Article

Soil N2O Emissions under Different N Rates in an Oil Palm Plantation on Tropical Peatland

1
Laboratory of Soil Science, Graduate School of Agriculture, Hokkaido University, Hokkaido 060-8589, Japan
2
Sarawak Tropical Peat Research Institute, Lot 6035, Kuching-Samarahan Expressway, 94300 Kota Samarahan, Sarawak, Malaysia
3
Tokachi Agricultural Experiment Station, Hokkaido Research Organization, Hokkaido 082-0081 Japan
*
Author to whom correspondence should be addressed.
Agriculture 2019, 9(10), 213; https://doi.org/10.3390/agriculture9100213
Submission received: 1 July 2019 / Revised: 17 September 2019 / Accepted: 19 September 2019 / Published: 1 October 2019
(This article belongs to the Special Issue Greenhouse Gas Emissions in Agroecosystems)

Abstract

:
(1) Background: Nitrogen (N) fertilization on drained tropical peatland will likely stimulate peat decomposition and mineralization, enhancing N2O emission from the peat soil. (2) Methods: A field experiment was conducted to quantify the N2O emissions from soil in an oil palm plantation (Elaeis guineensis Jacq.) located in a tropical peatland in Sarawak, Malaysia, under different rates of N fertilizers. The study was conducted from January 2010 to December 2013 and resumed from January 2016 to December 2017. Nitrous oxide (N2O) flux was measured every month using a closed chamber method for four different N rates; control—without N (T1), 31.1 kg N ha−1 yr−1 (T2), 62.2 kg N ha−1 yr−1 (T3), and 124.3 kg N ha−1 yr−1 (T4); (3) Results: Application of the N fertilizer significantly increased annual cumulative N2O emissions for T4 only in the years 2010 (p = 0.017), 2011 (p = 0.012), 2012 (p = 0.007), and 2016 (p = 0.048). The highest average annual cumulative N2O emissions were recorded for T4 (41.5 ± 28.7 kg N ha−1 yr−1), followed by T3 (35.1 ± 25.7 kg N ha−1 yr−1), T1 (25.2 ± 17.8 kg N ha−1 yr−1), and T2 (25.1 ± 15.4 kg N ha−1 yr−1), indicating that the N rates of 62.2 kg N ha−1 yr−1 and 124.3 kg N ha−1 yr−1 increased the average annual cumulative N2O emissions by 39% and 65%, respectively, as compared to the control. The N fertilization had no significant effect on annual oil palm yield (p = 0.994). Alternating between low (deeper than −60 cm) and high groundwater level (GWL) (shallower than −60 cm) enhanced nitrification during low GWL, further supplying NO3 for denitrification in the high GWL, and contributing to higher N2O emissions in high GWL. The emissions of N2O ranged from 17 µg N m−2 hr−1 to 2447 µg N m−2 hr−1 and decreased when the water-filled pore space (WFPS) was between 70% and 96%, suggesting the occurrence of complete denitrification. A positive correlation between N2O emissions and NO3 at 70–96% WFPS indicated that denitrification increased with increased NO3 availability. Based on their standardized regression coefficients, the effect of GWL on N2O emissions increased with increased N rate (p < 0.001). Furthermore, it was found that annual oil palm yields negatively correlated with annual N2O emission and NO3 for all treatments. Both nitrification and denitrification increased with increased N availability, making both processes important sources of N2O in oil palm cultivation on tropical peatland.; and (4) Conclusions: To improve understanding of N2O mitigation strategies, further studies should consider plant N uptake on N2O emissions, at least until the completion of the planting.

1. Introduction

Nitrous oxide (N2O) is one of the most potent greenhouse gases, with 298 times the global warming potential (GWP) of CO2 over a 100-year timescale [1]. Agricultural soils are responsible for 60–80% of anthropogenic N2O sources; mainly derived from synthetic fertilizers, manure applications, and crop residues left on farms [2,3]. The drive to fulfill the global demand for food supply and the scarcity of other suitable lands for agriculture has pushed the expansion of oil palm plantations into lowland tropical peatland. Drainage in tropical peatland is strengthened to create oxic conditions for palm growth, with an optimum water table depth of 50–75 cm [4]. Furthermore, nitrogen (N) fertilization is added to promote palm productivity. In Malaysia, the recommended annual N fertilizer for immature and mature oil palms established on tropical peat soil is 50–100 kg N ha−1 yr−1 and 120–160 kg N ha−1 yr−1, respectively [5]. However, both will likely stimulate peat decomposition and mineralization, enhancing N2O emission from the soil [6,7,8].
The N2O emissions from soils are produced by the microbial processes of nitrification (conversion of NH4+ to NO3) in aerobic condition and denitrification (NO3 to N2O or N2) in anaerobic condition [6,9]. Takakai et al. [10] found that N2O emission from vegetable fields on tropical peatland significantly increased in the wet season and, although NO3-N still accumulated in the soil in the dry season, N2O emission was low. Therefore, denitrification is believed to be a significant emitter of N2O and that soil moisture is a major environmental factor controlling the N2O emissions, as it regulates the oxygen availability to soil microbes, affecting the process of denitrification and nitrification [9]. One study observed nitrification as the dominant N2O-producing process in all soils with 60% water-filled pore space (WFPS) while 70% WFPS peat soil was dominated by denitrification [11]. Groundwater level (GWL) governs the anaerobicity and mineralization rate of soil [12]. Dobbie and Smith [13] found that rises in GWL were associated with increases in the WFPS of topsoil. The lowering of GWL was mainly reported to increase N2O emissions by introducing an oxic layer, enhancing peat decomposition and thus nitrogen mineralization [6,14]. However, another study reported that the presence of groundwater enhanced N2O production through denitrification [13,15]. Factors such as soil pH, precipitation [16], and NH4+ and NO3 concentration [17,18] have also been identified to affect soil N2O emissions.
Only a few studies on soil N2O emissions from oil palm plantation on tropical peatland [16,17,18] have been carried out. Of these studies, Oktarita et al. [18] conducted the only long-term study. Sakata et al. [16] found that there were no significant effects of the N fertilizer on N2O emissions in a young oil palm plantation on peat but high N2O emissions were observed when fertilizer was applied to wet peat soil. They concluded that N fertilizer had insignificant effects on annual N2O emissions because of the predominantly high emissions resulting from peat decomposition [10,18]. Meanwhile, Hadi et al. [19] reported that the addition of ammonium sulphate to soil significantly reduced the emission of N2O compared to the control treatments because of the high ammonium content that inhibited nitrification.
Emissions of N2O are typically erratic, often occurring as pulse events. They are also spatially variable and hard to predict, as they are generally not well correlated with any single environmental factor [20]. Thus, more information and understanding of the key factors influencing the response of soil N2O emissions due to N fertilization, besides urea, is necessary to develop approaches to mitigate N2O emissions from cultivated tropical peatland. Finding a suitable nitrogen rate for optimum oil palm growth and yield whilst maintaining low environmental impact is also crucial for the economic growth of the oil palm sector in Malaysia.
In this study, long-term monitoring was conducted to quantify soil N2O emissions by varying the rates of N fertilizers and the key factors influencing the response of soil N2O emissions under N fertilization were identified. In this study, ammonium sulphate (21% N) was used for N fertilization instead of urea.

2. Materials and Methods

2.1. Site Description

This study was carried out in an oil palm plantation (Elaeis guineensis Jacq.) on tropical peatland in Sarawak, Malaysia (2°11’ N, 111°50’ E). Sarawak has an average annual air temperature and an annual rainfall of 32.6 °C and 2701 mm, respectively. Generally, the wet season occurs between October and March while the dry season occurs between April and September. The peat in the experimental site is a deep peat of about 9 m depth, classified as Typic Haplofibrist based on the USDA soil classification system [21] and Dystric Histosols based on the World Reference Base (WRB) for soil classification systems [22]. The site was cleared and drained in 2007. After the peat surface was flattened with compaction and consolidated using a heavy machine, oil palms were planted in February 2008 at a density of 148 palms ha−1 (8.5 m between oil palms in a triangular design). The water table level was initially deeper than −1 m but became shallower and controlled between −50 cm and −70 cm below the soil surface in June 2010 and, therefore, suited for oil palm growth.

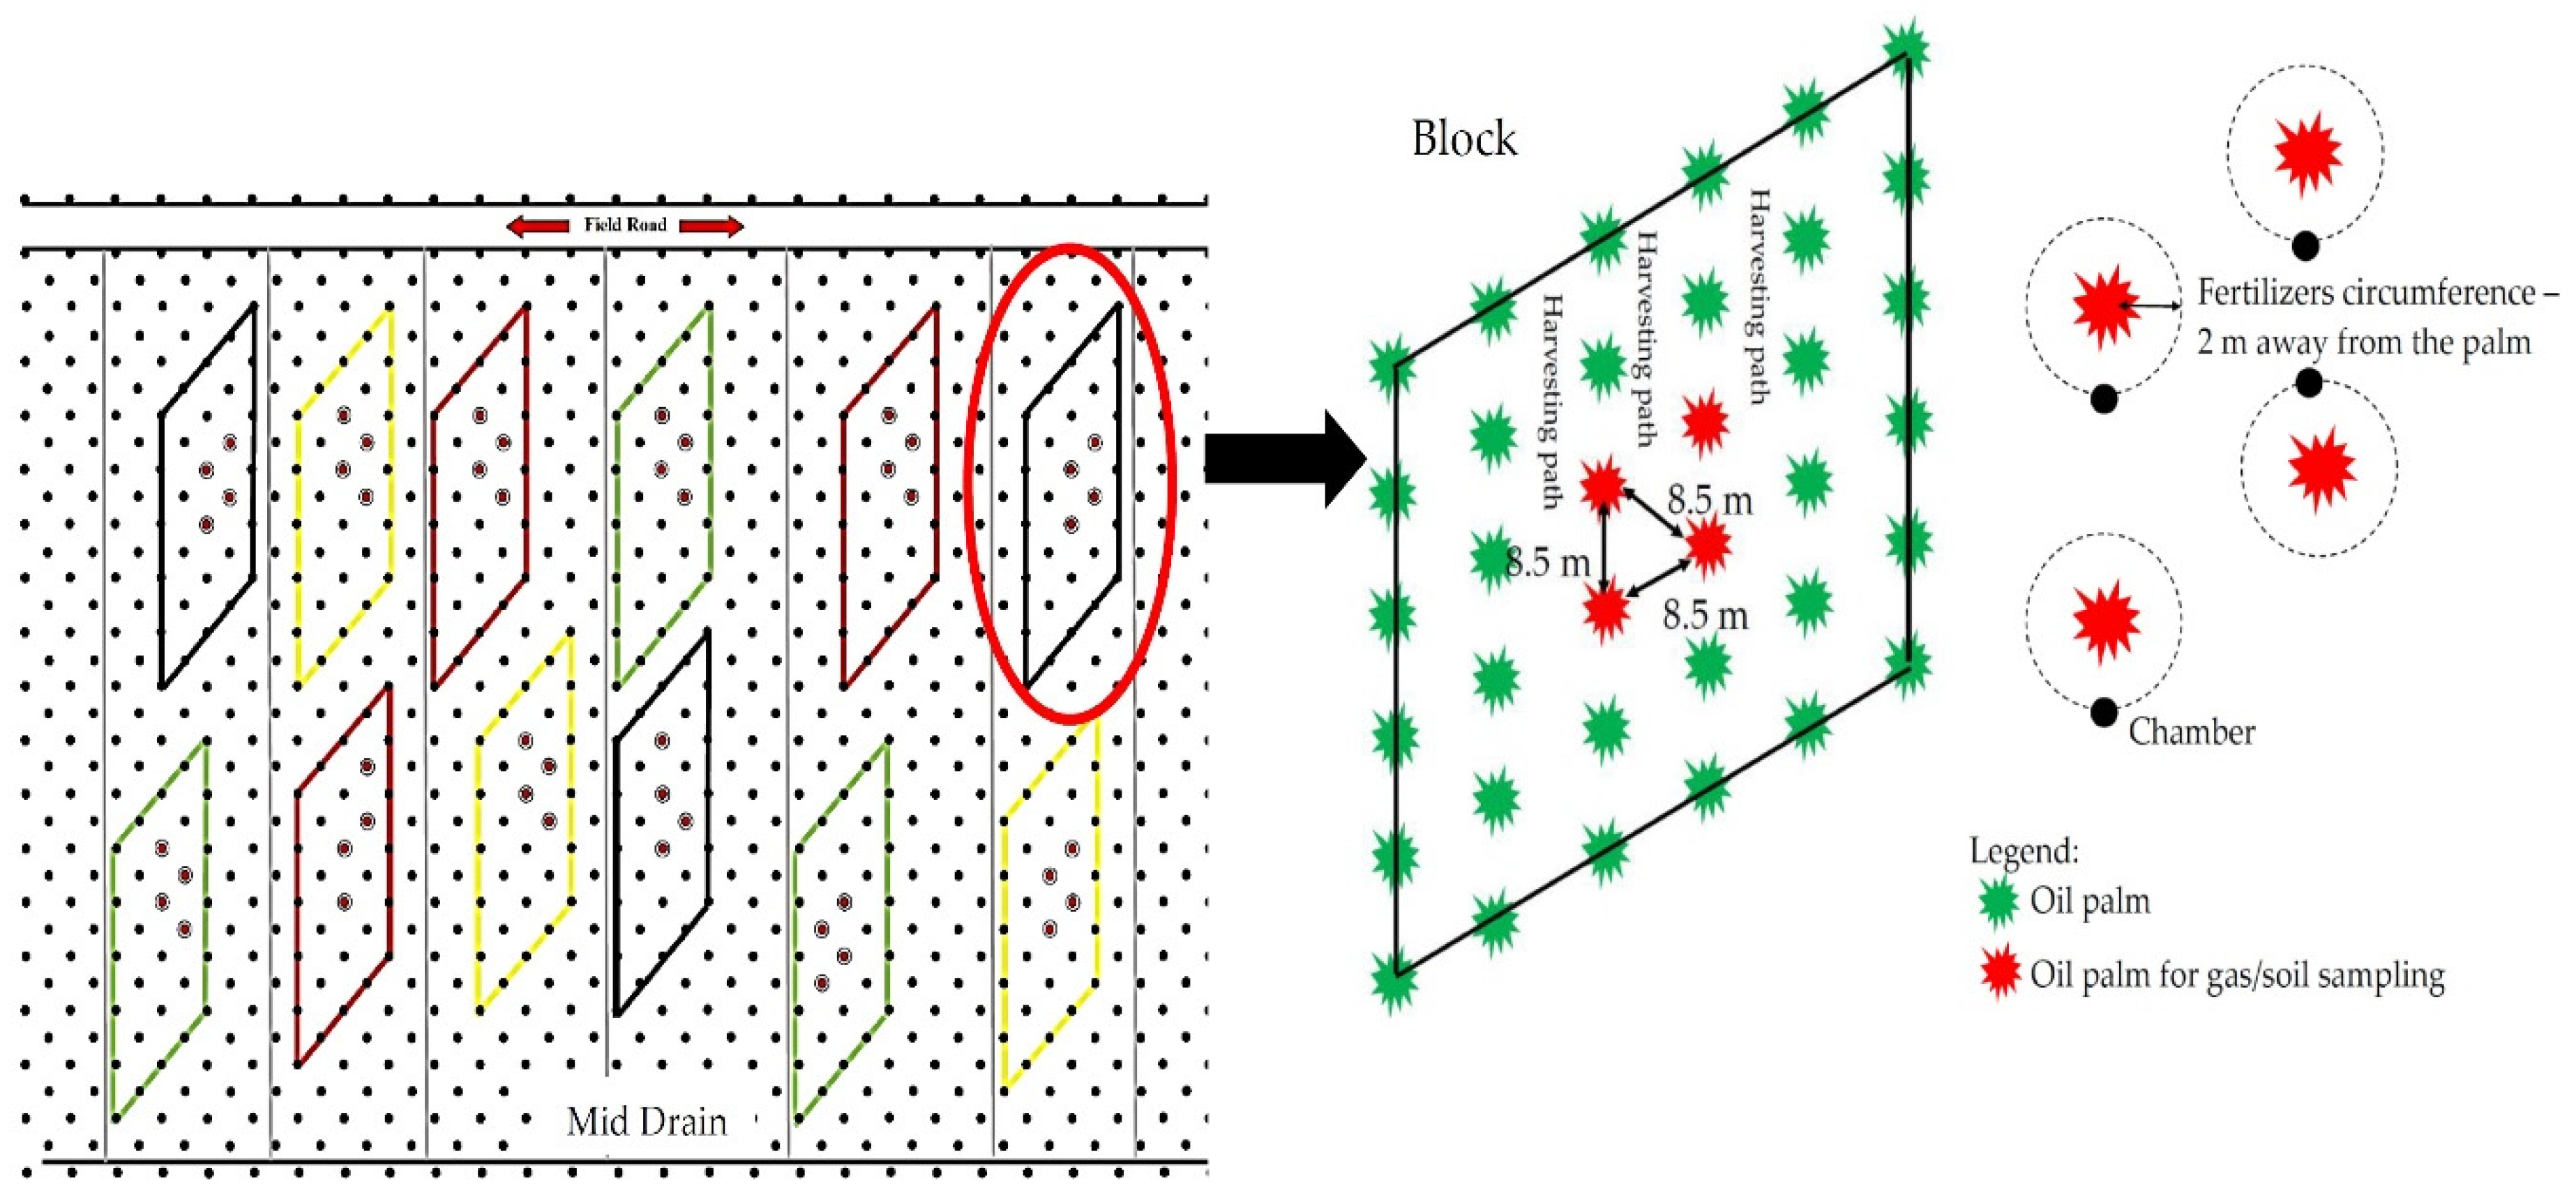
2.2. Field Experimental Design

The experiment used a randomized complete block design with four different N rates in three blocks (three replications). Each block (1564 m2) consisted of 36 oil palms of which 16 central palms were selected for the fresh fruit bunch (FFB) collection record while four were selected as the gas sampling points. Each block was separated by 2 to 3 rows of palms or field drains, as shown in Figure 1. The treatments included the control (T1, without N fertilization), low N (T2, 31.1 kg N ha−1), moderate N (T3, 62.2 kg N ha−1), and high N (T4, 124.3 kg N ha−1). The moderate N rate (T3) in this study was based on the recommended rate by Hasnol et al. [23]. Ammonium sulphate (AS) (21%N) was applied as the N fertilizer four times a year in March, June, September, and November. The rate of N fertilization is shown in Table 1. Other fertilizers such as rock phosphate (RP), muriate of potash (MOP), copper (Cu), Zinc (Zn), and borate (Bo), were also applied based on the schedule shown in Table 2. All fertilizers were applied 2 m away from the palm trunk (Figure 1).

2.3. Soil N2O Emission Measurements and Soil Sampling

This study was conducted from January 2010 to December 2013, and resumed from January 2016 to December 2017. The N2O emissions were measured in the first week of every month on a non-rainy day, 1 week after fertilization, using a closed chamber method. The chambers consisted of white-painted stainless-steel rings (25 cm height with a 20 cm diameter). Four palms in the middle of each replication plot were selected for the gas sampling. Prior to gas sampling, each chamber for each palm was placed directly into the soil, at a fertilizer spot 2 m away from the selected palm. The chamber was then inserted directly up to 3 cm depth. To attain stability in the presence of installation disturbance, all the chambers were left for 30 minutes upon installation [24]. Gas emissions in the field were collected between 11 a.m. and 2 p.m. Before closing the chamber, a 20 mL gas sample from the headspace of each chamber was extracted using a gas-tight 25 mL syringe and transferred into an evacuated vial for N2O analysis. This measurement was regarded as time 0 min. Under closed chamber conditions, another 20 mL gas sample was taken after 10, 20, and 40 min, and then transferred into an evacuated vial. In the laboratory, N2O gas concentrations were determined using an electron capture detector (ECD) gas chromatograph (Agilent Technologies 7890A).
Gas emissions were calculated using the following linear regression equation [25]:
F = p × h × (Δc/Δt) × (273/(273 + T) × α
where F is the gas flux (µg N m−2 h−1 for N2O), p is the gas density (N2O = 1.978 × 10⁹ µg m−3); h is the height of the chamber from the soil surface (m); Δc/Δt is the change in gas concentration inside the chamber during the sampling period (10−6 m3 m−3 h−1); T is the average air temperature during the sampling period (0, 10, 20, and 40 min) (°C); and α is the conversion factor from N2O to N (i.e., 28/44). A positive flux denotes emission from the soil and a negative flux denotes uptake from the atmosphere. The annual cumulative soil N2O emissions were calculated from the monthly mean values as follows [17]:
Annual   cumulative   N 2 O   emission   =   i = 1 n 1 Fi × Di
where Fi is the mean gas flux (kg N ha−1 day−1) between two sampling times (i.e., for time interval i), Di is the number of days in the sampling interval, and n is the frequency of sampling. The emission factor (EF) was calculated using the following formula [26]:
EF (%) = (F − C)/N × 100
where F is the annual cumulative N2O emission emitted from the fertilized treatment (kg N ha−1 yr−1), C is the annual cumulative N2O emissions from the control treatments (kg N2O-N ha−1 yr−1), and N is the annual amount of N application (kg N ha−1 yr−1).

2.4. Environmental Parameters and Soil Sampling

At the same time that the gas measurement was performed, environmental variables such as air temperature, relative humidity, soil temperature at 5 cm and 10 cm, groundwater level, and rainfall were also measured. Air temperature and relative humidity were measured using an air temperature and relative humidity meter (TESTO 625, Testo SE & Co. KGaA, Lenzkirch, Germany) while soil temperature was measured using a portable soil temperature meter (Hanna CheckTemp 1, Hanna Instruments Inc, Rhode Island, USA). Groundwater level was measured by installing a PVC perforated pipe into the ground and rainfall was collected and measured using a rain gauge.
Upon completing the gas measurement, the bulk density and the water-filled pore space (WFPS) of the soil inside the chamber were assessed by collecting soil core samples using a core ring (5 cm diameter, 5.1 cm height). Then, soil at 0–25 cm (higher root density zone) was sampled using a peat auger, after which the chemical characteristics of the soil were further analyzed. In the laboratory, the soil samples were air-dried and sieved (2 mm sieve) and extracted in deionized water or 2 M potassium chloride (KCl), filtered using filter paper. The extracts were then stored at 4 °C for further analysis to determine the content of soil nitrate (NO3), and ammonium (NH4+). From the water extracts, NO3 concentrations of the soil were analyzed using an ion chromatograph (Methrohm 761 Compact IC), while soil pH was measured using a pH meter (Methrohm 744) and NH4+ was determined using a method proposed by Keeney and Nelson [27]. Loss on ignition (LOI) was determined using a thermogravimetric analyzer (LECO TGA701, LECO Corporation, San Jose, MI, USA) while carbon (C) and nitrogen (N) were analyzed using a CN analyzer (LECO TruMac 4060, LECO Corporation, San Jose, MI, US).

2.5. Oil Palm Yield Collection

Oil palm yield, parameterized as the fresh fruit bunch (FFB) in each palm of each treatment block, were harvested, weighed, and recorded according to an approximately 7–10-day harvest interval in each month whereas the yearly total was derived using the density of 148 palms ha−1. The number of fruit bunches produced was also recorded. In this study, the production of palm oil started in May 2010; thus the annual oil palm yield was calculated starting from 2011 onwards.

2.6. Statistical Analysis

One-way ANOVA and Tukey’s test was used to compare the mean difference (p < 0.05) of the given variable across the treatments. A stepwise multiple regression analysis and Pearson’s Correlation were conducted to identify the main factors influencing N2O emissions as well as the environmental parameters and soil properties. All analyses were performed using SPSS Statistics Software version 21 (IBM, New York, NY, USA).

3. Results

3.1. General Soil Properties

The physicochemical properties of soil in the control plot are shown in Table 3. The groundwater level (GWL) recorded an average of −53.0 ± 20.4 cm below the peat surface and the water-filled pore space (WFPS) was 70.4 ± 10.4%. The bulk density in the study site was 0.24 ± 0.01 g cm−3—a result of compaction and consolidation upon drainage. The soil pH was 3.4 ± 0.1 and the loss on ignition (LOI) was 96.7 ± 1.0%. A high soil C/N ratio (30.3 ± 2.4) was recorded due to the higher C content (55.8 ± 2.4%) of the soil. Since the peat was ombrogenic, it had high acidity and high C content.

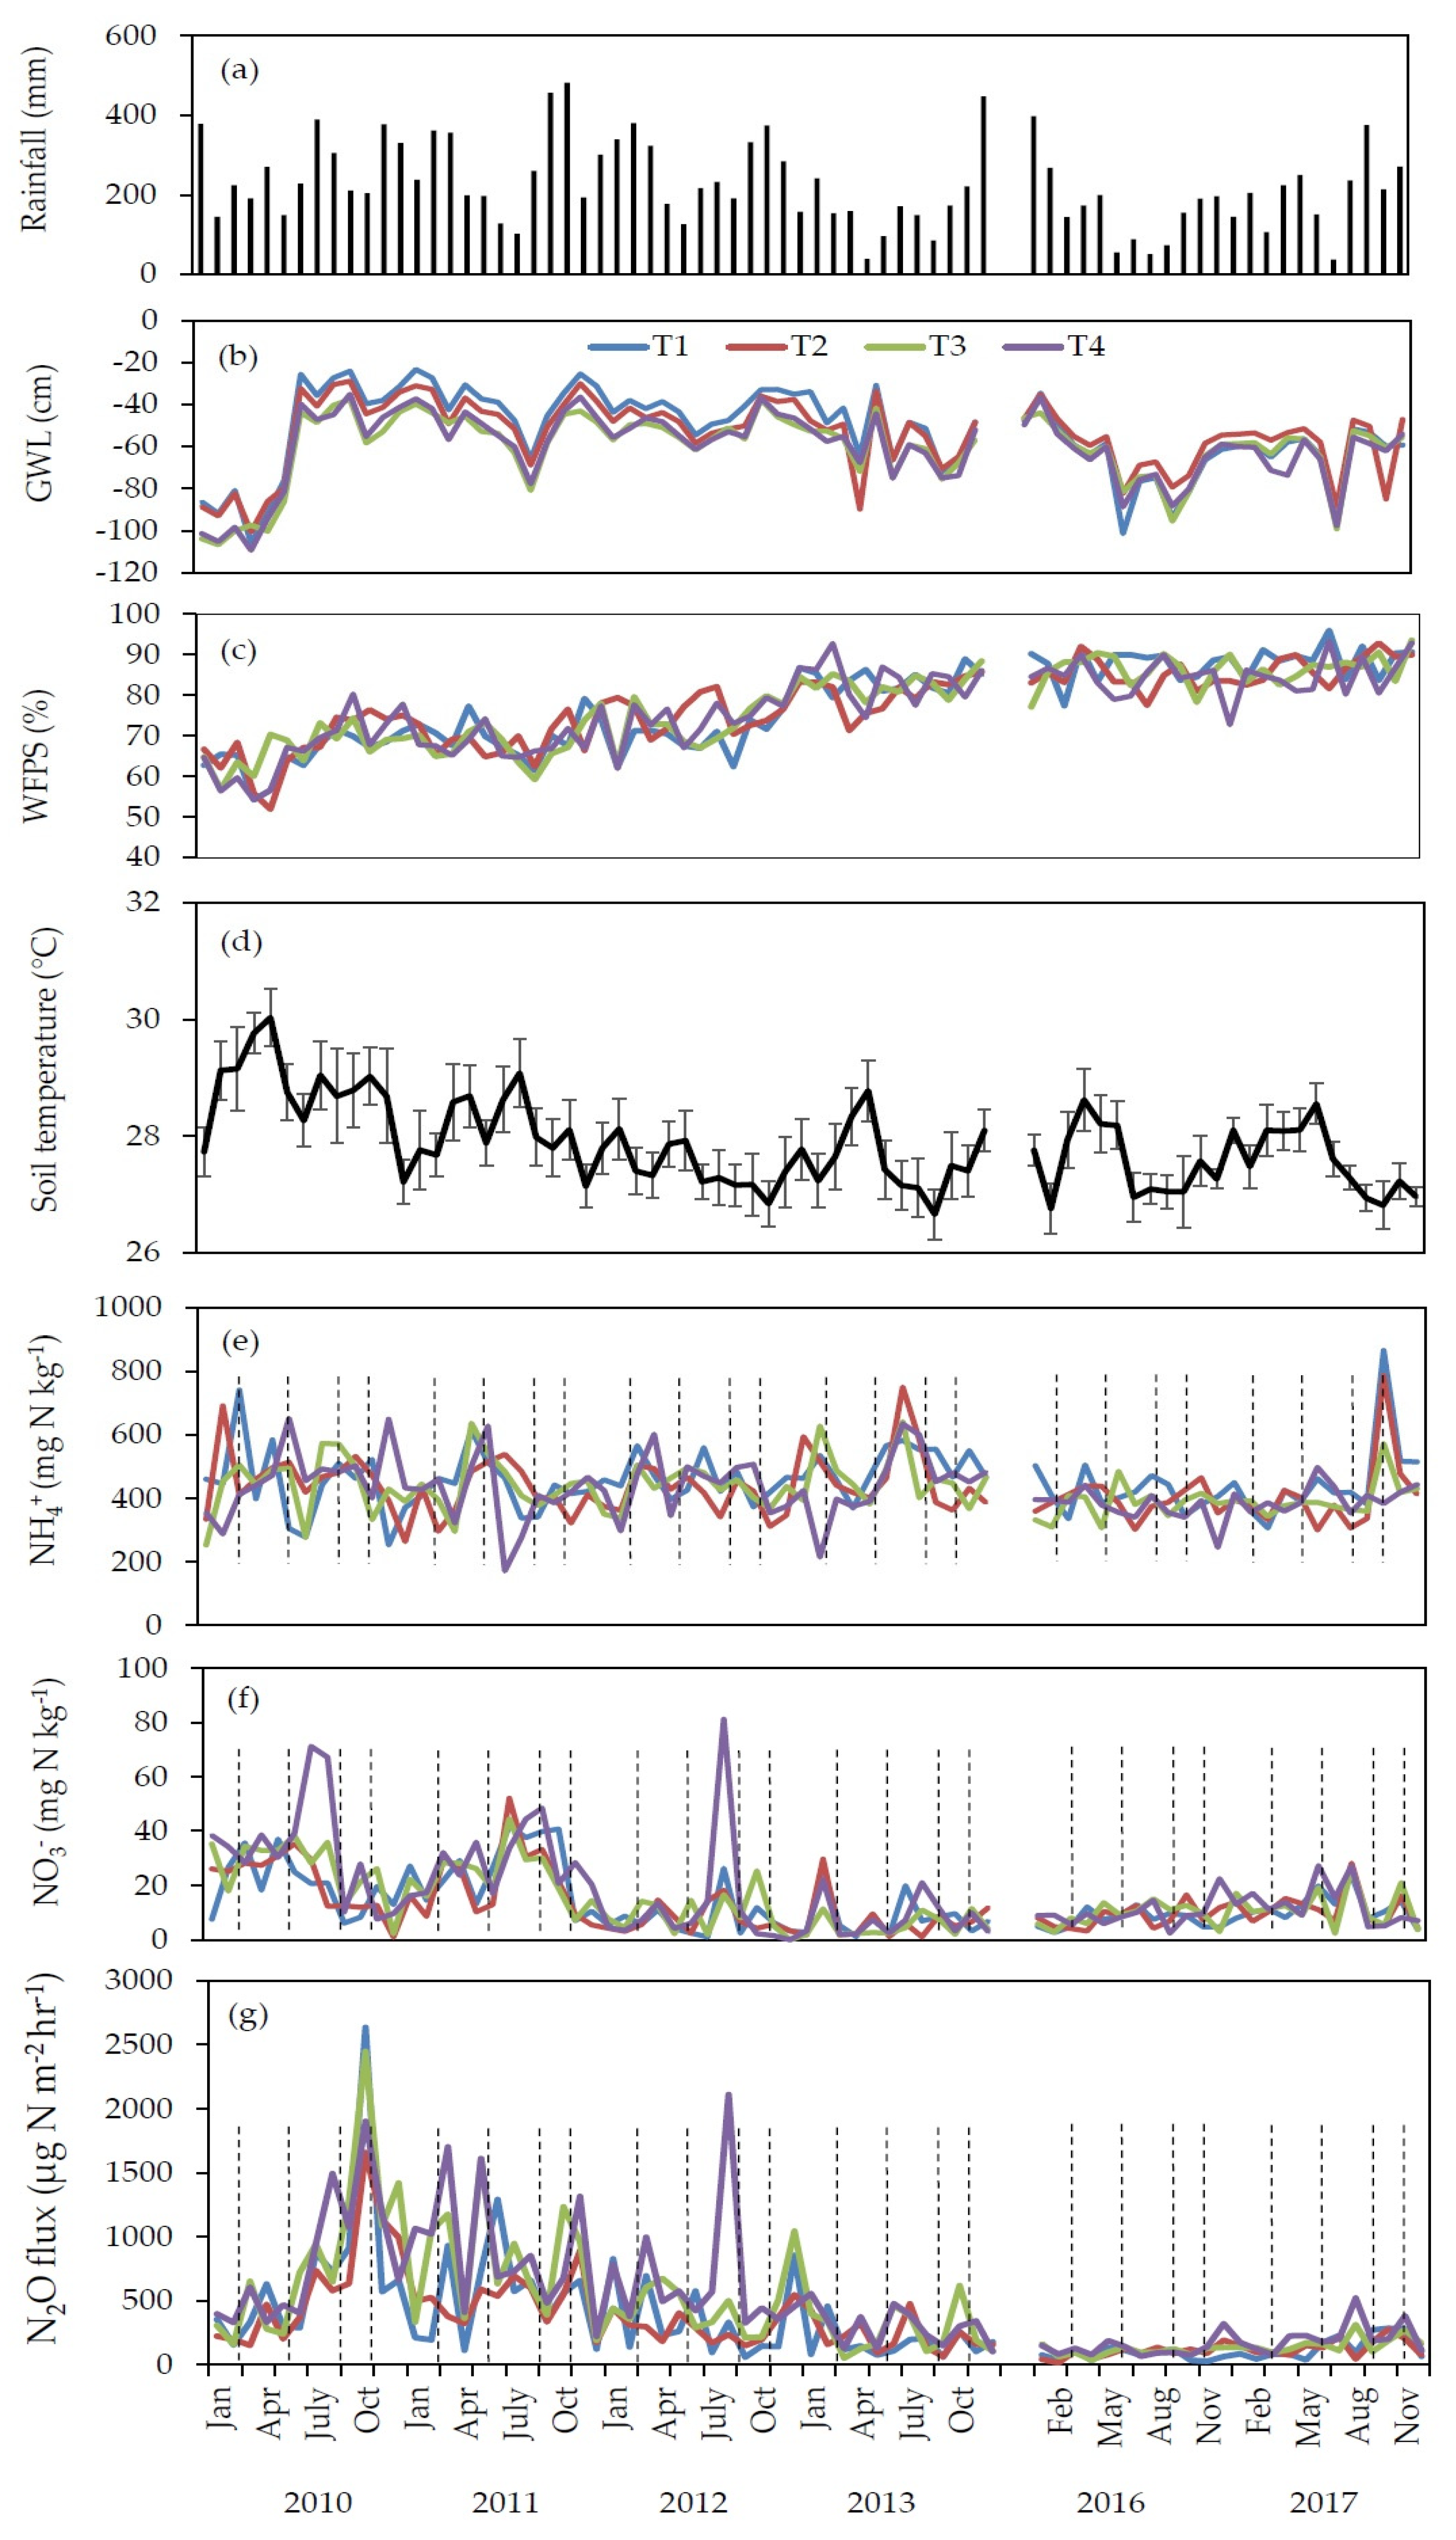
3.2. Ground Water Level, WFPS, and Soil Temperatures

The monthly rainfall, WFPS, GWL, and soil temperatures are shown in Figure 2. There is a clear seasonal pattern in the rainfall (Figure 2a). The GWL pattern generally follows the rainfall pattern (Figure 2b). The short-term low GWL for all treatments was observed between January 2010 and June 2010, ranging from −76 cm to −109 cm below the peat surface. The GWL increased beginning from July 2010 onwards, ranging from −23 cm to −101.5 cm below the peat surface. A lower GWL was also clearly observed from June 2011–December 2011, June 2016–December 2015, and June 2017–September 2017 (Figure 2b). A lower WFPS was observed from January to June 2010 ranging between 51% and 70%, coinciding with the lower GWL in the same period. The WFPS in all treatments eventually increased with time, ranging from 59% to 95.9% (Figure 2c). The significant differences (p < 0.05) of WFPS between continuous low GWL (−76 cm to −109 cm) and high GWL (−24 cm to −58.3 cm) in 2010 are shown in Table 4. However, from 2010 to 2012, the pattern of WFPS (ranging from 51% to 82.1%) was mainly influenced by the pattern of GWL. After 2012, the pattern of WFPS increased with an increase in the age of the palm, to range from 71% to 95.9% (Figure 2c).
Soil temperature at 5 cm and 10 cm depth did not show a clear seasonal or annual trend and remained in the range of 26.6 °C to 30.0 °C (Figure 2d).

3.3. Soil NH4+ and NO3 concentrations

As shown in Figure 2, the soil NH4+ for all treatments were higher than the soil NO3 throughout this study, indicating that inorganic-N was dominated by NH4+ at the study site. The variations in NH4+ among the treatments were small, ranging from 253–865.2 mg N kg−1, 263–785.7 mg N kg−1, 253–641.5 mg N kg−1, and 171–651.6 mg N kg−1 for T1, T2, T3, and T4, respectively. Following N fertilization, small peaks of NH4+ could sometimes be observed (Figure 2e). Short-term GWL changed in 2010 but did not significantly affect NH4+ either between treatments or between both low and high GWL conditions for each treatment (p > 0.05) (Table 4). The N fertilization had no effect on NH4+ in each year (p > 0.05).
The soil NO3 varied from 1.1–41.9 mg N kg−1, 1.0–52.0 mg N kg−1, 1.8–44.5 mg N kg−1, and 1.5–81.1 mg N kg−1 for T1, T2, T3, and T4, respectively (Figure 2f)). Generally, small peaks denoting NO3 concentration were observed upon N fertilization. Variation in NO3 was generally driven by the GWL pattern, especially from 2010 to 2012. A significant negative correlation was consistently found between GWL and NO3 from 2010 to 2012 (p < 0.05) (Table 5). High soil NO3 concentrations were recorded from January 2010 to June 2010 and then decreased mainly from June 2010 to June 2011 for all treatments except for T4 where higher concentrations were observed in July 2010 and August 2010 upon N fertilization. A wider peak of NO3 for all treatments appeared in July 2011 to September 2011 following N application, also coinciding with a drop in GWL (Figure 2b). Soil NO3 concentrations for all treatments became constantly low afterwards except for T4 in August 2012 where the highest peak of NO3 concentration (81.1 mg N kg−1) of T4 appeared two months after N application (Figure 2f). Significant effects of N application on soil NO3 were only observed in 2010 with only T4 being significantly higher than the control (p < 0.05). The changes in GWL in 2010 had a significant effect on NO3 for T1 and T2, as the high GWL significantly decreased NO3 concentration. The N rates only had an effect at high GWL with only T4 denoting significantly increased NO3 at high GWL (Table 4).

3.4. Soil N2O Emissions
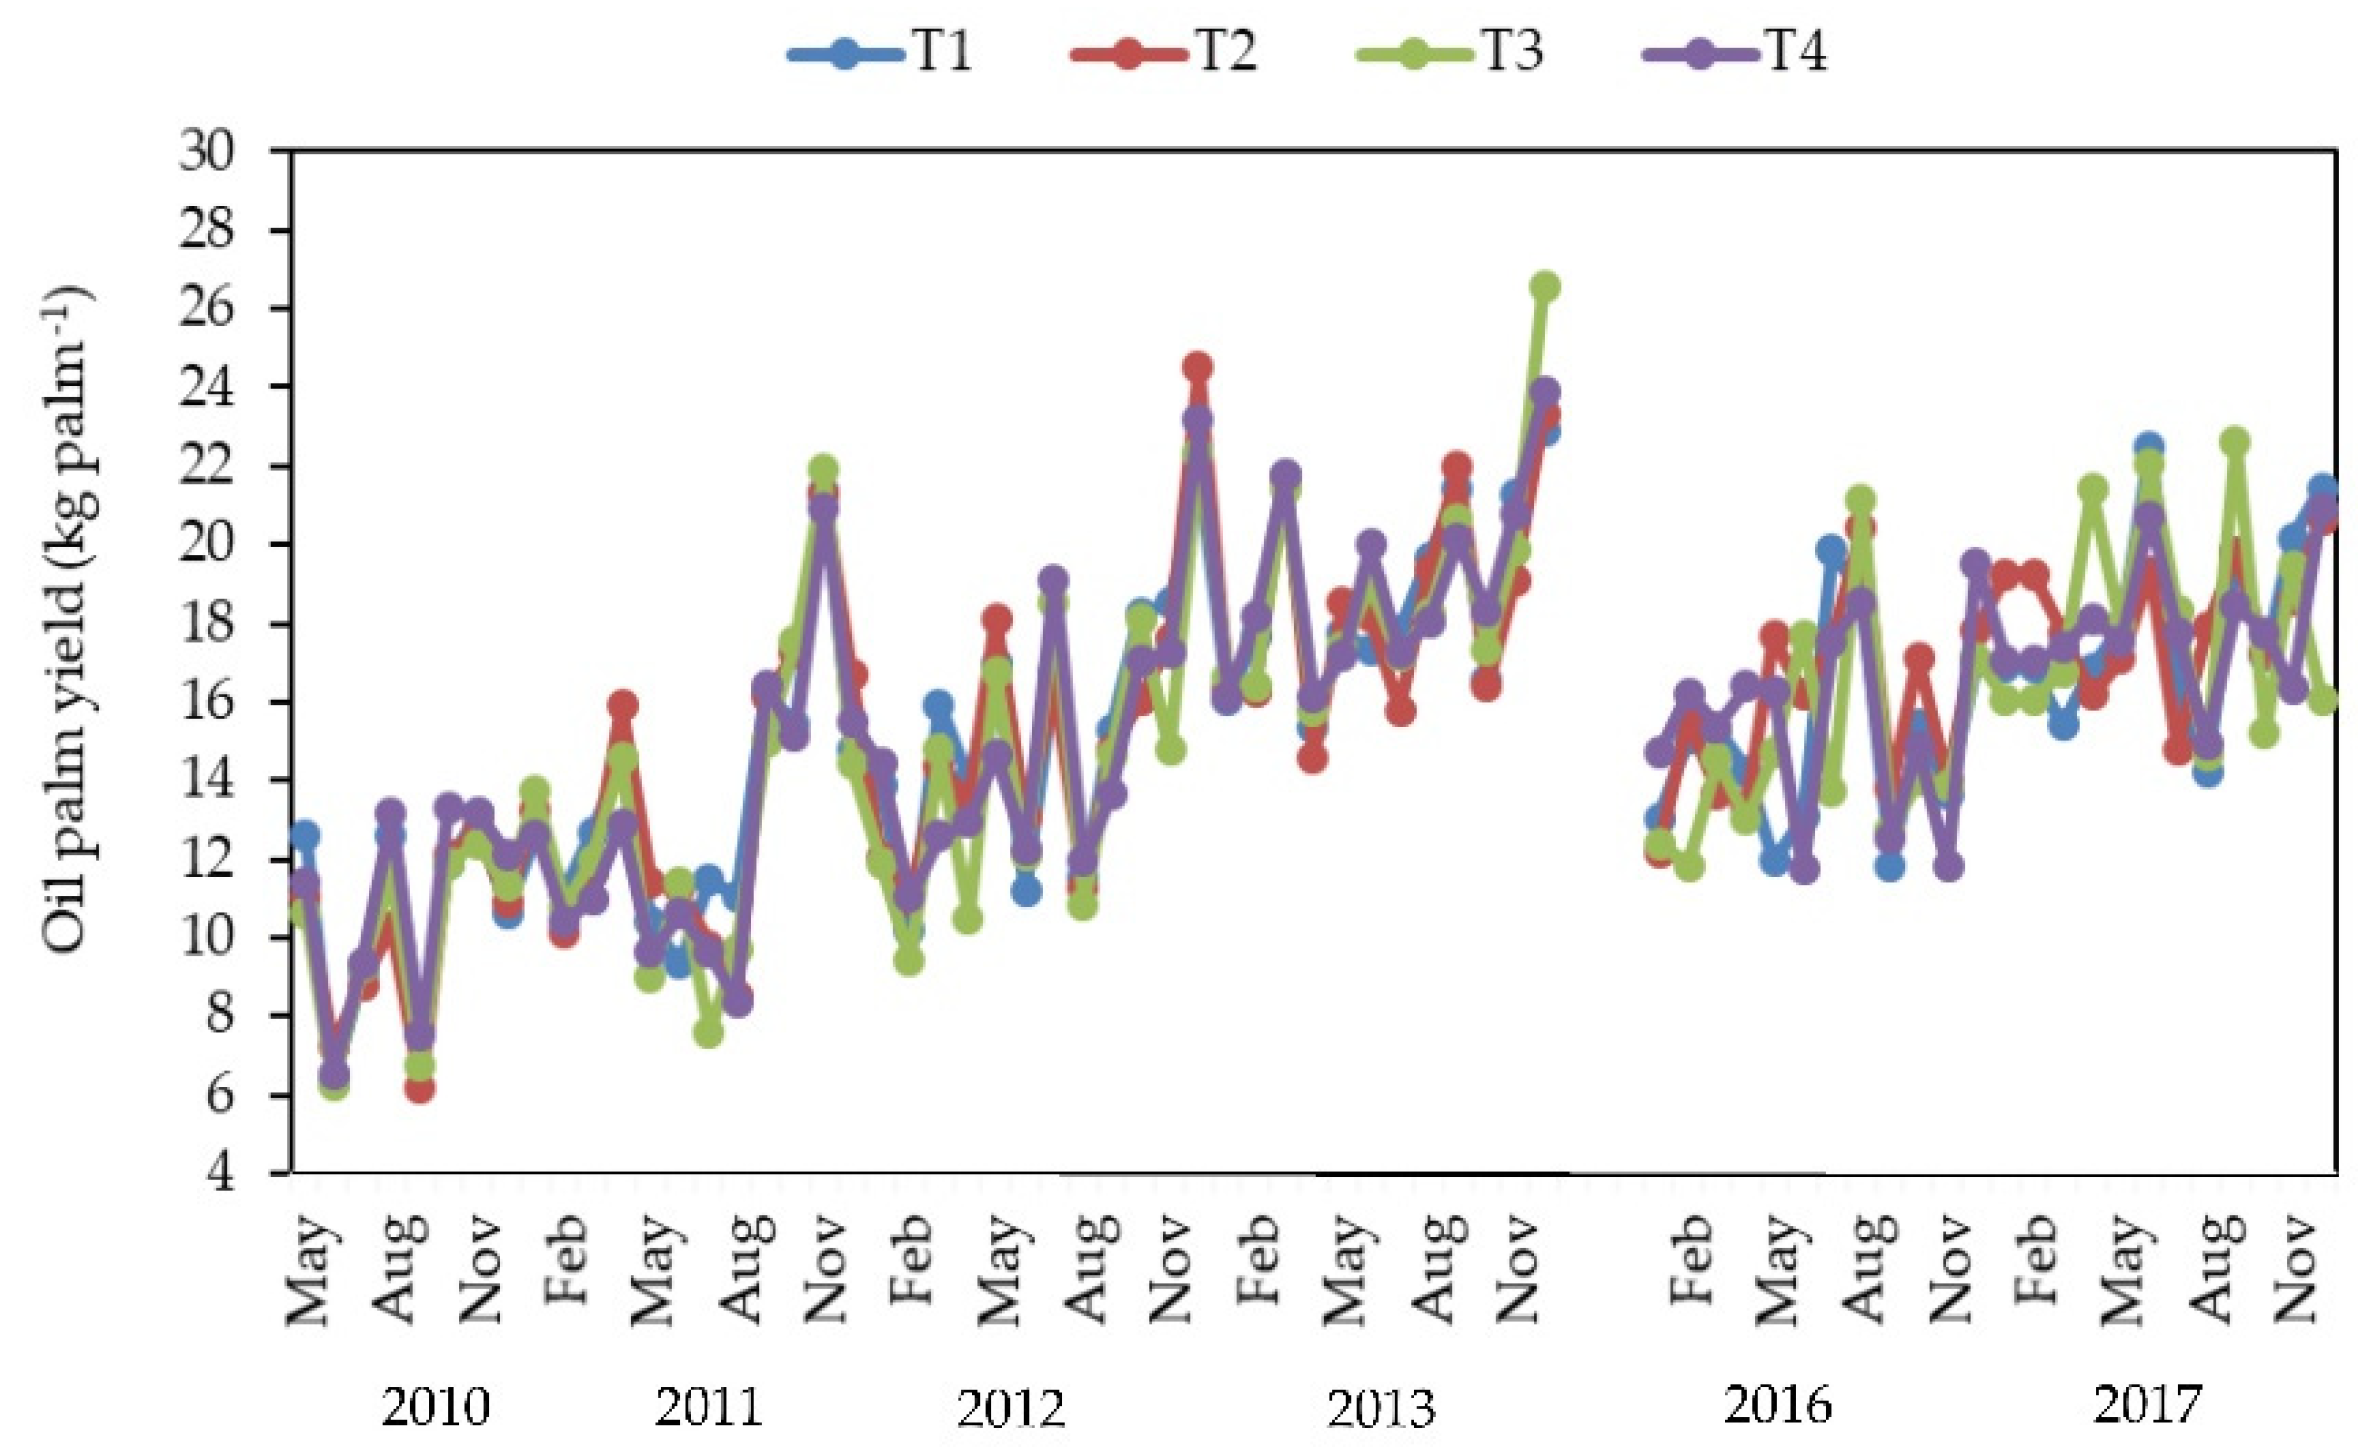
The highest N2O fluxes were generally recorded for T4. The N2O fluxes varied from 28.43–2635 µg N m−2 hr−1, 17.19–1658.41 µg N m−2 hr−1, 38.07–2447.36 µg N m−2 hr−1, and 45.63–2110.94 µg N m−2 hr−1 for T1, T2, T3, and T4, respectively (Figure 2g). Higher soil N2O emissions for all treatments were observed mainly in 2010, 2011, and 2012 compared to 2013, 2016, and 2017. In 2010, peaks of N2O fluxes appeared following N fertilization in most of the N fertilized treatments. Emissions of N2O still increased 2 to 3 months upon N application, particularly for T4. The N2O flux for T4 was significantly higher (1493.84 µg N m−2 hr−1) than other treatments (where T1, T2, and T3 were 728.04 µg N m−2 hr−1, 581.55 µg N m−2 hr−1, and 649.67 µg N m−2 hr−1, respectively) in August 2010 (p < 0.05). The peak N2O flux occurred in October 2010 for all treatments following N application, with the control recording the highest flux. The peak of N2O flux for T4 was significantly higher than other treatments upon N application in August 2012 (p < 0.05), coinciding with a higher peak concentration of NO3 for T4 in the same month. In 2013, the pattern of N2O emissions started to decrease with a decrease in NO3- (Figure 2f,g).
Besides N fertilization, the patterns of N2O fluxes were also driven by the pattern of GWL and WFPS, particularly in 2010, where continuously lower GWL occurred between January to June 2010 before it started to increase in July 2010 (Figure 2b,c). A comparison of N2O emissions from all treatments between the low GWL and high GWL periods in 2010 is shown in Table 4. At a lower GWL (−76 cm to −109 cm), N2O emissions ranged from 155–630.22 µg N m−2 hr−1 for T1, 152–474.5 µg N m−2 hr−1 for T2, 159–721.89 µg N m−2 hr−1 for T3, and 330–607.64 µg N m−2 hr−1 for T4. Meanwhile, at a higher GWL (−24 cm to −58 cm), N2O fluxes for T1, T2, T3, and T4 ranged from 661–2635 µg N m−2 hr−1, 581–1658 µg N m−2 hr−1, 649–2447 µg N m−2 hr−1, and 664–1902 µg N m−2 hr−1, respectively. There were no significant effects of N fertilizers on N2O fluxes in both GWL conditions (low GWL p = 0.24; high GWL p = 0.48) for all treatments but a rise in GWL significantly increased N2O emissions by 185% to 253% at low GWL (p < 0.05). A pattern of higher soil N2O emissions were continuously observed up until 2012.
The annual cumulative N2O emissions for each year for all treatments are shown in Table 6. The annual cumulative N2O emissions for T1, T2, T3, and T4 ranged from 6.5–47.4 kg N ha−1 yr−1, 7.6–43.5 kg N ha−1 yr−1, 8.2–70.7 kg N ha−1 yr−1, and 9.8–79.7 kg N ha−1 yr−1, respectively. The application of N fertilizer significantly increased the annual cumulative N2O emissions only for T4 in 2010 (p = 0.017), 2011 (p = 0.012), 2012 (p = 0.007), and 2016 (p = 0.048), which were significantly higher than the control by 48%, 68%, 96%, and 52% in 2010, 2011, 2012 and 2016, respectively. This was also reflected in the N2O EF whereby T4 induced an EF ranging between 2.7% and 25.9% with the highest N2O EF recorded in 2011. The annual cumulative N2O emissions for all treatments started to significantly decrease in 2012, coinciding with increased WFPS and decreased NO3 (Figure 2c,f). The highest average annual cumulative N2O emissions were recorded for T4 (41.5 ± 28.7 kg N ha−1 yr−1), followed by T3 (35.1 ± 25.7 kg N ha−1 yr−1), T1 (25.2 ± 17.8 kg N ha−1 yr−1), and T2 (25.1 ± 15.4 kg N ha−1 yr−1), indicating that the N rates of 62.2 kg N ha−1 yr−1 and 127.7 kg N ha−1 yr−1 increased the average annual cumulative N2O emissions by 39% and 65%, respectively, compared to the control.

3.5. Oil Palm Yield

The oil palm in this study started to produce yield in May 2010 for all treatments (Figure 3). An increasing trend could be observed from May 2010 until December 2013. The yield productions of all treatments were increased in October 2011 to November 2011. A trend of higher oil palm yield from all treatments was observed in December 2012 and remained high up until December 2013. A higher annual oil palm yield for all treatments was recorded in 2013 and followed by 2017 i.e., more than 30 t ha−1 yr−1. The oil palm yields decreased in 2016 and started to increase again in 2017. However, N fertilization had no significant effect on annual oil palm production in each year (p = 0.994). Annual oil palm yield was negatively correlated with annual N2O fluxes and NO3 for overall treatment (Figure 4).

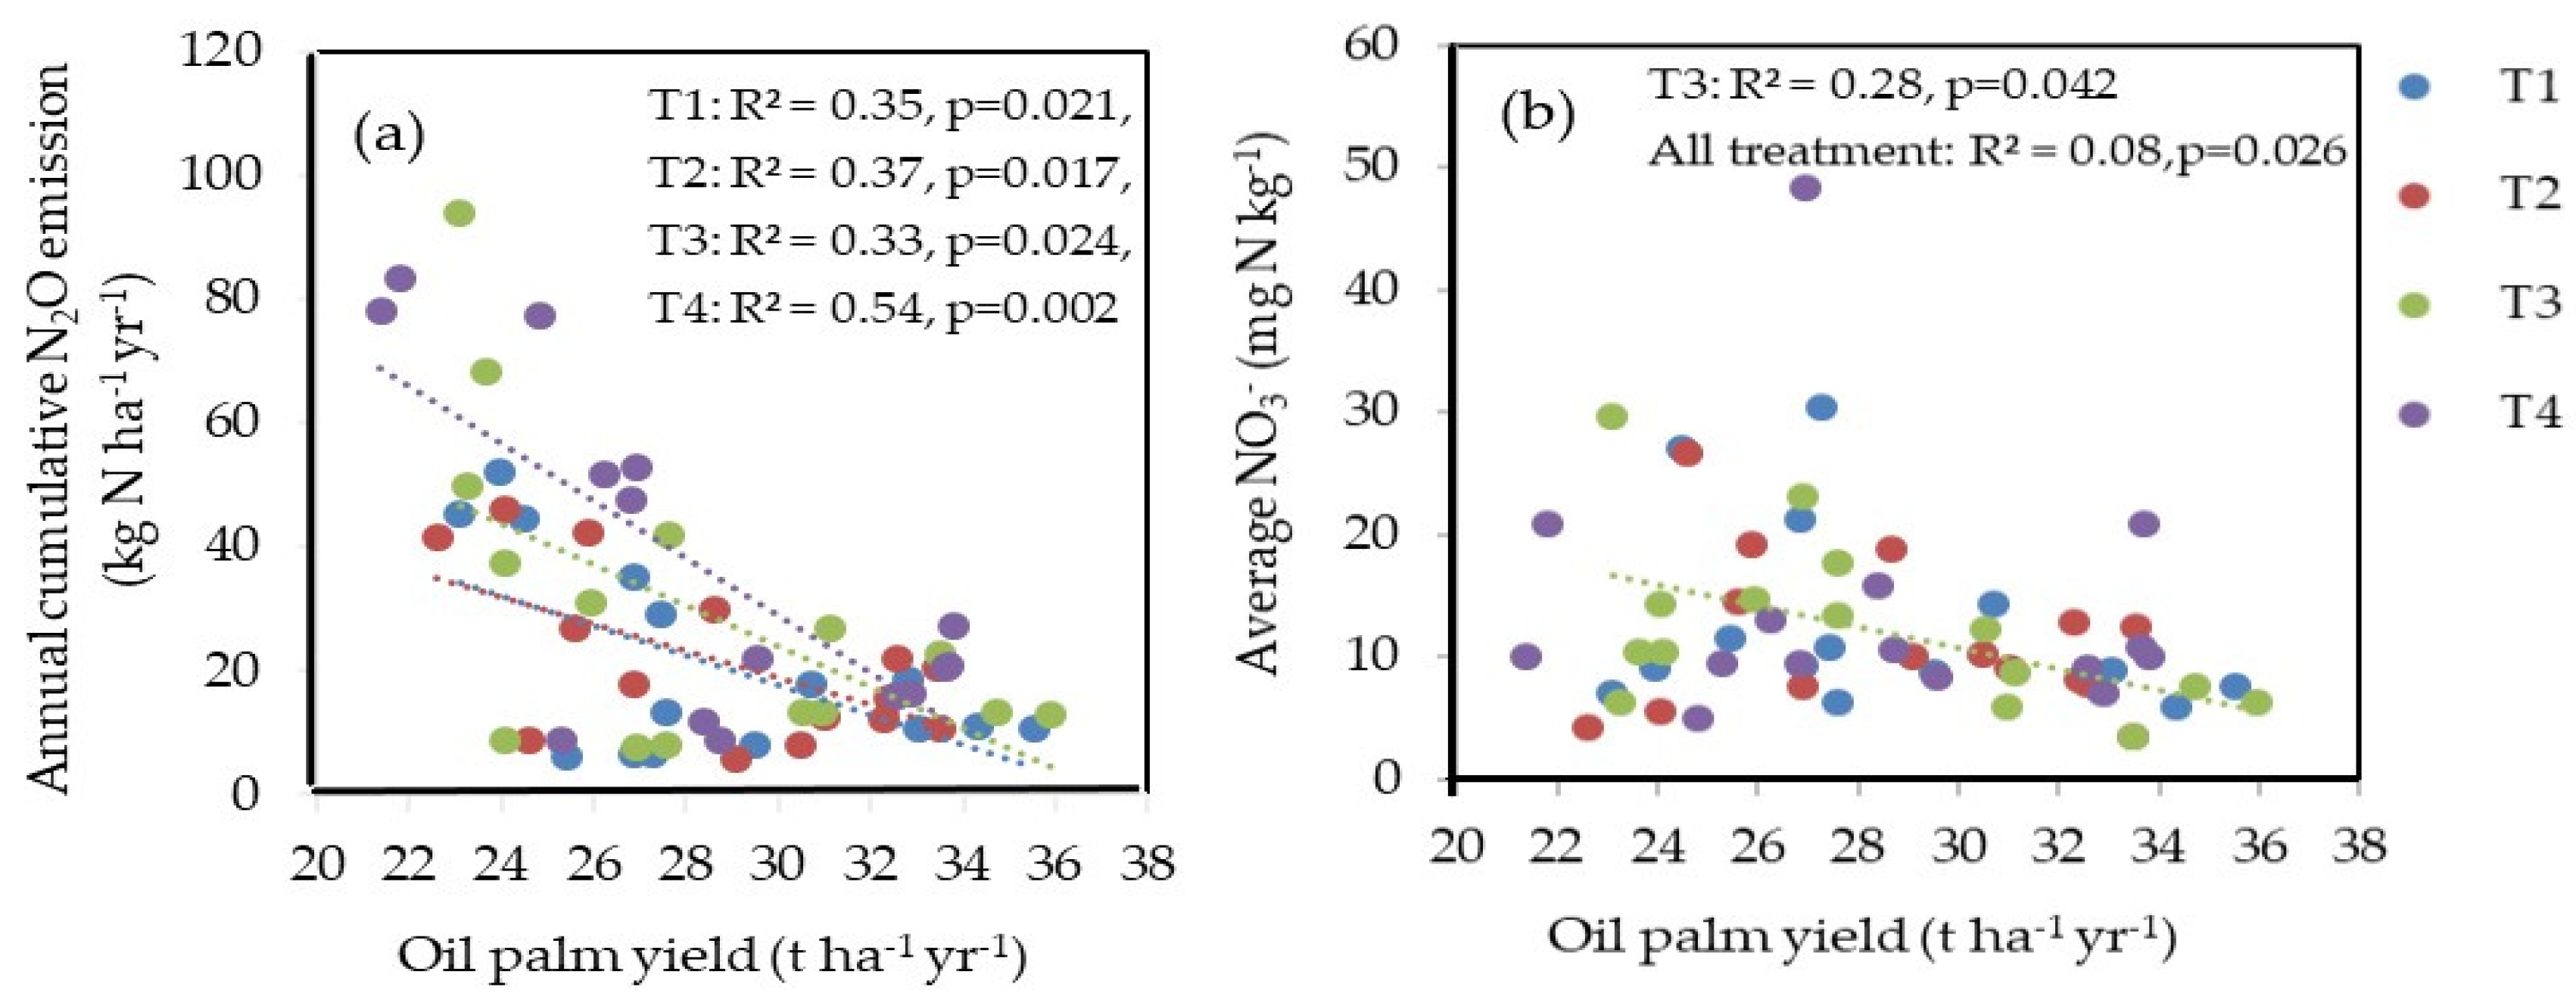
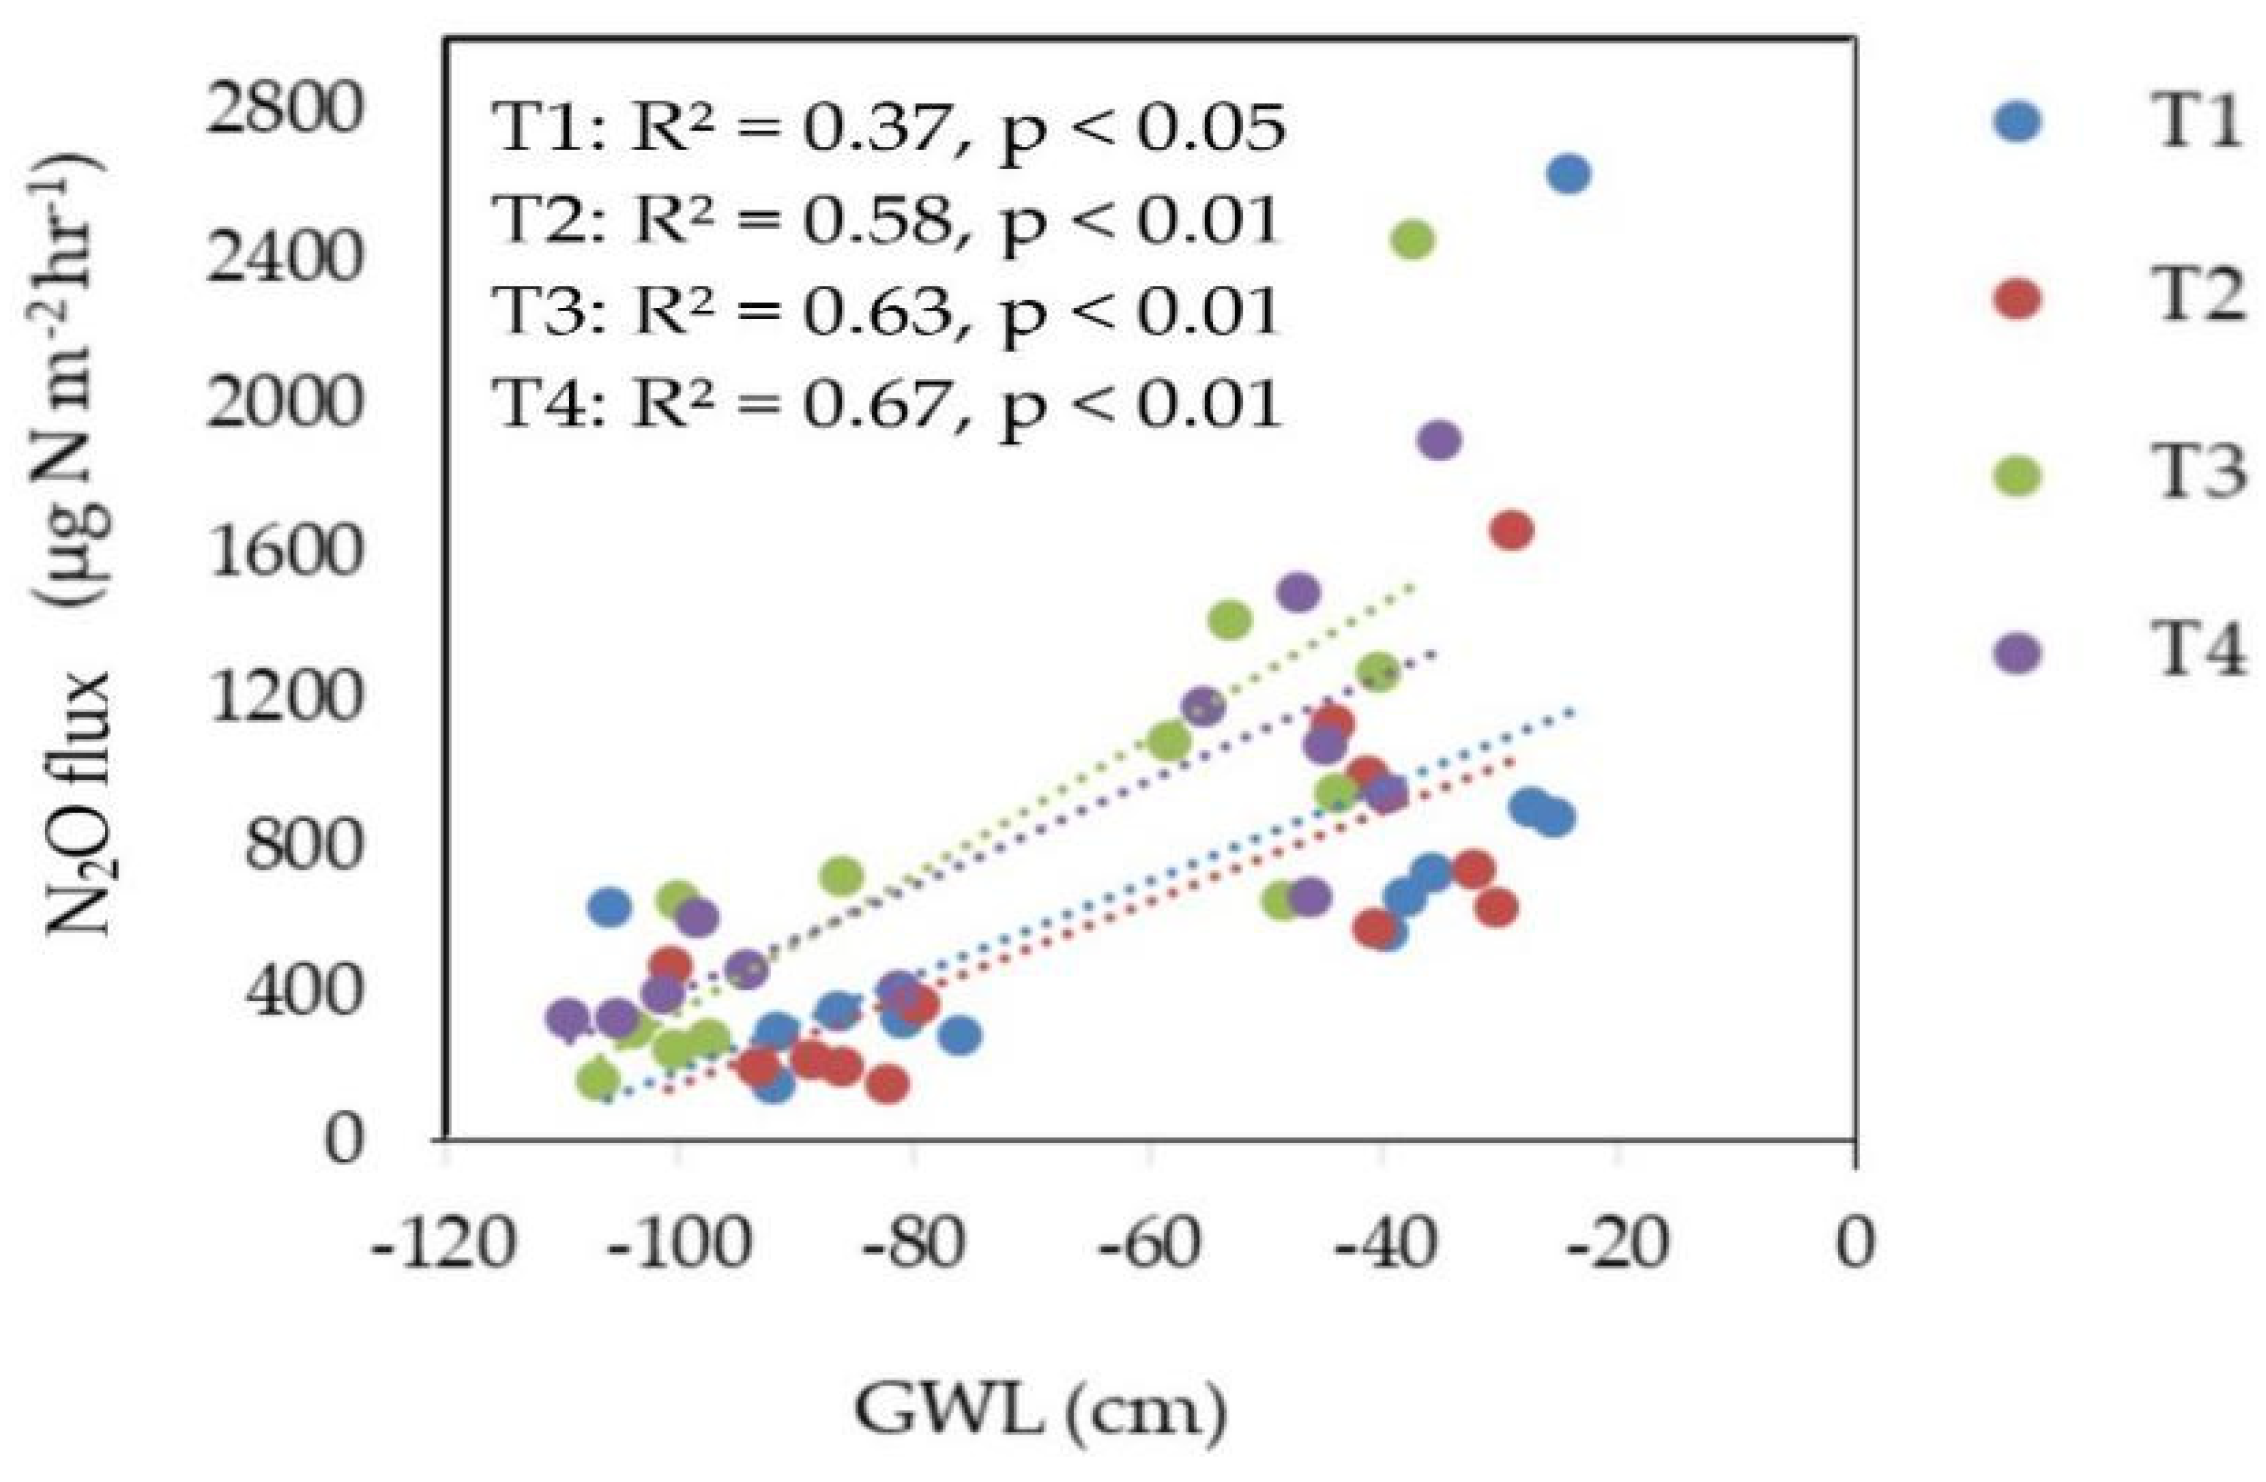
3.6. Factors Controlling Soil N2O Emissions

A stepwise regression analysis was done to examine the factors influencing soil N2O flux for each of the treatments (Table 7). Both GWL and WFPS were significant predictors in all treatments. A positive correlation between GWL and N2O flux was observed for each treatment (T1: R2 = 0.18; T2: R2 = 0.20; T3: R2 = 0.13; T4: R2 = 0.17), indicating that N2O flux increased with increased GWL. The highest N2O flux (2635 µg N m−2 hr−1) was also observed in the control plots at a high GWL of −24 cm. An exponential negative correlation was found between WFPS and N2O emissions for all treatments (T1: R2 = 0.32; T2: R2 = 0.30; T3: R2 = 0.42; T4: R2 = 0.17). The emissions of N2O at higher N rates (T3 and T4) were highest at a WFPS of more than 70%. It was observed that the N2O fluxes increased when WFPS increased from 50% to 70% and decreased afterwards when the WFPS increased to a higher WFPS (> 70%) (Table 8). A significant positive correlation between NO3 concentration and N2O emissions (p < 0.01) and a significant negative correlation between WFPS and NO3 (p < 0.05) were observed with a WFPS ranging between 70% and 96% (Table 8). Based on the standardized regression coefficients, the strongest predictor was GWL, except for T2 (Table 7). Also, the standardized coefficient of GWL was increased from T2 to T4 (Table 7). Soil N2O emissions were significantly correlated with both GWL (p < 0.001) and WFPS (p < 0.01) for all treatments. Soil N2O emission was significantly correlated with soil temperature for T2 only (p < 0.01) while inorganic N was significantly correlated with N2O emissions for T3 and T4 only (p < 0.05) (Table 7). An exponential positive correlation between N2O emissions and NO3 for T3 (R2 = 0.23) and T4 (R2 = 0.12) was observed.
The effect of GWL on N2O flux for both GWL conditions in 2010 is shown in Figure 5. The N2O flux increased to above 800 µg N m−2 hr−1 with a GWL shallower than −60 cm. A significant positive correlation between N2O flux and NO3 was observed for T4 (R2 = 0.23) but only at a low GWL of deeper than −60 cm (p < 0.05).

4. Discussion

4.1. Effect of N Fertilization on N2O Emissions

The increase in N2O flux with a small peak following N fertilization, as generally observed in this study, was also reported in other studies [28,29]. In this study, only T4 saw significantly increased annual N2O emissions. However, a previous incubation study showed that the addition of ammonium sulphate to tropical peatland suppressed N2O emissions due to high ammonium content and an anaerobic condition that inhibited nitrification [19]. However, it was also observed that N2O fluxes were occasionally higher in control plots compared to N-fertilized plots. It is likely that the greater part of N2O fluxes from drained organic soil was derived from N released as a result of peat decomposition, and not from fertilization [10,18,30], contributing to insignificant effects of N fertilizers on N2O emissions on tropical peatland. A study on temperate peat showed that N fertilization stimulated N2O flux only when application rates were very high (480 kg N ha−1) but the N2O flux hardly increased under 60–120 kg N ha−1 application rates even when NO3 was high [31]. Although the effect of N application on annual cumulative N2O emissions was only significant in T4, the N application still has the potential to induce annual cumulative N2O emissions when the N fertilizer goes above 62.2 kg N ha−1 yr−1—10% to 96% higher than without N.
The annual N2O emissions in this study were significantly increased with N fertilization for T4 only in 2010, 2011, 2012, and 2016 (Table 6). In these years, annual cumulative N2O emissions were higher, coinciding with higher NO3 concentration. In 2010, N fertilization significantly increased both NO3 and N2O emissions but only for T4. This could be due to the short-term drastic GWL change in 2010 in which increased GWL significantly decreased NO3 concentration and significantly increased both WFPS and N2O emissions (Table 4). Alternating between low (deeper than −60 cm) and high groundwater level (GWL) (shallower than −60 cm), enhanced nitrification during low GWL further supplied NO3 for denitrification in high GWL, contributing to higher N2O emissions in high GWL [32,33]. In 2011, higher N2O and NO3 were observed with decreasing GWL in June 2011 to December 2011, implying the occurrence of the nitrification process, which may be the reason for the larger annual N2O emissions. In 2012, annual N2O emissions started to significantly reduce for all treatments (Table 6), possibly due to the palm canopy density and leaf area index (LAI). As the palm grows, the size of its canopy increases and eventually closes (usually 4 years after planting). Canopies with high LAIs can block sunlight from reaching the soil surface and absorb more momentum; therefore allowing less vertical mixing of air within the canopy [34]. These conditions keep the air and soil beneath the canopy cool during the day, reducing water loss from the soil via evaporation. A higher bulk density and a lower total porosity due to compaction and peat decomposition cause more micropores to form, resulting in increased water retention capacity even during the dry season and the reduction in ground water level [35]. The increase in WFPS with time may have decreased the N mineralization and nitrification but enhanced denitrification, leading to a reduction in NO3 supplies and N2O emission.
To date, studies investigating the effect of N fertilization on N2O emissions in tropical peatland have mainly used urea as the N source [10,16,17,18]. Urea is widely used as an N fertilizer worldwide due to its lower price per unit N and its high N content (46% N) compared to other N fertilizers. The magnitude of the pH decrease has been found to be greater using ammonium sulfate compared to urea [36]. It has been reported that the addition of urea accelerated nitrification while AS tended to lower the nitrification status and inhibited nitrification at higher rates due to increased soil pH as a result of the hydrolysis of urea, which stimulated nitrifier activity and the availability of soluble substrate, thus enhancing the nitrification rate [37,38]. However, in the case of paddy fields, application of ammonium sulphate would result in larger emissions of N2O than that of urea, probably due to the faster availability of NH4-N from AS for faster nitrification and thus, higher N2O production [39,40].
In the current study, annual cumulative N2O emissions from 2010 until 2012 (ranging from 24.9–79.7 kg N ha−1 yr−1) were higher than the values obtained in a previous study involving a urea-fertilized oil palm plantation on tropical peatland (ranging from 12.8–26.6 kg N ha−1 yr−1) [18] while the values from 2013 until 2016 (ranging from 6.5–22.9 kg N ha−1 yr−1) fell within the previous study’s range. The higher values of N2O emissions from 2010 until 2012 in this study compared to the previous study may be due to the lower GWL during the period in this study. However, the aforementioned values still fall within the values obtained by studies on cropland on tropical peatland [10] (ranging from 21–259 kg N ha−1 yr−1). The EF for T4 in 2010, 2011, 2012, and 2016 was 17.6%, 25.9%, 20.0%, and 2.7%, respectively. In other studies on oil palm plantation on tropical peatland, the EF of urea and coated urea was 19.1% and 43.8%, respectively [16], higher than the EF values obtained in this study.

4.2. Factors Influencing Soil N2O Emissions

The regression analysis revealed that N2O fluxes correlated significantly with GWL and WFPS for all treatments, with GWL as the strongest predictor. This result shows that the depth of the water table affects the degree of anaerobicity of the peat, which is essential for denitrification, and the thickness of the aerobic layer, which determines the soil volume for nitrification rate. There was a significant positive correlation between GWL and N2O flux (p < 0.001), where N2O flux increased as GWL increased. The highest N2O emissions in the drained tropical peatland forest were found to relate to rising water table conditions during the start of the wet season. After the onset of the wet season, peat moisture increased due to the increased water infiltration and water table accompanied by sufficiently oxic conditions in the surface peat and the increased decomposition of fine root and leaf litter deposited during drier conditions, resulting in a surge in N2O emissions [6]. In 2010, short-term drastic GWL changes were observed and increased GWL significantly increased N2O emissions by 185% to 253.3% over the low GWL (p < 0.05) (Table 4). Rises in GWL were accompanied by increases in N2O emissions, through associated increases in WFPS. Peat soil moisture distribution is also influenced by the rate of capillary rise, which, in turn, is affected by GWL and bulk density. The highest soil water content (308%) corresponded to the soil capillary rise in high GWL (−40 cm) and high bulk density (0.2 g cm−3) while the lowest water content (37%) occurred in low GWL (−100 cm) and low bulk density (0.1 g cm−3) [41]. At low GWL (deeper than −60 cm), the WFPS ranged from 50–70% while at high GWL (shallower than −60 cm), the WFPS ranged from 60–80%. The effect of N fertilization on N2O emission was prominent in wet soil [16,42,43], which explains the larger effect of GWL on N2O emissions at high N rates (Table 7).
After GWL, WFPS was one of the important factors in affecting soil N2O emissions in this study. The WFPS was negatively correlated with N2O flux (p < 0.01). Soil N2O emissions increased when WFPS increased from 50% to 70% and decreased when WFPS went above 70%. This phenomenon was observed in the beginning of 2012 where both N2O flux and NO3 decreased in tandem with increased WFPS (>70%) (Figure 2). Complete denitrification might have occurred and N2O was mostly reduced to N2 when WFPS went above 70% [44,45]. Increasing WFPS likely reduced gas diffusivity in the soil, inhibiting the escape of N2O and enhancing the probability of its reduction to N2 [17,46]. Moreover, the low nitrification rate in continuously high WFPS limited the production of NO3 for denitrification, leading to low N2O emissions.
A significant positive correlation between NO3 and N2O flux was only found in T3 and T4 while the effect of NH4+ on N2O flux was only found for T3 (Table 7). The emissions of N2O from the soil were better correlated with NO3 (product of nitrification and precursor of denitrification) than with NH4+, suggesting that denitrification was an important source of soil N2O in this case [47]. According to Liu et al. [48], NH4+ enhanced the N2O flux from the soil only at lower soil moisture, which explains the lack of a relationship between NH4+ and N2O flux when WFPS was mostly higher than 70%.
Soil temperature is also considered important in regulating the rate of N2O flux, as the contributions of nitrification and denitrification to N2O flux may vary with temperature [49,50]. For instance, Lai et al. [50] reported that nitrification and denitrification peaked at 35–40 °C. However, at temperatures above 40 °C, high soil respiration rates will likely decrease oxygen availability, enhancing the anaerobic microsites, leading to the reduced of N2O to N2 production. In this study, a significant correlation between soil temperature at 5 cm and 10 cm and soil N2O flux was only found for T2 (Table 7). The lack of a relationship between soil temperature and N2O flux may be due to the constant variation in the soil temperature in tropical regions.

4.3. Effect of N Fertilization on Oil Palm Yield

In this study, the N fertilization rates had no effect on annual oil palm yield (p > 0.05). Morris et al. [51] also reported the significant effect of N fertilization on the grain yield of rice plant planted on peat, indicating the existence of a large N pool in the rewetted peat soils, which was also reflected by the higher oil palm yield in the control plot rather than the fertilized plot in the study. A study on the mineral soil in an oil palm plantation showed that N rates of 120 kg N ha−1 yr−1 met the nitrogen demands (116.2 kg N ha−1 yr−1) to produce 30 t ha−1 yr−1 FFB [52]. According to Teh [53], nutrient demand in oil palm plantations will increase steeply in the next two to four years, after which it will stabilize to a rather constant level (180 kg N ha−1); thus, high soil nutrient levels may not always lead to high nutrient uptake. The annual oil palm yield in this study was negatively correlated (p < 0.05) with annual cumulative N2O emissions and NO3, suggesting that increased oil palm yield reduced NO3 in soil via N uptake, resulting in lower N2O emissions. The effect of plant N uptake on N2O emissions was also reported by other studies [54,55]. Marwanto et al. [56] showed that during a drought, two tropical peatlands exhibited a low soil pH (pH 3.7–pH 4.0) at a depth of 50 cm and a high soil pH (pH 5.9–pH 6.8) at a depth of 200 cm. These phenomena are attributed to oxidation reactions such as organic acids and NO3 generation in shallower soil and reduction reactions such as denitrification in deeper soil during a drought. Therefore, in the rainy season, when NO3 leaches and ground water level rises, N2O production in subsurface soil will be increased. Kusa et al. [57] also found that the subsurface soil with a shallower ground water level would produce higher N2O due to NO3 leaching.

5. Conclusions

Although the effect of N application on annual cumulative N2O emissions was only significant for T4, N application still has the potential to induce annual cumulative N2O emissions when more than 62.2 kg N ha−1 yr−1 N fertilizer rate is applied. Both GWL (p < 0.001) and WFPS (p < 0.01) were significant predictors for all treatments in which the effect of GWL on N2O flux increased as the N rates increased. Based on this relationship, denitrification was the dominant source of N2O emissions in this study. Alternating between low and high GWL, particularly in 2010–2011, enhanced nitrification during low GWL further supplied NO3 for denitrification in the high GWL, contributing to higher N2O fluxes in the aforementioned years. Increasing WFPS (> 70%) was observed to start in 2012 correlating to a decrease in both N2O flux and NO3, which could be due to complete denitrification, a reduction in gas diffusivity, and plant N uptake. However, the effect of plant uptake on N2O flux should not be undermined, at least until the completion of the planting cycle.

Author Contributions

Investigation, Project Administration, Formal Analysis, Writing—original draft preparation: A.C.; Funding Acquisition, Resources, L.M.; Supervision, Writing—review and editing, L.M., K.I. and R.H. All authors have read and approved the final manuscript.

Funding

This research was funded by both Sarawak State Government and the Federal Government of Malaysia.

Acknowledgments

The authors gratefully acknowledge the STROPI staffs, who assisted in the field trial management and the laboratory analysis. We acknowledge the editors and two anonymous reviewers for their constructive comments and suggestions that have helped to improve the quality of this paper.

Conflicts of Interest

The authors declare no conflict of interest. The funders had no role in the design of the study; in the collection, analyses, or interpretation of data; in the writing of the manuscript, or in the decision to publish the results.

References

  1. Forster, P.; Ramaswamy, V.; Artaxo, P.; Berntsen, T.; Betts, R.; Fahey, D.W.; Haywood, J.; Lean, J.; Lowe, D.C.; Myhre, G.; et al. Changes in Atmospheric Constituents and in Radiative Forcing. In Climate Change 2007: The Physical Science Basis. Contribution of Working Group I to the Fourth Assessment Report of the Intergovernmental Panel on Climate Change; Solomon, S., Qin, D., Manning, M., Chen, Z., Marquis, M., Averyt, K.B., Tignor, M., Miller, H.L., Eds.; Cambridge University Press: Cambridge, UK; New York, NY, USA, 2007; pp. 129–234. [Google Scholar]
  2. Davidson, E.A. The contribution of manure and fertilizer nitrogen to atmospheric nitrous oxide since 1860. Nat. Geosci. 2009, 2, 659. [Google Scholar] [CrossRef]
  3. Maraseni, T.N.; Qu, J. An international comparison of agricultural nitrous oxide emissions. J. Clean. Prod. 2016, 135, 1256–1266. [Google Scholar] [CrossRef]
  4. Comte, I.; Colin, F.; Whalen, J.K.; Grünberger, O.; Caliman, J.P. Agricultural practices in oil palm plantations and their impact on hydrological changes, nutrient fluxes and water quality in Indonesia: A review. In Advances in Agronomy; Academic Press: Cambridge, MA, USA, 2012; Volume 116, pp. 71–124. [Google Scholar]
  5. Mutert, E.; Fairhurst, T.H.; Von Uexküll, H.R. Agronomic management of oil palms on deep peat. Better Crop. Int. 1999, 13, 22–27. Available online: http://www.ipni.net/publication/bci.nsf/0/963CC0D08521253185257BBA006E791B/$FILE/Better%20Crops%20International%201999-1%20p22.pdf (accessed on 26 May 2019).
  6. Jauhiainen, J.; Silvennoinen, H.; Hämäläinen, R.; Kusin, K.; Limin, S.; Raison, R.J.; Vasander, H. Nitrous oxide fluxes from tropical peat with different disturbance history and management. Biogeosciences 2012, 9, 1337–1350. [Google Scholar] [CrossRef] [Green Version]
  7. Couwenberg, J.; Dommain, R.; Joosten, H. Greenhouse gas fluxes from tropical peatlands in south-east Asia. Glob. Chang. Biol. 2010, 16, 1715–1732. [Google Scholar] [CrossRef]
  8. Murdiyarso, D.; Hergoualc’h, K.; Verchot, L.V. Opportunities for reducing greenhouse gas emissions in tropical peatlands. Proc. Natl. Acad. Sci. USA 2010, 107, 19655–19660. [Google Scholar] [CrossRef] [Green Version]
  9. Butterbach-Bahl, K.; Baggs, E.M.; Dannenmann, M.; Kiese, R.; Zechmeister-Boltenstern, S. Nitrous oxide emissions from soils: How well do we understand the processes and their controls? Philos. Trans. R. Soc. B Biol. Sci. 2013, 368, 20130122. [Google Scholar] [CrossRef]
  10. Takakai, F.; Morishita, T.; Hashidoko, Y.; Darung, U.; Kuramochi, K.; Dohong, S.; Limin, S.H.; Hatano, R. Effects of agricultural land-use change and forest fire on N2O emission from tropical peatlands, central Kalimantan, Indonesia. Soil Sci. Plant Nutr. 2006, 52, 662–674. [Google Scholar] [CrossRef]
  11. Pihlatie, M.; Syväsalo, E.; Simojoki, A.; Esala, M.; Regina, K. Contribution of nitrification and denitrification to N2O production in peat, clay and loamy sand soils under different soil moisture conditions. Nutr. Cycl. Agroecosyst. 2004, 70, 135–141. [Google Scholar] [CrossRef]
  12. Van Beek, C.L.; Pleijter, M.; Kuikman, P.J. Nitrous oxide emissions from fertilized and unfertilized grasslands on peat soil. Nutr. Cycl. Agroecosyst. 2011, 89, 453–461. [Google Scholar] [CrossRef]
  13. Dobbie, K.E.; Smith, K.A. The effect of water table depth on emissions of N2O from a grassland soil. Soil Use Manag. 2006, 22, 22–28. [Google Scholar] [CrossRef]
  14. Regina, K.; Silvola, J.; Martikainen, P.J. Short term effects of changing water table on N2O fluxes from peat monoliths from natural and drained boreal peatlands. Glob. Chang. Biol. 1999, 5, 183–189. [Google Scholar] [CrossRef]
  15. Minamikawa, K.; Eguchi, S.; Nishimura, S.; Ihara, H.; Maeda, M.; Yagi, K.; Komada, M. Groundwater-induced emissions of nitrous oxide through the soil surface and from subsurface drainage in an Andosol upland field: A monolith lysimeter study. Soil Sci. Plant Nutr. 2013, 59, 87–95. [Google Scholar] [CrossRef] [Green Version]
  16. Sakata, R.; Shimada, S.; Arai, H.; Yoshioka, N.; Yoshioka, R.; Aoki, H.; Inubushi, K. Effect of soil types and nitrogen fertilizer on nitrous oxide and carbon dioxide emissions in oil palm plantations. Soil Sci. Plant Nutr. 2014, 61, 48–60. [Google Scholar] [CrossRef]
  17. Melling, L.; Hatano, R.; Goh, K.J. Nitrous oxide emissions from three ecosystems in tropical peatland of Sarawak, Malaysia. Soil Sci. Plant Nutr. 2007, 53, 792–805. [Google Scholar] [CrossRef]
  18. Oktarita, S.; Hergoualc’h, K.; Anwar, S.; Verchot, L.V. Substantial N2O emissions from peat decomposition and N fertilization in an oil palm plantation exacerbated by hotspots. Environ. Res. Lett. 2017, 12, 104007. [Google Scholar] [CrossRef]
  19. Hadi, A.; Inubushi, K.; Purnomo, E.; Razie, F.; Yamakawa, K.; Tsuruta, H. Effect of land-use changes on nitrous oxide (N2O) emission from tropical peatlands. Chemosphere Glob. Chang. Sci. 2000, 2, 347–358. [Google Scholar] [CrossRef]
  20. Page, S.E.; Morrison, R.; Malins, C.; Hooijer, A.; Rieley, J.O.; Jauhiainen, J. Review of Peat Surface Greenhouse Gas Emissions from Oil Palm Plantations in Southeast Asia; White Paper Number 15; International Council on Clean Transportation: Washington, DC, USA, 2011; p. 22. Available online: http://www.environmentportal.in/files/file/ICCT_Peat-Emissions_Sept2011.pdf (accessed on 26 May 2019).
  21. Soil Survey Staff. Keys to Soil Taxonomy, 12th ed.; USDA-Natural Resources Conservation Service: Washington, DC, USA, 2014.
  22. IUSS Working Group WRB. World Reference Base for Soil Resources 2014. International Soil Classification System for Naming Soils and Creating Legends for Soil Maps; World Soil Resources Reports No. 106; FAO: Rome, Italy, 2015. [Google Scholar]
  23. Hasnol, O.; Farawahida, M.D.; Mohd, H.; Samsudin, A. Re-evaluation of nutrients requirements for oil palm planting on peat soil. Planter 2014, 90, 161–177. Available online: https://www.cabdirect.org/cabdirect/abstract/20143238761 (accessed on 28 May 2019).
  24. Norman, J.M.; Kucharik, C.J.; Gower, S.T.; Baldocchi, D.D.; Crill, P.M.; Rayment, M.; Savage, K.; Striegl, R.G. A comparison of six methods for measuring soil-surface carbon dioxide fluxes. J. Geophys. Res. Atmos. 1997, 102, 28771–28777. [Google Scholar] [CrossRef]
  25. Jin, T.; Shimizu, M.; Marutani, S.; Desyatkin, A.R.; Iizuka, N.; Hata, H.; Hatano, R. Effect of chemical fertilizer and manure application on N2O emission from reed canary grassland in Hokkaido, Japan. Soil Sci. Plant Nutr. 2010, 56, 53–65. [Google Scholar] [CrossRef]
  26. Albanito, F.; Lebender, U.; Cornulier, T.; Sapkota, T.B.; Brentrup, F.; Stirling, C.; Hillier, J. Direct nitrous oxide emissions from tropical and sub-tropical agricultural systems-a review and modelling of emission factors. Sci. Rep. 2017, 7, 44235. [Google Scholar] [CrossRef]
  27. Keeney, D.R.; Nelson, D.W. Nitrogen-Inorganic forms. In Methods of Soil Analysis Part 2: Chemical and Microbiological Properties, 2nd ed.; Agronomy 9/2; Page, A.L., Miller, R.H., Keeney, D.R., Eds.; American Society of Agronomy: Madison, WI, USA, 1982; pp. 643–698. [Google Scholar]
  28. Weitz, A.M.; Linder, E.; Frolking, S.; Crill, P.M.; Keller, M. N2O emissions from humid tropical agricultural soils: Effects of soil moisture, texture and nitrogen availability. Soil Biol. Biochem. 2001, 33, 1077–1093. [Google Scholar] [CrossRef]
  29. Zhou, W.J.; Ji, H.L.; Zhu, J.; Zhang, Y.P.; Sha, L.Q.; Liu, Y.T.; Lin, Y.X. The effects of nitrogen fertilization on N2O emissions from a rubber plantation. Sci. Rep. 2016, 6, 28230. [Google Scholar] [CrossRef]
  30. Leifeld, J. Distribution of nitrous oxide emissions from managed organic soils under different land uses estimated by the peat C/N ratio to improve national GHG inventories. Sci. Total Environ. 2018, 631, 23–26. [Google Scholar] [CrossRef]
  31. Augustin, J.; Merbach, W.; Rogasik, J. Factors influencing nitrous oxide and methane emissions from minerotrophic fens in northeast Germany. Biol. Fertil. Soils 1998, 28, 1–4. [Google Scholar] [CrossRef]
  32. Martikainen, P.J.; Nykänen, H.; Crill, P.; Silvola, J. Effect of a lowered water table on nitrous oxide fluxes from northern peatlands. Nature 1993, 366, 51. [Google Scholar] [CrossRef]
  33. Susilawati, H.L.; Setyanto, P.; Ariani, M.; Hervani, A.; Inubushi, K. Influence of water depth and soil amelioration on greenhouse gas emissions from peat soil columns. Soil Sci. Plant Nutr. 2016, 62, 57–68. [Google Scholar] [CrossRef]
  34. Hardwick, S.R.; Toumi, R.; Pfeifer, M.; Turner, E.C.; Nilus, R.; Ewers, R.M. The relationship between leaf area index and microclimate in tropical forest and oil palm plantation: Forest disturbance drives changes in microclimate. Agric. For. Meteorol. 2015, 201, 187–195. [Google Scholar] [CrossRef]
  35. Kurnain, A. Moisture release of tropical peat soils as decreasing water table. Trop. Wetl. J. 2016, 1, 33–37. Available online: http://eprints.unlam.ac.id/1986/1/09_5-9-1-SM.pdf (accessed on 14 August 2019).
  36. Fageria, N.K.; Dos Santos, A.B.; Moraes, M.F. Influence of urea and ammonium sulfate on soil acidity indices in lowland rice production. Commun. Soil Sci. Plant Anal. 2010, 41, 1565–1575. [Google Scholar] [CrossRef]
  37. Rizal, A.; Ahmad, H.; Osumanu, H.A.; Halimi, M.S. Influence of urea and ammonium sulfate on potential mineralization and nitrification rate in tropical peat soil from oil palm cultivation under lab condition. Int. J. Trop. Agric. 2015, 33 Pt IV, 1747–1754. Available online: https://www.cabdirect.org/cabdirect/abstract/20153342355 (accessed on 26 May 2019).
  38. Tierling, J.; Kuhlmann, H. Emissions of nitrous oxide (N2O) affected by pH-related nitrite accumulation during nitrification of N fertilizers. Geoderma 2018, 310, 12–21. [Google Scholar] [CrossRef]
  39. Cai, Z.; Xing, G.; Yan, X.; Xu, H.; Tsuruta, H.; Yagi, K.; Minami, K. Methane and nitrous oxide emissions from rice paddy fields as affected by nitrogen fertilisers and water management. Plant Soil 1997, 196, 7–14. [Google Scholar] [CrossRef]
  40. Kumar, U.; Jain, M.C.; Pathak, H.; Kumar, S.; Majumdar, D. Nitrous oxide emission from different fertilizers and its mitigation by nitrification inhibitors in irrigated rice. Biol. Fertil. Soils 2000, 32, 474–478. [Google Scholar] [CrossRef]
  41. Nugraha, M.I.; Annisa, W.; Syaufina, L.; Anwar, S. Capillary water rise in peat soil as affected by various groundwater levels. Indones. J. Agric. Sci. 2017, 17, 75–83. [Google Scholar] [CrossRef]
  42. Li, Z.A.; Zou, B.; Xia, H.P.; Ding, Y.Z.; Tan, W.N.; Ma, Z.R. Effect of fertilizer and water content on N2O emission from three plantation soils in south China. J. Environ. Sci. (China) 2005, 17, 970. [Google Scholar]
  43. Liu, X.; Dong, Y.; Qi, Y.; Peng, Q.; He, Y.; Sun, L.; Jia, J.; Guo, S.; Cao, C.; Yan, Z.; et al. Response of N2O emission to water and nitrogen addition in temperate typical steppe soil in Inner Mongolia, China. Soil Tillage Res. 2015, 151, 9–17. [Google Scholar] [CrossRef]
  44. Davidson, E.A.; Keller, M.; Erickson, H.E.; Verchot, L.V.; Veldkamp, E. Testing a conceptual model of soil emissions of nitrous and nitric oxides. BioScience 2000, 50, 667–680. [Google Scholar] [CrossRef]
  45. Ishikura, K.; Darung, U.; Inoue, T.; Hatano, R. Variation in Soil Properties Regulate Greenhouse Gas Fluxes and Global Warming Potential in Three Land Use Types on Tropical Peat. Atmosphere 2018, 9, 465. [Google Scholar] [CrossRef]
  46. Smith, K.A.; McTaggart, I.P.; Tsuruta, H. Emissions of N2O and NO associated with nitrogen fertilization in intensive agriculture, and the potential for mitigation. Soil Use Manag. 1997, 13, 296–304. [Google Scholar] [CrossRef]
  47. Pärn, J.; Verhoeven, J.T.; Butterbach-Bahl, K.; Dise, N.B.; Ullah, S.; Aasa, A.; Kasak, K. Nitrogen-rich organic soils under warm well-drained conditions are global nitrous oxide emission hotspots. Nat. Commun. 2018, 9, 1135. [Google Scholar] [CrossRef] [Green Version]
  48. Liu, X.J.; Mosier, A.R.; Halvorson, A.D.; Reule, C.A.; Zhang, F.S. Dinitrogen and N2O emissions in arable soils: Effect of tillage, N source and soil moisture. Soil Biol. Biochem. 2007, 39, 2362–2370. [Google Scholar] [CrossRef]
  49. Koponen, H.T.; Duran, C.E.; Maljanen, M.; Hytönen, J.; Martikainen, P.J. Temperature responses of NO and N2O emissions from boreal organic soil. Soil Biol. Biochem. 2006, 38, 1779–1787. [Google Scholar] [CrossRef]
  50. Lai, T.V.; Farquharson, R.; Denton, M.D. High soil temperatures alter the rates of nitrification, denitrification and associated N2O emissions. J. Soils Sediments 2019, 1–14. [Google Scholar] [CrossRef]
  51. Morris, J.; Ye, R.; Silva, L.C.; Horwath, W.R. Nitrogen fertilization had no effect on CH4 and N2O emissions in rice planted in rewetted peatlands. Soil Sci. Soc. Am. J. 2017, 81, 224–232. [Google Scholar] [CrossRef]
  52. Tarmizi, A.M.; Tayeb, D.M. Nutrient demands of Tenera oil palm planted on inland soils of Malaysia. J. Oil Palm Res. 2006, 18, 204–209. Available online: http://www.oneoilpalm.com/wp-content/uploads/2017/06/Nutrient-demands-of-tenera-oil-palm-planted-on-inland-soils-of-Malaysia.pdf (accessed on 30 August 2019).
  53. Teh, C.B.S. Availability, Use, and Removal of Oil Palm Biomass in Indonesia; Report for the International Council on Clean Transportation; University Putra: Selangor, Malaysia, 2016. [Google Scholar]
  54. Simojoki, A.; Jaakkola, A. Effect of nitrogen fertilization, cropping and irrigation on soil air composition and nitrous oxide emission in a loamy clay. Eur. J. Soil Sci. 2000, 51, 413–424. [Google Scholar] [CrossRef]
  55. Sosulski, T.; Szara, E.; Stępień, W.; Szymańska, M. Nitrous oxide emissions from the soil under different fertilization systems on a long-term experiment. Plant Soil Environ. 2014, 60, 481–488. [Google Scholar] [CrossRef] [Green Version]
  56. Marwanto, S.; Watanabe, T.; Iskandar, W.; Sabiham, S.; Funakawa, S. Effects of seasonal rainfall and water table movement on the soil solution composition of tropical peatland. Soil Sci. Plant Nutr. 2018, 64, 386–395. [Google Scholar] [CrossRef]
  57. Kusa, K.; Sawamoto, T.; Hu, R.; Hatano, R. Comparison of the closed-chamber and gas concentration gradient methods for measurement of CO2 and N2O fluxes in two upland field soils. Soil Sci. Plant Nutr. 2008, 54, 777–785. [Google Scholar] [CrossRef]
Figure 1. A diagram of the experimental design; each color represents different treatments (black—T1, yellow—T2, red—T3, and green—T4).
Agriculture 09 00213 g001
Figure 2. Monthly (a) rainfall, (b) GWL, (c) WFPS, (d) soil temperature, (e) NH4+-N, (f) NO3-N concentrations and (g) N2O fluxes for each treatment. The dashed line indicates N fertilization (applied every March, June, September, and November of each year).
Agriculture 09 00213 g002
Figure 3. Oil palm yield for each treatment (2010–2017).
Agriculture 09 00213 g003
Figure 4. Relationships between oil palm yields and annual cumulative N2O emissions (a); and between oil palm yields and NO3 (b) for each treatment.
Agriculture 09 00213 g004
Figure 5. Relationship between GWL and N2O flux for each treatment in 2010.
Agriculture 09 00213 g005
Table 1. Rate of ammonium sulphate (AS).
TreatmentMonthkg AS palm−1kg AS palm−1 yr−1kg N ha−1 yr−1
T1March000
June0
September0
November0
T2March0.25131.1
June0.25
September0.25
November0.25
T3March0.5262.2
June0.5
September0.5
November0.5
T4March14124.3
June1
September1
November1
Table 2. Fertilization schedule from 2010 to 2017 (kg palm−1).
RateFebruary March May June
RP ASMOPCu ZnBo ASMOP
T1 (Control)1.75 010.1 0.10.1 01
T2 (Low N)1.75 0.2510.1 0.10.1 0.251
T3 (Recommended N)1.75 0.510.1 0.10.1 0.51
T4 (High N)1.75 1.010.1 0.10.1 1.01
RateAugust September October November
Kieserite ASMOP CuZnBo ASMOP
T1 (Control)1.75 01.6 0.10.10.1 01.6
T2 (Low N)1.75 0.251.6 0.10.10.1 0.251.6
T3 (Recommended N)1.75 0.51.6 0.10.10.1 0.51.6
T4 (High N)1.75 1.01.6 0.10.10.1 1.01.6
Ammonium sulphate (NH4)2SO4 (AS); Rock phosphate Ca3(PO4)2 (RP); Muriate of potash (KCl) (MOP); Copper (Cu); Zinc (Zn); Borate (B2O3) (Bo). All values are in kilogram (kg).
Table 3. Descriptions and physicochemical properties of soil at the study site (mean ± STD). WFPS: water-filled pore space; GWL: groundwater level; LOI: loss on ignition.
PropertiesValue ± SD
Average annual rainfall (mm)2697 ± 596.7
WFPS (%)70.4 ± 10.4
GWL (cm)−53.0 ± 20.4
Bulk density (g cm−3)0.24 ± 0.01
Soil pH3.4 ± 0.1
LOI (%)96.7 ± 1.0
C (%)55.8 ± 2.4
N (%)1.9 ± 0.2
C/N ratio30.3 ± 2.4
Table 4. Mean WFPS, NO3 concentrations, NH4+ concentrations, and N2O emissions for each treatment at low GWL (−76 cm to −109 cm) (January–June) and at high GWL (−24 cm to 58.3 cm) (July–December) in 2010.
PropertiesGWLT1T2T3T4
WFPS (%)Low GWL61.5 (7.0)a61.4 (7.4)a64.0 (6.4)a59.7 (7.1)a
High GWL68.0 (7.0)a*72.2 (6.6)a*69.3 (7.8)a*71.3 (6.3)a*
NO3 (0–25 cm)
(mg N kg−1)
Low GWL25.0 (14.7)a28.9 (11.2)a31.9 (18.1)a34.8 (10.6)a
High GWL14.7 (8.6)b*14.1 (14.0)b*20.8 (14.8)ab33.7 (33.9)a
NH4+ (0–25 cm)
(mg N kg−1)
Low GWL489.1 (182.7)a484.6 (144.4)a440.0 (188.7)a436.7 (143.8)a
High GWL411.5 (144.6)a460.8 (481.7)a447.4 (134.6)a497.2 (192.3)a
N2O
(µg N m−2 hr−1)
Low GWL343.7 (240.4)a270.9 (144.9)a394.4 (340.0)a424.1 (200.9)a
High GWL1063.9 (920.7)a*957.0 (621.3)a*1304.8 (729.5)a*1209.9 (564.3)a*
The data represents the mean (standard deviation) (n = 18). The different letters show the significant differences among the treatments (p < 0.05). The asterisk (*) indicates significant differences between low and high GWL (p < 0.05).
Table 5. Pearson’s correlation coefficient denoting the effect of GWL on NO3 concentrations for each year (n = 48).
201020112012201320162017
GWL−0.348*−0.527**−0.297*−0.054−0.418**0.003
0.0150.0000.0430.7140.0030.981
**Correlation is significant at the 0.01 level (2-tailed). *Correlation is significant at the 0.05 level (2-tailed).
Table 6. Annual cumulative N2O emissions for each treatment.
YearAnnual Cumulative N2O Emissions (kg N ha−1 yr−1)
T1T2T3T4
201045.9 (11.5)b AB43.5 (5.3)b A60.4 (11.7)ab A67.8 (9.7)a A
201147.5 (4.2)b A43.3 (2.5)b A70.7 (22.2)ab A79.7 (3.3)a A
201225.9 (11.3)b BC24.9 (6.2)b B36.8 (5.4)ab BC50.7 (2.8)a B
201313.59 (4.6)a C19.4 (3.2)a BC20.9 (7.0)a CD22.9 (3.8)a C
20166.5 (0.3)b C7.6 (1.6)ab D8.2 (0.6)ab D9.8 (1.6)a C
201712.2 (5.1)a C11.8 (1.0)a D13.4 (0.1)a CD18.2 (3.3)a C
Mean25.2 (17.8)a25.1(15.4)a35.1 (25.7)a41.5(28.7)a
The data presents the mean (standard deviation) (n = 3–12). The letters (a, b, c) in the row indicate a significant difference between treatments while the letters (A, B, C) in the column indicate a significant difference between years using Tukey’s Test at p < 0.05.
Table 7. The stepwise regression analysis denoting the effect of environmental variables and soil inorganic N on the N2O fluxes in each treatment (n = 72).
TreatmentVariableStd. CoefficientSEp-ValueR2
T1GWL0.3751.9580.0000.18
WFPS−0.3743.8100.0000.32
T2GWL0.3731.6590.0000.20
WFPS−0.3223.1430.0020.29
Soil temperature at 5 cm0.64852.430.003
Soil temperature at 10 cm−0.41969.200.050
T3WFPS−0.4154.6980.0000.42
GWL0.4542.3140.0000.13
NH4+0.2350.4730.009
NO30.2224.2160.038
T4NO30.4422.6450.0000.29
GWL0.5162.2530.0000.17
WFPS−0.2934.7300.0020.31
Table 8. Pearson’s correlation between the N2O emissions and WFPS and NO3 concentrations at WFPS of 50–70% and > 70% (n = 79–207).
Variable50–70%70–96%
N2OWFPSN2OWFPS
WFPS0.384**-−0.506**-
0.000-0.000-
NO30.032−0.1150.376**−0.137*
0.7820.3130.0000.049
**Correlation is significant at the 0.01 level (2-tailed). *Correlation is significant at the 0.05 level (2-tailed).

