Article

Efficacy of N-methyl-N-nitrosourea (MNU) Mutation on Enhancing the Yield and Quality of Rice

1
Graduate School for International Development and Cooperation, Hiroshima University, Hiroshima 739-8529, Japan
2
Faculty of Agriculture, Nangarhar University, Nangarhar 2601, Afghanistan
3
Badam Bagh Research Station, Ministry of Agriculture, Irrigation, and Livestock, Kabul 1001, Afghanistan
4
Department of Biotechnology, NTT Institute of Hi-Technology, Nguyen Tat Thanh University, Ho Chi Minh 72820, Vietnam
5
Department of Genetic Engineering, Agricultural Genetics Institute, Hanoi 122300, Vietnam
6
Khai Xuan International Co. Ltd., Ha Dong District, Duong Noi Ward, LK20A-20B, Khai Xuan Building, Hanoi 152611, Vietnam
*
Author to whom correspondence should be addressed.
Agriculture 2019, 9(10), 212; https://doi.org/10.3390/agriculture9100212
Submission received: 2 September 2019 / Revised: 23 September 2019 / Accepted: 25 September 2019 / Published: 27 September 2019

Abstract

:
Mutation technology has been applied more in recent decades to achieve novel products that are not commonly found in nature. An experiment was conducted to examine the effects of an N-methyl-N-nitrosourea (MNU) mutation on the growth, yield, and physicochemical properties of rice. Seeds of two rice cultivars (K1: DT84, and K3: Q5), along with their mutant lines (K2: mutated DT84, and K4: mutated Q5), were sown, and the established seedlings were transplanted to an open field. Ten hills per plot were randomly selected to evaluate growth parameters, yield, and components. Physicochemical attributes, including protein, amylose, and lipid contents, as well as taste score were measured by a quality tester device. The results showed that plant length, tiller number, and panicle length were higher in mutant lines than those of their cultivars. Furthermore, mutant lines took longer to reach heading and maturity stage. The highest panicle number, spikelet number, repined ratio, 1000 grain weight, 1000 brown rice weight, and grain yield were obtained in mutant lines, as compared to cultivars. The greatest grain yield was obtained in the K4 mutant line (11.6 t/ha), while the lowest was recorded in the K1 cultivar (7.7 t/ha). Lower amylose, protein, and lipid contents were observed in mutant lines compared to those in cultivars. The taste score, which increased from 67.7 to 73.7, was found to be correlated with lower amylose, protein, and lipid contents. The mutation approach increased the grain length but decreased the grain width of tested varieties. This study highlights and suggests the importance of MNU mutation in terms of rice yield improvement with preferable quality.

1. Introduction

Rice (Oryza sativa L.) is one of the leading crops and provides the main source of calories for more than half of the world’s population [1,2,3]. An increasing population has raised demands for rice production worldwide, especially in Asian countries where rice is consumed as part of the typical diet [4,5]. To meet increasing demand, various methods and techniques of genetic manipulation have been applied to optimize rice production, such as mass selection, hybridization, mutation, and genetic modification, among others [6].
Mutation technology has been used to achieve novel attributes that are rarely observed in nature [7]. Utilization of gamma rays has recently raised attention as a speedy method to improve the qualitative and quantitative properties for several crops [8]. El-Degwy [9] stated that gamma irradiation increased heading time, plant length, and panicle number per plant, but it decreased total grain yield compared to those of nonmutagenic rice plants. Induced mutation is a promising tool for creating new genotypes, changing major genes, and governing the quantitative character [10].
Among known methods of mutation, N-methyl-N-nitrosourea (MNU) mutation is a significant approach that effectively enhances and improves food production in many crops, especially in rice [11,12]. Recently, Xuan et al. [13] documented that rice lines developed by MNU mutation exhibited high yield, good quality, and were a potential source for breeding new rice cultivars. The application of mutant rice cultivars is spreading and becoming more prevalent in rice-producing countries. China has been increasingly using this technology for over 15 years [14]. As a result, hundreds of new rice varieties have been released worldwide, especially by China, Japan, and India [5].
Overall, the developed mutant rice cultivars do not have ideal growth performances or quality and are not as adaptable [15]. Hence, more attention is required to evaluate the growth performance, yield potential, and physicochemical properties of mutant rice cultivars based on growing regions to increase productivity and improve desired qualities. The screening process is an essential approach to find suitable and adaptable environments for the developed mutant lines [16]. Within the screening process, phenotypic evaluation is a crucial factor to determine the effectiveness of mutation technology. Very few studies have evaluated the utilization of the MNU approach on rice [5,17,18]. Thus, this research was carried out to examine the effects of MNU mutation on the growth, yield, and physicochemical properties of rice.

2. Materials and Methods

2.1. Experimental Site and Design

This experiment was conducted in the experimental paddy field and Laboratory of Plant Physiology and Biochemistry affiliated to Hiroshima University, Higashi-Hiroshima City, Japan. It was carried out during the rice-growing season from May to October 2018 in irrigated conditions. The field cultivation was arranged in a randomized complete block design with three replications and four cultivars/mutant lines, as shown in Table 1. Mutant lines (F2) were the self-pollination F1 of the mutated K1 and K3 cultivars, which were obtained from the treatments of MNU mutation following a protocol described previously [17,18]. Briefly, seeds of the original cultivars were treated with 150 mM MNU for three hours, dried, and kept in hermetic conditions for three months. Afterward, the seeds were collected and stored at 5 °C in the darkness for further use. The mutated F1 was self-pollinated to yield the mutated F2 population. The experimental field was puddled by power tiller, leveled manually, and each plot was designed at 3 m2.

2.2. Plant Materials and Seedling Management

Perfect seeds of the selected cultivars and mutant lines were soaked in distilled water and managed in a growth chamber for 72 h at 30 °C. The pregerminated seeds were sown in nursery boxes (30 × 60 cm) in commercial soil (N.P.K. contents at 0.8, 1.0, and 1.3 g/kg, JA-ZEN CHU Co. Hiroshima, Japan). The seedlings (25 days old) with 3.5 plant age in leaf number were transplanted to the prepared rice field. The distances between plants and rows were 15 and 20 cm, respectively. Every hill contained one seedling. Weeds were manually controlled at maximum tillering and heading stages. Standard fertilizer (14-10-13) at 130 g per plot was applied at early tillering and milking stages. Water was kept normally based on environmental conditions and plant requirements. Plants were harvested at maturity stage.

2.3. Measurements of Growth and Yield Attributes

Ten hills per plot were randomly chosen to evaluate the growth parameters, yield, and components. Growth parameters were recorded at the maturity stage. Plant length was measured from the surface of the soil to the tip of the flag leaf. Tillers were counted by hand, and panicle length was measured by sample ruler. Panicles were counted in the field, and spikelet numbers were summed per each panicle. Collected grains of each plot were threshed and dried at room temperature to obtain 18% moisture content. The repined grain ratio was calculated based on the formula shown below after the separation of filled and unfilled grains by salt solution (NaCl/water at 1.06 hydrometer). The 1000 grain weight was recorded in triplicate. The grain yield was determined with the below formula. The grains were then dehusked using automatic rice husker machine (model TR-250, Kett Electric Laboratory, Tokyo, Japan), and the brown rice grains were used for further procedures.
Repined grain ratio (%) = (filled grains/total grains) × 100,
Grain yield (g/hill) = Panicle number per hill × Spikelet number per panicle × Ripened grain ratio × 1000 grain weight,

2.4. Measurements of Physicochemical Properties

Physicochemical properties, including protein, amylose, and lipid contents, as well as taste score were measured by a quality tester machine (PGC Shizuoka Seiki PS-500 machine, version 2-12, Shizuoka Seiki Co. Ltd., Shizuoka, Japan) using 100 g brown rice grains with three replications. Ten perfect brown rice grains were selected for each cultivar and mutant line to record grain length, grain width, and grain length-to-width ratio using a vernier caliper as well as to observe their appearance.

2.5. Statistical Analysis

Data were analyzed by Minitab 16.0 statistical software (Minitab Inc. State College, PA, USA). One-way analysis of variance (ANOVA) was conducted to express the differences between cultivars and mutant lines, followed by Tukey’s multicomparison test. Significant differences were defined at p < 0.05 probability level. Pearson correlation was conducted to indicate the relation between grain yield and other parameters.

3. Results

3.1. Growth Attributes

Growth parameters in terms of plant length, tiller number per hill, panicle length, and days to heading and maturity are summarized in Table 2. Plant length and tiller number per hill of mutant lines were not significantly higher than those of the cultivars, while the panicle length was significantly higher in both mutant lines K2 (26.4 cm) and K4 (29.2 cm) in comparison with their origins K1 (23.1 cm) and K3 (26.3 cm), respectively. Days to heading and maturity were significantly different (p < 0.05) between mutant line (K4) and cultivar (K3); mutant lines took longer to reach heading and maturity stages. Plant length and tiller number per hill ranged from 108.5 to 114.1 cm and 11.1 to 13.7, respectively, with the highest value in K2. Panicle length was within the interval of 23.1 to 29.2 cm, and the longest was obtained in K4. Based on the heading and maturity behaviors, K4 and K3 were late and early maturity crops, respectively.

3.2. Yield and Its Components

Grain yield and its components are illustrated in Table 3. There were significant differences (p < 0.05) in 1000 grain weight, 1000 brown rice weight, and grain yield among mutant lines and cultivars. Panicle number per hill significantly differed between K3 and K4. The highest panicle number per hill, 1000 grain weight, 1000 brown rice weight, and grain yield were obtained in mutant lines rather than in their cultivars. Additionally, spikelet number per panicle and repined ratio were higher in mutant lines, and 1000 husk weight was greater in the cultivars but did not differ statistically.
Panicle number per hill, spikelet number per panicle, and repined ratio, respectively, ranged from 9.3 to 11.1, 127.7 to 148.6, and 83.4% to 90.0%. The weights of 1000 grain, 1000 brown rice, and 1000 husk ranged from 22.0 to 24.1 g, 18.0 to 21.3 g, and 2.6 to 4.0 g, respectively. The greater grain yield (11.6 t/ha) was obtained in K4, a mutant line, and the lowest grain yield (7.7 t/ha) was recorded in K1, a cultivar.

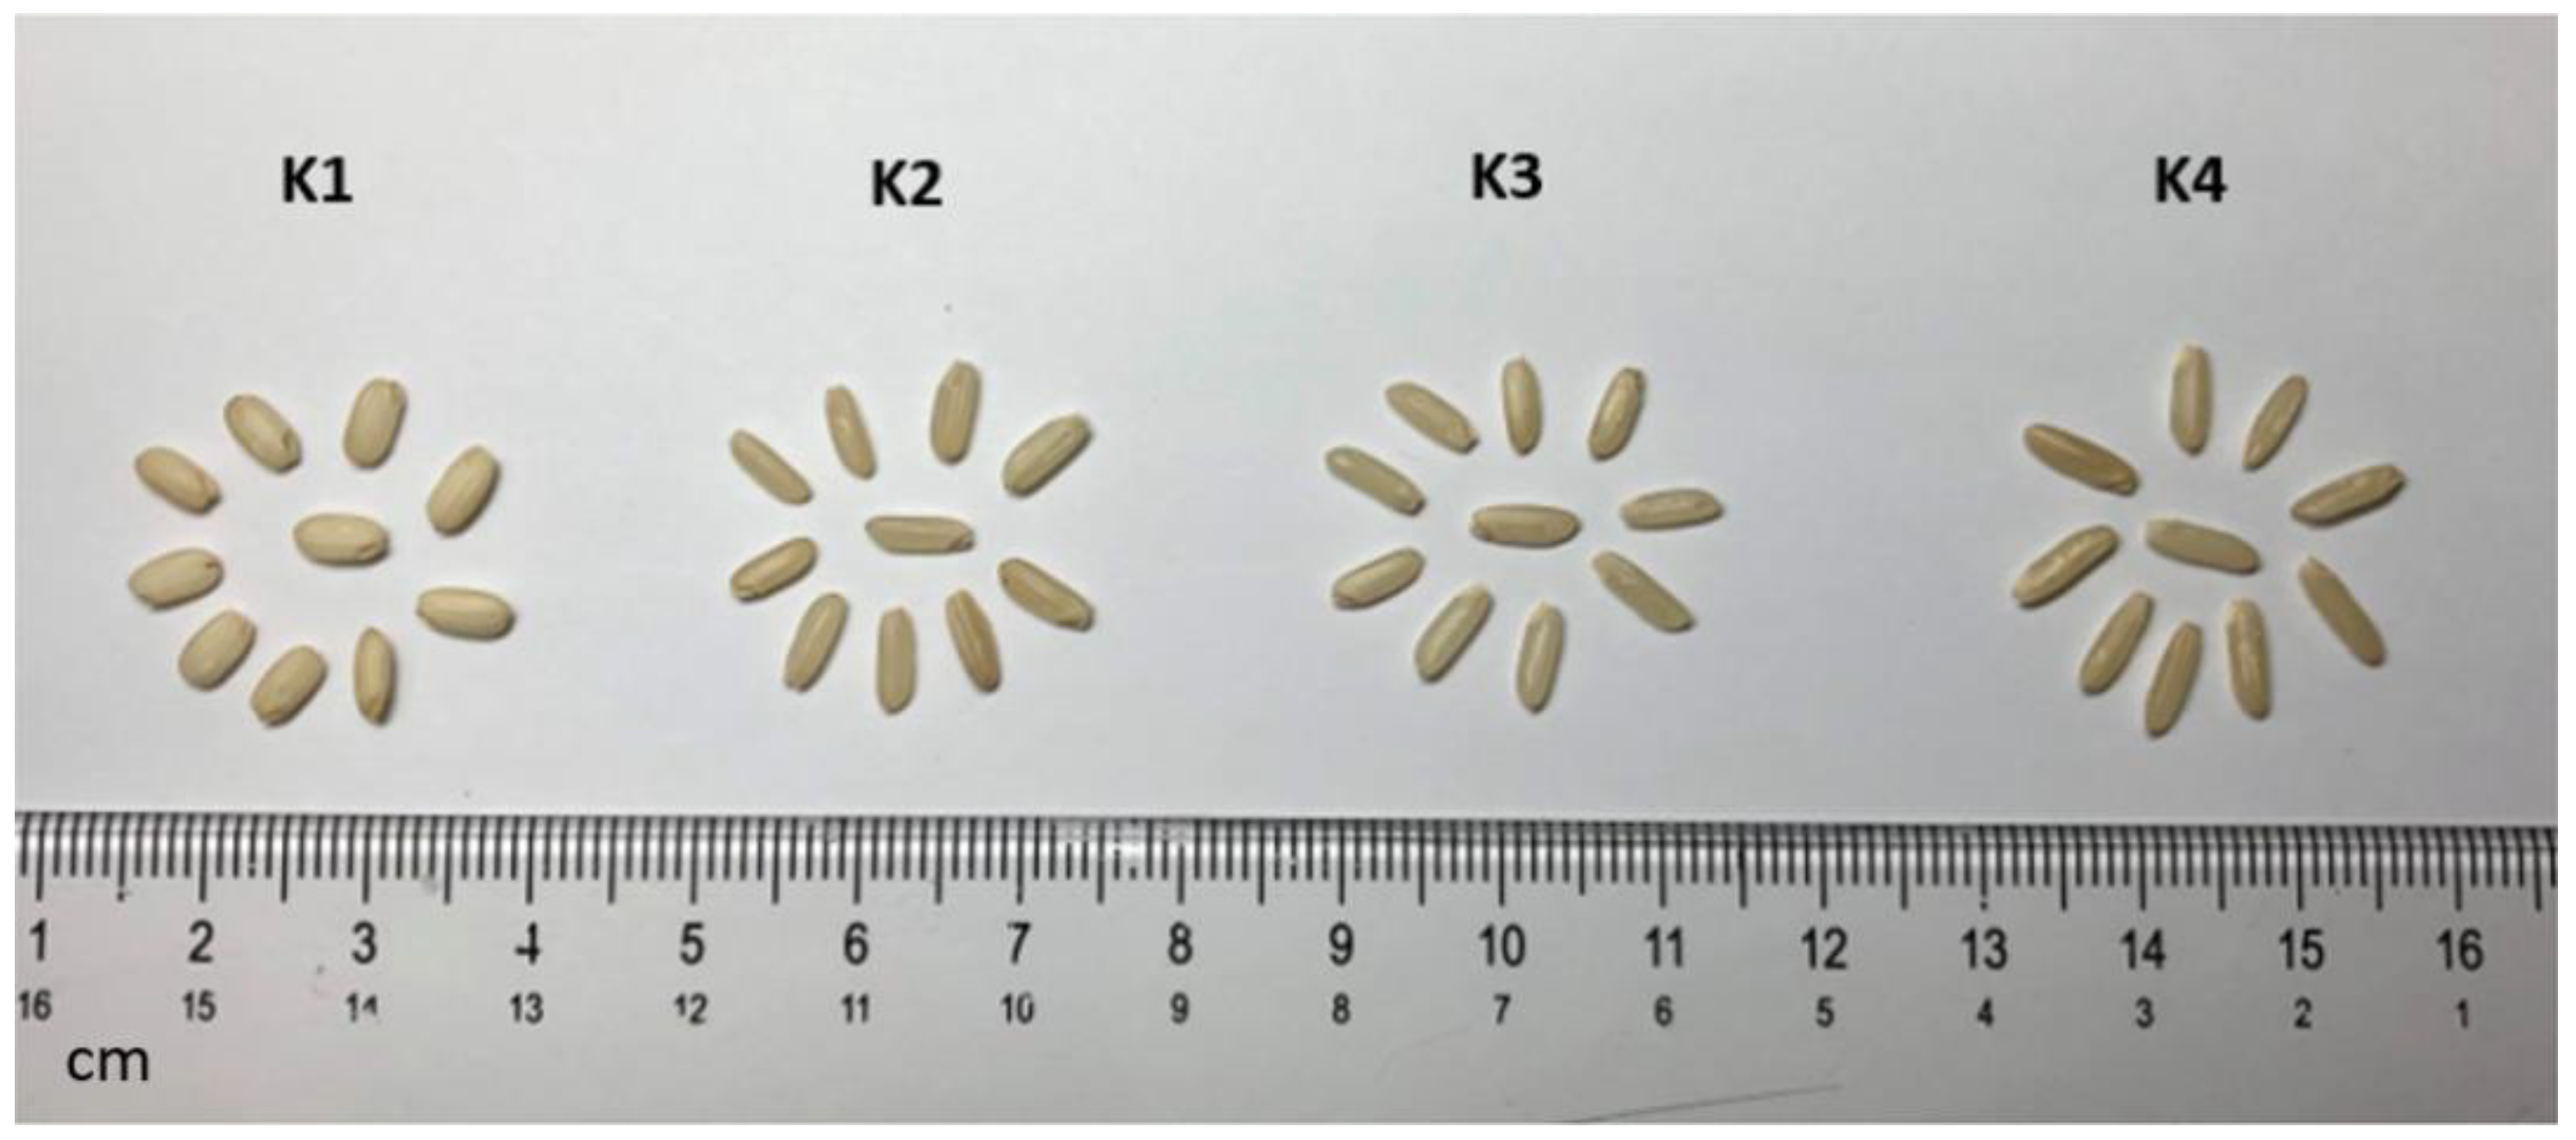
3.3. Physicochemical Properties and Appearance

Physicochemical properties, including amylose, protein, and lipid contents; taste score; and grain length, width, and length-to-width ratio are presented in Table 4. A significant difference (p < 0.05) among cultivars and mutant lines was observed in terms of amylose content. Taste score significantly differed between K1 and K2 as well as grain length between K3 and K4. Amylose, protein, and lipid contents ranged from 21.4% to 23.3%, 6.6% to 7.0%, and 7.7% to 10.7%, respectively. Lower amylose, protein, and lipid contents were recorded in mutant lines rather than in their cultivars, but the protein and lipid contents were not statistically significant. Taste score extended from 67.7 to 73.7 (as reference), which was enhanced with the decrease in amylose, protein, and lipid contents.
Grain length, grain width, and grain length-to-width ratio ranged from 6.2 to 7.1 mm, 2.1 to 2.5 mm, and 2.5 to 3.3 mm, respectively. Mutant line (K4) displayed an increased grain length as compared to cultivar (K3). K4 was recorded as the longest grain compared to other cultivars/mutant lines; however, K1 was observed as the thickest grain cultivar. Figure 1 shows the physical appearance of the cultivars and mutant lines. Rice grains produced by K1 were white in color, while the others were brown.

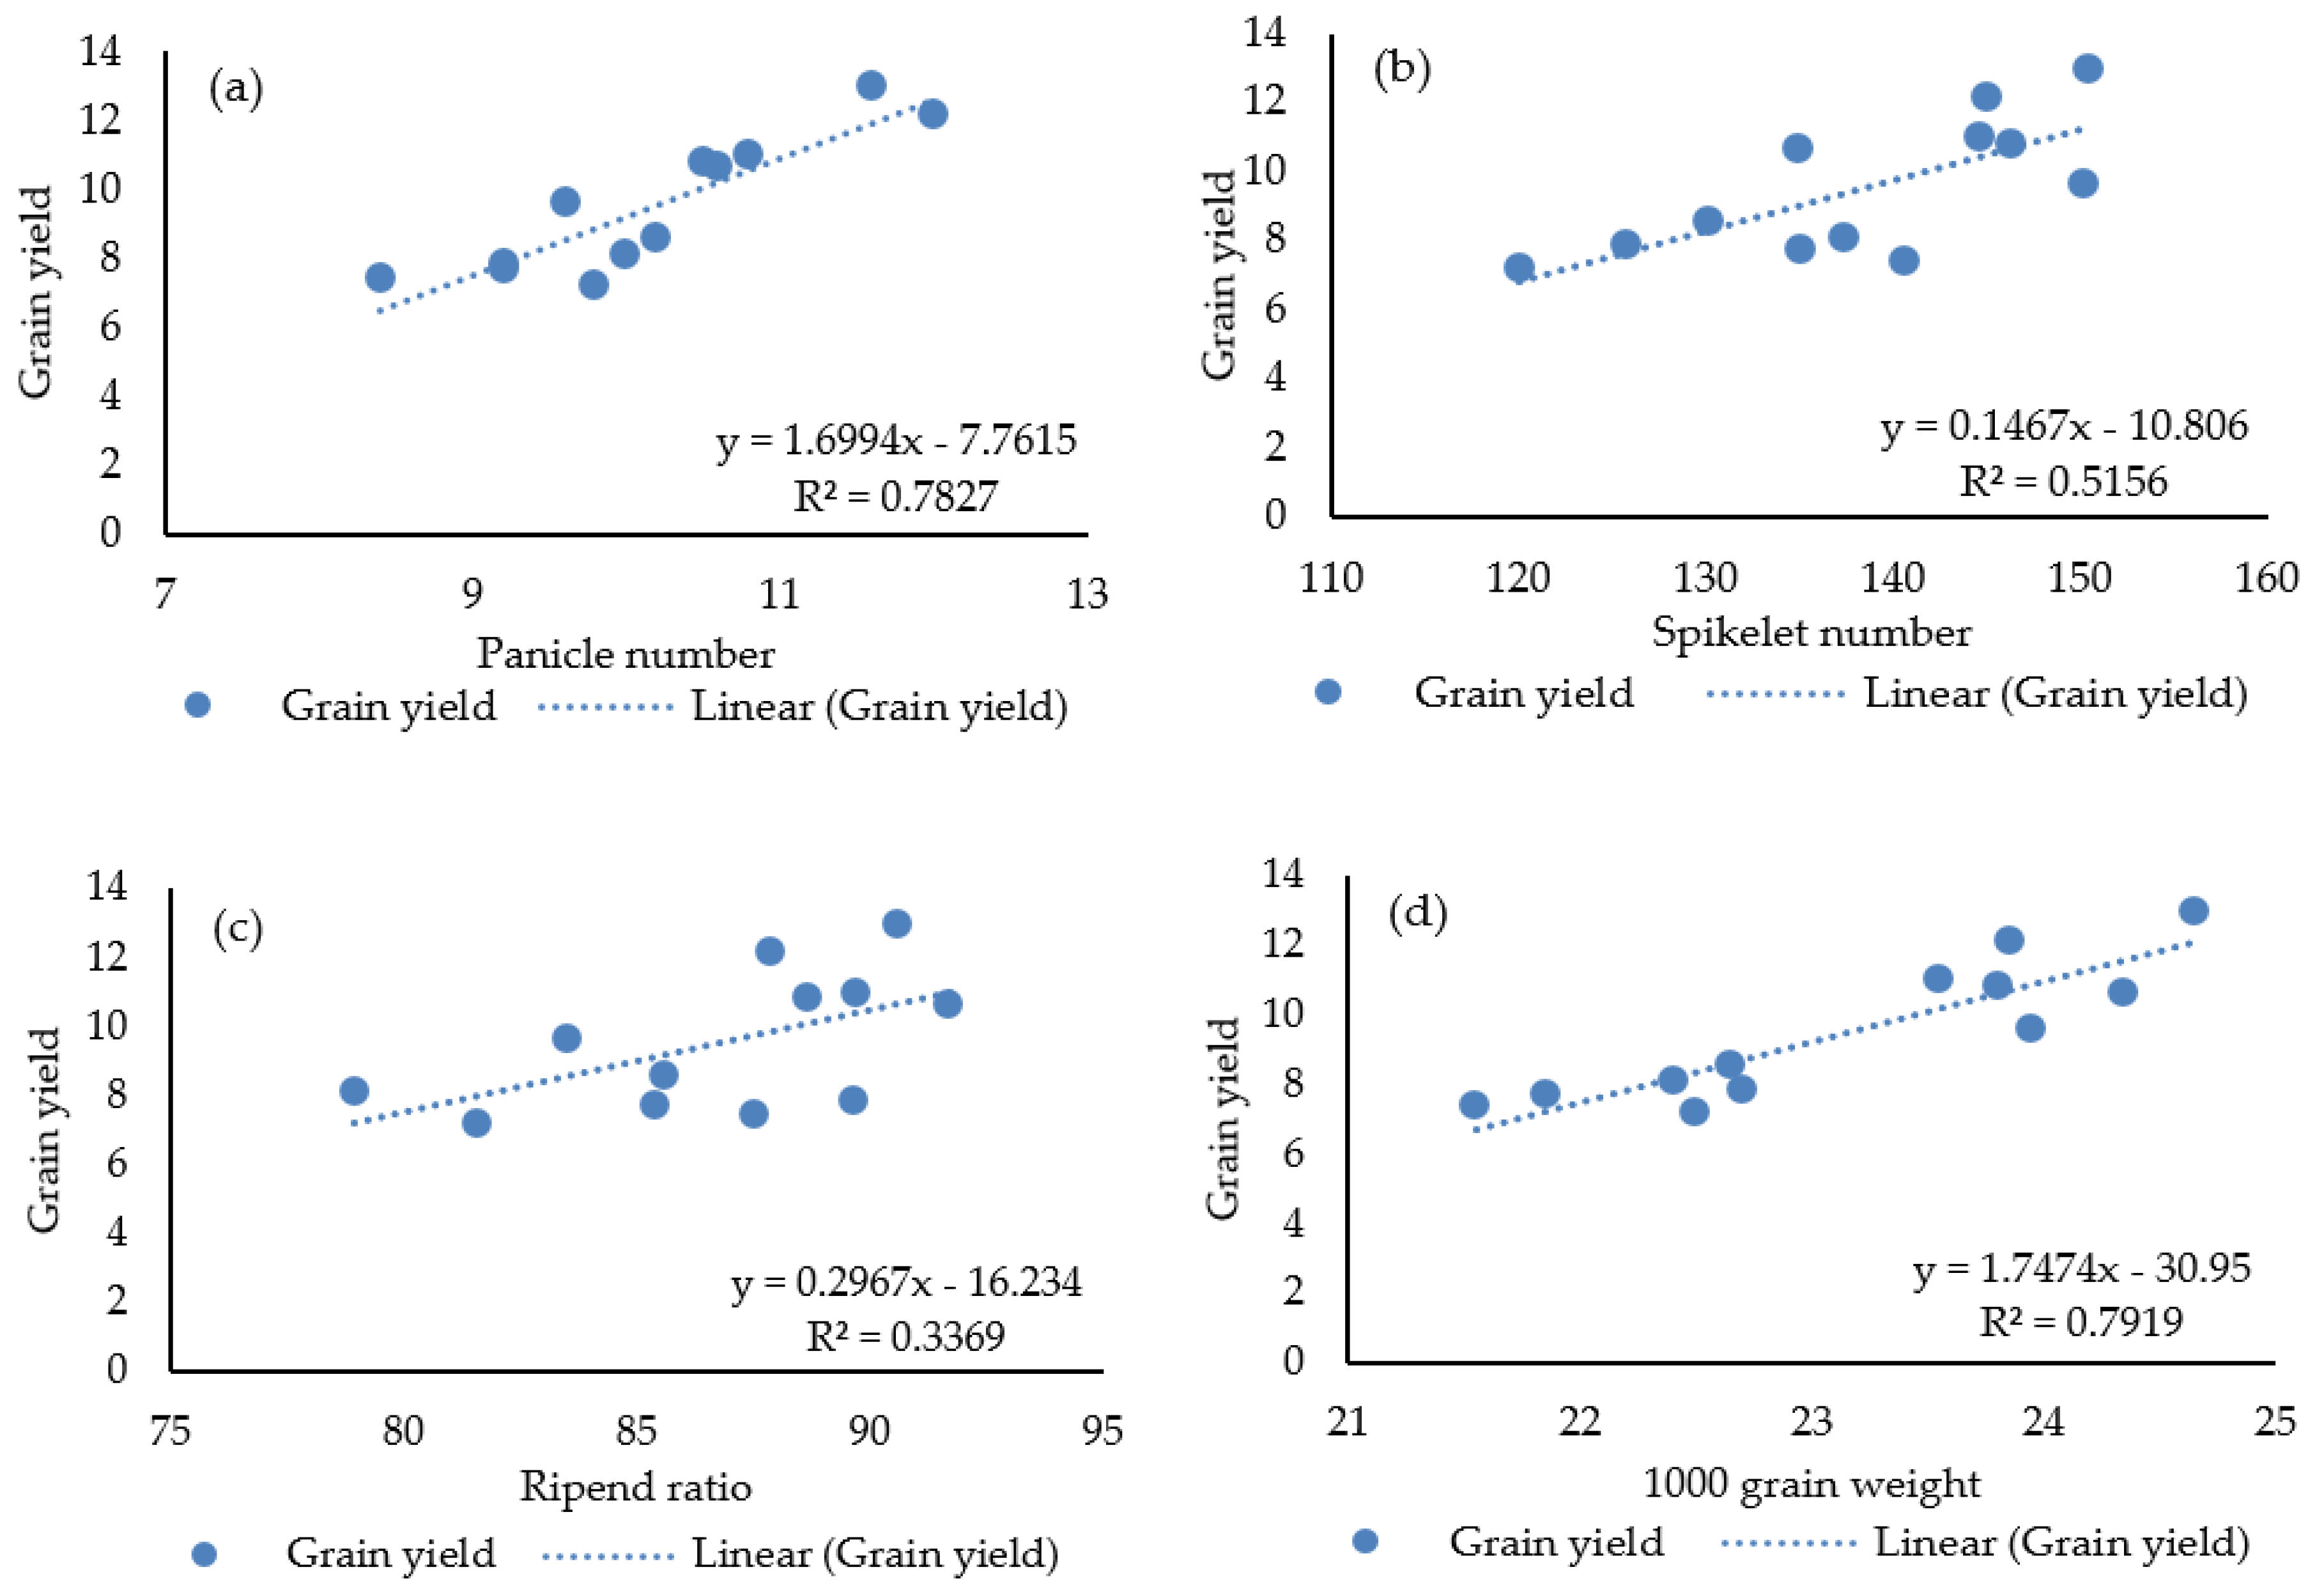
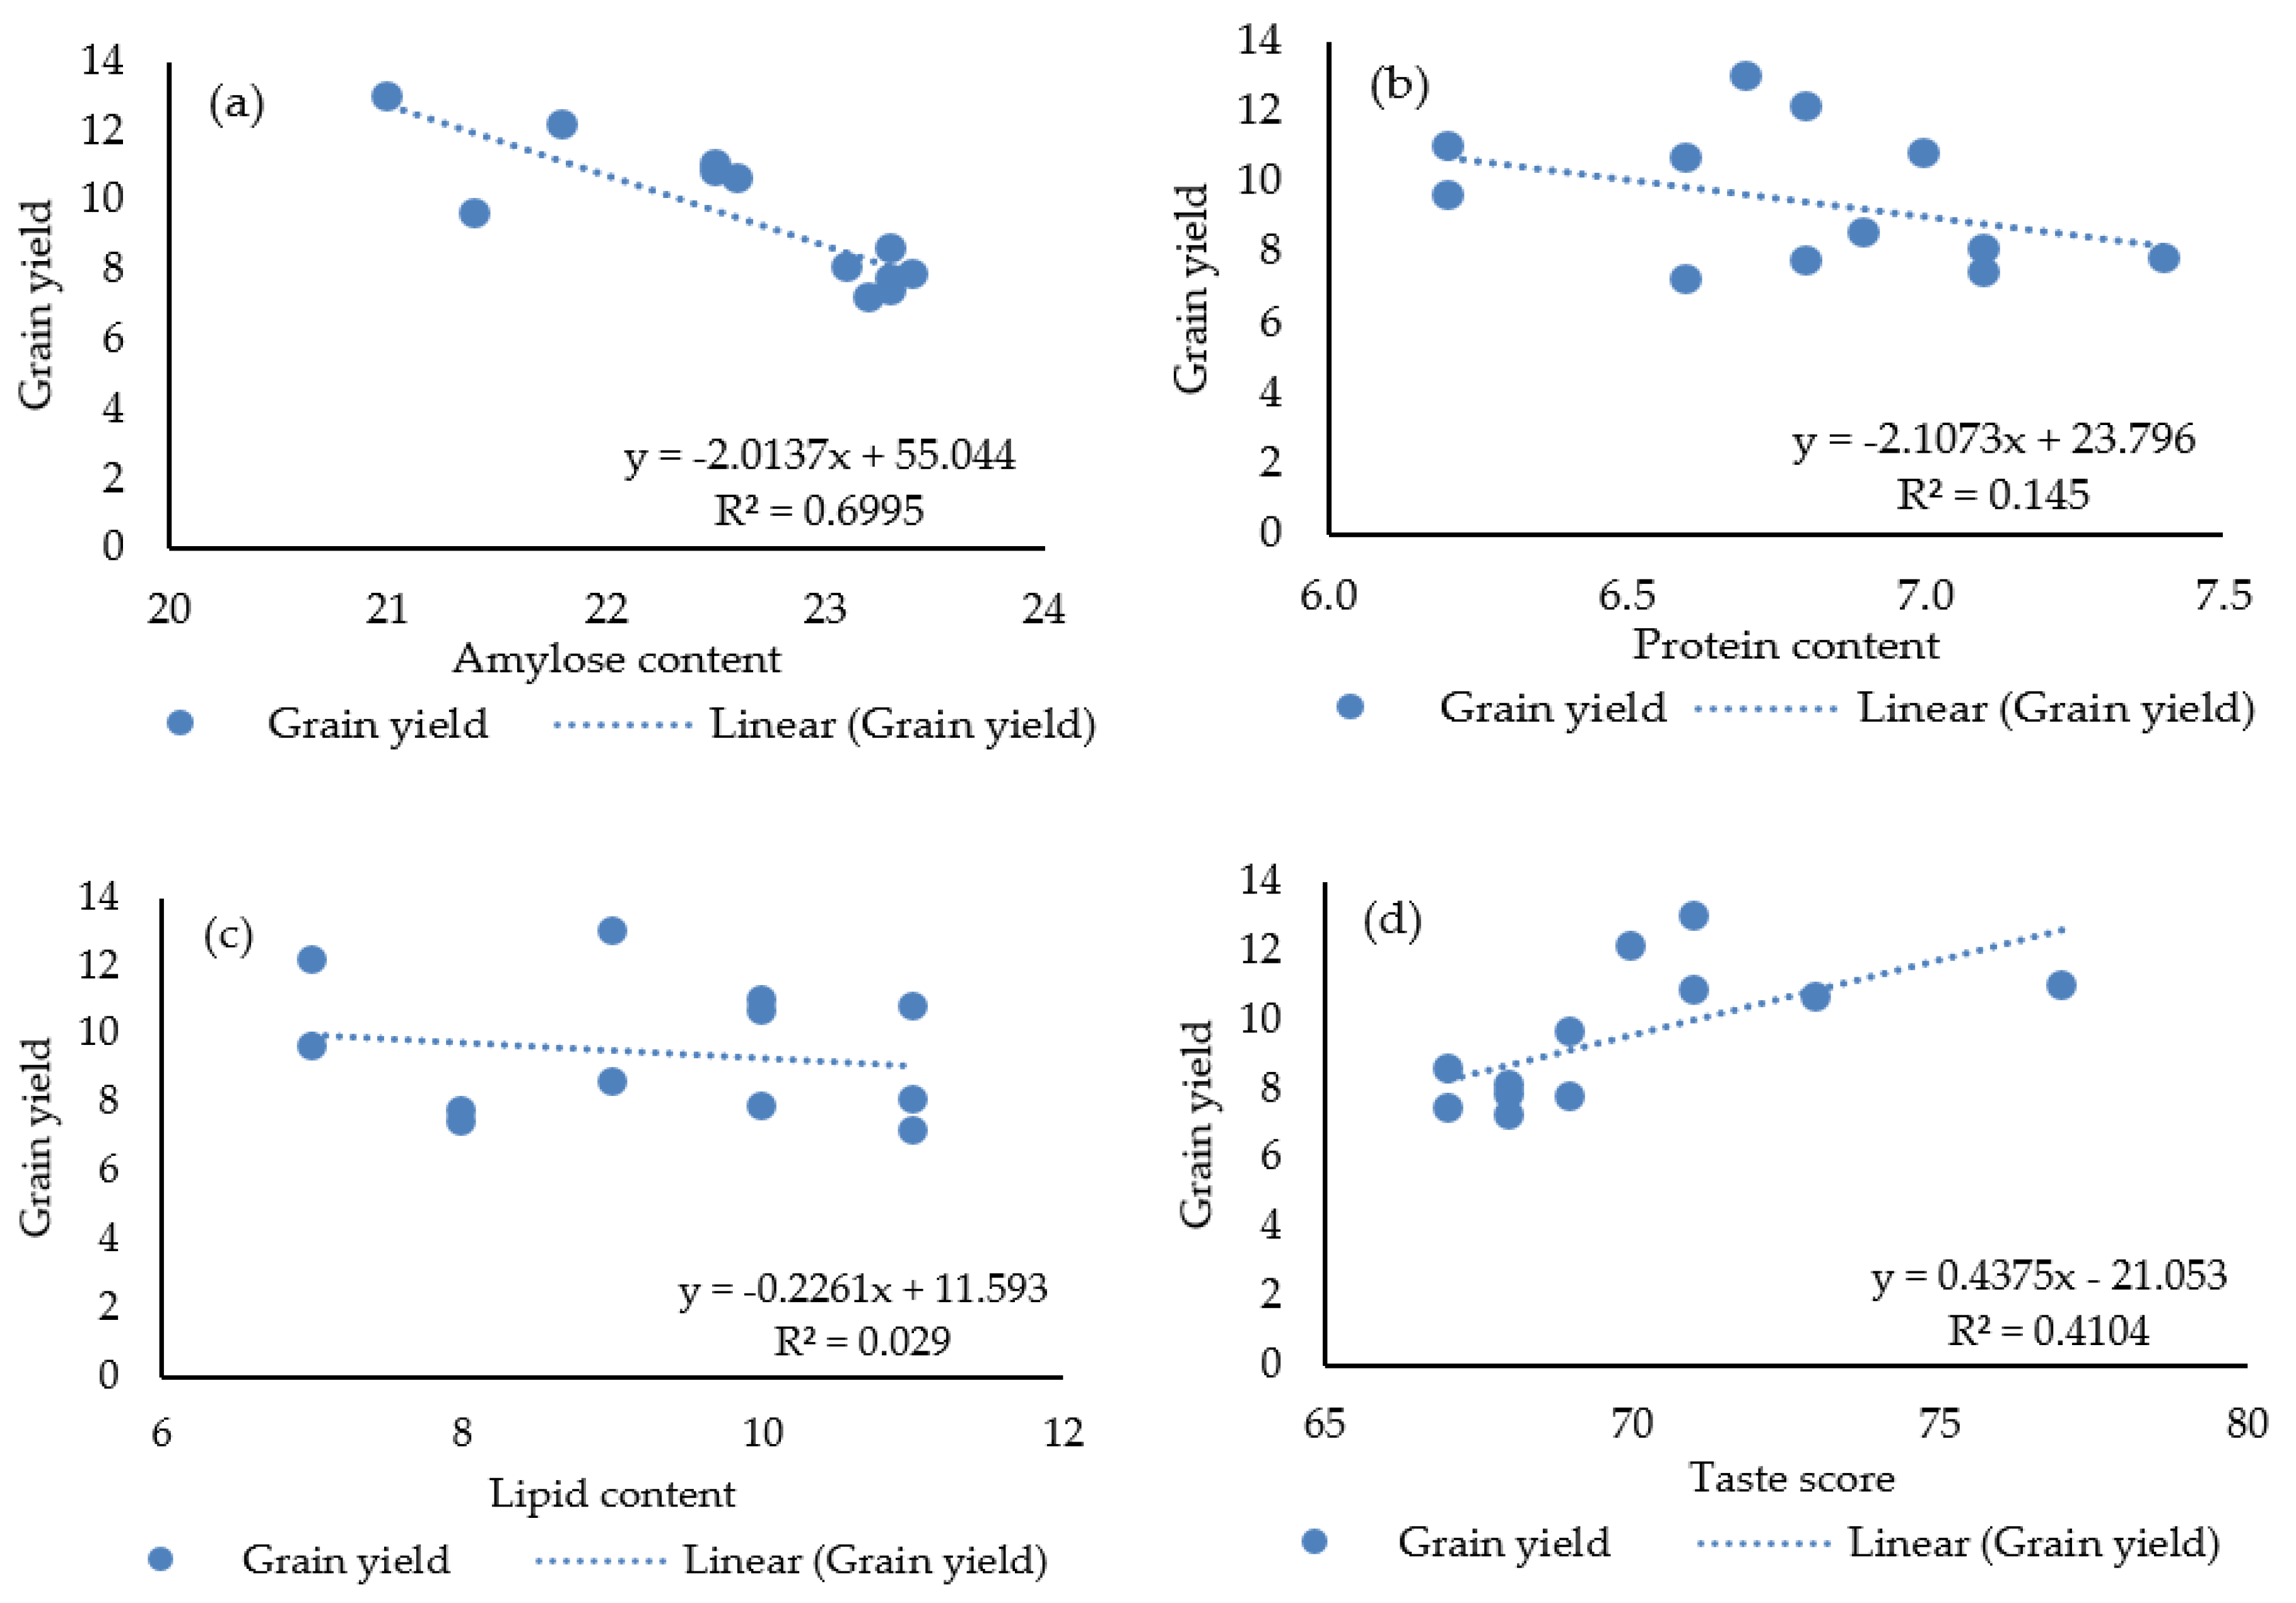
3.4. Relationship of Yield with Other Parameters

The correlation coefficient of grain yield with growth parameters, yield components, and physicochemical properties are illustrated in Table 5. There were significantly positive correlations among grain yield with tiller number per hill, panicle length, panicle number per hill, spikelet number per panicle, repined ratio, 1000 grain weight, and taste score. However, a significant, negative correlation was found between grain yield and amylose content. Furthermore, grain yield did not show any significant correlation with protein, lipid, grain length, and grain width in these cultivars/mutant lines. The correlation between grain yield with its components (panicle number, spikelet number, repined ratio, and 1000 grain weight) is demonstrated in Figure 2. The results show that there was a linear relation between grain yield and its components (r = 0.885, p = 0.001; r = 0.718, p = 0.009; r = 0.580, p = 0.048; and r = 0.890, p = 0.001), respectively. The results of correlation between grain yield with amylose content and taste score also exhibited a linear relation (r = −0.836, p = 0.001; and r = 0.641, p = 0.025) but a nonlinear correlation with protein and lipid contents (r = −0.381, p = 0.222; and r = −0.170, p = 0.597) see Figure 3.

4. Discussion

Genotypic properties play a dominant role in crop production. Manipulation of genetic sources is an option toward meeting rising food demand [19]. Mutation technology modifies the genotypic mechanism of plants through the alteration of select genes [17]. Such changes cause variation in phenotypic performances and productivity of crops [17,18]. Variations in rice grain yield and its quality are largely dependent on genetic and environmental factors [20]. In this study, MNU mutation showed a wide variation in growth, yield, and physicochemical properties of rice.
Growth attributes, including plant length, tiller number, and panicle length, were varied among cultivars and mutant lines. Plant length largely depends on the length of internodes [21] and the application of nitrogenous fertilizer [22], which varies based on genetic differences between varieties and environmental conditions [23]. On the other hand, increased plant length is often associated with stress responses such as light and shading [24]; therefore, further observations on the expressions of genes and gene clusters in determining the plant length should be done. Simultaneously, experiments with other environmental stresses should be carried out to confirm responsive levels between mutant lines and the corresponding cultivars. Tiller number is the most important factor for panicle formation and development in rice plants [25] and is a major determinant of grain yield [26]. Laza et al. [27] reported that rice varieties with long and intermediate panicle sizes produced greater grain yields than the varieties with small panicles. Thus, mutant lines produced high yields compared to the original cultivars.
An increase or decrease in the vegetative period of rice plants can affect yield and its components. Kasim et al. [28] found that mutations can reduce plant age by shortening the plant heading and maturity times. On the contrary, the present study showed that mutant line K4 matured later than the original cultivar K3, whereas there was no change between K2 and K1. The results suggested that the mutation by MNU might elongate the maturity period of normal rice (K3) rather than sticky rice (K1), but grain yields of both rice types increased. Previous studies also reported that late-maturity varieties contribute to higher biomass production and accumulation of photosynthates [17]. As vegetative growth of mutant lines was favorable and had extensive root visibility, this situation might lead mutant lines to take advantage of soil nutrients and applied fertilizers, consequently postponing heading and maturity stages, as reported by Ali et al. [29], who stated that excessive nutrients tend to delay heading and maturity stages. On the other hand, shortened vegetative growth in the selected cultivars may lead to decreased spikelet number per panicle, repined ratio, 1000 grain weight, and grain yield. Similar results were reported by Vergara et al. [30]. These influences might be determined by genetic backgrounds of varieties and their responses to various environmental conditions.
Yield components are the main factors affecting grain yield [31]. Duan et al. [32] stated that panicle, spikelet, repined ratio, and 1000 grain weight were the most important traits and key enhancers of yield. In the present study, panicle number per hill, spikelet number per panicle, repined ratio, and 1000 grain weight were higher in mutant lines, which consequently resulted in increased grain yield, and is in line with previous studies [32]. Anh et al. [5] explained that full-grain weight is the key decider for grain yield; however, results of this study showed that all the yield components were responsible for grain yield production in both cultivars and mutant lines. Grain yield has a linear correlation with its components [31]; we also found a linear correlation between grain yield and its components, which is in line with the previous study.
Rice grain quality is determined by several physical and chemical characteristics; thus, a specific customer class might have special preferences [2,4,33]. Amylose, protein, and lipid contents are the main elements of the physicochemical quality of rice grain and should be considered as a crucial factor in rice breeding strategies [2,4,34]. These quality traits are largely affected by genotypic and environmental conditions [33]. The results of this study indicated that MNU mutation decreased the percentage of amylose content in the rice grain. Low amylose content in rice grain increases softness and stickiness, while higher amounts cause rice grain to become hard and easily breakable during the grain milling process [2,4,35]. It has been shown that high amylose, protein, and lipid contents decrease grain taste score; thus, the selected cultivars exhibited lower taste scores, and mutant lines showed a higher taste score. Protein and lipid contents are major indicators of the nutritional value of rice grain [20,31]. Zhou et al. [36] reported that rice grains with low amylose and protein contents are preferred in world markets.
Rice grain appearance, in terms of cooking and eating, mainly depends upon cultural differences and consumer preferences [33,37]. Physical traits including grain length, grain width, and grain length-to-width ratio are considerable elements of appearance [2,5]. Noori et al. [38] reported that grain length and width mostly depend on the cultivar genotype. In our study, the MNU mutation increased the grain length. It is reported that the grain appearance quality is associated with grain nutritional quality [5,39]. The results of this study proved that MNU mutation can increase grain yield and produce quality grains. Hence, the MNU mutation approach may be used to support the production of high-quality rice grain as well as help developing countries to increase their productivity by releasing new cultivars within a short period of time.

5. Conclusions

The cultivated area for rice production has remained the same; whereas, rice demand is rising. Therefore, enhancement of rice yield per unit area is required. High yields and stable performances of new rice cultivars under different environments are key factors for sustainable rice production. Determination of the interaction between genotypic and environmental traits is an effective and stable approach to rice productivity. Released varieties by MNU mutation showed improved growth parameters, yield potential, and physicochemical properties of the F2 generation compared to their parents. Further examination on the subsequent generation from F3 should be conducted to select the elite rice lines with improved yield and quality from the MNU mutation.

Author Contributions

T.D.K. and T.D.D. provided seeds of the rice cultivars (K1–K4). K.K. and T.D.X. assumed the idea and wrote the manuscript. K.K. and I.K.W. conducted the experiment and implemented measurements. T.D.X., H.-D.T., and N.V.Q. revised the manuscript.

Funding

The research received no external funding.

Acknowledgments

The authors appreciate the Japan International Cooperation Agency for providing Kifayatullah Kakar a scholarship. The help of Breana Venneman is appreciated for assistance with the manuscript.

Conflicts of Interest

The authors declare no conflicts of interest and approved the final version of the manuscript.

References

  1. Kakar, K.; Xuan, T.D.; Haqani, M.I.; Rayee, R.; Wafa, I.K.; Abdiani, S.; Tran, H.D. Current situation and sustainable development for rice cultivation and production in Afghanistan. Agriculture 2019, 9, 49. [Google Scholar] [CrossRef]
  2. Kakar, K.; Xuan, T.D.; Abdiani, S.; Wafa, I.K.; Noori, Z.; Attai, S.; Khanh, T.D.; Tran, H.-D. Morphological observation and correlation of growth and yield characteristics with grain quality and antioxidant activities in exotic rice varieties of Afghanistan. Agriculture 2019, 9, 167. [Google Scholar] [CrossRef]
  3. Wang, N.; Long, T.; Yao, W.; Xiong, L.; Zhang, Q.; Wu, C. Mutant resources for the functional analysis of the rice genome. Mol. Plant 2013, 6, 596–604. [Google Scholar] [CrossRef] [PubMed]
  4. Kakar, K.; Nitta, Y.; Asagi, N.; Komatsuzaki, M.; Shiotau, F.; Kokubo, T.; Xuan, T.D. Morphological analysis on comparison of organic and chemical fertilizers on grain quality of rice at different planting densities. Plant Prod. Sci. 2019, 22, 1–9. [Google Scholar] [CrossRef]
  5. Anh, T.T.T.; Xuan, T.D.; Huong, C.T.; Dat, T.D. Phenotypic performance of rice (Oryza sativa L.) populations induced by the MNU mutant on the adaptive characteristics. J. Horti. Plant Res. 2019, 5, 13–24. [Google Scholar] [CrossRef]
  6. Breseghello, F.; Coelho, A.S.G. Traditional and modern plant breeding methods with examples in rice (Oryza sativa L.). J. Agric. Food Chem. 2013, 61, 8277–8286. [Google Scholar] [CrossRef] [PubMed]
  7. Sikora, P.; Chawade, A.; Larsson, M.; Olsson, J.; Olsson, O. Mutagenesis as a tool in plant genetics, functional genomics, and breeding. Int. J. Plant Genom. 2011, 2011, 314829. [Google Scholar] [CrossRef]
  8. Bentota, A.P. Mutation improvement of rice variety BW-267-3 for red pericarp grains and lodging resistance. Plant Mutat. Rep. 2006, 1, 42–43. [Google Scholar]
  9. El-Degwy, I.S. Mutation induced genetic variability in rice (Oryza sativa L.). Int. J. Agric. Crop Sci. 2013, 5, 2789–2794. [Google Scholar]
  10. Shadakshari, Y.G.; Chandrappa, H.M.; Kulkarni, R.S.; Shashidhar, H.E. Induction of beneficial mutants in rice (Oryza sativa L.). Indian J. Genet. Plant Breed. 2001, 61, 274–276. [Google Scholar]
  11. Riaz, A.; Gul, A. Plant mutagenesis and crop improvement. In Crop Production and Global Environment Issues; Hakeem, K., Ed.; Springer: Cham, Switzerland, 2015; pp. 181–209. [Google Scholar]
  12. Ahloowalia, B.S.; Maluszynski, M.; Nichterlein, K. Global impact of mutation-derived varieties. Euphytica 2004, 135, 187–204. [Google Scholar] [CrossRef]
  13. Xuan, T.D.; Bach, D.T.; Dat, T.D. Involvement of phenolics, flavonoids, and phenolic acids in high yield characteristics of rice (Oryza sativa L.). Int. Lett. Nat. Sci. 2018, 68, 19–26. [Google Scholar] [CrossRef]
  14. Fang, J.; Zhou, Y.; Zou, D.; Ning, J. Breeding of high yield and high protein rice varieties by space mutation. Acta Agric. Nucleatae Sin. 2004, 18, 280–283. [Google Scholar]
  15. Penna, S.; Jain, S.M. Mutant resources and mutagenomics in crop plants. Emir. J. Food Agric. 2017, 29, 651–657. [Google Scholar]
  16. Lo, S.F.; Fan, M.J.; Hsing, Y.I.; Chen, L.J.; Chen, S.; Wen, I.C.; Liu, Y.L.; Chen, K.T.; Jiang, M.J.; Lin, M.K.; et al. Genetic resources offer efficient tools for rice functional genomics research. Plant Cell Environ. 2016, 39, 998–1013. [Google Scholar] [CrossRef] [PubMed]
  17. Xuan, T.D.; Anh, T.T.T.; Tran, H.D.; Khanh, T.D.; Dat, T.D. Mutation breeding of a N-methyl-N-nitrosourea (MNU)-induced rice (Oryza sativa L. ssp. Indica) population for the yield attributing traits. Sustainability 2019, 11, 1062. [Google Scholar] [CrossRef]
  18. Anh, T.T.T.; Khanh, T.D.; Dat, T.D.; Xuan, T.D. Identification of phenotypic variation and genetic diversity in rice (Oryza sativa L.) mutants. Agriculture 2018, 8, 30. [Google Scholar] [CrossRef]
  19. Hussain, S.; Fujii, T.; McGoey, S.; Yamada, M.; Ramzan, M.; Akmal, M. Evaluation of different rice varieties for growth and yield characteristics. J. Anim. Plant Sci. 2014, 24, 1504–1510. [Google Scholar]
  20. Singh, N.; Sodhi, N.S.; Kaur, M.; Saxena, S.K. Physico-chemical, morphological, thermal, cooking and textural properties of chalky and translucent rice kernels. Food Chem. 2003, 82, 433–439. [Google Scholar] [CrossRef]
  21. Ashrafuzzaman, M.; Islam, M.R.; Ismail, M.R.; Shahidullah, S.M.; Hanafi, M.M. Evaluation of six aromatic rice varieties for yield and yield contributing characters. Int. J. Agric. Biol. 2009, 11, 616–620. [Google Scholar]
  22. Sultana, S.; Ali, M.Y. Effect of different nitrogen levels on the yield performance of aromatic rice varieties. Bull. Inst. Trop. Agric. Kyushu Univ. 2014, 37, 47–56. [Google Scholar]
  23. Kanegana, M.Z.; Kargbo, A.M. Effect of Nitrogen Topdressing at Different Growth Stages on Rice Plant Growth, Yield and Yield Components; Report on Experiments in Rice Cultivation Techniques Development Course; Japan Int. Coop. Agency: Tsukuba, Japan, 2011; pp. 43–45. [Google Scholar]
  24. Feng, L.Y.; Raza, M.A.; Li, Z.C.; Chen, Y.; Khalid, M.H.B.; Du, J.; Liu, W.; Wu, X.; Song, C.; Yu, L.; et al. The influence of light intensity and leaf movement on photosynthesis characteristics and carbon balance of soybean. Front. Plant Sci. 2019, 9, 1952. [Google Scholar] [CrossRef] [PubMed]
  25. Badshah, M.A.; Naimei, T.; Zou, Y.; Ibrahim, M.; Wang, K. Yield and tillering response of super hybrid rice Liangyoupeijiu to tillage and establishment methods. Crop J. 2014, 2, 79–86. [Google Scholar] [CrossRef]
  26. Champagne, E.T. Rice: Chemistry and Technology, 3rd ed.; American Association of Cereal Chemists: Eagan, MN, USA, 2004; p. 640. [Google Scholar]
  27. Laza, M.R.C.; Peng, S.; Akita, S.; Saka, H. Effect of panicle size on grain yield of IRRI-released indica rice cultivars in the wet season. Plant Prod. Sci. 2004, 7, 271–276. [Google Scholar] [CrossRef]
  28. Kasim, N.; Sjahril, R.; Riadi, M.; Arbie, F. The phenotype performance of M3 red rice mutant (Oryza sativa L.). IOP Conf. Ser. Earth Environ. Sci. 2018, 157, 012047. [Google Scholar] [CrossRef]
  29. Ali, K.; Arif, M.; Shah, S.; Hussain, Z.; Ali, A.; Munir, S.; Sher, H. Effect of organic and inorganic nutrients sources on phenology and growth of wheat. Pak. J. Bot. 2015, 47, 2215–2222. [Google Scholar]
  30. Vergara, B.S.; Lilis, R.; Tanaka, A. Relationship between length of growing period and yield of rice plants under a limited nitrogen supply. Soil Sci. Plant Nutr. 1964, 10, 15–21. [Google Scholar] [CrossRef]
  31. Abacar, J.D.; Lin, Z.; Zhang, X.; Ding, C.; She, T.; Liu, Z.; Wang, S.; Ding, Y. Variation in yield and physicochemical quality traits among mutants of Japonica rice cultivar Wuyujing 3. Rice Sci. 2016, 23, 33–41. [Google Scholar] [CrossRef]
  32. Duan, L.; Huang, C.; Chen, G.; Xiong, L.; Liu, Q.; Yang, W. Determination of rice panicle numbers during heading by multi-angle imaging. Crop J. 2015, 3, 211–219. [Google Scholar] [CrossRef] [Green Version]
  33. Noori, Z.; Mujadidi, M.W.; Amin, M.W. Physicochemical properties and morphological observations of selected local rice varieties in northern Afghanistan. Int. J. Agric. Environ. Food Sci. 2018, 2, 99–103. [Google Scholar] [CrossRef]
  34. Kaur, P.; Pal, P.; Virdi, A.S.; Kaur, A.; Singh, N.; Mahajan, G. Protein and starch characteristics of milled rice from different cultivars affected by transplantation date. J. Food Sci. Technol. 2016, 53, 3186–3196. [Google Scholar] [CrossRef] [Green Version]
  35. Juliano, B.O.; Villareal, C.P. Grain Quality Evaluation of World Rices; International Rice Research Institute: Manila, Philippines, 1993. [Google Scholar]
  36. Zhou, Z.; Robards, K.; Helliwell, S.; Blanchard, C. Composition and functional properties of rice. Int. J. Food Sci. Technol. 2002, 37, 849–868. [Google Scholar] [CrossRef]
  37. Qiao, J.; Liu, Z.; Deng, S.; Ning, H.; Yang, X.; Lin, Z.; Li, G.; Wang, Q.; Wang, S.; Ding, Y. Occurrence of perfect and imperfect grains of six japonica rice cultivars as affected by nitrogen fertilization. Plant Soil 2011, 349, 191–202. [Google Scholar] [CrossRef]
  38. Noori, Z.; Kakar, K.; Fujii, T.; Ji, B. Growth and yield characteristics of upland rice cultivar NERICA-4 grown under paddy field condition. Int. J. Agron. Agric. Res. 2017, 10, 59–68. [Google Scholar]
  39. Xu, Z.; Chen, W.; Ma, D.; Lu, Y.; Zhou, S.; Liu, L. Correlations between rice grain shapes and main qualitative characteristics. Zuo Wu Xue Bao 2004, 30, 894–900. [Google Scholar]
Figure 1. Appearance of cultivars and mutant lines.
Agriculture 09 00212 g001
Figure 2. The correlation of grain yield with panicle number, spikelet number, ripened ratio, and 1000 grain weight. (a), Panicle number; (b), Spikelet number; (c), Ripened ratio; (d), 1000 grain weight.
Agriculture 09 00212 g002
Figure 3. The correlation of grain yield with amylose, protein, and lipid contents, and taste score. (a) Amylose content; (b) protein content; (c) lipid content; and (d) taste score.
Agriculture 09 00212 g003
Table 1. Origin and description of the selected cultivars and mutant lines.
CodeOriginDescriptionsStatus
K1DT84A traditional sticky rice with good quality in the north of VietnamCultivar
K2Mutated DT84F2 (self-pollination from the mutated DT84 F1)Mutant line
K3Q5A commercial rice cultivar with good quality in the north of VietnamCultivar
K4Mutated Q5F2 (self-pollination from the mutated Q5 F1)Mutant line
Cultivars and mutant lines were subtype Indica and provided by Khai Xuan International Co. Ltd., and Agricultural Genetic Institute, Hanoi, Vietnam.
Table 2. Description of growth parameters among cultivars and mutant lines.
CodePlant Length (cm)Tiller Number per HillDays to HeadingDays to MaturityPanicle Length (cm)
K1113.4 ± 3.6 a12.1 ± 0.4 ab106.3 ± 0.6 b136.7 ± 1.1 b23.1 ± 0.5 c
K2114.1 ± 5.6 a13.7 ± 0.4 a107.6 ± 0.7 b138.2 ± 0.7 b26.4 ± 0.3 b
K3108.5 ± 3.1 a11.1 ± 1.1 b104.0 ± 2.6 b132.7 ± 2.3 c26.3 ± 0.2 b
K4109.5 ± 2.2 a12.5 ± 1.3 ab122.3 ± 1.1 a151.0 ± 1.0 a29.2 ± 0.6 a
Values are presented as mean ± standard deviation. Different letters in a column indicate significant differences at p < 0.05.
Table 3. Description of grain yield and its components among cultivars and mutant lines.
CodePanicle Number per HillSpikelet Number per PanicleRipened Ratio (%)1000 Grain Weight (g)1000 Brown Grain Weight (g)1000 Husk Weight (g)Grain Yield (t/ha)
K19.7 ± 0.4 ab127.7 ± 8.8 b83.4 ± 5.6 a22.5 ± 0.1 b19.2 ± 0.3 b3.3 ± 0.1 a7.7 ± 0.5 b
K210.6 ± 0.1 a142.0 ± 6.1 ab90.0 ± 1.5 a23.9 ± 0.4 a21.3 ± 0.2 a2.6 ± 0.2 a10.8 ± 0.2 a
K39.3 ± 0.9 b135.3 ± 5.2 ab86.2 ± 1.2 a22.0 ± 0.6 b18.0 ± 0.4 c4.0 ± 1.0 a7.9 ± 0.6 b
K411.1 ± 1.3 a148.6 ± 3.1 a87.3 ± 3.6 a24.1 ± 0.4 a21.1 ± 0.3 a3.0 ± 0.5 a11.6 ± 0.2 a
Values are presented as mean ± standard deviation. Different letters in a column indicate significant differences at p < 0.05.
Table 4. Description of physicochemical properties of rice grain among cultivars and mutant lines.
CodeAmylose (%)Protein (%)Lipid (%)Taste ScoreGrain Length (mm)Grain Width (mm)Grain Length/Width Ratio
K123.2 ± 0.1 a7.0 ± 0.4 a10.7 ± 0.6 a68.0 ± 0.0 b6.2 ± 0.3 b2.5 ± 0.1 a2.5 ± 0.0 b
K222.5 ± 0.1 b6.6 ± 0.4 a10.3 ± 0.6 a73.7 ± 3.0 a6.3 ± 0.1 b2.4 ± 0.1 a2.6 ± 0.1 b
K323.3 ± 0.0 a6.9 ± 0.1 a8.3 ± 0.6 b67.7 ± 1.1 b6.2 ± 0.1 b2.2 ± 0.2 a2.8 ± 0.4 ab
K421.4 ± 0.4 c6.6 ± 0.3 a7.7 ± 1.1 b70.0 ± 1.0 ab7.1 ± 0.4 a2.1 ± 0.0 a3.3 ± 0.2 a
Values are presented as mean ± standard deviation. Different letters in a column indicate significant differences at p < 0.05.
Table 5. The correlation coefficient of grain yield with growth parameters, yield components, and physicochemical properties among cultivars and mutant lines.
TNPLPNSNRRGWGYACPCLCTSGL
PL0.047
PN0.726 **0.437
SN0.1780.810 ***0.422
RR0.559 *0.3060.3280.280
GW0.658 *0.574 *0.779 **0.5540.500
GY0.685 **0.671 **0.885 ***0.718 **0.580 *0.890 ***
AC−0.330−0.807 ***−0.664 **−0.786 **−0.274−0.833 ***−0.836 ***
PC−0.242−0.553 *−0.320−0.373−0.018−0.476−0.3810.534
LC0.322−0.734 **−0.004−0.433−0.101−0.027−0.1700.3930.232
TS0.803 **0.2600.5280.4150.5490.597 *0.641 *−0.379−0.595 *0.180
GL−0.0030.707 **0.3600.587 *0.1150.5200.497−0.723 **−0.294−0.693 **0.013
GWD0.357−0.686 **−0.282−0.307−0.013−0.256−0.3020.4440.1950.574 *0.298−0.478
*, **, and *** indicate significant differences at p < 0.05, p < 0.01, and p < 0.001 probability levels. TN (tiller number), PL (panicle length), PN (panicle number), SN (spikelet number), RR (ripened ratio), GW (1000 grain weight), GY (grain yield), AC (amylose content), PC (protein content), LC (lipid content), TS (taste score), GL (grain length), and GWD (grain width).

