Article

Market Awareness and Participation for Cattle Farmers in the Kaonafatso ya Dikgomo (KyD) Scheme in KwaZulu-Natal Province, South Africa

1
Department of Risk and Vulnerability Science Centre, University of Fort Hare, Alice 5700, South Africa
2
Department of Agricultural Economics and Extension, University of Fort Hare, Alice 5700, South Africa
*
Author to whom correspondence should be addressed.
Agriculture 2019, 9(10), 215; https://doi.org/10.3390/agriculture9100215
Submission received: 6 August 2019 / Revised: 20 September 2019 / Accepted: 23 September 2019 / Published: 1 October 2019

Abstract

:
The objective of the study was to outline the determinants of market awareness and participation in the Kaonafatso ya Dikgomo (KyD) scheme in South Africa. The study utilised a cross-sectional survey of a randomly selected sample of 116 KyD farmers in KwaZulu-Natal Province. A Logit model was used to analyse the data. The results show that more farmers are aware of farmgate market channels, but however, they tended to utilise auction market channels. Furthermore, gender, marital status, educational level, employment status, farm income, source of income, herd size, labour and training were significant variables in the awareness and use of butcheries, auctions and farm gate markets. The study concludes that the scheme is particularly effective in influencing commercialisation through utilisation of more lucrative market channels such as auctions. Furthermore, socio-economic factors had a bearing on the awareness and use of marketing channels for smallholder farmers in the KyD scheme. Labour was particularly significant across butchery, auction and farm gate market channels. The study recommends that the scheme needs to improve awareness and use of market channels through utilisation of information platforms such as radio, television and direct communication though mobile phones. Furthermore, extension should assist farmers not only in awareness of markets, but also in the utilisation of those markets.

1. Introduction

Livestock production is significant in wealth creation and improving the livelihoods of rural poor households [1,2]. Cattle commercialisation increases production and quality, contributing to improved incomes. Market participation becomes a determining factor in the commercialisation of cattle by rural poor households [3]. Cattle herd size positively influence cattle market supply decisions [2]. Thus, agricultural market participation is associated with productivity, with empirical evidence showing that in Southern Africa, growth in herd size is required in shifting to commercial cattle farming systems [3]. Cattle production contributes between 25% and 30% per annum to South Africa’s national agricultural GDP [4]. Cattle are a major livelihood strategy for South Africa’s communal and emerging farmers, who are resource poor and own 40% of the herd size. [2]. Approximately 3 million subsistence as well as 240,000 small-scale farmers own 5.6 million cattle relative to 50,000 commercial farmers who own 8.2 million cattle [5].
Consumer preferences, changing lifestyle, globalisation, high population and income growth as well as urban migration in South Africa have been responsible for growth in livestock markets. This has availed opportunities for integrating smallholder farmers into the market economy [2]. The National Livestock Development Strategy supports smallholder and emerging farmers to be profitable and competitive through creation of an enabling policy environment and market development. The policy also endeavours to integrate sustainable rural development by focussing on equitable participation, training, research and development as well as investment in rural commercial and cooperative infrastructure [2]. Furthermore, in easing access to agricultural market infrastructure and information, commodity associations or groups have been advocated for, especially for livestock farmers in the agricultural marketing strategy. This has encouraged a range of livestock marketing channels, which include the traditional farmgate, butcheries, speculators, abattoirs and auctions. [2,4,6]. Various Livestock Development Programmes (LDPs) have been implemented in the endeavour to mainstream smallholder rural poor livestock keepers to participate in formal market economies and commercialize. In KwaZulu-Natal, it was reported that farmers in the Okhahlamba Local Cooperative (OLC) participated more in cattle marketing than those who were not partaking, and the members perceive this programme as the best solving challenges and barriers around cattle marketing [5]. In 2013, the National Agricultural Marketing Council (NAMC) cattle custom feeding program was initiated in the Eastern Cape Province where farmers are organised into marketing cooperatives. These groups are said to enhance farmers to partake in commercial cattle markets and also help farmers in creating awareness about the best possible markets to utilize [7]. The positive impact of Livestock Development Programmes (LDP) on marketing led to introduction of new schemes that enhance the same purpose in South African regions.
In recognition of the need to promote market participation and awareness in South Africa, the ARC has embarked on technology and information dissemination programmes, integrating production systems and scientific research for smallholder livestock producers. One of these programmes is known as the Kaonafatso ya Dikgomo (KyD) Scheme. With reference to ARC [8], the KyD scheme has registered more than 8300 smallholder livestock farmers on a national animal improvement database, called the Integrated Registration Genetic Information System (INTERGIS). One of the objectives of the Scheme is to improve market access and commercialization for small-scale cattle producers as well as keep accurate animal performance records for sustainable livestock improvement [9,10]. The evidence demonstrates that market off-takes for the participants in the Scheme have increased by 16%. Thus from a 33,000 head of cattle, there is significant harvest of more than 5000. [8]. However, there has been little documentation as to how the scheme has incorporated the determinants of market awareness and choice, in its formulation and implementation. The study seeks to outline the determinants of market awareness and participation in the KyD scheme.

1.1. Determinants of Market Channel Choice by Livestock Farmers

According to Mafukata [1], communal farmer market choice in developing countries is influenced by adoption of new marketing techniques and technologies, access to financial assistance and insurance, level of farm production. This has relegated farmers to informal market participation. Market preference for small holder farmers has been relegated to informal marketing channels relative to formal channels [11] Furthermore, determinants in selecting a particular market channel were dependent upon gender of a household head, education, herd size and access to market information [11]. Access to market information, training and transport, especially though government extension officers can support farmers in marketing their cattle. Senyolo et al. [12] found factors such as ownership of assets such as cattle, technological infrastructure such as radio and television as well as distance to market and means of transport also affecting the choice of a market beef cattle farmers use. In the Free State Province of South Africa, Bahta and Bauer [13] highlighted that trained farmers and those who live within shorter distances to market had more probabilities of participating in livestock markets.
Transactional costs also play a huge role in farmer choice of market as they are barriers to the efficient participation of farmers in different markets [4]. Remote location of most communal cattle producers coupled with poor road networks, result in high transport costs reducing farmer net income from the sale of their cattle. Transaction costs are influenced by the distances from the market. There is positive correlation between distance and transport costs. [4]. Other factors such as costly communication, time value and price fluctuations also result in late arrivals at markets to take advantage of opportunities. Lubungu et al. [14] noted that lack of quality and price variations within the standard beef sector limits commercialisation through substantive underinvestment in herd management. Moreover, transactional cost is enhanced by too many marketing charges combined with a lack of marketing centres. There are various information needs for communal farmers ranging from market opportunities, price, quantity, quality, demand as well as information on prevailing production techniques and market conditions [4]. However, access by smallholder farmers to radios, televisions, mobile phone network and internet facilities is still limited. Constrained interaction between extension officers and farmers due to poor communication infrastructures further enhances the limited transfer of information, skills and knowledge. Capacity building through education and training will further improve farmers, allowing for informed decision choices [4].

1.2. Theoretical and Conceptual Framework

Market utilisation can be explained through the expected utility theory. Utility refers to the attractiveness of an economic opportunity as well as its associated risk [15]. Expected utility theory combines two notions: personal utility function as well as the associated distribution function [16]. The theory highlights that if an individual believes an action has possible outcomes defined as x i , each with a utility U x i , an individual’s choice is based on his/her utility function combined with the subjective probability of each subjective outcome p x i , providing the following expected value of the utility:
i U x i p x i
Alternatively, if the same individual decides to choose x j , he/she chooses y i , then the new individual’s subjective utility would be:
i U y i p y i
The preference between the two decisions depends on the utility of each decision [17]. In relation to the current study, the individual makes decisions on the market channel to utilise, based from awareness of that market. These decisions are influenced by individual socio-economic and institutional circumstances. The KyD Scheme, in its modus operandi, provides activities and training in market access [18,19]. There are different market choices available and utilised by KyD Scheme farmers based on their demographic, socio-economic, institutional and farm bio-physical characteristics.

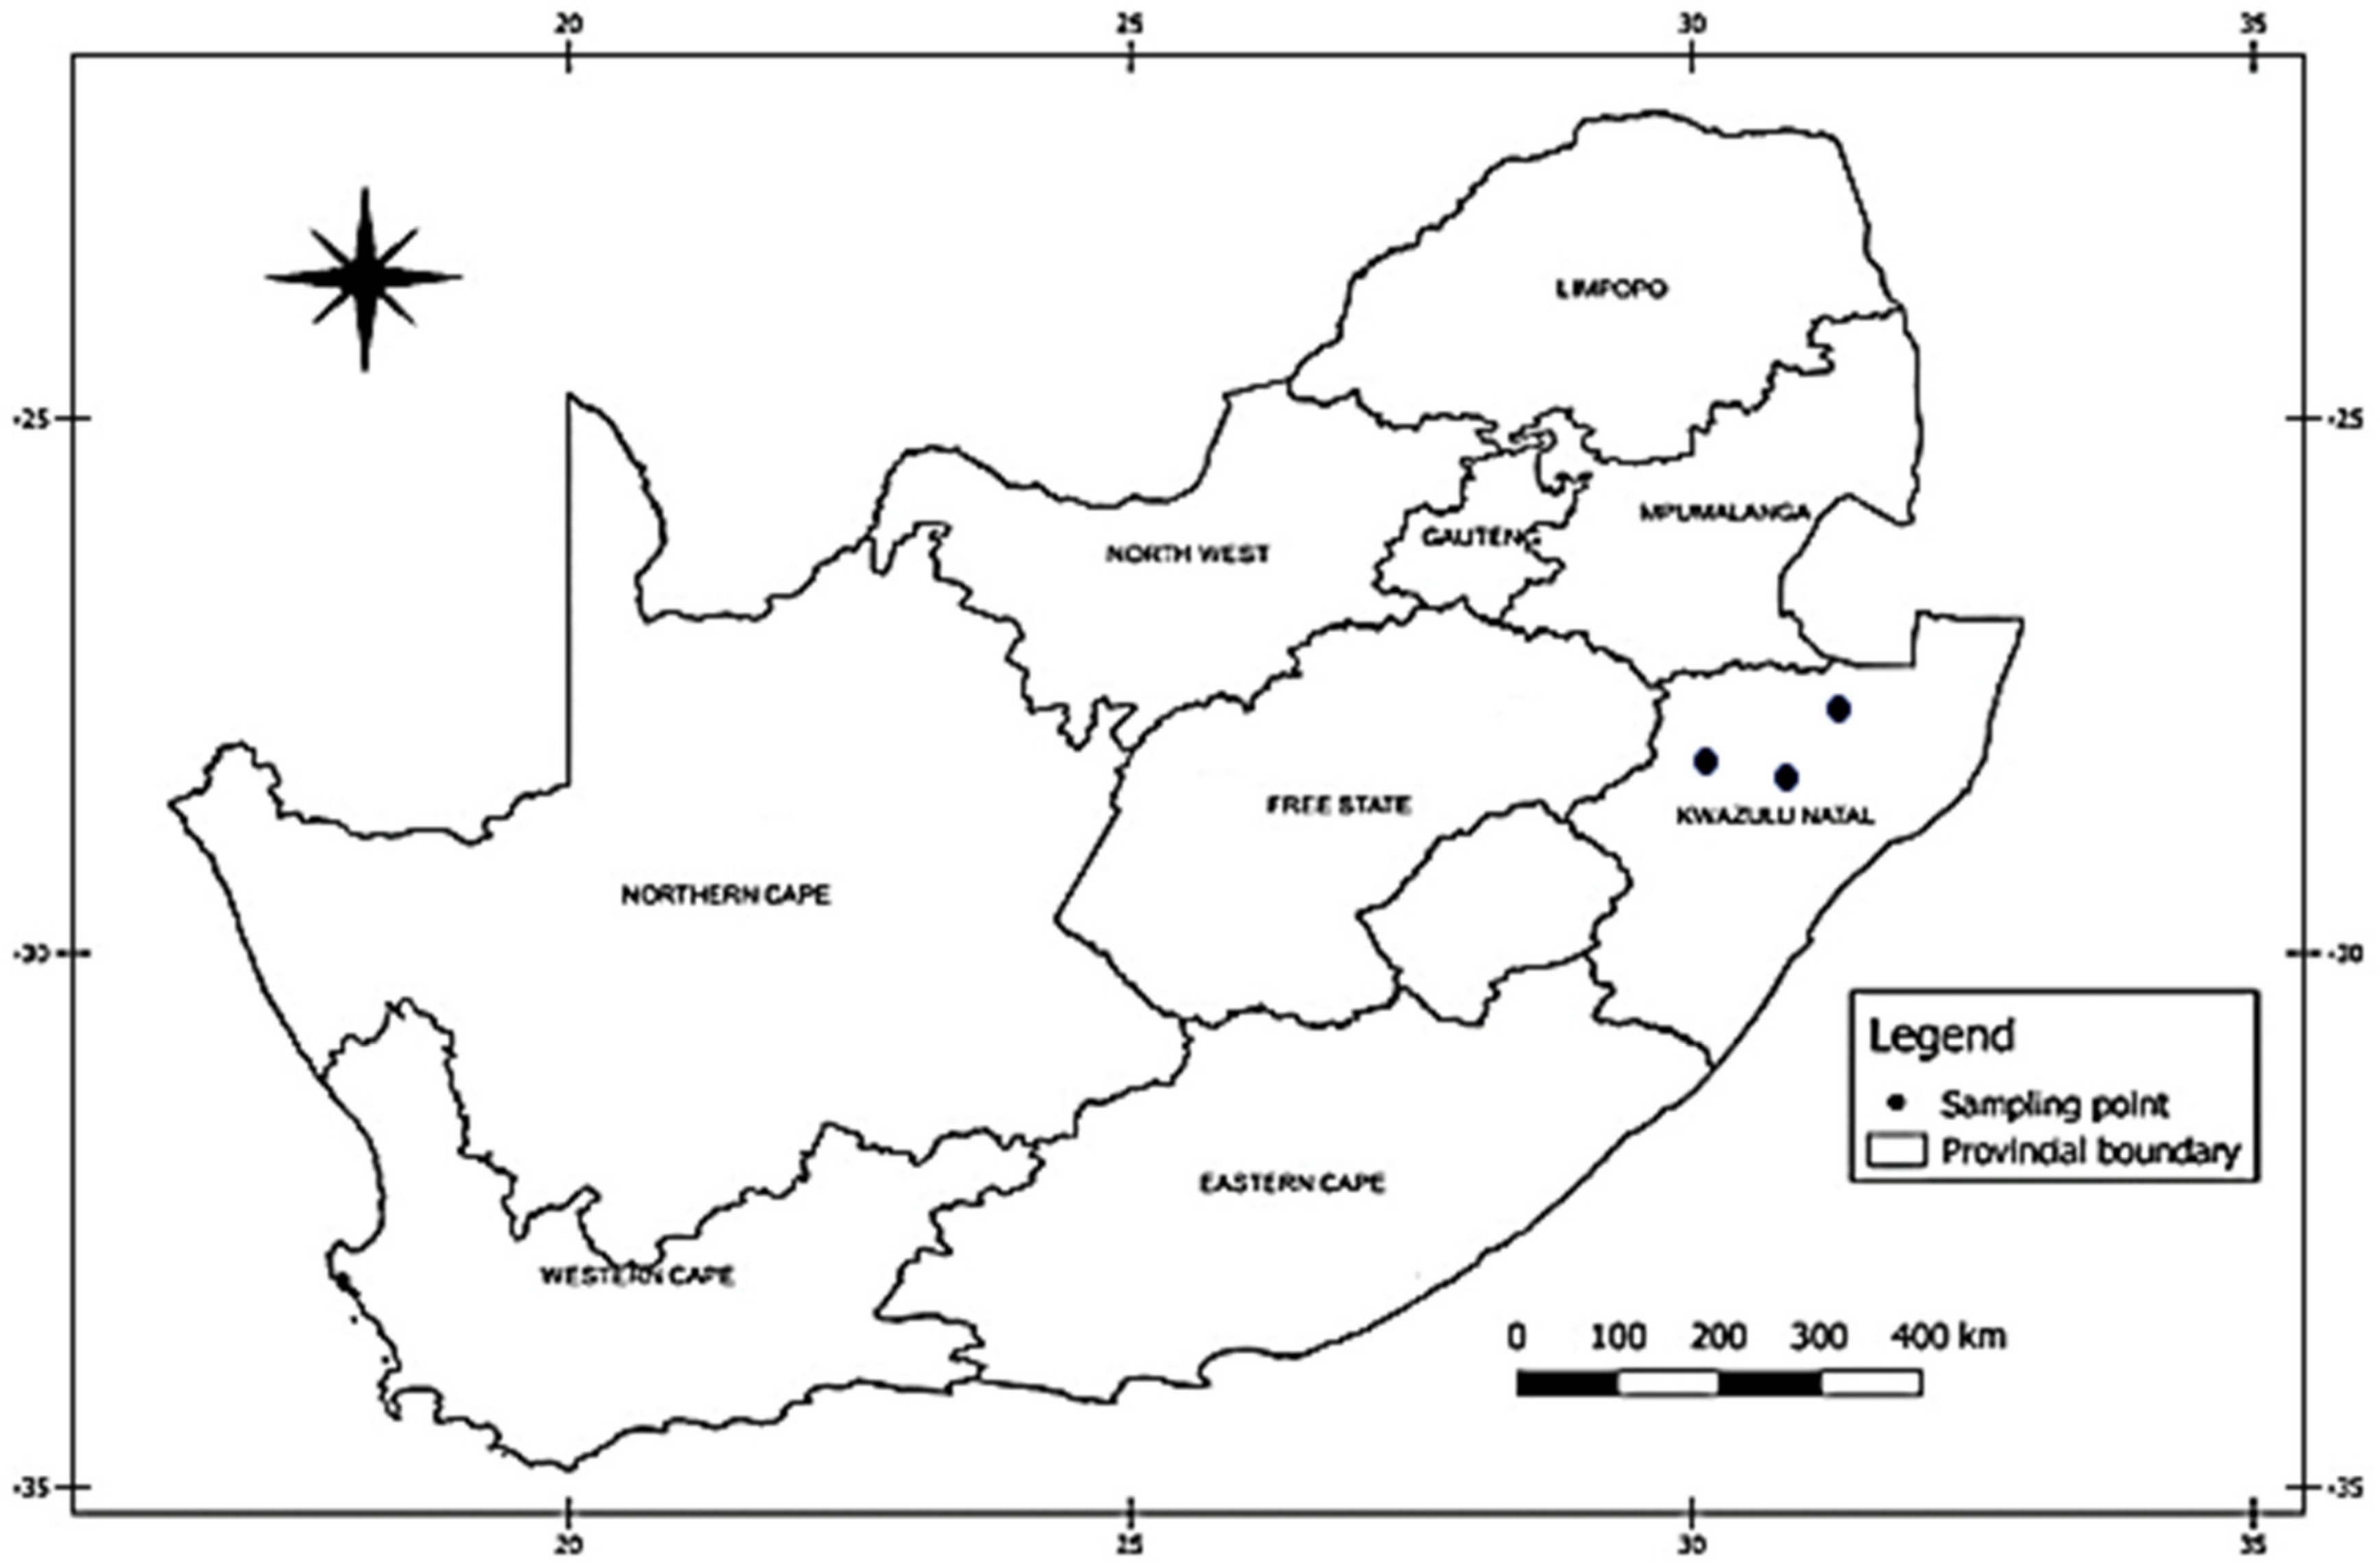
2. Materials and Methods

The study was carried out in KwaZulu-Natal, aiming at cattle farmers currently in the KyD Scheme (Figure 1). KwaZulu-Natal Province livestock farmers are predominately smallholder utilizing their livestock for traditional purposes, with low off-take attributable to lack of market system understanding [20]. The study made use of data collected from KyD Scheme participants from a sample of 116 respondents.
Multiple sampling methods were utilised. These included purposive sampling of KwaZulu-Natal Province. From a population of 220 a random sample of 116 respondents was obtained. The sampling frame was obtained from KyD scheme technicians in KwaZulu-Natal Province. The distribution of the sample is shown in Table 1.
The data collected, through a questionnaire, pertained to socio-economic demographic, institutional and farm biophysical factors as well as market choice decision. Logit model was used to identify factors influencing awareness to a market, as well as utilization of that market. The model is specified as follows:
log P y = 1 1 p y = 1 = β 0 + i = 1 n β i x i
Or as
p y = 1 1 P y = 1 = e β 0 + i = 1 n β i x i
where P is the probability that a farmer is aware a particular market, y = 1, or the farmer is not aware of a particular market, y = 0; Χi is the set of independent variables. The second expression P y = 1 1 P y = 1 represents the odds ratio with e β 0 + i = 1 n β i x i representing the marginal effects of xi on the odds. Another logit was performed with y = 0 being no utilisation of the market, and y = 1 being utilisation of the market. The explanatory variables and their expected signs are presented in Table 2. Thus, each farmer is either aware of a market or not, as well utilises a market or does not. The awareness and utilisation is dependent on the various socio-economic, institutional and farm-specific factors.
The resultant equation is presented as follows:
log P y = 1 1 P y = 1 = β 0 + β 1 x 1 i + β 2 x 2 i + + β n x i

3. Results and Discussion

3.1. Descriptive Results

Table 3 shows socio-demographic characteristics of KyD participants in the KZN province. The measured variables were gender, age, marital status, educational qualification, employment status, source of income, and cattle farming experience of the household head. The table shows a gender imbalance of 72% male and 28% female participating in the scheme. These results contradict with the assumption that women are responsible for farming especially in subsistence agriculture as well as livestock keeping and food processing as men migrate from rural areas for employment purposes. Women are also involved with household responsibilities, and due to patriarchal cultural societies, are less likely to participate in male-dominated domains such as livestock rearing [22].
Table 3 further indicates age variable with farmers younger than 20 years (1%), 20–29 years (6%), 30–39 years (15%), 40–49 years (26%), 50–59 years (23%), 60–69 years (21%) and above 70 years old (8%). Therefore, the KyD scheme constitute of youth middle age and old farmers participating. The results show only 29% of farmers aged 60 years and above that are participating in the KyD scheme. Middle aged farmers (40–59 years) in the scheme are the highest as they constitute 49% in the study area. There were 22% farmers in the scheme representing youth (less than 40 years). The indication of having more youth and middle aged farmers than old ones could be advantageous as young household heads have an affinity to uptake new innovations and opportunities [23].
The results on Table 3 show that the majority of farmers in KyD scheme in KZN were single (36%), followed by married (34%), widowed (21%) and divorced (9%) farmers. In terms of educational qualification of KyD participants, it is indicated that the scheme had both literate and illiterate farmers as described by 29% non-educated, 28% primary, 34% secondary and 9% tertiary qualified participants. Educational levels are crucial as they proportionally influence the adoption of new technological innovations by farmers. The employment status of KyD participants as indicated on Table 3 show 60% of unemployed farmers whilst the employed farmers were evenly distributed as formerly employed (12%) and self-employed (12%). According to Jari and Fraser [24], unemployed farmers might be compelled to sell cattle in response to their household bills and financial expenditures.
Table 3 shows main source of income as formal employment (12%), informal employment (18%), social grants (62%), remittances (6%) and pension (2%). The majority of the KyD farmers depended on social grants with only 12% obtaining income from formal employment. Montshwe [25] outlined that household who received unearned incomes had more chances of participating in livestock markets. The lowest number of KyD participants with formal employment income compared to the highest number of low level income source vindicates with the study of Randolph et al. [26] that, smallholder cattle producers with high income levels can afford to settle most of their bills without having to sell livestock. In Table 3, farm management of farmers was categorised and described by whether a farmer is part-time or full-time farmer which consists 7% and 8% respectively. The farming experience of cattle was sub-divided into various categories: less than four years (25%), 5–9 years (28%), 10–14 years (18%), 15–19 years (9%), 20–25 years (11%) and more than 25 years (10%). The KyD programme was dominated by majority of farmers with cattle rearing experience 5–10 years followed by farmers with less than five years in experience. The fact that there were farmers with more than 25 years (10%) farmers means that the scheme had farmers with better livestock management skills.
Table 4 shows that 40% of the respondents were aware of farmgate market channels, followed by 37% and 35% who were aware of butcheries and auctions, respectively. Only 13%, 11% and 6% of the respondents were aware of abattoirs, traders and wet markets, respectively. The higher recognition of farm gate marketing channel is due to its popularity to smallholder farmers because these take place among neighbours and between neighbouring communities, mainly in the form of barter or cash sales (5). The KyD scheme also plays a prominent role in encouraging livestock marketing [27], informing the participants into formal market channels is fundamental hence 35% of these farmers are knowledgeable of auction markets.
Table 4 further shows that 29% of the respondents tend to utilise auction markets, followed by farmgate (20%), abattoirs (9%), butcheries (7%), traders (7%) and wet markets (7%). KyD farmers utilised both formal and informal markets, auctions and butcheries being formal. Auction markets therefore require detailed classification of the cattle to be auctioned and it becomes easy for the KyD participants as the purpose of the scheme is to improve farmers recording accuracy of cattle production [8].

3.2. Determinants of Awareness and Use of Butcheries, Auctions and Farmgate Marketing Channels

Table 5 shows the determinants of awareness and utilisation of butcheries, auctions and farmgate markets. All the models were significant at the 1% level with a Nagelkerke ranging from 0.164 to 0.405. Table 5 shows that labour and training were significant variables in the awareness of butcheries as a market. In terms of utilising the butcheries market, gender, farming activities and training were significant. Table 5 indicates that when the household head is female, there is a 6.7% chance that they would use butchery markets. Women may not be aware of formal markets such as butcheries as they do not focus on cattle rearing as indicated by Kristjanson et al. [28] who argued that males tend to take part and control in livestock production especially cattle since women own small-stock such as chicken and goats. Market utilisation is in line with awareness and the fact that gender is not significant in the awareness of butcheries that leads to less use of the market.
Furthermore, there is a 1.02 chance that when the labour hours are increasing, there is less awareness to butchery markets. Farmers devoting much of their time on cattle production in the KyD scheme are highly exposed to formal and lucrative market information and training pertaining to use of auctions and abattoirs as they would spend most of their time looking at best possible production and marketing opportunities. In addition, farmers that tend to utilise more labour are usually large-scale and proffer for more lucrative markets such as auctions. Furthermore, there is a 23% chance that farmers having access to training will be aware of butchery markets. Marketing knowledge on farmers with access to training is driven by the information acquired during the sessions. Basically, training of farmers involves education on technical skills, workshops on improving quality of produce and access to markets [29]. Farmers trust and rely on information gained in workshops of which may not be as enough as searching for more marketing channels such as auctions on their own. There exists a 5.1% chance that respondents who have training utilise butcheries. Utilisation of markets such as butcheries requires market information such as product specification, which can be attained through training. There is a 9.8% chance that farmers who diversify tend to utilise butchery markets. This was contrary to Montshwe [25], who indicated that the less diversified the farmers, the less they would participate in mainstream markets.
Table 5 also shows that herd size and labour were significant in the awareness of auctions, whilst off -farm income and labour were significant in the use of auction markets. From the results, it is shown that there is a 96.1% chance of awareness of auction markets and a 1.1 chance of less awareness to auction markets as labour hours increase. An increase in labour hours result to proportional decrease in awareness because of the social structures of rural farmers whose labour is composed mainly of family labour. This labour is mainly for minding and retrieving cattle. The larger the herd size the more farmers become part of development programmes such as the KyD. These programmes tend to train farmers in the use of auction markets so that the farmers realise better returns. Furthermore, the larger the herd size, the lower the trade-offs between utilising livestock for consumption purposes and income purposes. The farmers therefore actively seek out lucrative markets such as auctions. It inherently increases their awareness to such markets. This is besides the fact that smallholder farmers aim at increasing their herd for various reasons, such as social and physical capital relative to income. Farmers become more reluctant in finding formal market information as their herd is important for ceremonial purposes, hides, horns and meat [30]. Enhanced herd sizes also act as a social status for Sub Saharan Africa households, with smallholder farmers unwilling to sell their cattle. There is a 1.2 and 1.5 chance that the auctions will be not be utilised if off-farm income increases and labour hours increase, respectively. Although farmers may keep their cattle for herd improvement, an income increase from non-farm employment means enough money for family responsibilities and negate the need to use cattle for commercial purposes. Furthermore, income has always been an issue for smallholder farmers not to sell their cattle on formal markets as it involves a lot of costs and also cattle are used for family consumption [30], therefore increased income can cover the costs of utilising auction markets.
In terms of farmgate market, educational level was significant in its awareness, whilst labour was significant in its use. Table 5 indicates that there is a 70.1 chance that there will be no awareness of farmgate markets as the educational level decreases. With reference to Makhura [31] farm gates sales result in farmers getting low prices due to poor conditions of livestock that are being sold hence educated farmers with knowledge are able to identify the suitable market such as auctions and butcheries for the quality of their herd. Musemwa et al. [4] stipulated that educated farmers are more informed when it comes to their decision-making, this also implies that smallholder farmers tend to aim at commercializing hence focus on improving their awareness on formal markets and not prioritise farm gate sales. Furthermore, there is a 1.03 likelihood that farmers will utilise farmgate markets as labour hours decrease. This is based on the scale of the enterprise where less labour equates to a smaller number of cattle and thus utility in achieving consumption and cultural purposes. There is thus an increase in the use of farmgate markets. However, authors such as Onono [32] advocate that full-time livestock farmers devoting most of their time on herd management believe in on-farm marketing due to instances of carcass damage during the transportation which may decrease the value of cattle on formal markets and therefore farm gates may be utilised by full time livestock carers to avoid such transportation costs [7].

4. Conclusions and Recommendation

Livestock farmers are faced with an array of decisions pertaining to market channel participation. Most of these decisions are governed by the socio-economic, institutional and farm bio-physical characteristics of smallholder farmers. This is also evidence in livestock development programmes becoming pertinent—especially when the farmers are trained to commercialise and make marketing decisions. Livestock Development Programmes (LDPs) have been implemented in the endeavour to mainstream smallholder rural poor livestock keepers to participate in formal market economies and commercialize. The Kaonafatso ya Dikgomo (KyD) scheme is one such LDP with the objective of improving market access and commercialization for small-scale cattle producers and achieving sustainable livestock improvement by keeping accurate animal performance records. The objective of the study was to outline the determinants of market awareness and participation in the KyD scheme, through the utilisation of logit model. The results indicated that more KyD farmers were aware of farmgate relative to other market channels. However, a larger number of farmers tended to utilise auction markets. This indicates that the scheme is particularly effective in influencing commercialisation through utilisation of more lucrative market channels such as auctions. Awareness to butcheries was determined by labour and training, whereas awareness to auctions was influenced by herd size and labour. In terms of farmgate market channel, educational level was significant. In relation to utilisation of butcheries, gender, diversification and training were significant, whilst off-farm income and labour were significant for auction market channels. Labour was also a determinant of utilisation of farm gate market channels. In conclusion, market channel choice is influenced by various socio-economic factors. Furthermore, labour was a significant determinant across all three market channels.
For the KyD scheme to increase its impact in terms of market channel choice, the study recommends that it targets farmers who are commercialising and utilise increased labour. However, even those farmers who do not have a propensity to commercialise should also be conscientized on the available lucrative markets. Furthermore, use of more lucrative market channels can be enhanced though improving awareness of these markets, either though farmer field days or through information platforms such as radios, television or utilisation of direct communication through mobile phones. Extension should also be utilised not only to influence awareness of lucrative market channels, but to go further in assisting in utilisation of those markets.

Author Contributions

Conceptualization, M.P.; methodology, M.P. and S.N.; formal analysis, S.N.; data curation, M.P.; writing—original draft preparation, M.P.; writing—review and editing, S.N.; supervision, S.N.; funding acquisition, A.M.

Funding

This research received no external funding

Acknowledgments

The authors would like to acknowledge the Centre of Collaboration (CoC) between the Agricultural Research Council (ARC), University of Fort Hare (UFH), University of Pretoria (UP) and University of Limpopo (UP) for sponsoring the study as part of a PhD and Master’s study. The authors further acknowledge the anonymous reviewers whose comments helped improve the article.

Conflicts of Interest

The authors declare no conflict of interest.

References

  1. Mafukata, M.A. Factors having the most significance on the choice and selection of marketing channels amongst communal cattle farmers in Vhembe District, Limpopo Province. J. Hum. Ecol. 2015, 49, 77–87. [Google Scholar] [CrossRef]
  2. Ndoro, J.T.; Mudhara, M.; Chimonyo, M. Cattle Commercialization in Rural South Africa: Livelihood Drivers and Implications for Livestock Marketing Extension. J. Hum. Ecol. 2014, 45, 207–221. [Google Scholar] [CrossRef]
  3. Rios, A.R.; Shively, G.E.; Masters, W.A. Farm production and household market participation: Evidence from LSMS data. In Proceedings of the International Association of Agricultural Economist Conference, Beijing, China, 16–22 August 2009. [Google Scholar]
  4. Musemwa, L.; Mushunje, A.; Chimonyo, M. Nguni cattle marketing constraints and opportunities in the communal areas of South Africa: Review. Afr. J. Agric. Res. 2008, 3, 239–245. Available online: https://www.researchgate.net/profile/Voster_Muchenje/publication/207117498_Nguni_cattle_marketing_constraints_and_opportunities_in_the_communal_areas_of_South_Africa_Review/links/09e4150b37a1690ef7000000.pdf (accessed on 5 January 2019).
  5. Ndoro, J.T.; Mudhara, M.; Chimonyo, M. Farmers’ choice of cattle marketing channels under transaction cost in rural South Africa: A multinomial logit model. Afr. J. Range Forage Sci. 2015, 32, 243–252. [Google Scholar] [CrossRef]
  6. Musemwa, L.; Mushunje, A.; Chimonyo, M.; Mapiye, C. Low cattle market off-take rates in communal production systems of South Africa: Causes and mitigation strategies. J. Sustain. Dev. Afr. 2010, 12, 209–226. [Google Scholar]
  7. Marandure, T.; Mapiye, C.; Makombe, G.; Nengovhela, B.; Strydom, P.; Muchenje, V.; Dzama, K. Determinants and opportunities for commercial marketing of beef cattle raised on communally owned natural pastures in South Africa. Afr. J. Range Forage Sci. 2016, 33, 199–206. [Google Scholar] [CrossRef]
  8. ARC. Annual Report 2013/2014; ARC: Pretoria, South Africa, 2014. [Google Scholar]
  9. ARC. National Beef Cattle Recording and Improvement Scheme; ARC: Irene, South Africa, 2011; pp. 1–48. [Google Scholar]
  10. ARC. Annual Beef Bulletin; ARC: Irene, South Africa, 2016. [Google Scholar]
  11. Thomas, B.; Togarepi, C.; Simasiku, A. Analysis of the determinants of the sustainability of cattle marketing systems in Zambezi Region of north-eastern communal area of Namibia. Int. J. Livest. Prod. 2014, 5, 129–136. [Google Scholar]
  12. Senyolo, G.M.; Chaminuka, P.; Makhura, M.N.; Belete, A. Patterns of access and utilization of output markets by emerging farmers in South Africa: Factor analysis approach. J. Agric. Res. 2009, 4, 208–213. [Google Scholar]
  13. Bahta, S.; Bauer, S. Anlysis of the Determinants of Market Participation within the South African Small-Scale Livestock Sector. In Proceedings of the Utilisation of Diversity in Land Use Systems: Sustainable and Organic Approaches to meet Human Needs, Witzenhausen, Germany, 9–11 October 2007. [Google Scholar]
  14. Lubungu, M.; Sitko, N.J.; Hichaambwa, M. Factors Limiting Smallholder Cattle Commercialization in Zambia; Indaba Agriculture Policy Research Institute: Lusaka, Zambia, 2016. [Google Scholar]
  15. Tatsvarei, S.; Mushunje, A.; Matsvai, S.; Ngarava, S. Farmer perceptions in Mashonaland East Province on Zimbabwe’ s agricultural land rental policy. Land Use Policy 2018, 75, 468–477. Available online: https://doi.org/10.1016/j.landusepol.2018.04.015 (accessed on 3 February 2019).
  16. Borges, J.A.R.; Foletto, L.; Vanderson, T.X. An interdisciplinary framework to study farmers’ decisions on adoption of innovation: Insights from expected utility theory and theory of planned behaviour. Afr. J. Agric. Res. 2015, 10, 2814–2825. [Google Scholar]
  17. Arbuckle, G.J.; Morton, L.W.; Hobbs, J. Perspectives on climate change adaptation and mitigation: The roles of trust in sources of climate information, climate change beliefs, and perceived risk. Environ. Behav. 2015, 47, 205–234. [Google Scholar] [CrossRef] [PubMed]
  18. ARC. Annual Report 2012–2013; ARC: Pretoria, South Africa, 2013. [Google Scholar]
  19. ARC. Annual Report 2016/2017; ARC: Pretoria, South Africa, 2017. [Google Scholar]
  20. Ngarava, S. Evaluating Livestock Development Programmes Through the Production Risk Interface: Case of the Kaonafatso ya Dikgomo (KyD) Scheme in South Africa; University of Fort Hare: Alice, South Africa, 2019. [Google Scholar]
  21. GIS. Study Area; GIS: Alice, South Africa, 2018. [Google Scholar]
  22. Challa, M.; Tilahun, U. Determinants and Impacts of Modern Agricultural Technology Adoption in West Wollega: The Case of Gulliso District. J. Biol. Agric. Healthc. 2014, 4, 63–78. [Google Scholar]
  23. Barrett, C. Smallholder market participation: Concepts and evidence from eastern and southern Africa. Food Policy 2008, 33, 299–317. [Google Scholar] [CrossRef]
  24. Jari, B.; Fraser, G.C.G. An analysis of institutional and technical factors influencing agricultural marketing amongst smallholder farmers in the Kat River Valley, Eastern Cape Province, South Africa. Int. J. Agric. Res. 2009, 4, 1129–1137. [Google Scholar]
  25. Montshwe, B.D. Factors Affecting Participation in Mainstream Cattle Markets by Small-Scale Cattle Farmers in South Africa; University of the Free State: Bloemfontein, South Africa, 2005. [Google Scholar]
  26. Randolph, T.F.; Schelling, E.; Grace, D.; Nicholson, C.F.; Leroy, J.L.; Cole, D.C.; Demment, M.W.; Omore, A.; Zinsstag, J.; Ruel, M. Invited Review: Role of livestock in human nutrition and health for poverty reduction in developing countries. J. Anim. Sci. 2007, 85, 2788–2800. [Google Scholar] [CrossRef] [PubMed]
  27. ARC. Annual Report 2010–2011; ARC: Pretoria, South Africa, 2011. [Google Scholar]
  28. Kristjanson, P.; Waters-Bayer, A.; Johnson, N.; Tipilda, A.; Njuki, J.; Baltenweck, I.; Grace, D.; MacMillan, S. Livestock and Women’s livelihoods: A Review of the Recent Evidence; Report No.: Discussion Paper No. 20; International Livestock Research Institute: Nairobi, Kenya, 2010. [Google Scholar]
  29. Sikwela, M.M.; Mushunje, A. The impact of farmer support programmes on household income and sustainability in smallholder production: A case study of the Eastern Cape and KwaZulu Natal farmers, South Africa. Afr. J. Agric. Res. 2013, 8, 2502–2511. Available online: http://www.academicjournals.org/AJAR (accessed on 6 October 2018).
  30. Soji, Z.; Chikwanda, D.; Chikwanda, A.T.; Jaja, I.F.; Mushonga, B.; Muchenje, V. Relevance of the formal red meat classification system to the South African informal livestock sector. S. Afr. J. Anim. Sci. 2015, 45, 263–277. [Google Scholar]
  31. Makhura, M. Overcoming transaction costs barriers to market participation of smallholder cattle keepers in the Northern Province of South Africa. Agrekon 2001, 38, 165–189. [Google Scholar]
  32. Onono, J.O.; Amimo, J.O.; Rushton, J. Constraints and efficiency of cattle marketing in semiarid pastoral system in Kenya. Trop. Anim. Health Prod. 2015, 47, 691–697. [Google Scholar] [CrossRef] [PubMed]
Figure 1. Study sites. Source: Geographic Information Systems [21].
Agriculture 09 00215 g001
Table 1. Sample selection.
ProvinceDistrict MunicipalityLocal MunicipalityVillageKyD Farmers
KwaZulu-NatalZululanduPhongoloGodlwayo38
AmajubaNewcastleAitona39
uThekelaEndumeniUitval39
Table 2. Variables used in the logit model.
VariableType of MeasurementExpected Sign
Awareness of a marketDummy: 0 = yes, 1 = no
Participation in a marketDummy: 0 = yes, 1 = no
GenderDummy: 0 = male, 1 = female+/−
AgeOrdinal: Actual number in years+
Marital statusDummy: 1 = single, 0 = otherwise+/−
Household sizeContinuous: Actual number+/−
Educational levelOrdinal: 1 = no education, 2 = primary, 3 = secondary, 4 = tertiary+/−
Employment statusDummy: 1 = unemployed, 0 = otherwise
Household off/non-farm incomeOrdinal: Actual number in Rand
Main source of incomeDummy: 1 = formal employment, 0-otherwise+/−
Cattle farming experienceOrdinal: Actual number in years+
Herd sizeContinuous: Actual number
Distance to nearest marketActual number in metres (continuous)+/−
EnterpriseOrdinal: 1 = communal, 2 = small scale commercial, 3 = large scale commercial+/−
Farming activities undertakenDummy: 1 = livestock + crops + vegetables, 0 = otherwise+
Labour hoursContinuous: Actual number in hours+/−
TrainingDummy: 1 = yes, 0 = no+
Part of farmer organizationDummy: 1 = yes, 0 = no+
+ indicates positive association, − indicates negative association.
Table 3. Descriptive statistics.
VariablesFrequenciesPercentages
Gender of household head
 Male8171.7
 Female3228.3
Age of household head
 < 20 years10.9
 20–29 years76.2
 30–39 years1715.0
 40–49 years2925.7
 50–59 years2623.0
 60–69 years2421.2
 > 70 years98.0
Marital status of household head
 Single4136.3
 Married3833.6
 Widowed2421.2
 Divorced108.8
Highest educational qualification of household head
 None3329.2
 Primary3228.3
 Secondary3833.6
 Tertiary108.8
Employment status of household head
 Unemployed6860.2
 Formally employed1412.4
 Self employed1412.4
 Part time farmer87.1
 Full time farmer98.0
Sources of income
 Formal employment1412.4
 Informal employment2017.7
 Social grants7061.9
 Remittances76.2
 Pension21.8
Cattle farming experience
 0–4 years2824.8
 5–9 years3228.3
 10–14 years2017.7
 15–19 years108.8
 20–25 years1210.6
 More than 25 years119.7
Table 4. Market channels utilised.
Market Channels
Butcheries (%)Abattoirs (%)Auctions (%)Traders (%)Farmgate (%)Wet market (%)
Aware
Yes37.212.835.411.040.26.1
No62.887.264.689.059.893.9
Used
Yes6.78.528.73.720.13.7
No93.391.571.396.379.996.3
Table 5. Determinants of awareness and use of butcher, auction and farmgate markets for KyD scheme farmers.
ButcherAuctionFarmgate
AwarenessUseAwarenessUseAwarenessUse
BExp(B)BExp(B)BExp(B)BExp(B)BExp(B)BExp(B)
Gender (1 = female, 0 = male) −0.7950.451−2.702*0.067−0.5920.553−0.6260.535−0.0570.945−0.8530.426
Age −0.047 0.954 −0.263 0.769 0.076 1.079 −0.033 0.967 −0.133 0.875 0.110 1.117
Marital status (1 = single, 0 = otherwise) −0.453 0.636 −1.215 0.297 0.230 1.259 0.529 1.697 −0.212 0.809 0.466 1.594
Total household size 0.044 1.045 −0.062 0.940 0.048 1.049 0.037 1.038 0.040 1.040 0.062 1.064
Highest educational level −0.155 0.856 −0.196 0.822 0.075 1.078 0.048 1.049 −0.355*** 0.701 −0.112 0.894
Employment status (1 = employed, 0 = otherwise) −0.001 0.999 0.234 1.264 0.022 1.022 0.104 1.109 −0.167 0.847 0.004 1.004
Off/Non-Farm income 0.066 1.068 0.288 1.334 0.143 1.153 0.212** 1.237 0.115 1.121 −0.144 0.866
Main source of income (1 = formal employment, 0 = otherwise) 0.160 1.173 −2.387 0.092 0.058 1.060 0.072 1.075 −0.696 0.499 −0.390 0.677
Experience rearing cattle 0.197 1.218 −0.269 0.764 −0.007 0.993 0.077 1.080 −0.041 0.960 −0.028 0.973
Number of cattle −0.022 0.979 −0.091 0.913 −0.040** 0.961 −0.030 0.971 0.013 1.013 −0.016 0.984
Distance to nearest market 0.000 1.000 0.000 1.000 0.000 1.000 0.000 1.000 0.000 1.000 0.000 1.000
Type of cattle enterprise −0.315 0.730 0.489 1.631 −0.338 0.713 −0.556 0.574 −0.209 0.812 0.319 1.376
Farming activities undertaken (1 = livestock + crops + vegetables, 0 = otherwise) −0.263 0.768 −2.323* 0.098 −0.240 0.786 -0.494 0.610 0.090 1.094 0.537 1.712
Labour hours 0.024* 1.024 −0.001 0.999 0.059*** 1.061 0.055** 1.057 0.007 1.007 0.030* 1.031
Training (1 = yes, 0 = otherwise) −1.459*** 0.232 −2.971* 0.051 −0.131 0.877 −0.096 0.908 −0.144 0.865 −0.279 0.756
Part of a farmer organization (1 = yes, 0 = otherwise) 1.328 3.774 3.597 36.475 −1.131 0.323 −1.179 0.308 1.680 5.364 −1.660 0.190
Constant −0.795 0.451 −5.890 0.003 −0.592 0.553 −0.626 0.535 −0.057 0.945 −0.853 0.426
Nagelkerke0.217 0.405 0.205 0.230 0.164 0.173
Sig.0.001 0.000 0.004 0.000 0.004 0.000
Sig at *** 1%, ** 5% and * 10%
Sig. (Significance) at *** 1%, ** 5% and * 10%.

