
Hydroponic Cultivation of Laranja Cherry Tomatoes under Salt Stress and Foliar Application of Hydrogen Peroxide
 , , , ,
Abstract
:1. Introduction
2. Materials and Methods
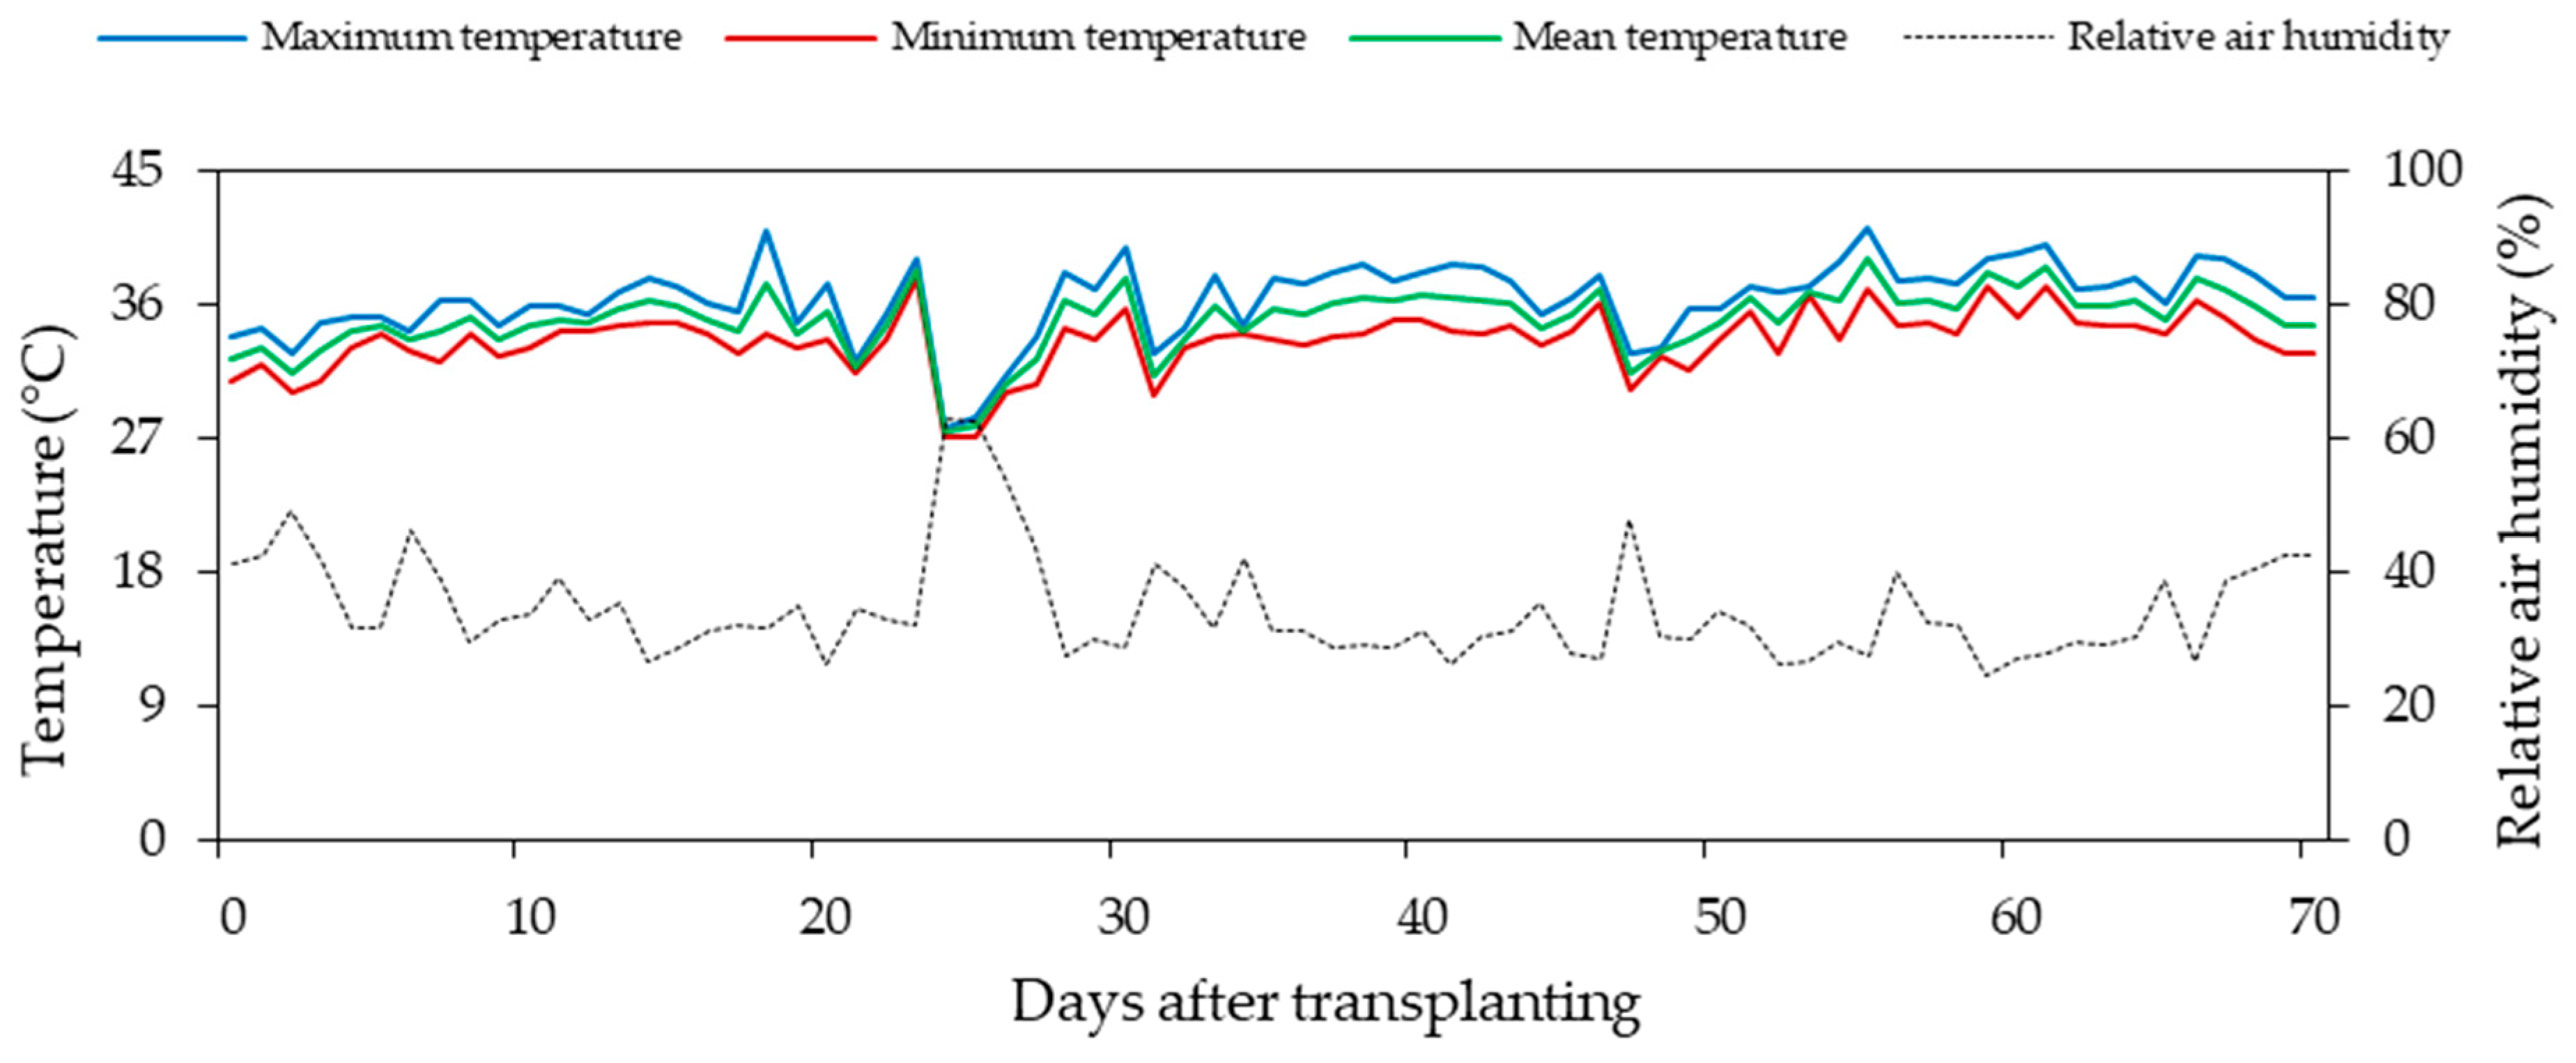
2.1. Experiment Location
2.2. Cultivar Studied
2.3. Treatments and Experimental Design
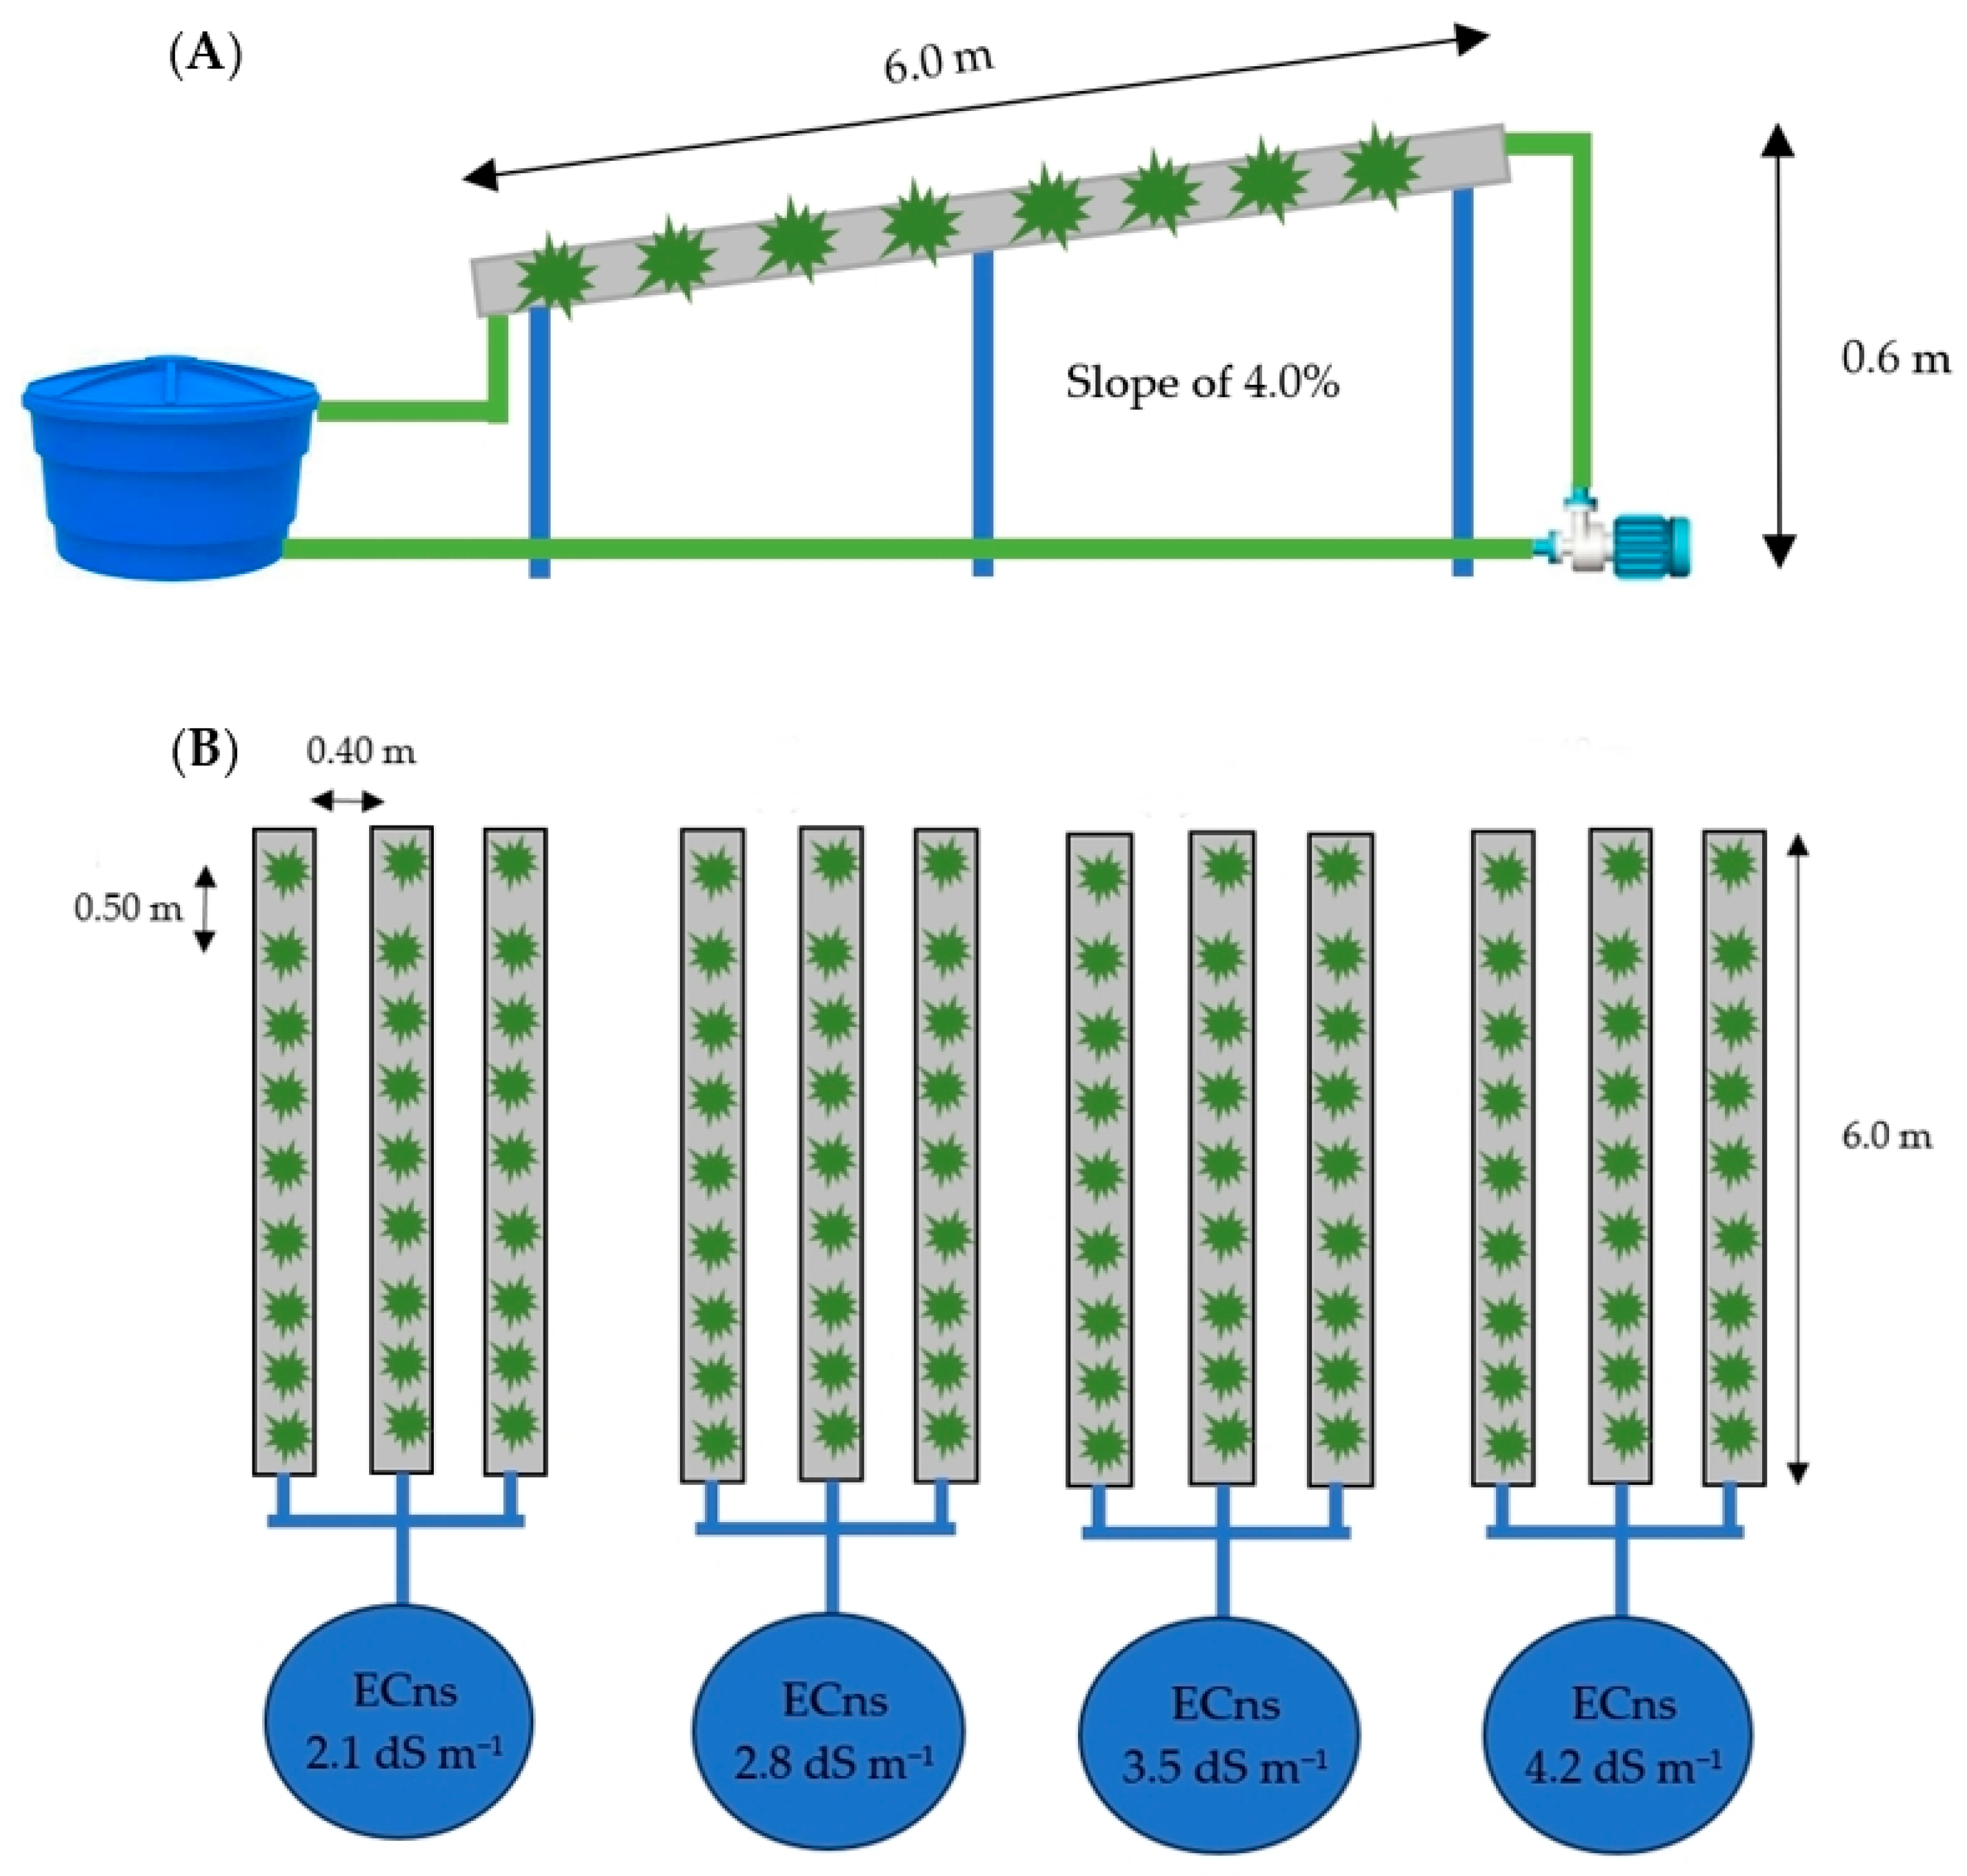
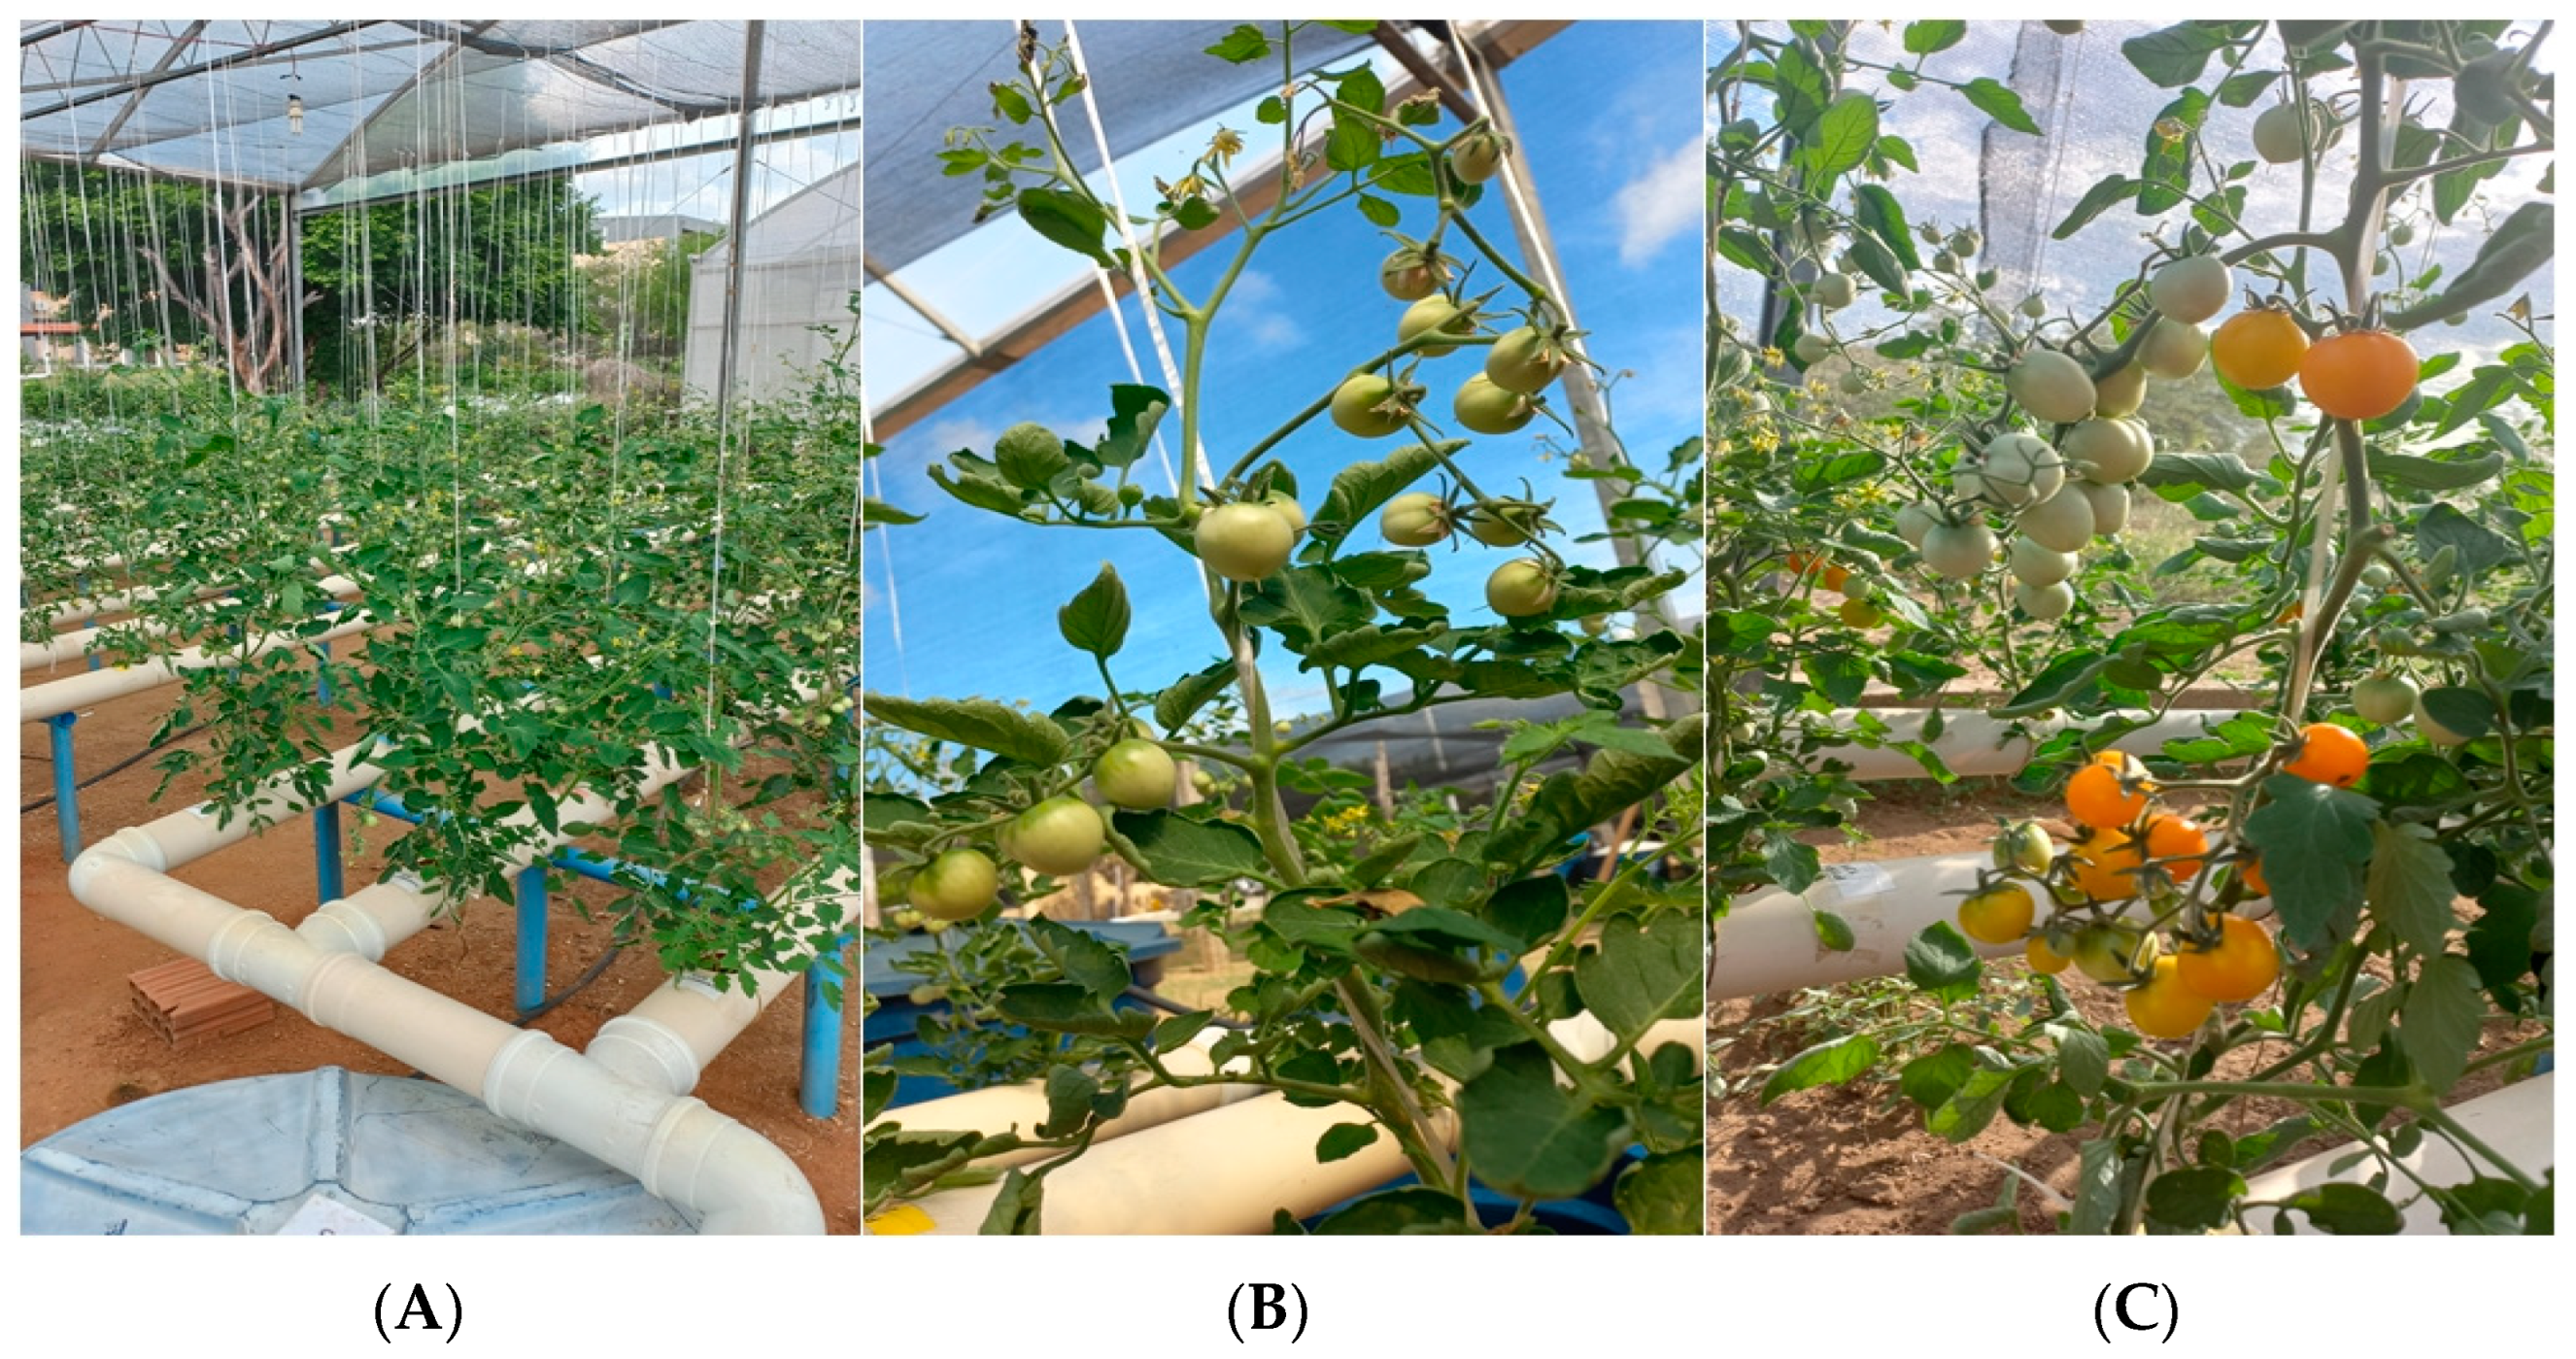
2.4. Experiment Setup and Conduction
2.5. Traits Analyzed
2.5.1. Production Variables
2.5.2. Post-Harvest Quality Variables
2.6. Statistical Analysis
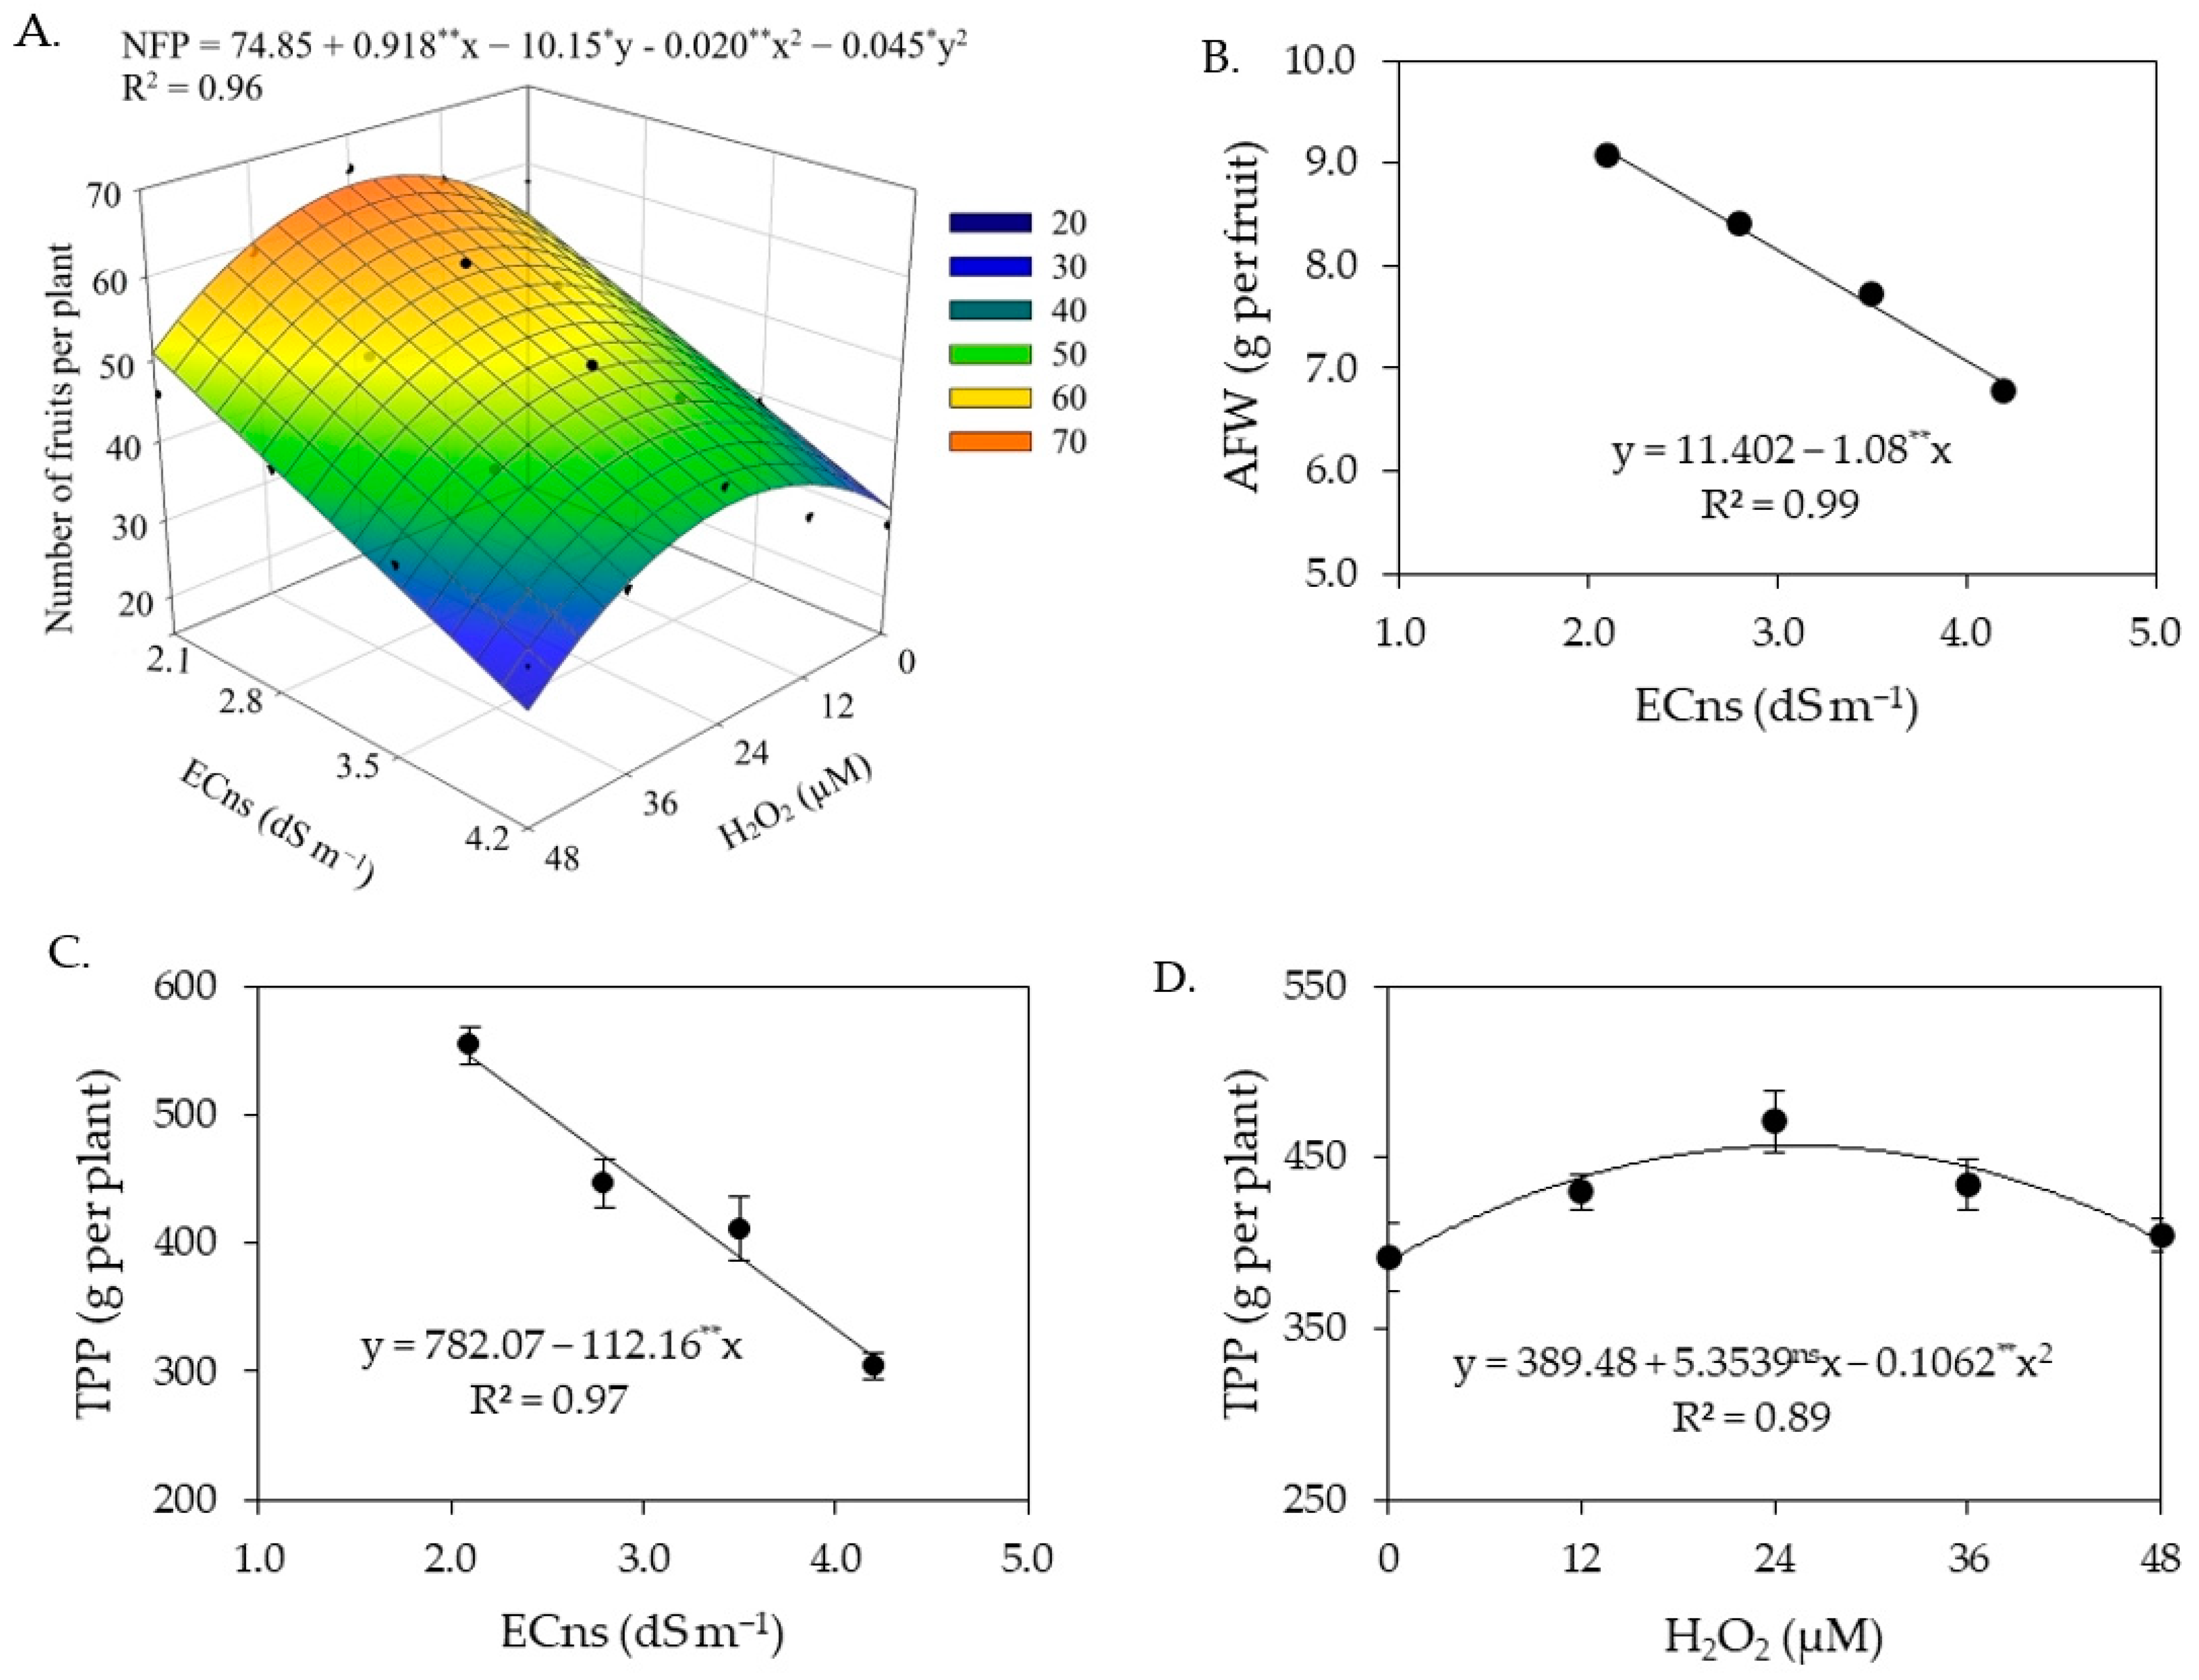
3. Results
4. Discussion
5. Conclusions
Author Contributions
Funding
Data Availability Statement
Acknowledgments
Conflicts of Interest
References
- Silva, A.A.R.; Lima, G.S.; Azevedo, C.A.V.; Veloso, L.L.S.A.; Lacerda, C.N.; Gheyi, H.R.; Soares, L.A.d.A. Methods of application of salicylic acid as attenuator of salt stress in cherry tomato. Braz. J. Biol. 2022, 82, e265069. [Google Scholar] [CrossRef]
- Dai, Y.; Wang, Z.; Li, J.; Xu, Z.; Qian, C.; Xia, X.; Feng, Y. Tofu by-product soy whey substitutes urea: Reduced ammonia volatilization, enhanced soil fertility and improved fruit quality in cherry tomato production. Environ. Res. 2023, 226, 115662. [Google Scholar] [CrossRef]
- Bu, S.; Munir, S.; He, P.; Li, Y.; Wu, Y.; Li, X.; He, Y. Bacillus subtilis L1-21 as a biocontrol agent for postharvest gray mold of tomato caused by Botrytis cinerea. Biol. Control 2021, 157, e104568. [Google Scholar] [CrossRef]
- de Matos, R.M.; da Silva, P.F.; Dantas Neto, J.; Lima, A.S.; de Lima, V.L.A.; Saboya, L.M.F. Organic fertilization as an alternative to the chemical in cherry tomato growing under irrigation depths. Biosci. J. 2021, 37, e37006. [Google Scholar] [CrossRef]
- IBGE—Instituto Brasileiro de Geografia e Estatística. 2021. Available online: https://www.ibge.gov.br/explica/producao-agropecuaria/tomate/br> (accessed on 5 June 2023).
- Nobre, R.G.; de Lima, G.S.; Gheyi, H.R.; Medeiros, E.P.D.; Soares, L.A.A.; Alves, A.N. Oil content and yield of castor bean as affected by nitrogen fertilization and saline water irrigation. Pesqui. Agropecu. Bras. 2012, 47, 991–999. [Google Scholar] [CrossRef]
- Veloso, L.L.S.A.; Nobre, R.G.; de Lima, G.S.; Barbosa, J.L.; Melo, E.M.; Gheyi, H.R.; Gonçalves, E.B.; Souza, C.M.A. Quality of soursop (Annona muricata L.) seedlings under different water salinity levels and nitrogen fertilization. Aust. J. Crop Sci. 2018, 12, 306–310. [Google Scholar] [CrossRef]
- van Zelm, E.; Zhang, Y.; Testerink, C. Salt tolerance mechanisms of plants. Annu. Rev. Plant Biol. 2020, 71, 403–433. [Google Scholar] [CrossRef] [PubMed]
- Song, Q.; Zhou, M.; Wang, X.; Brestic, M.; Liu, Y.; Yang, X. RAP2. 6 enhanced salt stress tolerance by reducing Na+ accumulation and stabilizing the electron transport in Arabidopsis thaliana. Plant Physiol. Biochem. 2023, 195, 134–143. [Google Scholar] [CrossRef]
- Wang, Y.; Cao, Y.; Liang, X.; Zhuang, J.; Wang, X.; Qin, F.; Jiang, C. A dirigent family protein confers variation of Casparian strip thickness and salt tolerance in maize. Nat. Commun. 2022, 13, e2222. [Google Scholar] [CrossRef]
- Oliveira, V.K.N.; Silva, A.A.R.d.; Lima, G.S.d.; Soares, L.A.d.A.; Gheyi, H.R.; de Lacerda, C.F.; Vieira de Azevedo, C.A.; Nobre, R.G.; Garófalo Chaves, L.H.; Dantas Fernandes, P.; et al. Foliar application of salicylic acid mitigates saline stress on physiology, production, and post-harvest quality of hydroponic japanese cucumber. Agriculture 2023, 13, 395. [Google Scholar] [CrossRef]
- Chen, L.; Meng, Y.; Yang, W.; Qian, L.V.; Zhou, L.; Liu, S.; Li, X. Genome-wide analysis and identification of TaRING-H2 gene family and TaSDIR1 positively regulates salt stress tolerance in wheat. Int. J. Biol. Macromol. 2023, 242, e125162. [Google Scholar] [CrossRef] [PubMed]
- Roque, I.A.; Soares, L.A.d.A.; de Lima, G.S.; Lopes, I.A.P.; Silva, L.d.A.; Fernandes, P.D. Biomass, gas exchange and production of cherry tomato cultivated under saline water and nitrogen fertilization. Rev. Caatinga 2022, 35, 686–696. [Google Scholar] [CrossRef]
- Batista, M.C.; do Nascimento, R.; Maia Júnior, S.d.O.; Nascimento, E.; Bezerra, C.V.d.C.; de Lima, R.F. Physiology and production of cherry tomato cultivars in a hydroponic system using brackish water. Rev. Bras. Eng. Agríc. Ambient. 2021, 25, 219–227. [Google Scholar] [CrossRef]
- Martínez, J.P.; Fuentes, R.; Farías, K.; Lizana, C.; Alfaro, J.F.; Fuentes, L.; Lutts, S. Effects of salt stress on fruit antioxidant capacity of wild (Solanum chilense) and domesticated (Solanum lycopersicum var. cerasiforme) tomatoes. Agronomy 2020, 10, 1481. [Google Scholar] [CrossRef]
- Rapa, M.; Ciano, S.; Ruggieri, R.; Vinci, G. Bioactive compounds in cherry tomatoes (Solanum Lycopersicum var. Cerasiforme): Cultivation techniques classification by multivariate analysis. Food Chem. 2021, 355, e129630. [Google Scholar] [CrossRef]
- Mendonça, A.J.T.; da Silva, A.A.R.; de Lima, G.S.; Soares, L.A.d.A.; Oliveira, V.K.N.; Gheyi, H.R.; de Lacerda, C.F.; de Azevedo, C.A.V.; de Lima, V.L.A.; Fernandes, P.D. Salicylic acid modulates okra tolerance to salt stress in hydroponic system. Agriculture 2022, 12, 1687. [Google Scholar] [CrossRef]
- da Silva, A.A.R.; Sousa, P.F.d.N.; de Lima, G.S.; Soares, L.A.d.A.; Gheyi, H.R.; Azevedo, C.A.V. Hydrogen peroxide reduces the effect of salt stress on growth and postharvest quality of hydroponic mini watermelon. Water Air Soil Pollut. 2022, 233, 198. [Google Scholar] [CrossRef]
- Bagheri, M.; Gholami, M.; Baninasab, B. Hydrogen peroxide-induced salt tolerance in relation to antioxidant systems in pistachio seedlings. Sci. Hortic. 2019, 243, 207–213. [Google Scholar] [CrossRef]
- Veloso, L.L.d.S.A.; de Azevedo, C.A.V.; Nobre, R.G.; de Lima, G.S.; Bezerra, J.R.C.; da Silva, A.A.R.; Fátima, R.T.; Gheyi, H.R.; Soares, L.A.d.A.; Fernandes, P.D.; et al. Production and fiber characteristics of colored cotton cultivares under salt stress and H2O2. Plants 2023, 12, 2090. [Google Scholar] [CrossRef]
- Gohari, G.; Alavi, Z.; Esfandiari, E.; Panahirad, S.; Hajihoseinlou, S.; Fotopoulos, V. interaction between hydrogen peroxide and sodium nitroprusside following chemical priming of Ocimum basilicum L. against salt stress. Physiol. Plant. 2020, 168, 361–373. [Google Scholar] [CrossRef]
- Shalaby, O.A.E.S.; Farag, R.; Ibrahim, M.F. Effect of hydrogen sulfide and hydrogen peroxide on growth, yield and nutrient content of broccoli plants grown under saline conditions. Sci. Hortic. 2023, 316, e112035. [Google Scholar] [CrossRef]
- Aragão, J.; de Lima, G.S.; de Lima, V.L.A.; da Silva, A.A.R.; Santos, L.F.S.; Dias, M.d.S.; Soares, L.A.d.A. Hydrogen peroxide in the mitigation of salt stress in bell pepper. Semin. Ciênc. Agrar. 2023, 44, 217–236. [Google Scholar] [CrossRef]
- Pereira, F.H.; dos Santos, G.L.; de Lacerda, F.H.; de Sousa, D.D.; Sousa, V.F.d.O.; Fernandes, J.E.d.M.; Barboza, J.B. Use of hydrogen peroxide in acclimatization of melon to salinity of irrigation water. Rev. Bras. Eng. Agríc. Ambient. 2022, 27, 51–56. [Google Scholar] [CrossRef]
- Dantas, M.V.; de Lima, G.S.; Gheyi, H.R.; Pinheiro, F.W.A.; Silva, P.C.C.; Soares, L.A.d.A. Gas exchange and hydroponic production of zucchini under salt stress and H2O2 application. Rev. Caatinga 2022, 35, 436–449. [Google Scholar] [CrossRef]
- Hajivar, B.; Zare-Bavani, M.R. Alleviation of salinity stress by hydrogen peroxide and nitric oxide in tomato plants. Adv. Hortic. Sci. 2019, 33, 409–416. [Google Scholar] [CrossRef]
- Liu, L.; Huang, L.; Lin, X.; Sun, C.O. Hydrogen peroxide alleviates salinity-induced damage by increasing proline buildup in wheat seedlings. Plant Cell Rep. 2020, 39, 567–575. [Google Scholar] [CrossRef]
- Capitulino, J.D.; Lima, G.S.d.; Azevedo, C.A.V.d.; Silva, A.A.R.d.; Arruda, T.F.d.L.; Soares, L.A.d.A.; Gheyi, H.R.; Dantas Fernandes, P.; Sobral de Farias, M.S.; Silva, F.d.A.d.; et al. Influence of foliar application of hydrogen peroxide on gas exchange, photochemical efficiency, and growth of soursop under salt stress. Plants 2023, 12, 599. [Google Scholar] [CrossRef]
- Agristar. Available online: https://agristar.com.br/topseed-garden/blue-line-hortalicas/tomate-cereja-laranja/1888147 (accessed on 10 May 2023).
- Hoagland, D.R.; Arnon, D.I. The water-culture method for growing plants without soil. Circ. Calif. Agric. Exp. Stn. 1950, 347, 32. [Google Scholar]
- Instituto Adolfo Lutz—IAL. Normas analíticas do Instituto Adolfo Lutz. In Métodos Químicos e Físicos para Análise de Alimentos, 3rd ed.; IMESP: São Paulo, Brazil, 2008; 1020p. [Google Scholar]
- Ferreira, D.F. SISVAR: A computer analysis system to fixed effects split plot type designs. Rev. Bras. Biom. 2019, 37, 529–535. [Google Scholar] [CrossRef]
- Usman, S.; Yaseen, G.; Noreen, Z.; Rizwan, M.; Noor, H.; Elansary, H.O. Melatonin and arginine combined supplementation alleviate salt stress through physiochemical adjustments and improved antioxidant enzymes activity in Capsicum annuum L. Sci. Hortic. 2023, 321, 112270. [Google Scholar] [CrossRef]
- Zhao, Y.; Jia, K.; Tian, Y.; Han, K.; El-Kassaby, Y.A.; Yang, H.; Li, Y. Time-course transcriptomics analysis reveals key responses of populus to salt stress. Ind. Crops Prod. 2023, 194, e116278. [Google Scholar] [CrossRef]
- Wu, C.; Zhang, M.; Liang, Y.; Zhang, L.; Diao, X. Salt stress responses in foxtail millet: Physiological and molecular regulation. Crop J. 2023, 1, 1–27. [Google Scholar] [CrossRef]
- da Silva, A.A.R.; Capitulino, J.D.; de Lima, G.S.; de Azevedo, C.A.V.; Arruda, T.F.d.L.; Souza, A.R.; Soares, L.A.d.A. Hydrogen peroxide in attenuation of salt stress effects on physiological indicators and growth of soursop. Braz. J. Biol. 2022, 84, e261211. [Google Scholar] [CrossRef]
- Farooq, M.; Nawaz, A.; Chaudhary, M.A.M.; Rehman, A. Foliage-applied sodium nitroprusside and hydrogen peroxide improves resistance against terminal drought in bread wheat. J. Agron. Crop Sci. 2017, 203, 473–482. [Google Scholar] [CrossRef]
- Veloso, L.L.d.S.A.; da Silva, A.A.R.; Capitulino, J.D.; de Lima, G.S.; de Azevedo, C.A.V.; Gheyi, H.R.; Nobre, R.G.; Fernandes, P.D. Photochemical efficiency and growth of soursop rootstocks subjected to salt stress and hydrogen peroxide. AIMS Agric. Food 2020, 5, 1–13. [Google Scholar] [CrossRef]
- Jacoby, R.P.; Millar, A.H.; Taylor, N.L. Wheat mitochondrial proteomes provide new links between antioxidant defense and plant salinity tolerance. J. Proteome Res. 2010, 9, 6595–6604. [Google Scholar] [CrossRef] [PubMed]
- Liang, H.; Shi, Q.; Li, X.; Gao, P.; Feng, D.; Zhang, X.; Ma, W. Synergistic effects of carbon cycle metabolism and photosynthesis in Chinese cabbage under salt stress. Hortic. Plant J. 2022, 9, 1–12. [Google Scholar] [CrossRef]
- Junedi, M.A.; Mukhopadhyay, R.; Manjari, K.S. Alleviating salinity stress in crop plants using new engineered nanoparticles (ENPs). Plant Stress 2023, 6, e100184. [Google Scholar] [CrossRef]
- Silva, H.H.B.; Azevedo Neto, A.D.; Menezes, R.V.; Silva, P.C.C.; Gheyi, H.R. Use of hydrogen peroxide in acclimation of basil (Ocimum basilicum L.) to salt stress. Turk. J. Bot. 2019, 43, 208–217. [Google Scholar] [CrossRef]
- Chattha, M.U.; Hassan, M.U.U.; Khan, I.; Nawaz, M.; Shah, A.N.; Sattar, A.; Qari, S.H. Hydrogen peroxide priming alleviates salinity induced toxic effect in maize by improving antioxidant defense system, ionic homeostasis, photosynthetic efficiency and hormonal crosstalk. Mol. Biol. Rep. 2022, 49, 5611–5624. [Google Scholar] [CrossRef] [PubMed]
- Skider, R.K.; Wang, X.; Zhang, H.; Gui, H.; Dong, Q.; Jin, D.; Song, M. Nitrogen enhances salt tolerance by modulating the antioxidant defense system and osmoregulation substance content in Gossypium hirsutum. Plants 2020, 9, 450. [Google Scholar] [CrossRef] [PubMed]
- Zhao, Y.; Li, L.; Gao, S.; Wang, S.; Li, X.; Xiong, X. Propriedades de armazenamento pós-colheita e modelos cinéticos de qualidade de tomates cereja tratados por campos eletrostáticos de alta voltagem. LWT 2023, 176, e114497. [Google Scholar] [CrossRef]
- Tigist, M.; Workneh, T.S.; Woldetsadik, K. Effects of variety on the quality of tomato stored under ambient conditions. Int. J. Food Sci. Technol. 2013, 50, 477–486. [Google Scholar] [CrossRef] [PubMed]
- Silva, J.B.C.; Giordano, L.B. Tomate Para Processamento Industrial; Embrapa Hortaliças: Brasília, Brazil, 2000; 168p. [Google Scholar]
- Brasil. Ministério da Agricultura e do Abastecimento. In Aprova o Regulamento Técnico Geral Para Fixação dos Padrões de Identidade e Qualidade Para Polpa de Fruta; Diário Oficial da União: Brasília, Brazil, 2018; 23p. [Google Scholar]
- Wu, S.; Lu, M.; Wang, S. Effect of oligosaccharides derived from Laminaria japonica-incorporated pullulan coatings on preservation of cherry tomatoes. Food Chem. 2016, 199, 296–300. [Google Scholar] [CrossRef]
- El-Mogy, M.M.; Garchery, C.; Stevens, R. Irrigation with salt water affects growth, yield, fruit quality, storability and marker-gene expression in cherry tomato. Acta Agric. Scand. 2018, 68, 727–737. [Google Scholar] [CrossRef]


| Source of Variation | DF | Mean Squares | ||||
|---|---|---|---|---|---|---|
| NFP | TPP | AFW | FPD | FED | ||
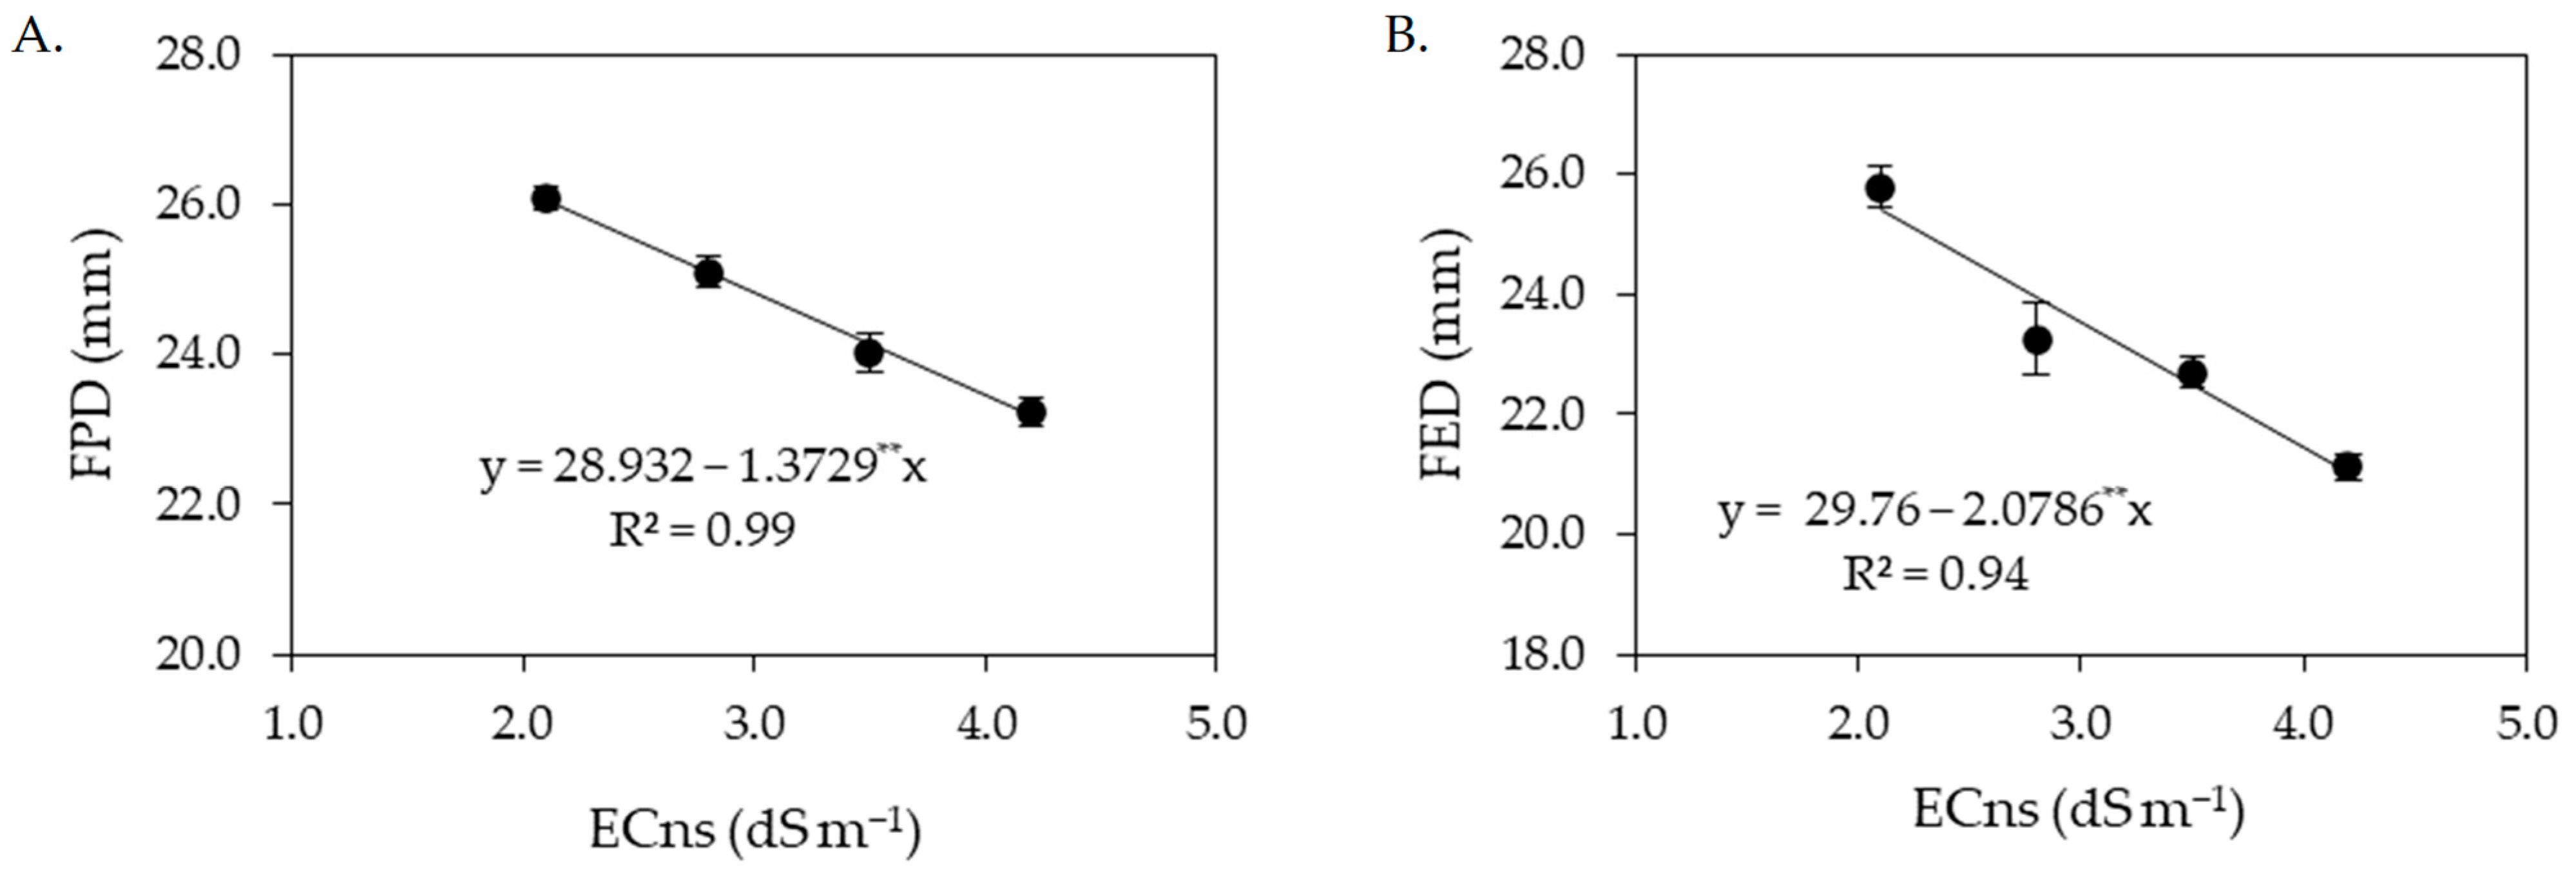
| Saline nutrient solution (ECns) | 3 | 1413.60 ** | 172,330.59 ** | 12.68 ** | 23.16 ** | 56.28 ** |
| Linear regression | 1 | 4093.03 ** | 498,323.61 ** | 35.09 ** | 69.25 ** | 158.82 ** |
| Quadratic regression | 1 | 63.76 * | 289.61 ns | 1.92 ns | 0.12 ns | 3.37 ns |
| Residual 1 | 6 | 4.41 | 960.69 | 0.19 | 1.57 | 2.17 |
| Hydrogen peroxide (H2O2) | 4 | 387.52 ** | 11,312.80 ** | 0.63 ns | 4.69 ns | 6.69 ns |
| Linear regression | 1 | 55.97 ns | 1151.65 ns | 0.02 ns | 0.78 ns | 8.11 ns |
| Quadratic regression | 1 | 1298.93 ** | 39,417.44 ** | 0.22 ns | 0.52 ns | 13.31 ns |
| Interaction (ECns × H2O2) | 12 | 68.89 ** | 2763.34 ns | 0.48 ns | 1.15 ns | 1.16 ns |
| Residual 2 | 34 | 22.27 | 689.10 | 0.49 | 1.23 | 1.42 |
| CV 1 (%) | 4.44 | 7.27 | 5.41 | 5.09 | 6.35 | |
| CV 2 (%) | 9.97 | 6.16 | 8.65 | 4.50 | 5.13 | |
| Source of Variation | DF | Mean Squares | ||||
|---|---|---|---|---|---|---|
| pH | AA | SS | TA | MOIST | ||
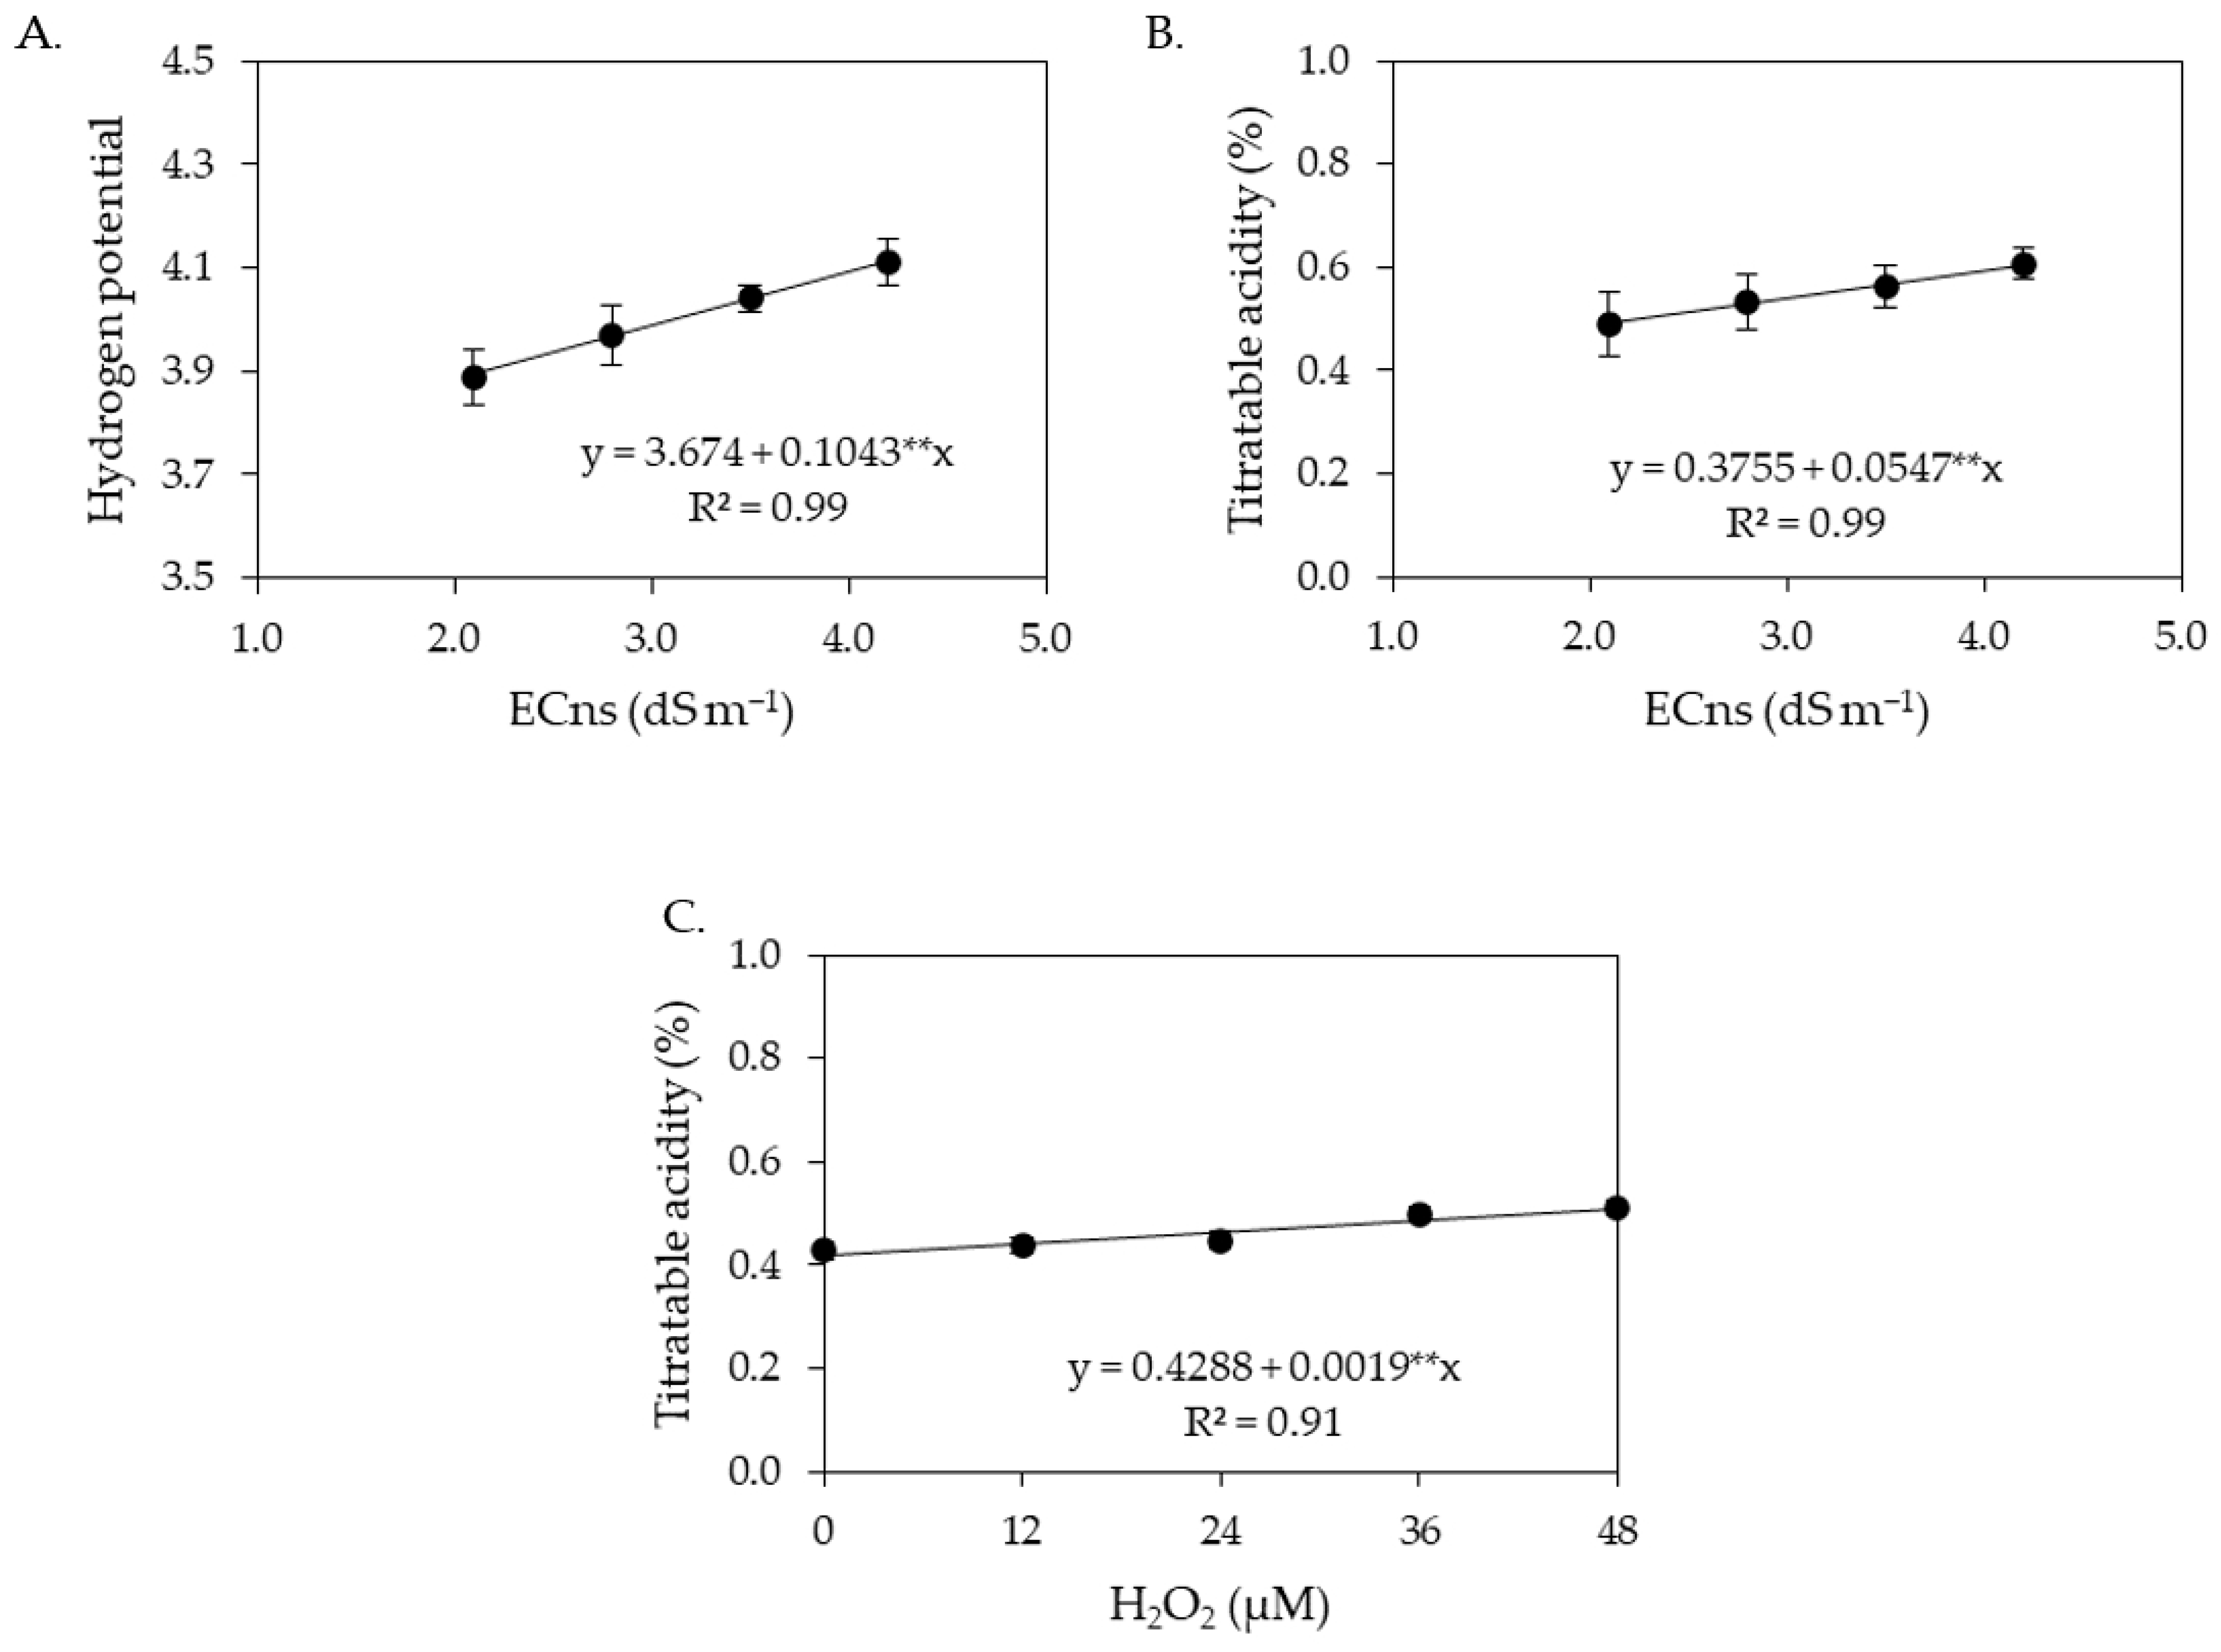
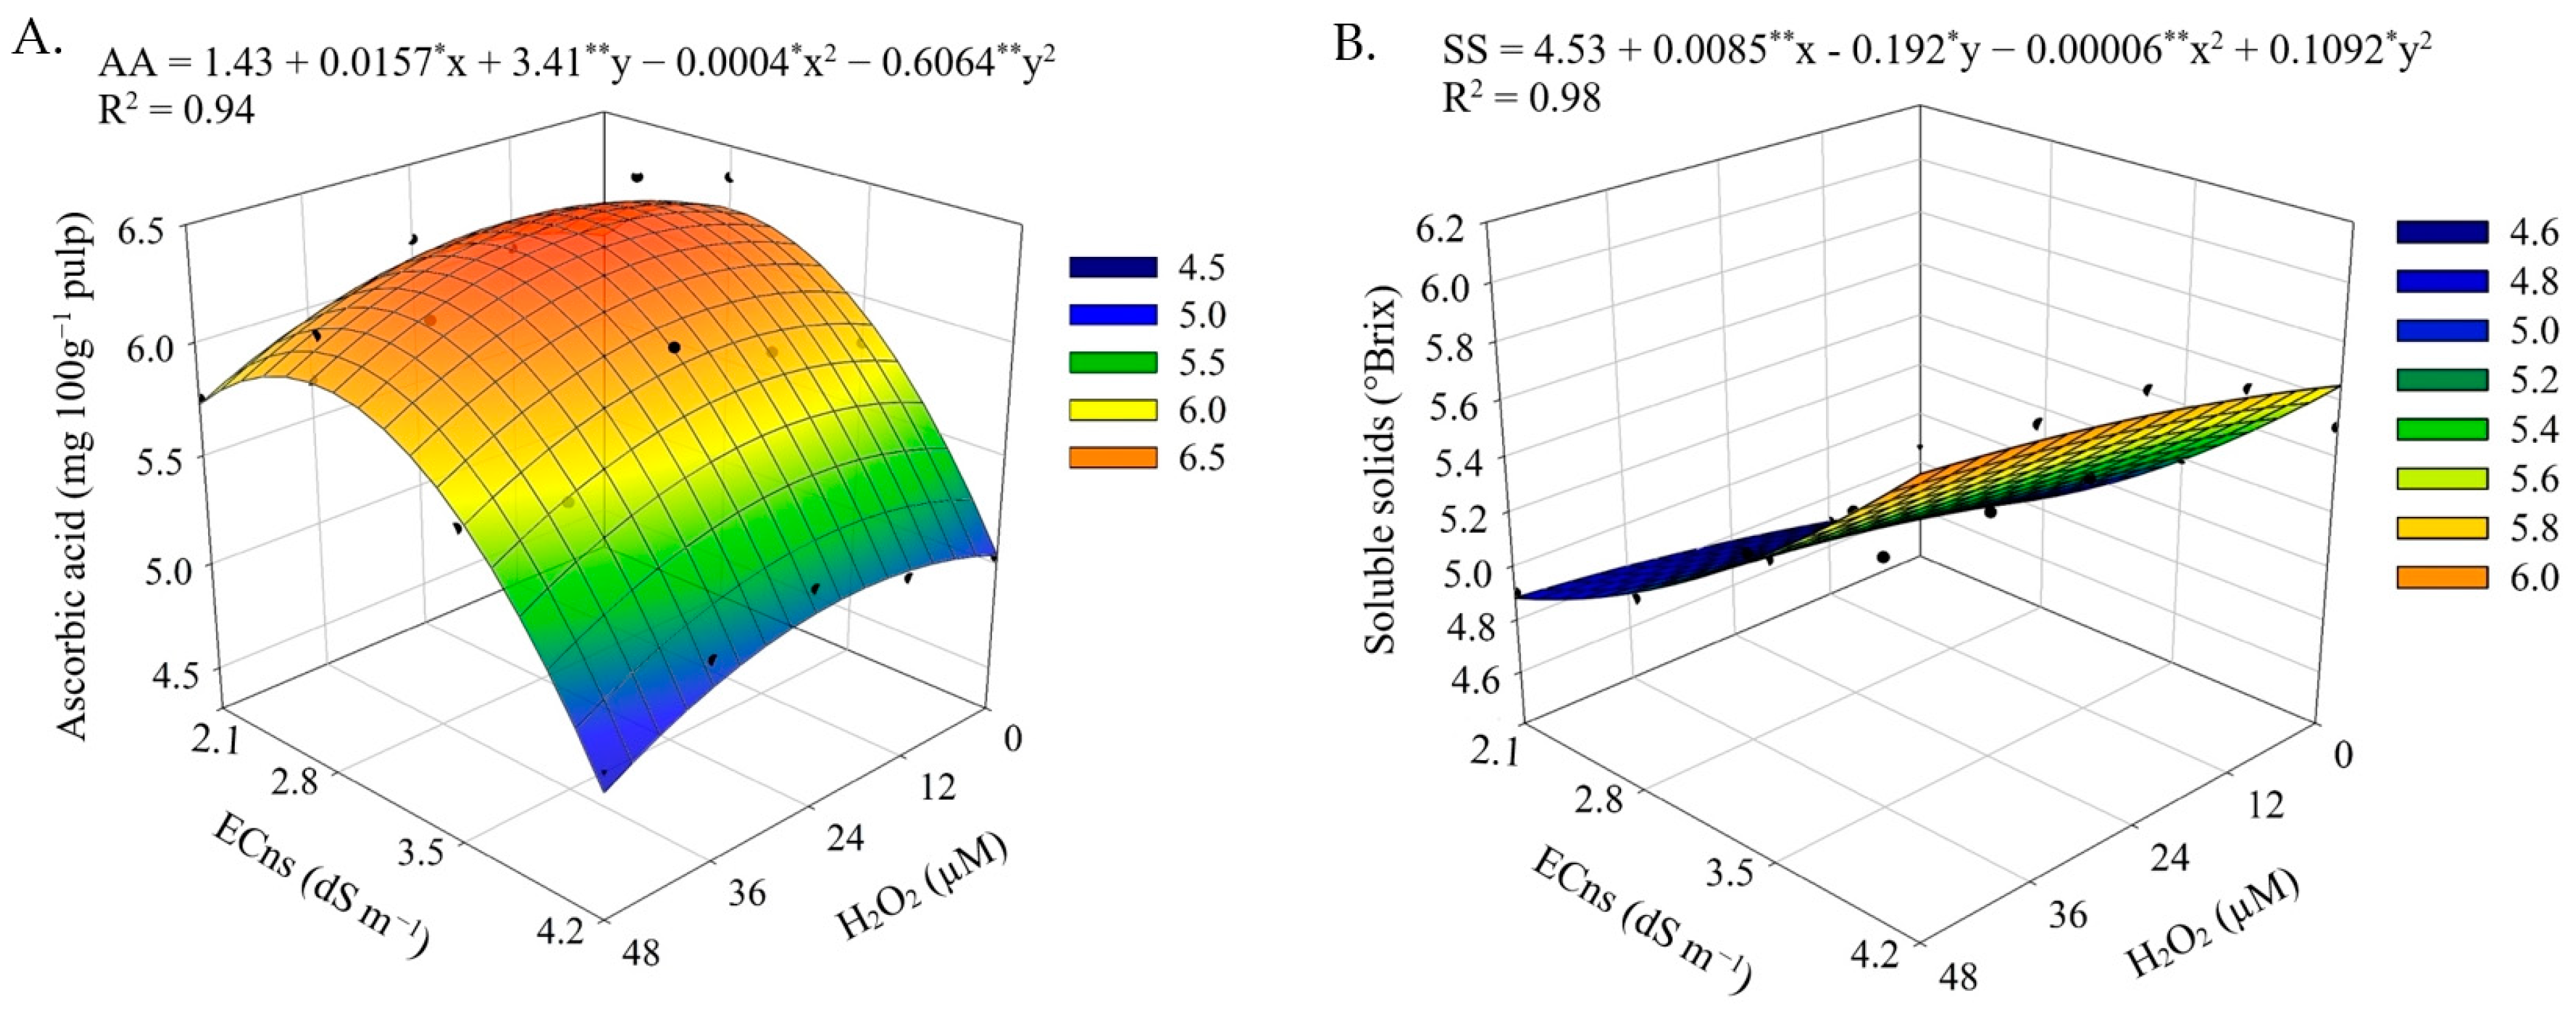
| Saline nutrient solution (ECns) | 3 | 0.11 ** | 7.01 ** | 3.39 ** | 15.25 ** | 3.76 ns |
| Linear regression | 1 | 0.31** | 6.62 * | 9.75 ** | 45.53 ** | 1.01 ns |
| Quadratic regression | 1 | 0.01 ns | 13.95 ** | 0.22 ns | 0.01 ns | 5.22 ns |
| Residual 1 | 6 | 0.003 | 0.14 | 0.004 | 0.04 | 1.35 |
| Hydrogen peroxide (H2O2) | 4 | 0.01 ns | 6.99 ** | 0.15 ** | 1.35 ** | 1.69 ns |
| Linear regression | 1 | 0.03 ns | 3.56 * | 0.61 ** | 5.30 ** | 0.32 ns |
| Quadratic regression | 1 | 0.01 ns | 11.87 ** | 0.01 ns | 0.01 ns | 6.16 ns |
| Interaction (ECns × H2O2) | 12 | 0.01 ns | 7.18 ** | 0.03 ** | 0.13 ns | 2.09 ns |
| Residual 2 | 34 | 0.004 | 0.10 | 0.002 | 0.05 | 1.92 |
| CV 1 (%) | 1.51 | 6.56 | 2.30 | 1.93 | 1.24 | |
| CV 2 (%) | 1.65 | 5.68 | 1.96 | 2.16 | 1.47 | |
| Source of Variation | DF | Mean Squares | |||
|---|---|---|---|---|---|
| ASH | FIB | EC | SU | ||
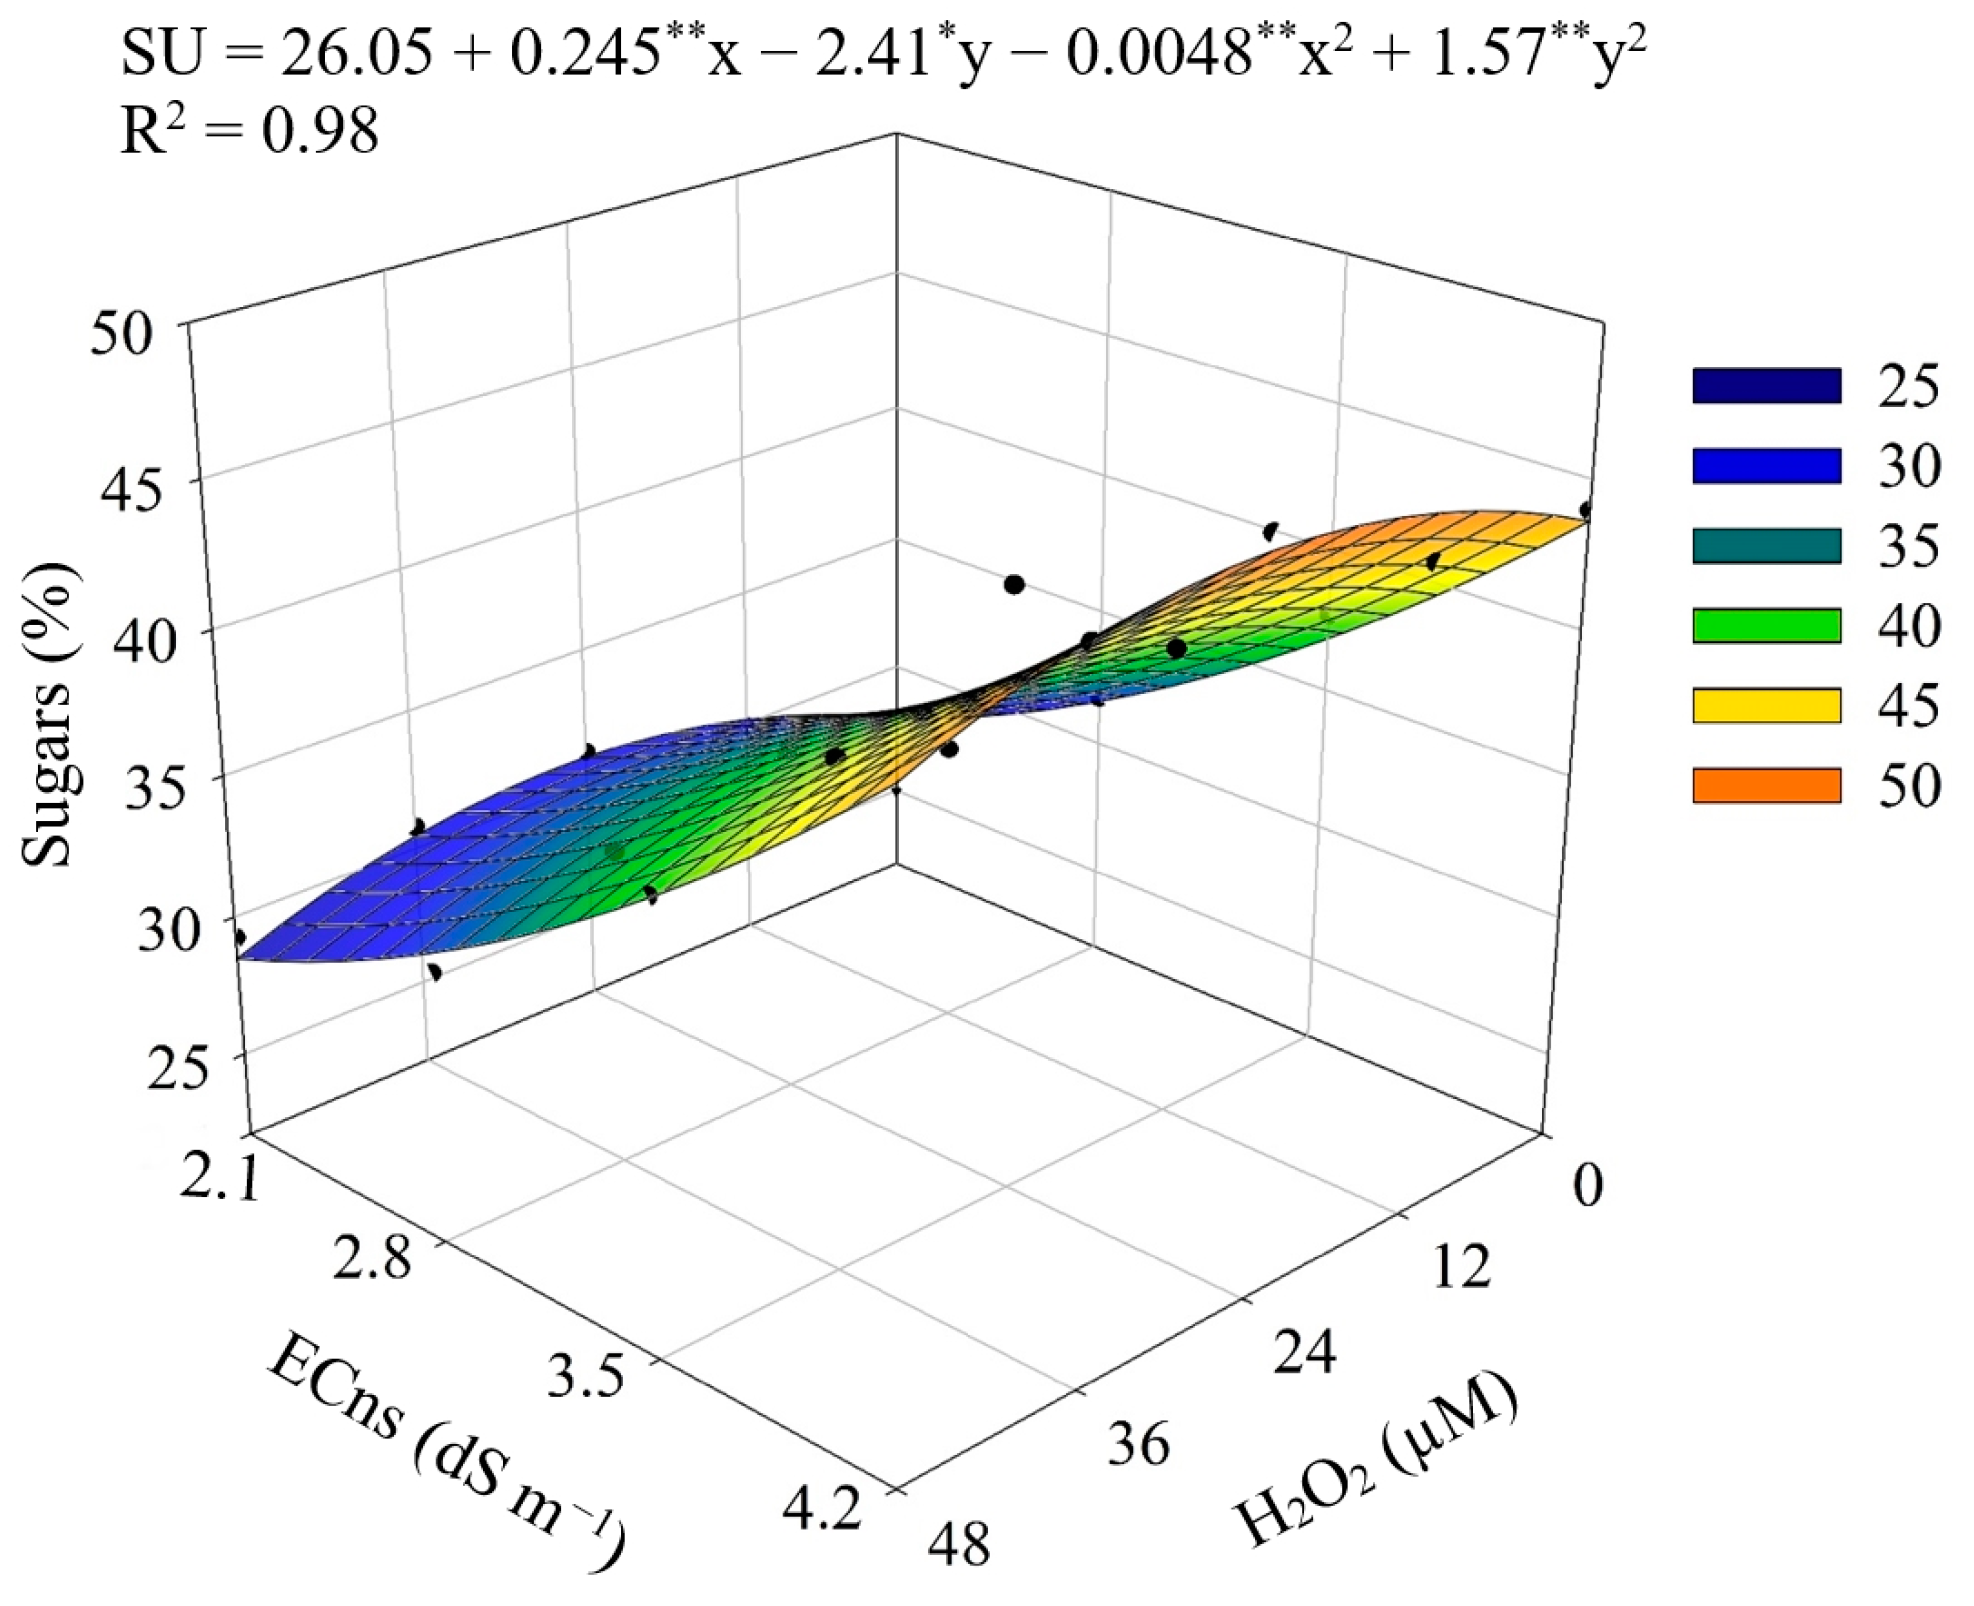
| Saline nutrient solution (ECns) | 3 | 0.19 ns | 1.92 ns | 4641.30 ns | 730.05 ** |
| Linear regression | 1 | 0.20 ns | 0.21 ns | 765.63 ns | 2153.66 ** |
| Quadratic regression | 1 | 0.13 ns | 1.23 ns | 10,662.93 ns | 15.61 ns |
| Residual 1 | 6 | 0.03 | 0.45 | 2607.54 | 0.21 |
| Hydrogen peroxide (H2O2) | 4 | 0.04 ns | 0.73 ns | 2960.55 ns | 42.54 ** |
| Linear regression | 1 | 0.03 ns | 2.50 ns | 6072.21 ns | 168.84 ** |
| Quadratic regression | 1 | 0.01 ns | 0.35 ns | 2900.36 ns | 0.40 ns |
| Interaction (ECns × H2O2) | 12 | 0.09 ns | 0.64 ns | 2468.51 ns | 1.92 ** |
| Residual 2 | 34 | 0.06 | 0.34 | 2476.38 | 0.27 |
| CV 1 (%) | 19.20 | 28.49 | 13.91 | 1.23 | |
| CV 2 (%) | 23.47 | 20.47 | 13.56 | 1.38 | |
Disclaimer/Publisher’s Note: The statements, opinions and data contained in all publications are solely those of the individual author(s) and contributor(s) and not of MDPI and/or the editor(s). MDPI and/or the editor(s) disclaim responsibility for any injury to people or property resulting from any ideas, methods, instructions or products referred to in the content. |
© 2023 by the authors. Licensee MDPI, Basel, Switzerland. This article is an open access article distributed under the terms and conditions of the Creative Commons Attribution (CC BY) license (https://creativecommons.org/licenses/by/4.0/).
Share and Cite
Guedes, M.A.; Silva, A.A.R.d.; Lima, G.S.d.; Gheyi, H.R.; Soares, L.A.d.A.; Silva, L.d.A.; Oliveira, V.K.N.; Fátima, R.T.d.; Nobre, R.G.; Nóbrega, J.S.; et al. Hydroponic Cultivation of Laranja Cherry Tomatoes under Salt Stress and Foliar Application of Hydrogen Peroxide. Agriculture 2023, 13, 1688. https://doi.org/10.3390/agriculture13091688
Guedes MA, Silva AARd, Lima GSd, Gheyi HR, Soares LAdA, Silva LdA, Oliveira VKN, Fátima RTd, Nobre RG, Nóbrega JS, et al. Hydroponic Cultivation of Laranja Cherry Tomatoes under Salt Stress and Foliar Application of Hydrogen Peroxide. Agriculture. 2023; 13(9):1688. https://doi.org/10.3390/agriculture13091688
Chicago/Turabian StyleGuedes, Maria Amanda, André Alisson Rodrigues da Silva, Geovani Soares de Lima, Hans Raj Gheyi, Lauriane Almeida dos Anjos Soares, Luderlândio de Andrade Silva, Valeska Karolini Nunes Oliveira, Reynaldo Teodoro de Fátima, Reginaldo Gomes Nobre, Jackson Silva Nóbrega, and et al. 2023. "Hydroponic Cultivation of Laranja Cherry Tomatoes under Salt Stress and Foliar Application of Hydrogen Peroxide" Agriculture 13, no. 9: 1688. https://doi.org/10.3390/agriculture13091688