Article

Classification and Detection of Rice Diseases Using a 3-Stage CNN Architecture with Transfer Learning Approach

1
Department of Computer Engineering and Application, GLA University, Mathura 281406, India
2
Faculty of Agricultural Sciences, GLA University, Mathura 281406, India
3
Department of Computer Science, Assam University, Silchar 788011, India
4
Agriculture Victoria, Grains Innovation Park, Horsham, VIC 3400, Australia
5
School of Applied Systems Biology, La Trobe University, Bundoora, VIC 3083, Australia
*
Author to whom correspondence should be addressed.
Agriculture 2023, 13(8), 1505; https://doi.org/10.3390/agriculture13081505
Submission received: 27 May 2023 / Revised: 29 June 2023 / Accepted: 25 July 2023 / Published: 27 July 2023

Abstract

:
Rice is a vital crop for global food security, but its production is vulnerable to various diseases. Early detection and treatment of rice diseases are crucial to minimise yield losses. Convolutional neural networks (CNNs) have shown great potential for disease detection in plant leaves, but training CNNs requires large datasets of labelled images, which can be expensive and time-consuming. Here, we have experimented a 3-Stage CNN architecture with a transfer learning approach that utilises a pre-trained CNN model fine-tuned on a small dataset of rice disease images. The proposed approach significantly reduces the required training data while achieving high accuracy. We also incorporated deep learning techniques such as progressive re-sizing and parametric rectified linear unit (PReLU) to enhance rice disease detection. Progressive re-sizing improves feature learning by gradually increasing image size during training, while PReLU reduces overfitting and enhances model performance. The proposed approach was evaluated on a dataset of 8883 and 1200 images of disease and healthy rice leaves, respectively, achieving an accuracy of 94% when subjected to the 10-fold cross-validation process, significantly higher than other methods. These simulation results for disease detection in rice prove the feasibility and efficiency and offer a cost-effective, accessible solution for the early detection of rice diseases, particularly useful in developing countries with limited resources that can significantly contribute toward sustainable food production.

1. Introduction

The global population is projected to reach 9.7 billion by 2050, creating a pressing need to increase food production rapidly. Rice is a crucial crop for global food security, being the second-most produced crop worldwide and a staple food for over half of the global population. India is the second-largest producer of rice in the world, accounting for 24% of global production [1,2]. However, numerous factors, such as pests, diseases, bacteria, viruses, temperature, rainfall, and soil fertility, can significantly affect the yield and quality of rice crops. Rice diseases are a significant concern in rice production, as they can cause significant yield losses and impact food security [3]. Rice diseases can be broadly classified into fungal, bacterial, and viral diseases. Fungal diseases, such as brown spot and leaf blast, are caused by fungus. Bacterial diseases, such as bacterial leaf blight, are caused by Xanthomonas. Viral diseases, like tungro, are caused by viruses, such as rice tungro spherical virus (RTSV) and rice tungro bacilliform virus (RTBV) [4]. Each rice disease has specific symptoms that helps in their identification and classification. Understanding the pathogenesis of rice diseases is essential for effective management strategies [5]. Despite dedicated time and resources to managing diseases [6], timely disease detection is a major challenge, and by the time disease symptoms are detected and actions are taken to control disease, significant damage has already been done, resulting in reduced production. It is tedious for farmers to timely inspect the entire crop [7]. Therefore, early detection and identification of crop plant diseases are important in agriculture for preventing yield loss and maintaining product quality [8].
Fortunately, the convergence of computer science and technology has made it possible to detect crop diseases quickly and with minimal training by using artificial intelligence (AI) analytics [9]. Deep learning (DL), particularly convolutional neural networks (CNNs), has recently surpassed machine learning (ML) techniques for image categorisation [9,10,11]. Several articles have been published on the topic of disease classification using AI-based methods. The CNN model establishes a link between image layers and spatial information, making it useful for image categorization [12]. There have been few studies on rice disease categorisation using CNN. For example, Lu et al. [13] used 500 photos from 10 different categories and analysed by CNN model comprising three layers of convolution, three stochastic pooling layers, and a softmax layer. Rajmohan et al. [14] investigated deep CNN for image de-noising and support vector machine (SVM) for rice plant disease categorisation using colour and shape information on 200 images and reported 87.5% categorisation accuracy.
However, CNN requires a large amount of training data to be properly trained and collecting accurate images of a given type of diseased leaf in rice is a difficult operation. This constraint can be circumvented using the transfer learning technique which modifies the weights of previously trained networks on big data sets for the present small dataset [15]. This study experimented a 3-Stage CNN architecture that incorporates transfer learning and progressive resizing to consider various factors affecting model performance, such as effective regularisation approaches, active data augmentation, and large-scale data [16]. The transfer learning technique shortens training time, mitigates overfitting in networks, and solves the problem of insufficient training data in deep models [17]. In addition, progressive resizing helps fine-tune the final model and boosts accuracy by gradually increasing the scale of images used in the training process from small to large. The parametric rectified linear unit (PReLU) activation function has been used in the dense layers of the proposed model, which is a generalisation of the conventional rectified unit [18]. PReLU improves model fitting with little computational overhead and almost no overfitting risk.
This research implemented the 3-stage deep CNN model to identify five major rice diseases in the midland area of India. The dataset used for training and testing contained images from various regions of India. This study aimed to identify the most effective approach to using AI, neural networks, and ML in rice disease detection. By improving disease identification and classification, farmers can timely control disease and prevent yield loss and improve crop quality, ultimately contributing to global food security.

2. Materials and Methods

2.1. Model Selection for Early Detection of Rice Diseases

With the progress of DL in recent years, various deep architectures have been introduced for image classification, such as CNNs, R-CNNs, Caps Nets, and ResNets, which allow for the extraction of deep-level attributes [19,20]. Both ML and DL algorithms are used to tackle problems in agriculture research [21]. This research aims to automate tasks that are usually performed by humans, with the added value of machines performing these tasks. Deep learning technology has shown great promise in plant disease classification from images, which is a technique based on feature learning from labelled training data sets. For instance, this technique is used for diseases of tea, apple, tomato, grapes, peaches, and pears, mostly using leaves to identify diseases from images [22,23]. Table 1 provides a comparison of various machine-learning techniques used for target disease detection.

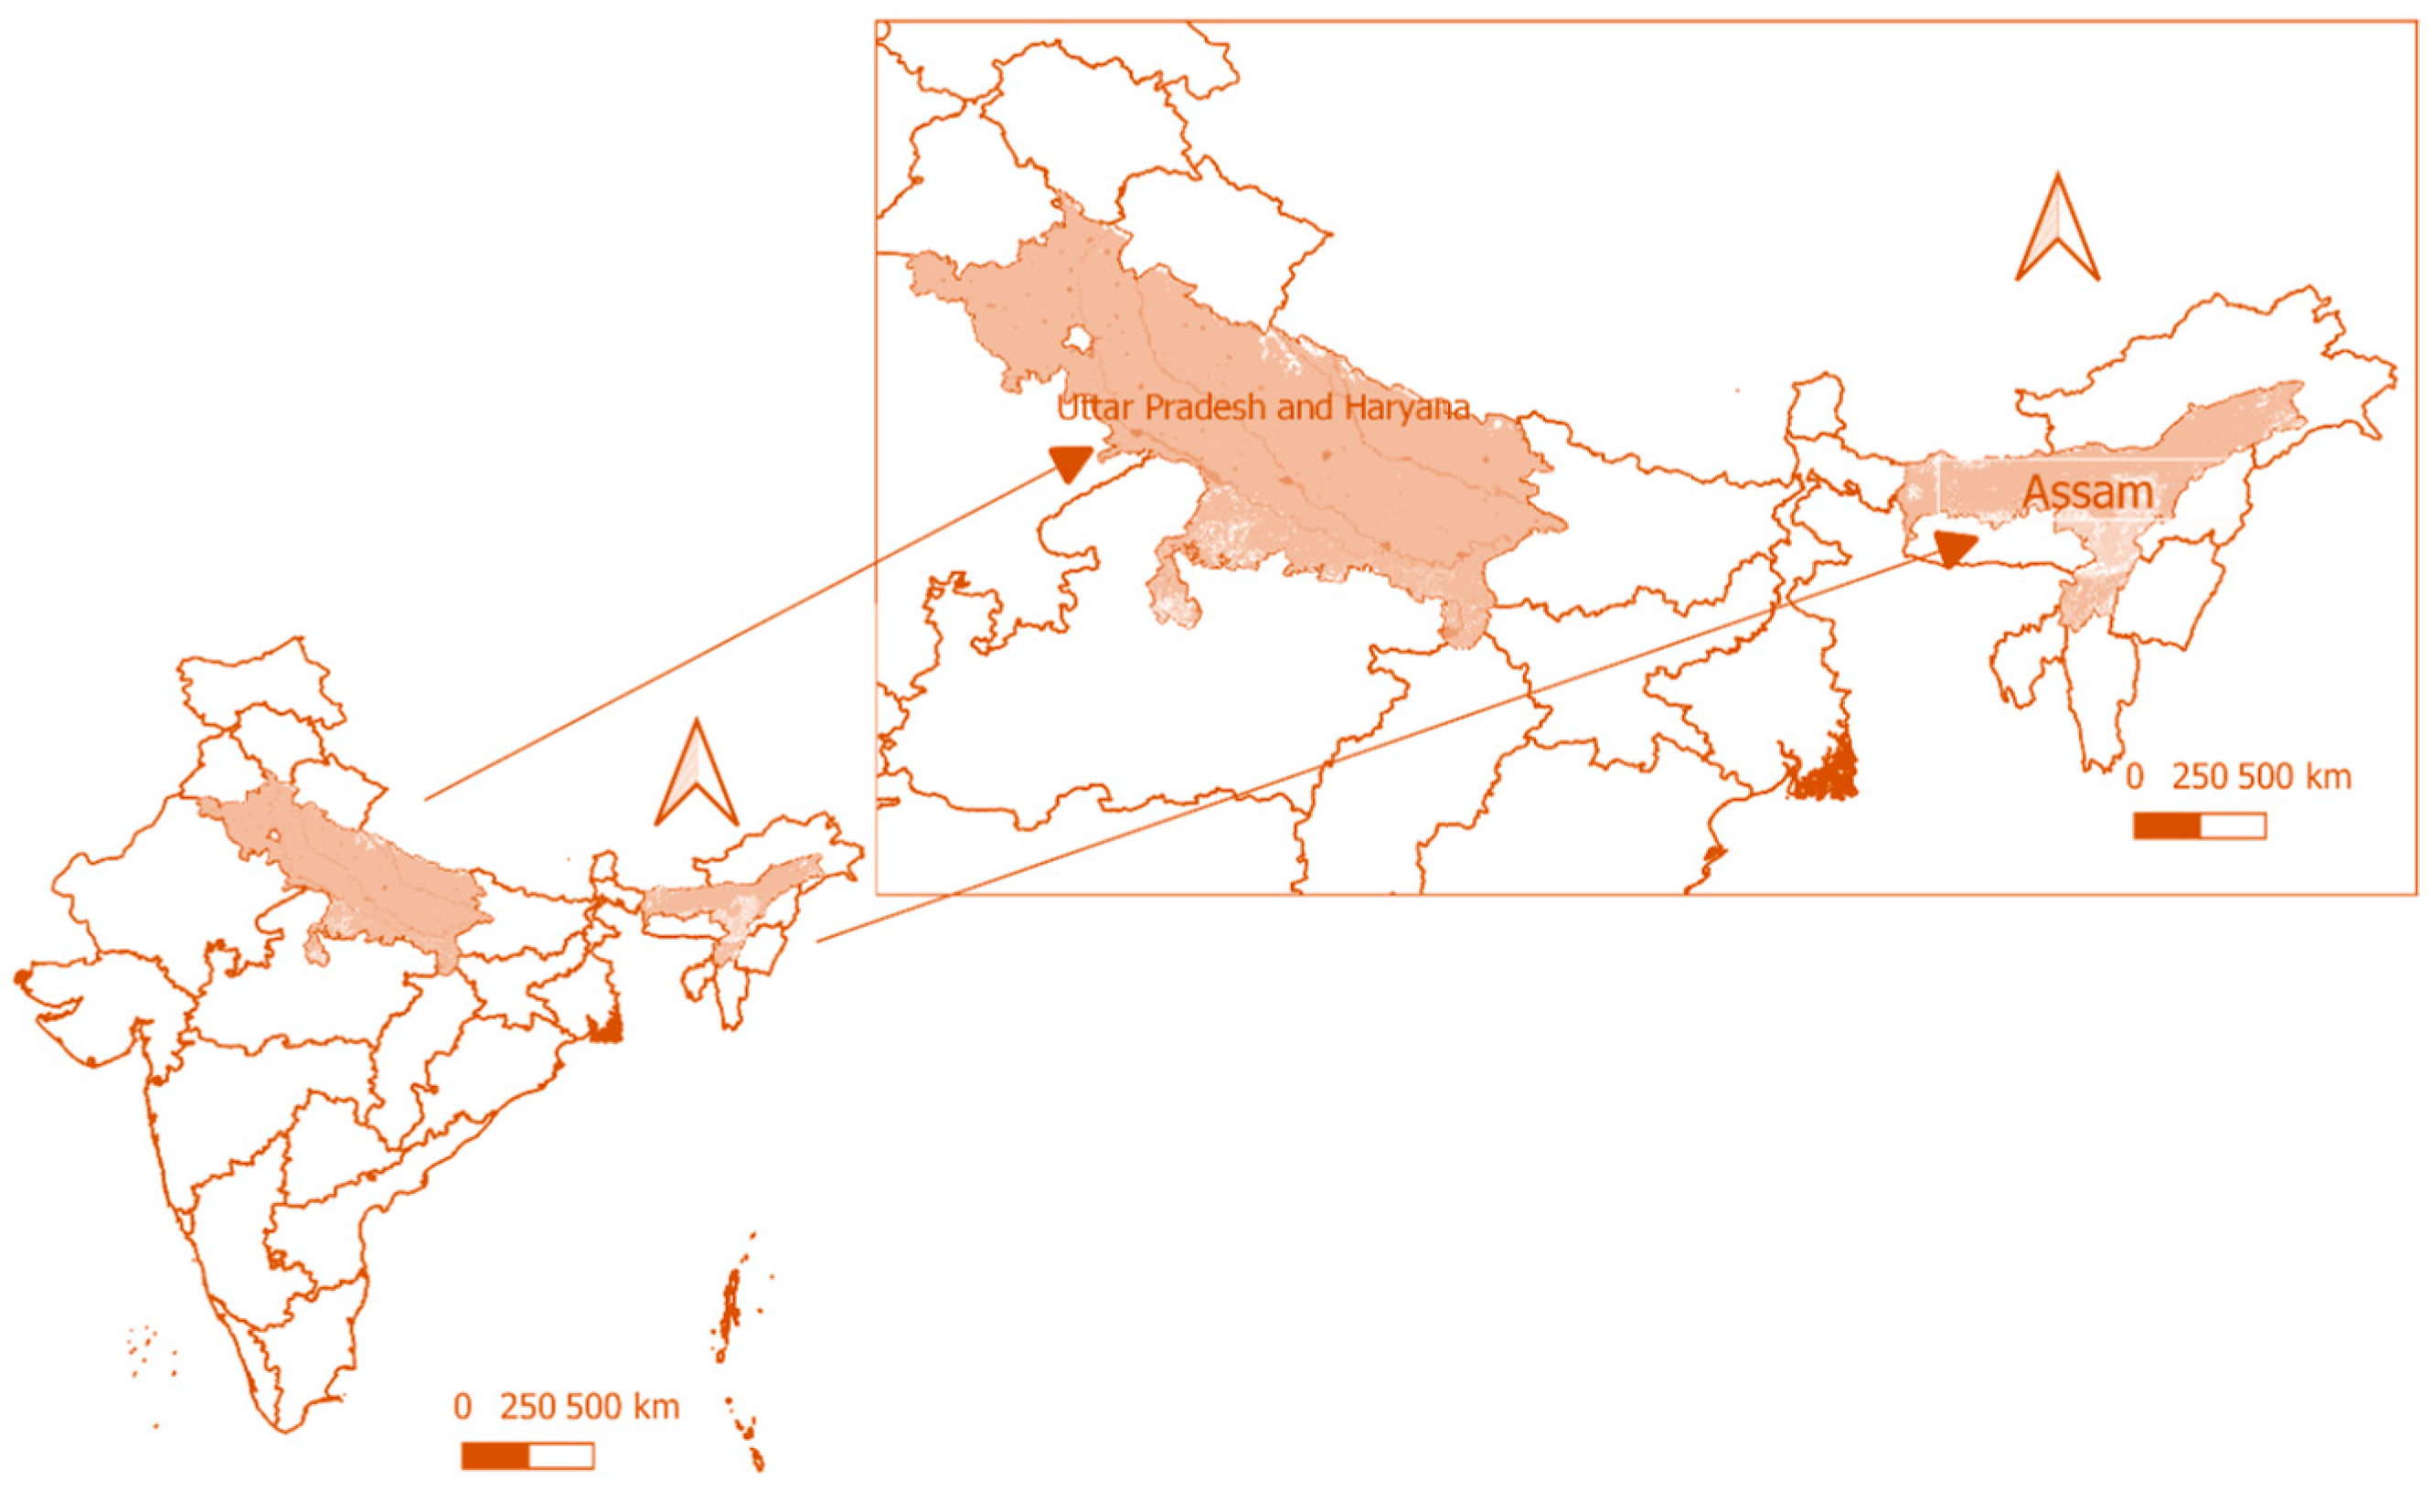
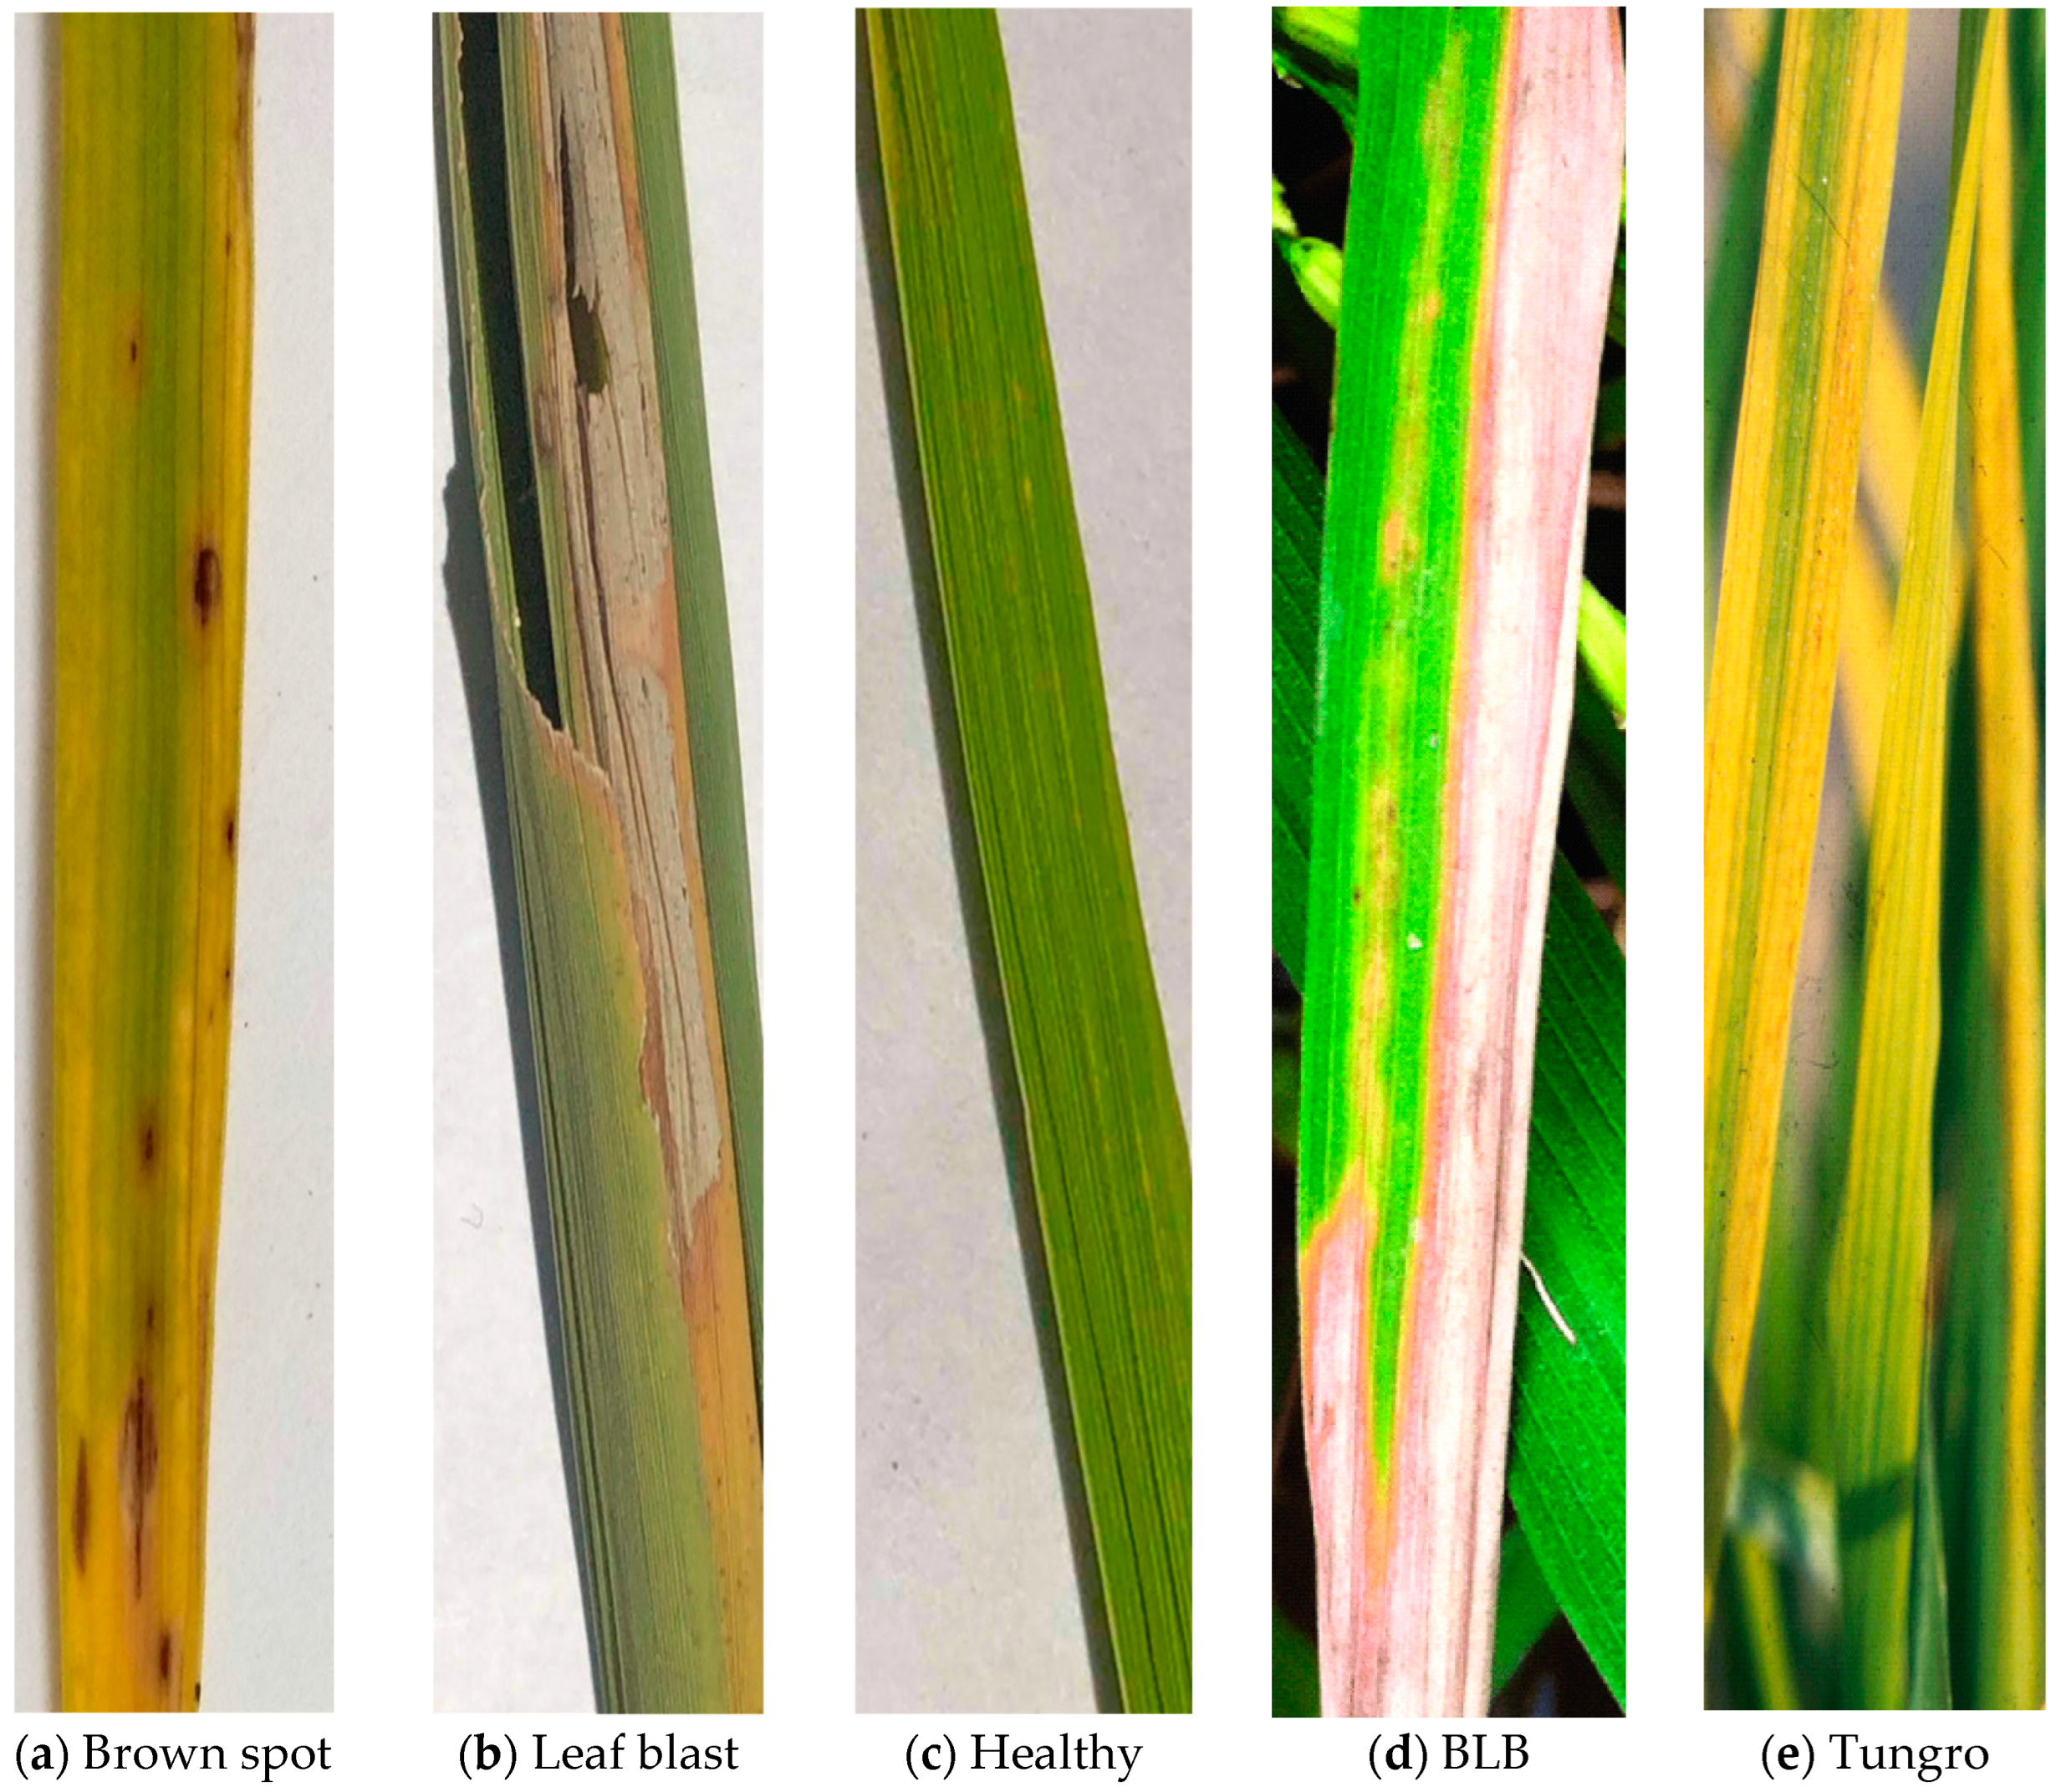
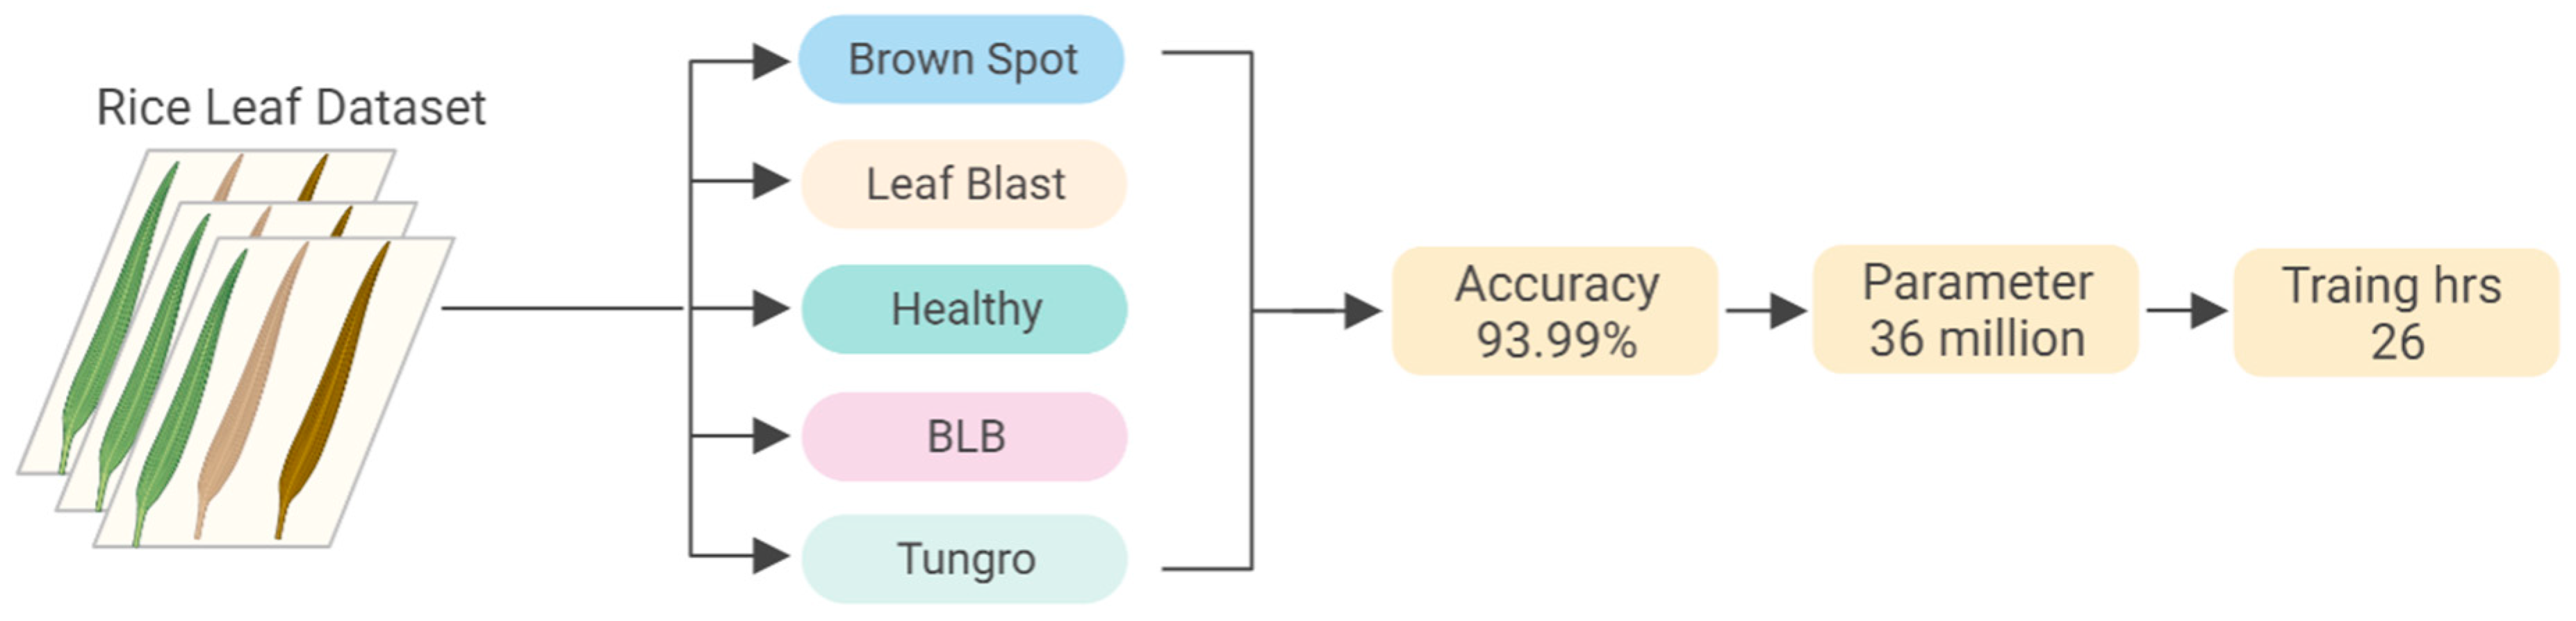
2.2. Data Collection and Training
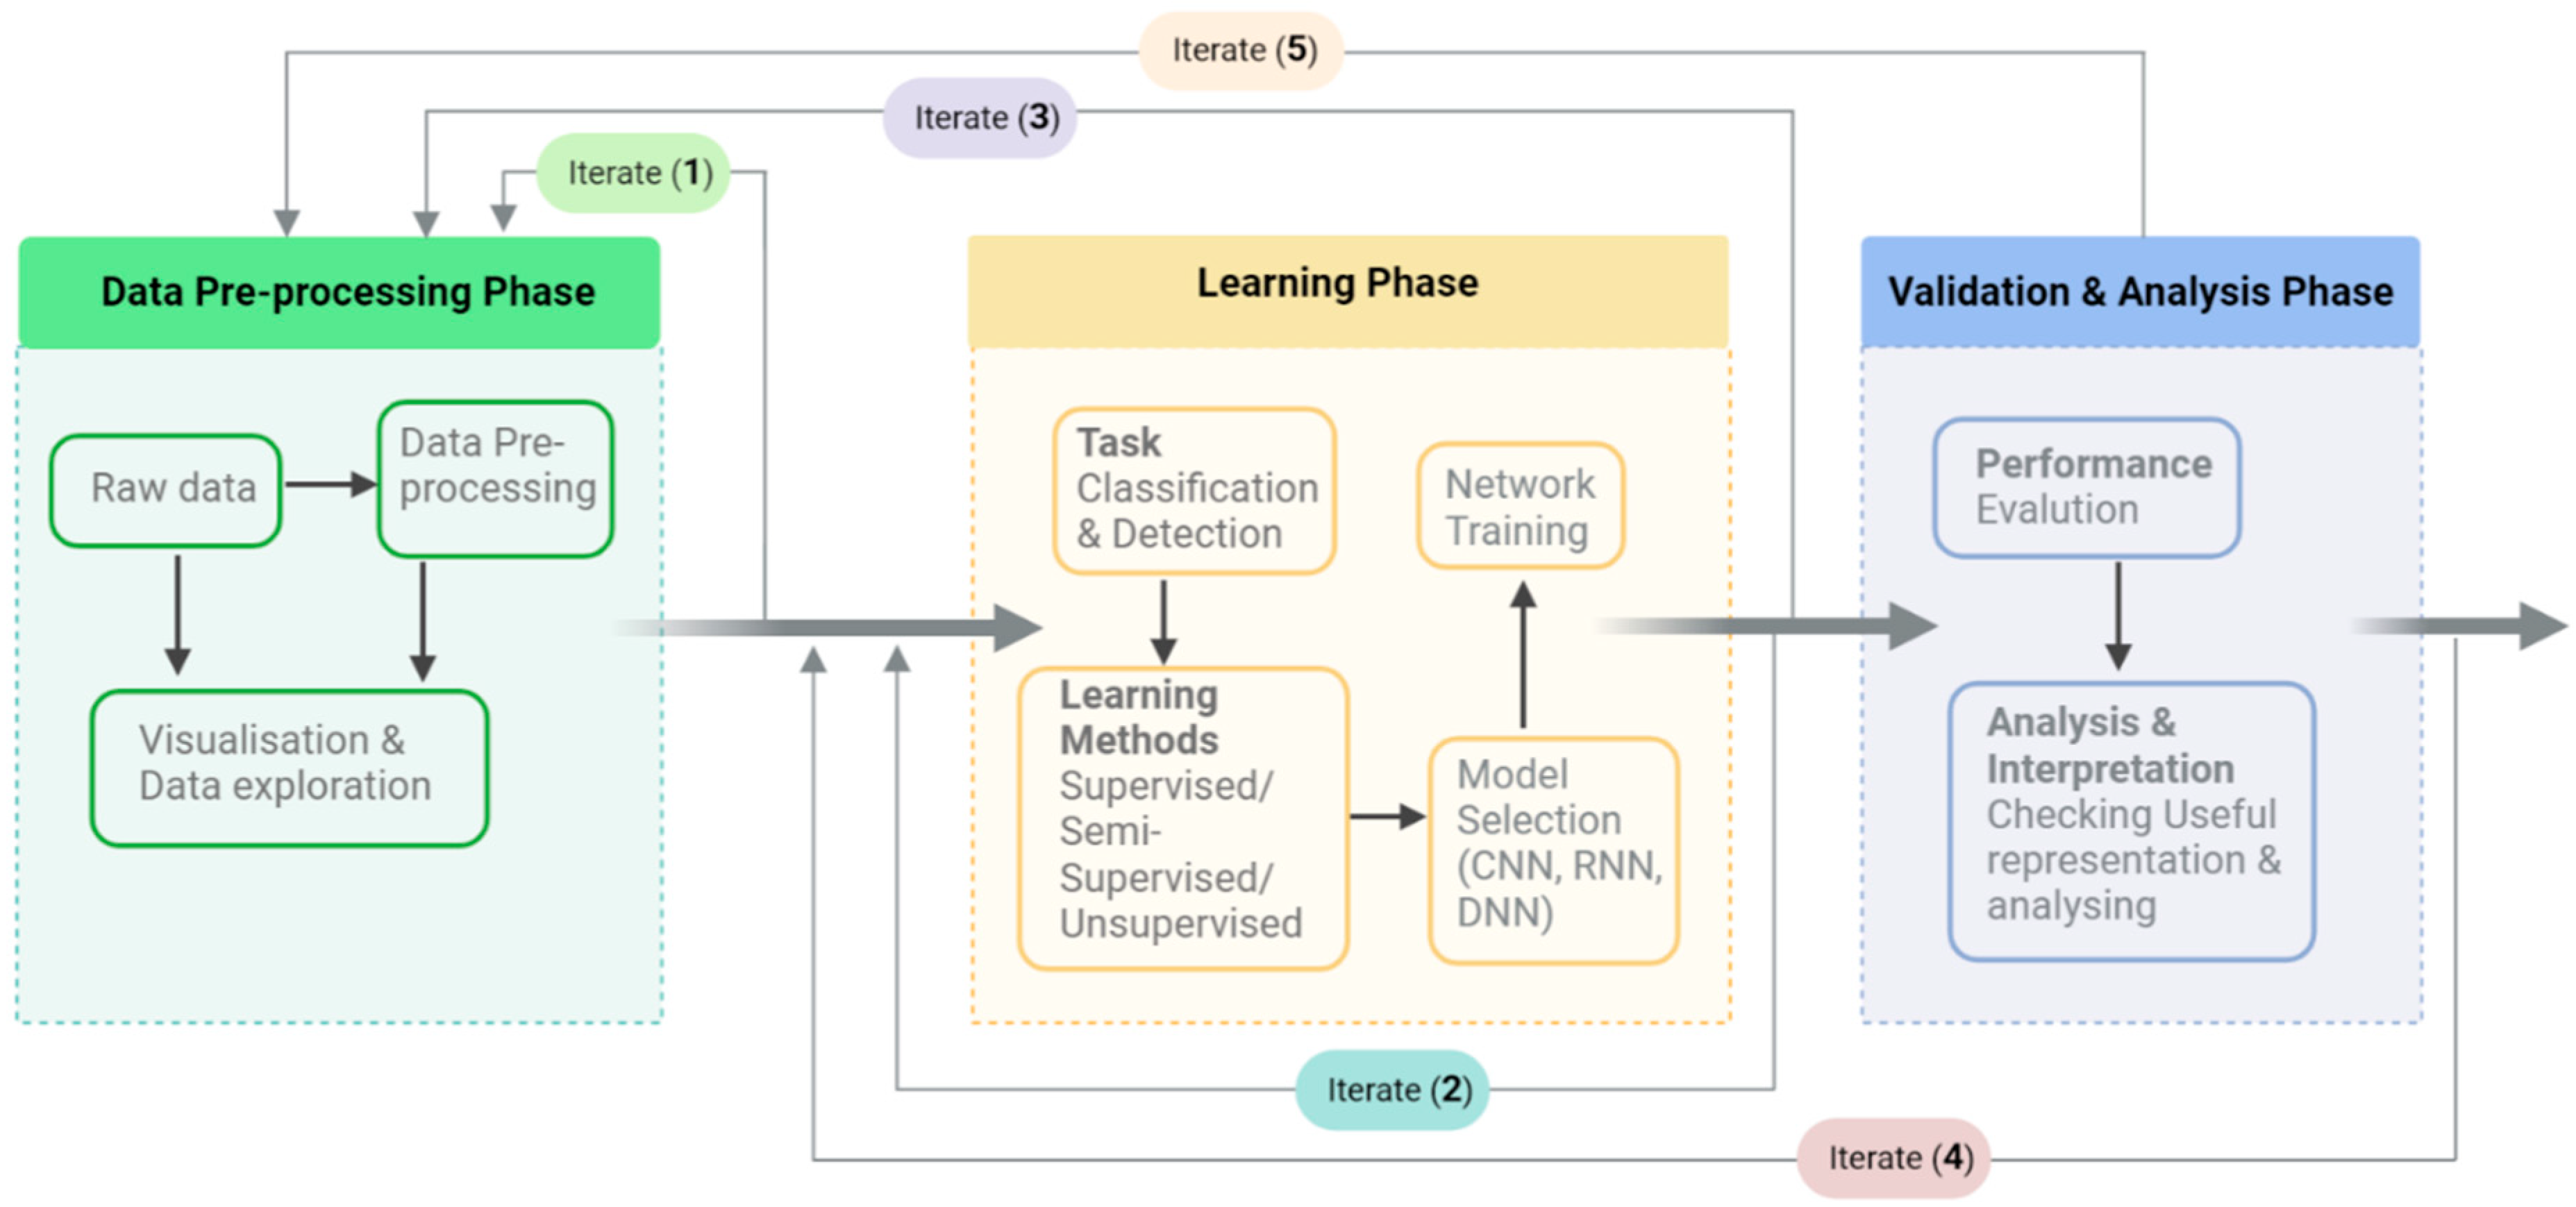
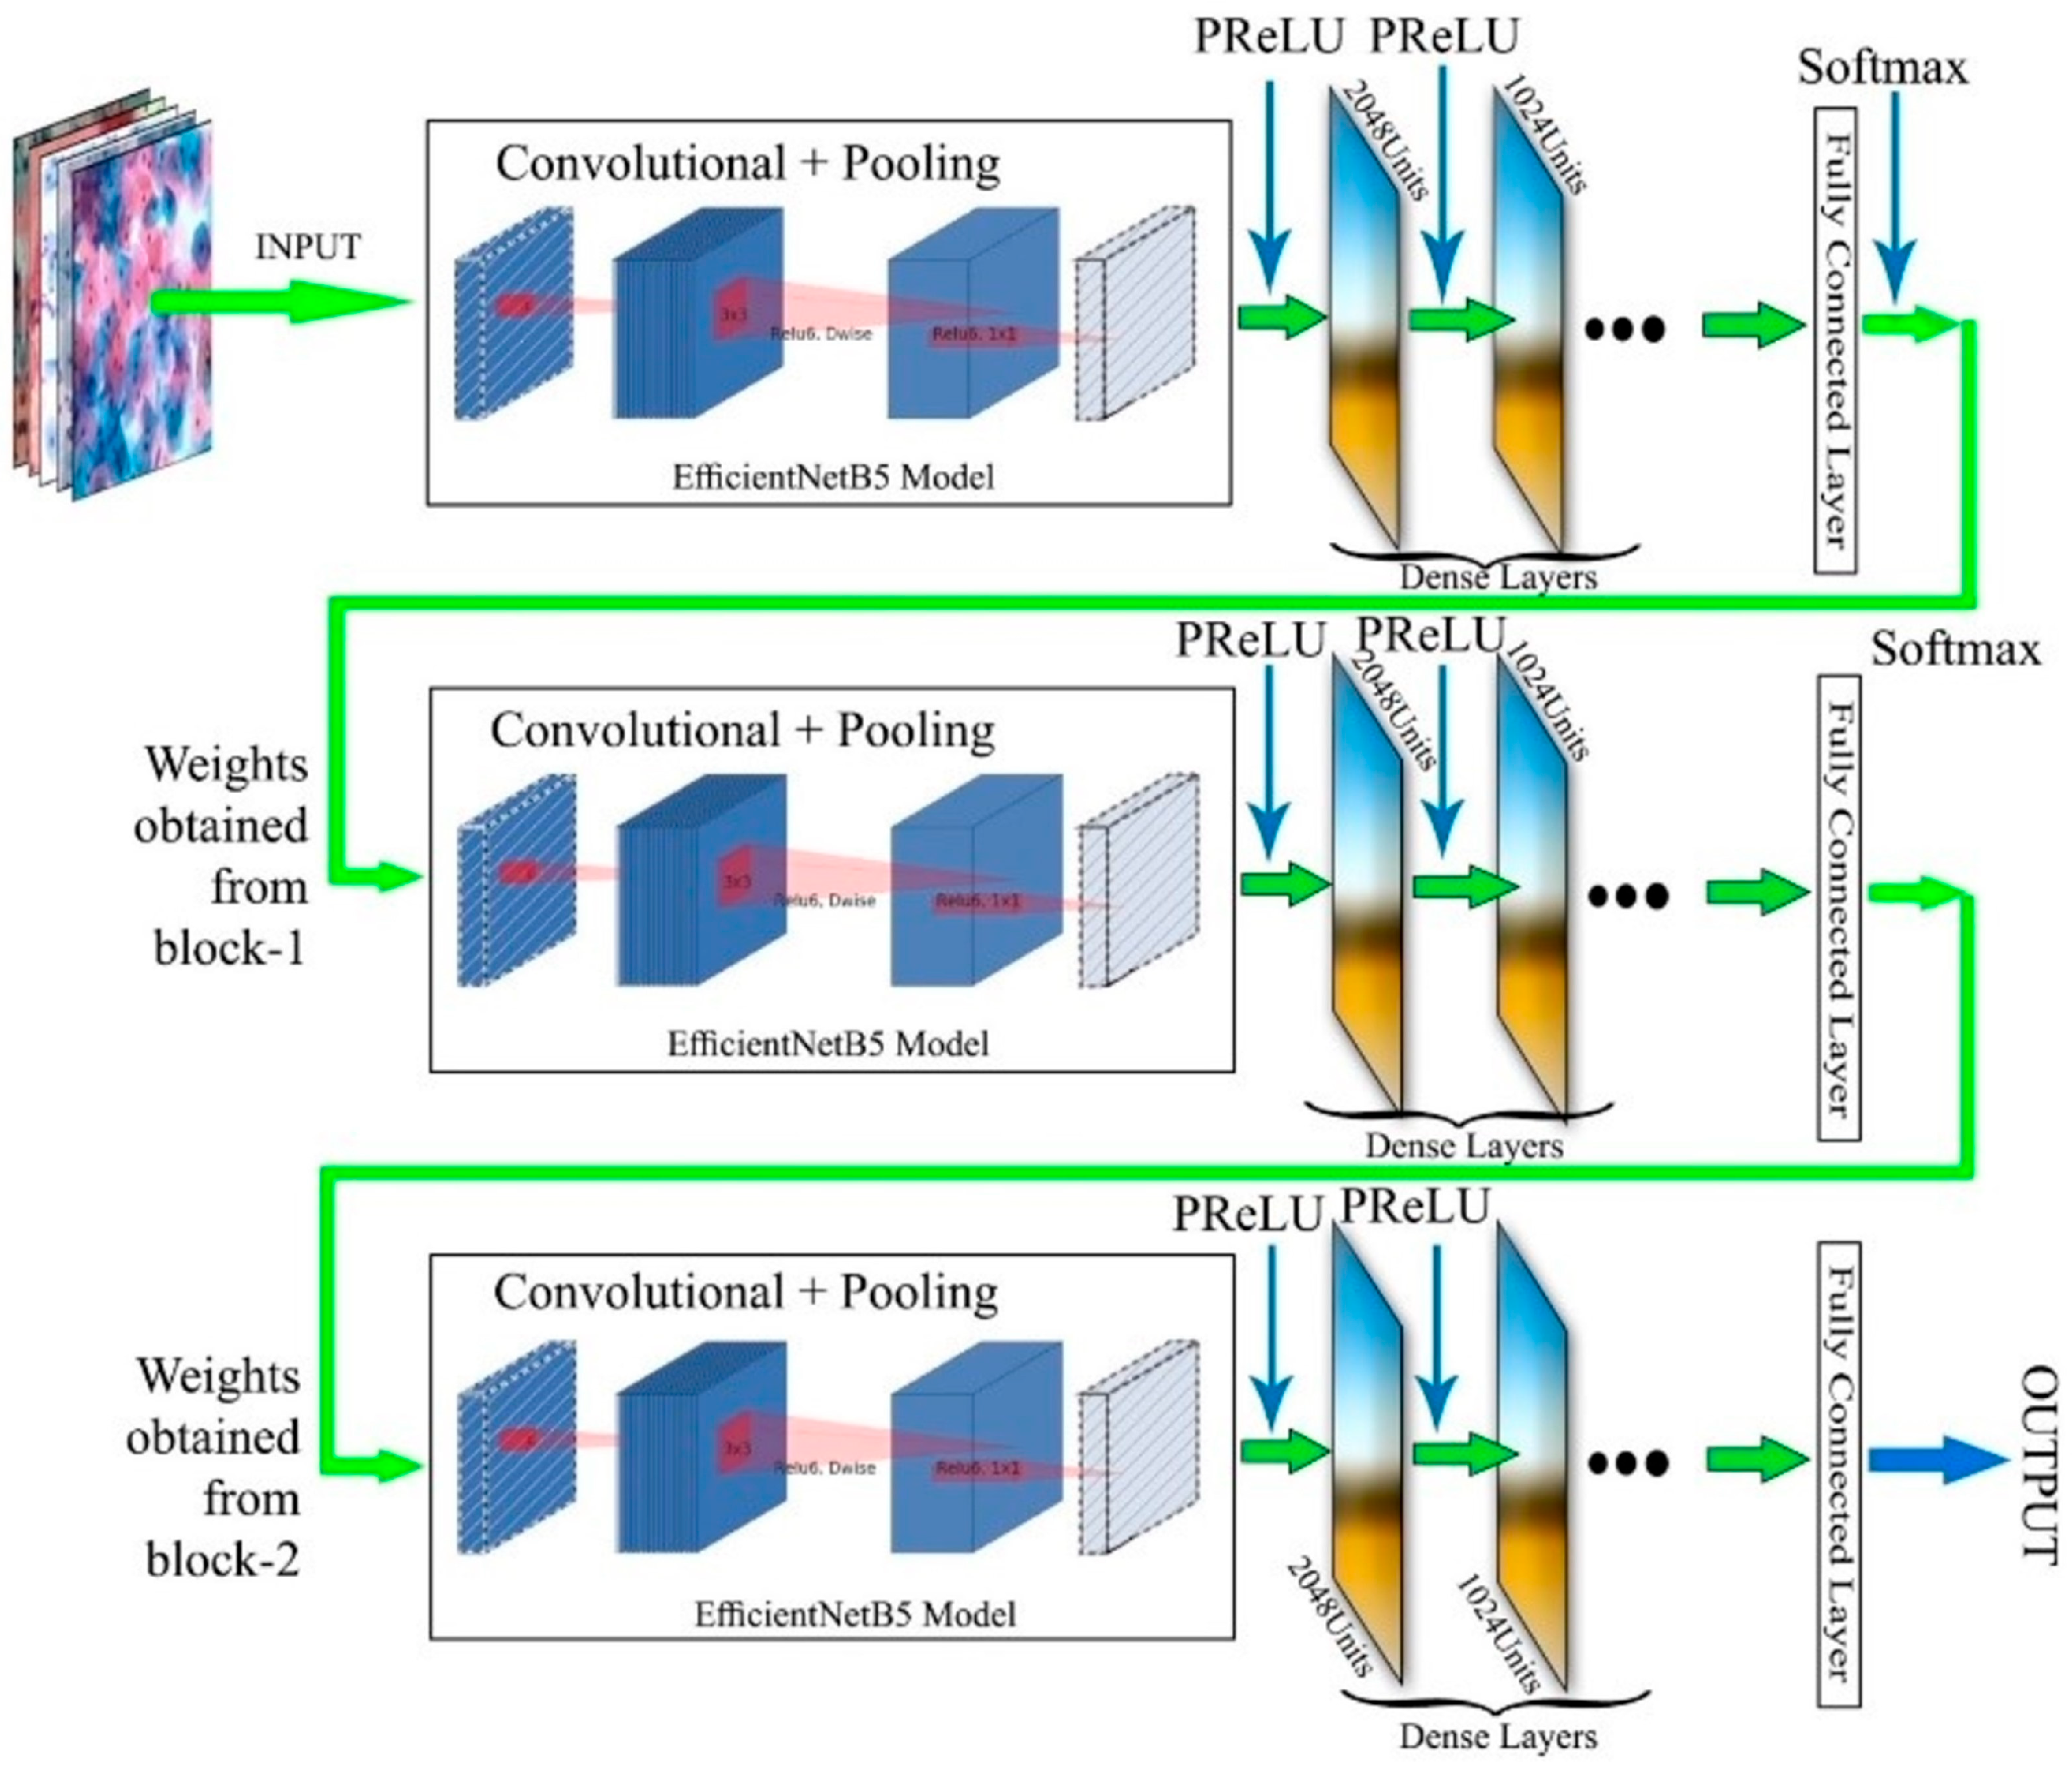
Images for the dataset were collected from various regions of India, including the states of Uttar Pradesh, Haryana, and Assam (Figure 1). The climate of Uttar Pradesh and Haryana falls under the sub-tropical region. In contrast, the climate of Assam is characterised by alternate cool and warm periods with high humidity. Samples of healthy and diseased rice plants were collected from various locations to identify diseases affecting rice plants in these states.
We developed a Deep CNN model based on images to classify rice leaf diseases. The model comprises three phases: data processing, learning, and result analysis. Data processing includes data collection, noise elimination, labelling, and visualisation. During the learning phase, tasks and learning strategies are determined to train the deep neural network. The model’s hidden representations are analysed through performance evaluation and validation. Figure 2 illustrates the classification workflow, with arrows representing the iterative design process. The backward arrows in each phase indicate iterations and updates based on the model’s performance. For example, the Iterate (1) arrow in the data-processing phase indicates room for improvement in the raw instances, while Iterate (2) represents adjusting the data-processing stage based on the learning phase. If the model overfits the training data, Iterate (3) may be used to shorten the training phase. The Iterate (4) arrow indicates that the validation and analysis phase results inform the next data processing round. The Iterate (5) arrow indicates the normal completion of the data processing.

2.3. System Model

The DL approach is a powerful tool that utilises multiple representations to learn feature hierarchies. Its primary goal is to generate features at the top of the hierarchy from those at the bottom. Deep CNN-based image classification has proven to be a highly effective approach in computer vision, outperforming more traditional ML methods (Figure 3). One of the main advantages of CNN networks is their ability to perform automatic feature design [44], thus eliminating the need for more traditional feature extraction techniques like SIFT, HOG, and GIST.
In this implementation, we utilised a split-and-train technique, transfer learning, and progressive scaling to construct deep CNN models. Additionally, the model’s dense layers have been activated with the generalised traditional rectified unit, known as the Parametric Rectified Linear Unit (PreLU), to enhance the accuracy of the representation. This approach has a low risk of overfitting and improves model fitting with almost no discernible increase in computational cost. To enhance comprehension, we divided the concepts and procedures into several steps.

2.3.1. Transfer Learning

CNNs are a powerful tool for image classification. However, training a CNN from scratch can be time-consuming and expensive, especially if a large dataset is not available. A common approach is to pre-train a CNN on a large dataset, such as ImageNet, and then fine-tune it on a dataset. This approach, called transfer learning, has become increasingly popular, particularly when the training and test data are not required to be independent and identically distributed [45]. Moreover, it can save a lot of time and effort, help to improve model performance, and generalise the model to new datasets. Transfer learning can be implemented in different ways. One way is to use a pre-trained CNN as a feature extractor by freezing its weights and only training the last few layers. This is suitable for small datasets. Another way is to fine-tune a pre-trained CNN by unfreezing its weights and training the entire model on a new dataset, which is more suitable for large datasets.
To implement transfer learning in the proposed 3-Stage CNN model, we used EfficientNET B7, developed by Mingxing Tan and Quoc Le of the Google Research Brain team. In terms of accuracy and computing efficiency for image classification, EfficientNet surpasses the current state of the art. Based on the EfficientNET architecture, the network’s classification accuracy improves with increasing depth, width, and resolution. Efficient net adheres to the compound scaling formula, making it more efficient than other previously developed pre-trained networks. The EfficientNet family is scaled up in various block layers (from B0 to B7 using a compound scaling method). By using EfficientNET B7 as a transfer learning network, we were able to leverage the network’s pre-trained weights and significantly speed up the training process while achieving high classification accuracy.

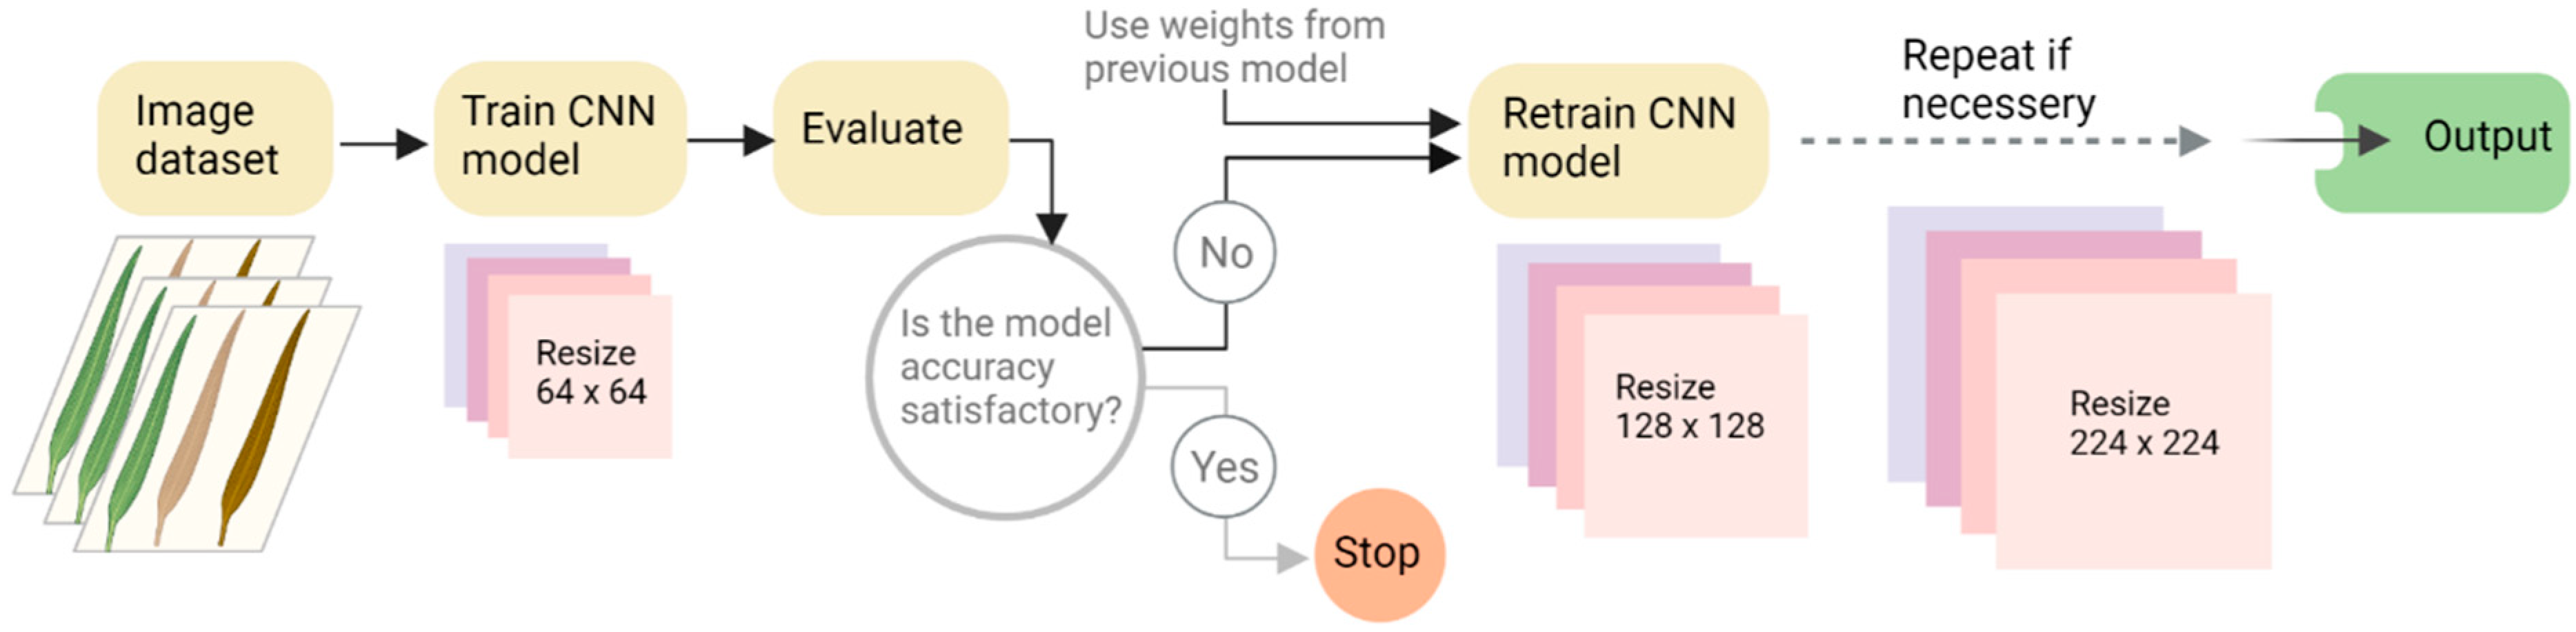
2.3.2. Progressive Re-Sizing

DL networks incorporated a progressive image resizing technique to enhance their performance, as documented by [46]. This method involves training CNN models with a gradually increasing dataset size, starting from smaller images such as 128 × 128 pixels. The weights of the first model are then utilised to train a second model on larger images of size 256 × 256 pixels, and so on, to fine-tune the models and improve their accuracy scores. The architecture of larger models incorporates the layers and weights of earlier smaller models to further refine their performance. Despite the resolution of the images being changed from 64 × 64 to 128 × 128 pixels, the human eye may not discern the difference, but it provides CNN models with a fresh dataset to practice and improve their learning as shown in Figure 4.

2.3.3. PreLU Activation

Additionally, we used the PreLU activation function on the dense layers of the 3-Stage CNN model, which generalises the standard rectified unit [47] by introducing a learnable slope parameter for negative values. This allows the PreLU function to better capture the non-linearities in the data, which can lead to improved performance on classification tasks. PreLU also has the benefit of being computationally efficient and less prone to overfitting than other activation functions. The activation function of a neural network can be defined as in Equation (1):
L X i = X i a i X i , i f   i f   X i X i > > 0 0
The slope of the negative component of the PreLU function is determined by the coefficient X i , which is the input to the ith nonlinear activation function L. This allows the PreLU function to be differentially expressed in different channels, as shown by the ith in a i . ReLU is the name given to the activation function when the coefficient ( a i = 0), while PreLU is the name given to Equation (1) when ( a i ) is a learnable parameter [47]. Figure 5 presents the results of the experiment using the Deep CNN model.
The proposed Deep 3-Stage CNN model was built in three stages using the pretrained architecture of EfficientNet7 as a transfer learning model (Figure 5) [48]. Layers were added using the compound scaling concept. The PreLU activation was used in the dense layers of the proposed architecture, which allows the parameter to be adaptively learned from the data. The controlling coefficient ( a i ) regulates the negative slope by adaptively learning the parameters. The proposed Deep 3-Stage CNN model incorporates a progressive rescaling technique on images to boost accuracy while taking both image size and the regularization parameter into account. The split and train strategy, which is an enhancement of progressive learning, was implemented to achieve a faster training time and better re-sizing dataset.
Adding more layers to a network increases its complexity, making it more difficult to train. This is because the network has more parameters to learn, and the loss function can become more jagged, making it difficult to find the optimal solution. To address this challenge, hyperparameter optimization was used to tune the parameters of the network, such as the learning rate, batch size, and number of epochs. This can help the network to learn more effectively and achieve better accuracy. In addition, strategies like SGD, Adam, AdaGrad, and AdaDelta were implemented for optimisation [49]. This is because different optimisers work better for different networks. For example, the SGD optimiser is a good choice for small networks, while the Adam optimiser is a better choice for large networks. By fine-tuning the optimiser, the proposed Deep CNN model can achieve better accuracy on the rice leaf datasets with fewer parameters. The model’s Hyperparameters with values are shown in Table 2.

2.4. Dataset and Implementation Setup

The rice image dataset used in this study were captured using a Samsung 52S mobile camera (Samsung Electronics, Noida, India) and a Canon EOS 1500D DSLR (Canon Inc., Tokyo, Japan). The dataset comprises a total of 8883 images, including those of rice leaves affected by four diseases: brown spot, leaf blast, bacterial leaf blight (BLB), and tungro, and 1200 images of healthy leaves, presented in Table 3. Brown spot infected leaves have large spots, which initially appear as small, circular, dark brown to purple-brown lesions. As the disease progresses, lesions become circular to oval with a light brown to grey centre and a reddish-brown margin (Figure 6a) [50]. In leaf blast disease, small necrotic regions grow into chlorotic margins. The disease affects rice plant leaves, collars, nodes, inter-nodes, leaf blades, and panicles (Figure 6b) [51]. BLB infected leaves turn greyish-green and roll up, then turn yellow, discolour straw, and die (Figure 6d). Wavy margins spread toward the base. Bacterial ooze resembles early-morning dew in younger leaves [52]. The most serious rice disease; tungro, in South and Southeast Asia is caused by rice tungro spherical virus (RTSV), transmitted by the green leafhopper (Nephotettix virescens), and rice tungro bacilliform virus (RTBV). RTSV infection causes yellowing and redness in leaves and stunted plant growth (Figure 6e). RTBV causes severe symptoms without leafhopper transmission [53].
Implementation setup: Python version 3.7 was used for implementing the network architecture, with Keras 2.3.1 and TensorFlow 1.15 serving as the frontend and backend, respectively. We employed model and data-parallelism techniques for conducting image classification experiments on a Linux-based GPU environment with over 2000 CPU cores, 1.5 TB RAM, and NVIDIA Tesla V100 32 GB GPU accelerators (Hewlett Packard Enterprise, Nvidia, Santa Clara, CA, USA) running on Google Collab Pro.
To train network on the rice leaf dataset, which includes five distinct classes (BLB, leaf blast, tungro, healthy, and brown spot), we used the GPU configuration platform to create a pretrained network using ImageNet, which was then fine-tuned. Furthermore, we used a decreasing learning rate schedule of 5% per 10 epochs for an adaptive learning schedule, with each iteration comprising 150 epochs.
Performance matrices: Accuracy and error rate calculations were used to make model comparisons [54]. In most cases, the best models are those with the fewest errors and the highest accuracy. The precision and the margin of error are defined as follows:
Accuracy   of   model = T N + T P F N + F P + T P + T N .
Error   in   model = F N + F P F P + F N + T P + T N .
The numbers of true negatives, false negatives, true positives, and false positives are denoted as TN, FN, TP, and FP.

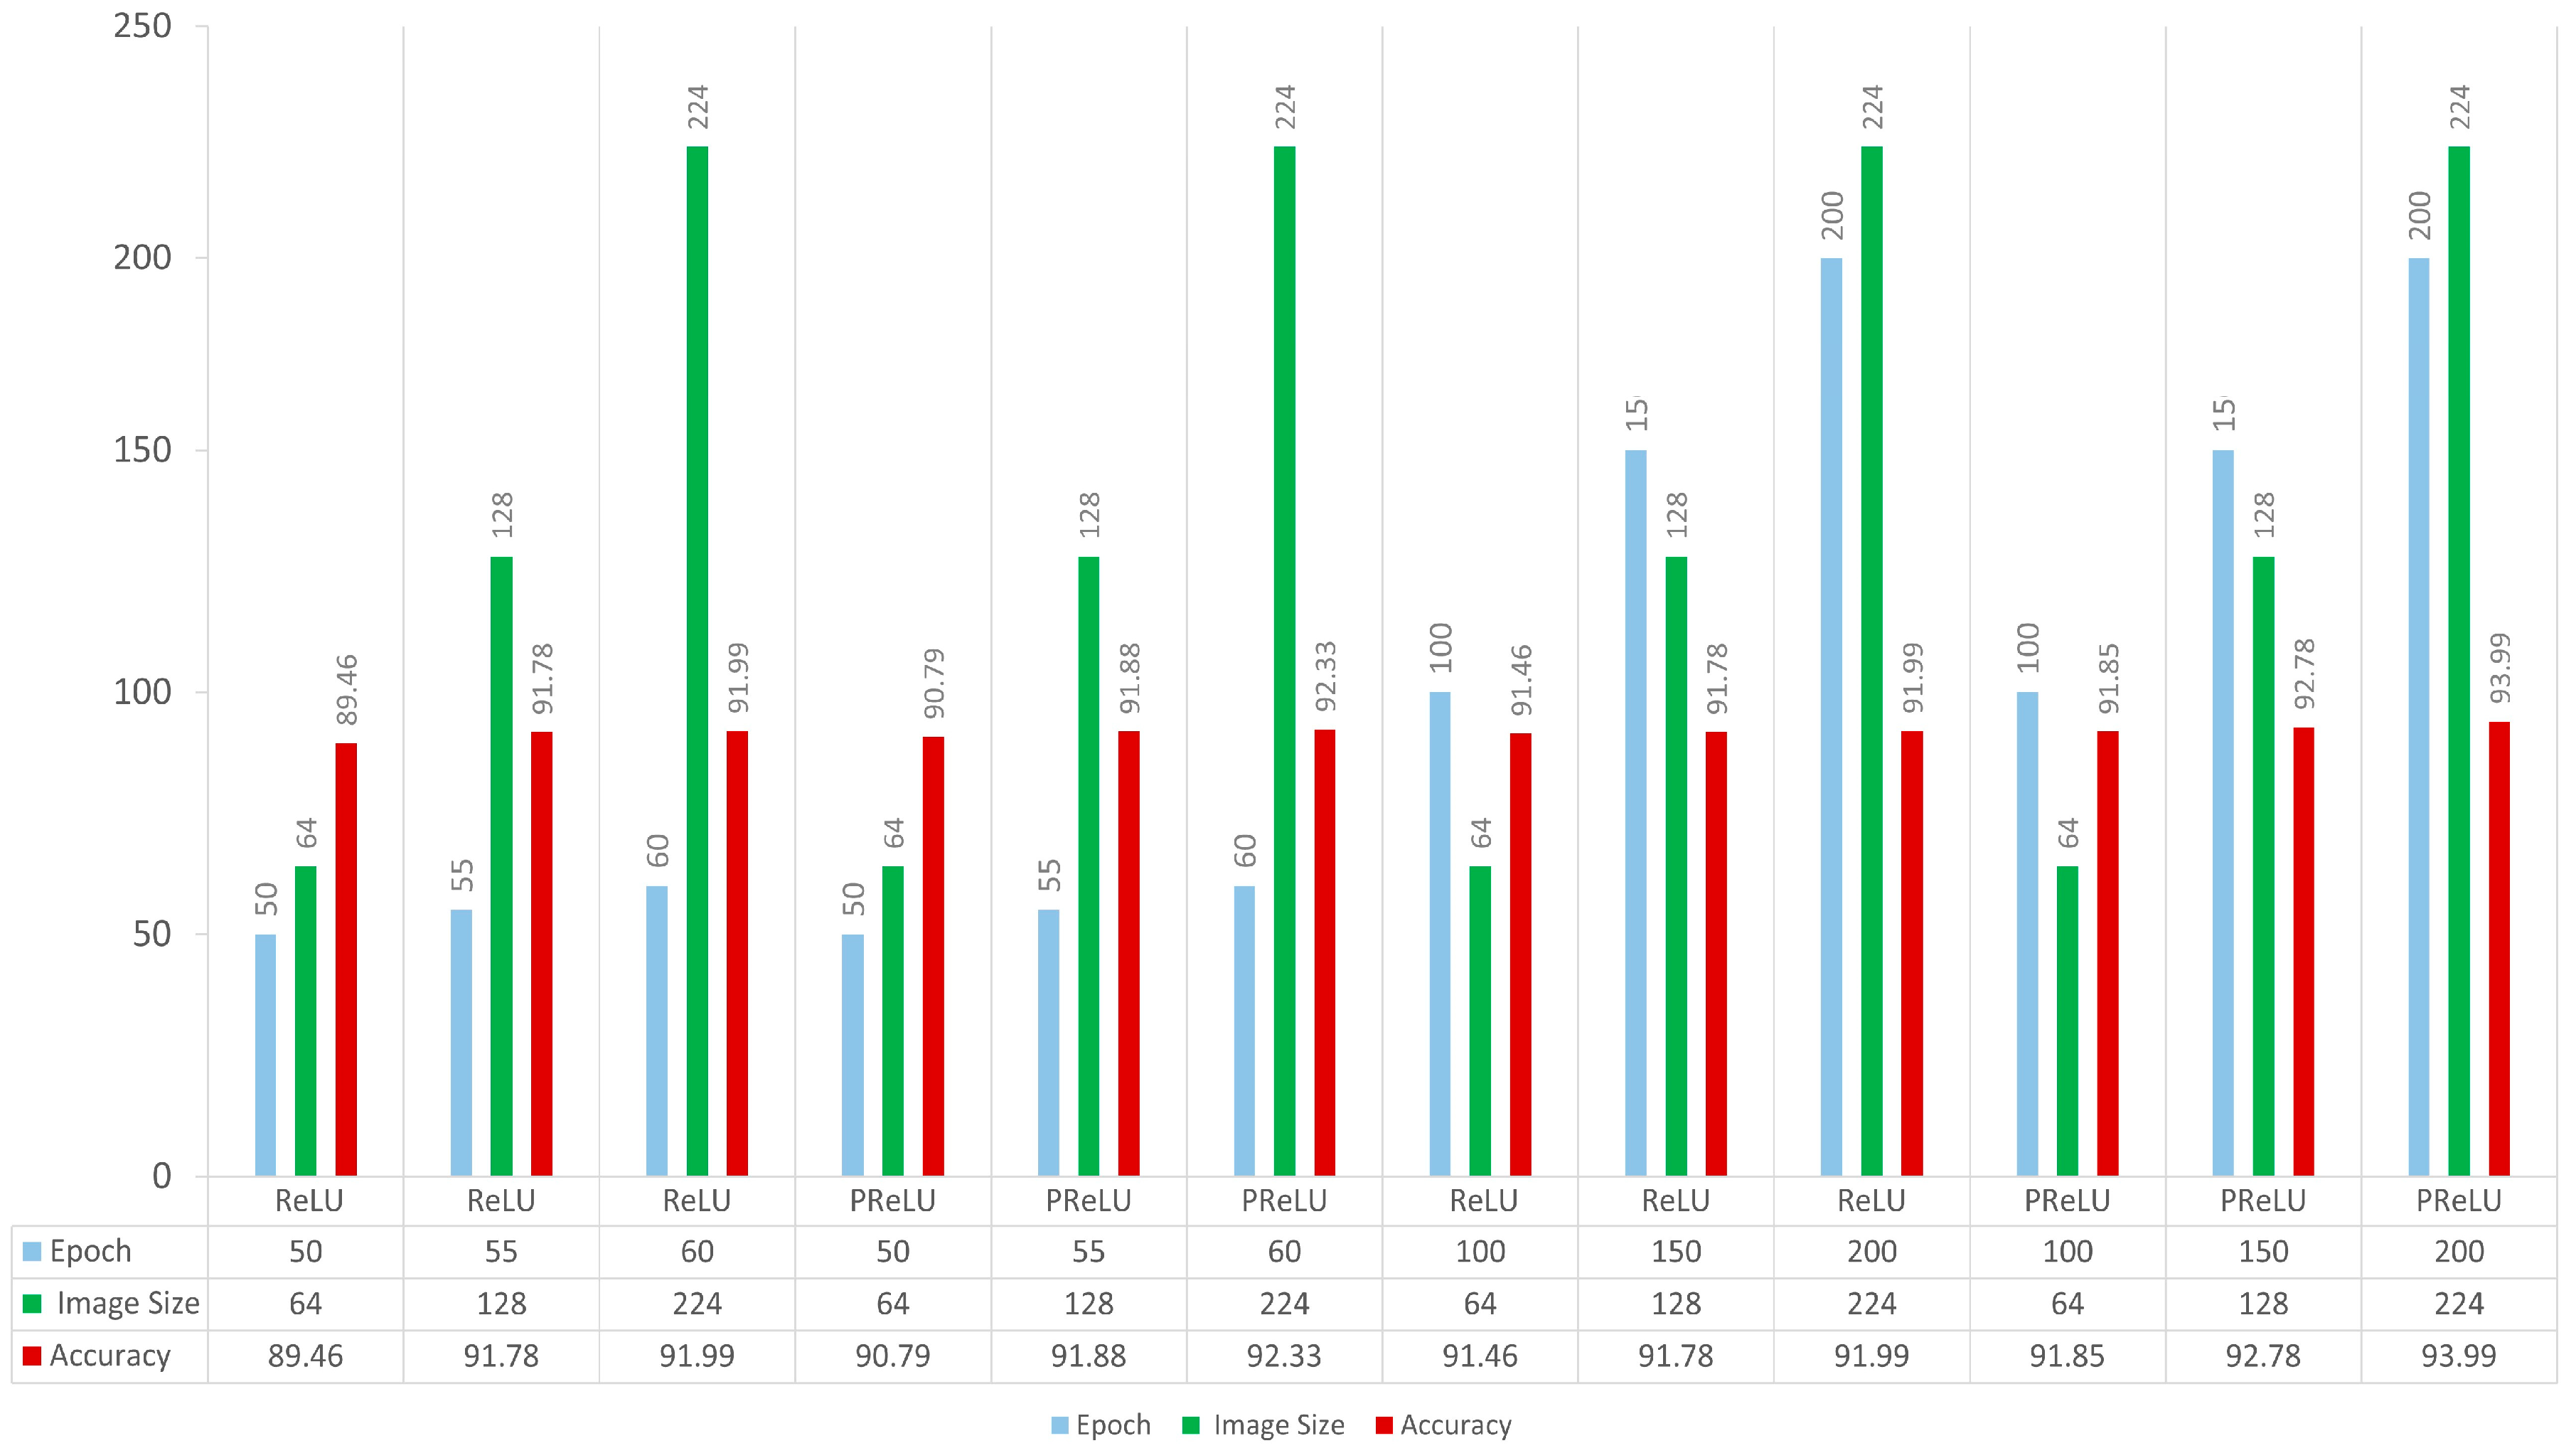
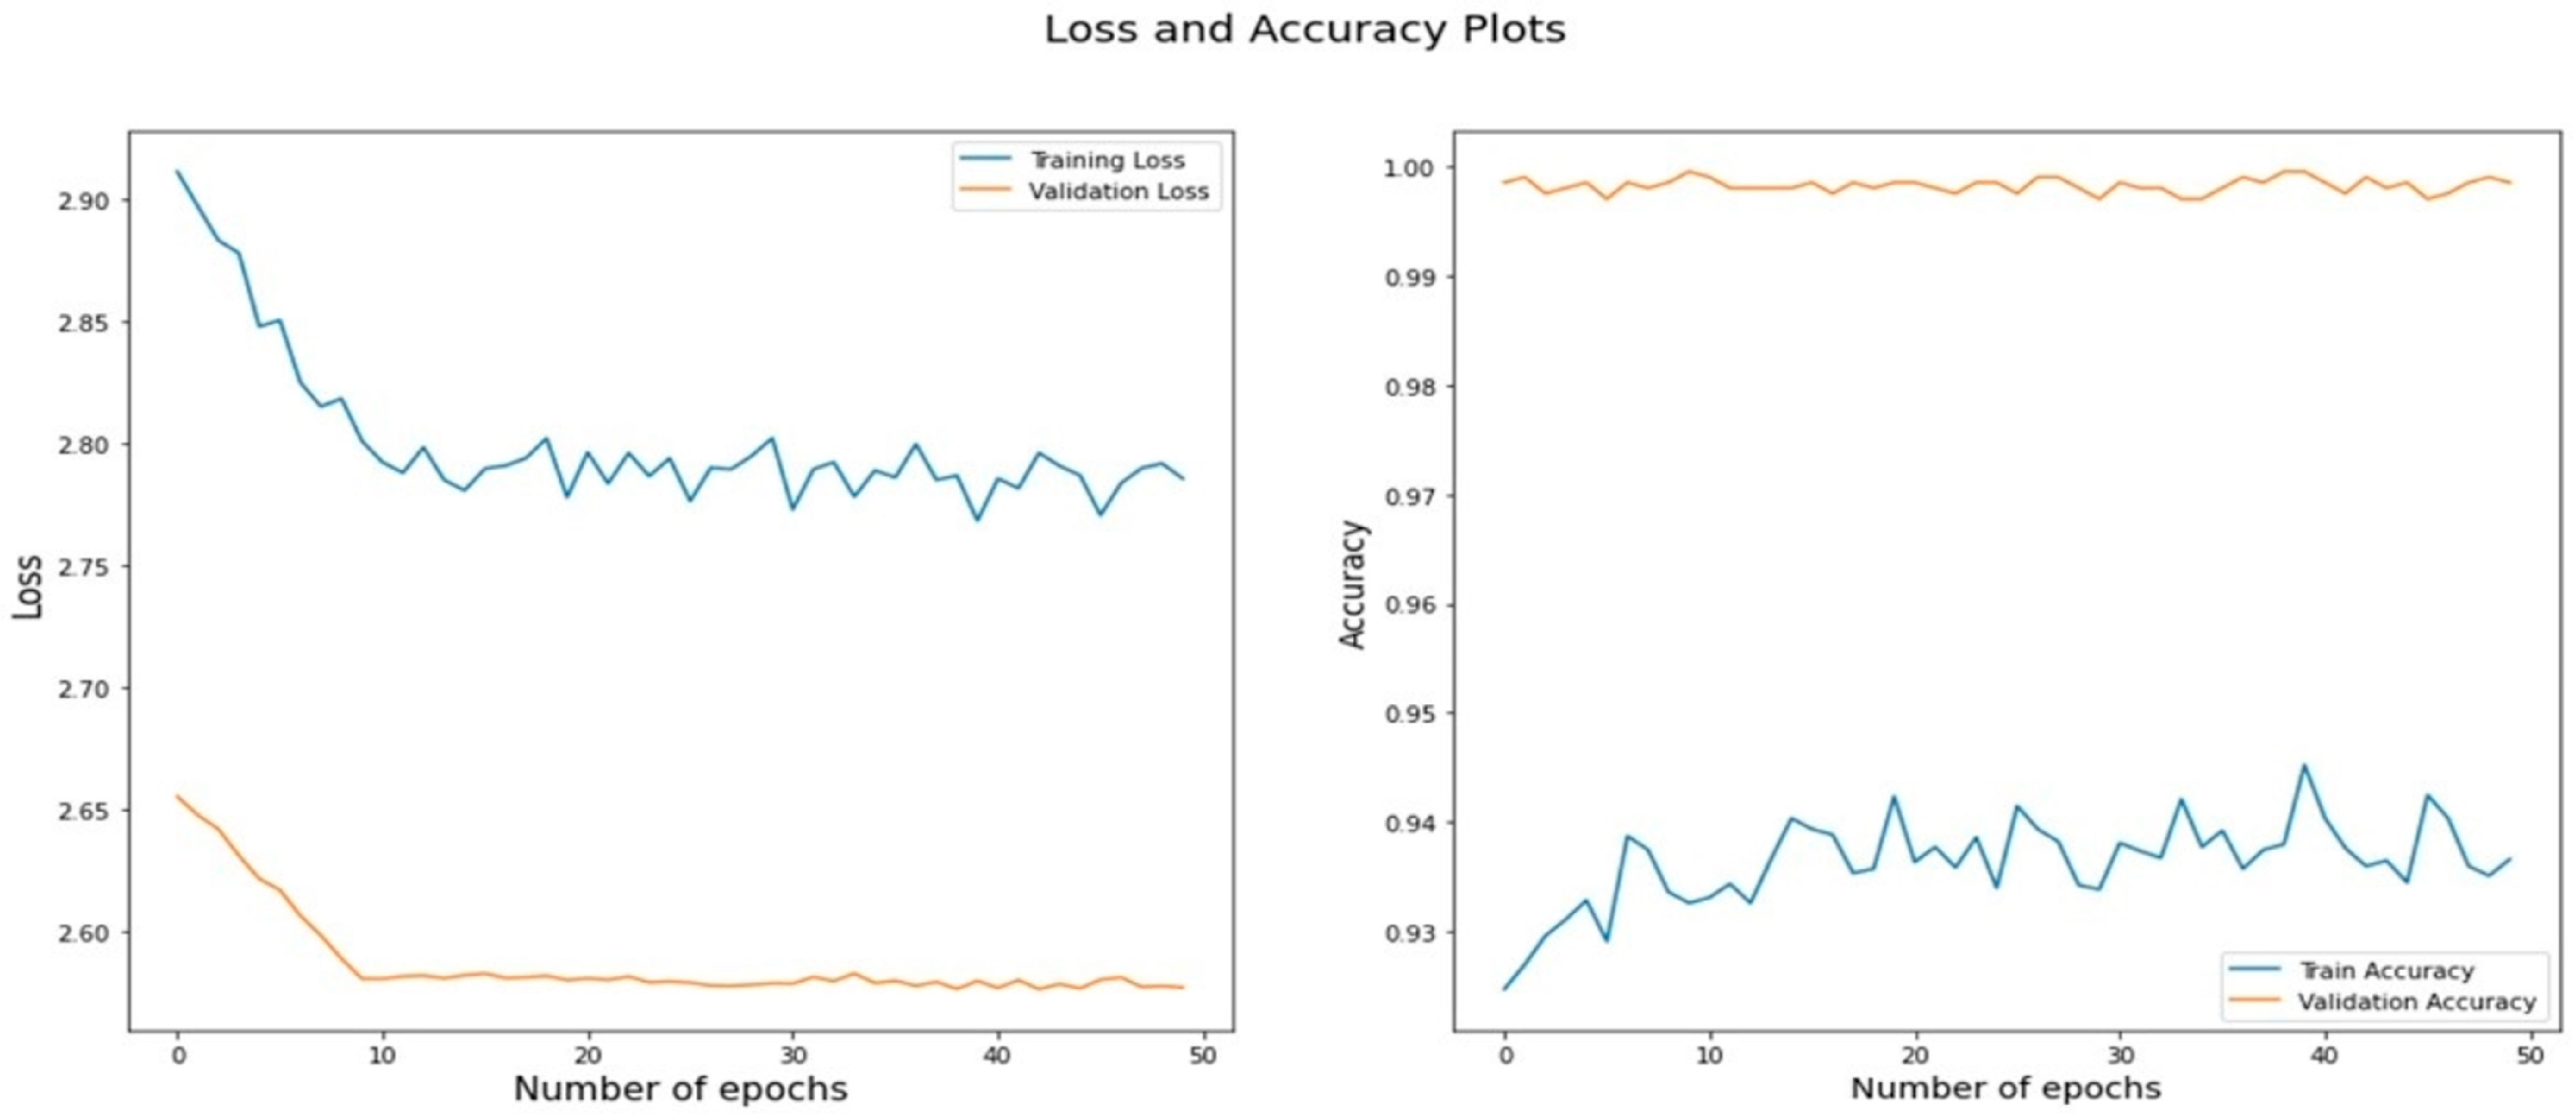
3. Results and Discussion

Here we describe the accuracy of the deep 3-Stage CNN model that classifies a dataset of rice leaf images into five classes. The proposed 3-Stage CNN model trained under suitable hyperparameter values for the best results and generalizing the model. The hyperparameter values are described in Table 2. For this experimentation, the proposed 3-Stage CNN model mentioned in Figure 5 was trained using two configurations: (i) progressive resizing and (ii) ReLU versus PReLU activation with transfer learning. Previous research shows that the CNN model outperformed with precision variations ranging from 3% to 28.9% [55,56]. Mohanty et al. [57] trained models to identify 14 crop species and 26 diseases using the Plant Village database, achieving a 99.4% accuracy on a held-out test set. Picon, Alvarez-Gila et al. [58] focused on three wheat diseases and achieved a balanced accuracy of 98% for Septoria and 96% for Rust using a mobile app.
The efficiency of deep neural networks (DNN) training and accuracy improvement is significantly influenced by image size. In this experiment, three parameters were considered while training the network with images of various aspect ratios. The experiment revealed that regularisation parameters employed by the model could affect its accuracy. To achieve higher accuracy when incorporating progressive rescaling on image data, it is recommended that regularisation parameters be adjusted instead of using fixed regularisations, which can lead to inaccurate results. More stringent regularisation is essential to prevent overfitting in large models. For example, EfficientNet-B7 employs higher dropout rates and more stringent data augmentations than EfficientNet-B0. In this experiment, regularisation methods such as Dropout [59] and Rand Augment [60] were used in conjunction with the progressive rescaling of images during three training phases for various image dimensions.
The present study conducted experiments on rice leaf disease datasets to evaluate the performance of a proposed 3-Stage CNN model for image classification. The experimental setup is presented in Table 4, with 100 epochs set for each stage. As illustrated in Figure 7, an accuracy of 89.5% was achieved when the image size was 64 × 64 pixels, and the regularisation was less stringent (RandAugment = 5, Dropout 0.1). However, accuracy was increased to 93.99% after the third training stage when the image size was increased and applied more stringent regularisation.
The accuracy of model improved from 90.79% to 93.99% when we moved from stage I to stage III with a larger image size and stronger regularisation parameters. Furthermore, the accuracy of model and training time were improved when the dataset was rescaled in progressive steps. The loss and accuracy plot of the deep model is shown in Figure 8, where the accuracy on the rice leaf dataset was 93.99%.
Our proposed model, which was trained for a total of 26 h using 36 million parameters, achieved an accuracy of 93.99% on categorising the five distinct types of images, as shown in Figure 9. We used fewer FLOPs and fewer parameters than other benchmark models in the literature, which suggests that increasing the image size is more effective for this data set than increasing the model size by adding layers.
We observed an improved accuracy of PReLU over ReLU in the activation function setup of our proposed deep 3-Stage CNN architecture for rice disease classification over the datasets. On the dataset, the training implementation achieved 93.99% accuracy after being tested with 10 different views. Using progressive training on different blocks without loading the weight of the previous block, ReLUs were used to train the model across all layers. As a result, accuracy in all three sections improved by around 3%. Later, the model was trained by switching out all of the ReLUs for PreLUs, and progressive training was also performed by loading weights from the prior block. Table 5 provides the results’ specifics, showing that PReLU is 3.2% more accurate than ReLU from stage I to stage III in the rice leaf dataset. The more favourable value is presented in boldface for each of the stages.
The results indicate that (i) using the PReLU activation function on model layers generalises the standard rectified unit and offers various benefits, including improved model fitting, reduced risk of overfitting, superior efficiency on datasets that incorporate rescaled images, and essentially no additional computing cost. (ii) Fine-tuning the Deep network’s hyperparameters and optimisers and increasing the training dataset’s size can lead to competitive results in the high-accuracy regime. (iii) The improved performance on the dataset with rescaled images can be attributed to the use of PReLU activation function on the model layers, which generalises the classic rectified unit and improves model fitting with almost no additional computing cost and no risk of overfitting.

4. Conclusions and Future Work

Computer vision and AI frameworks have spread to many areas of the food industry, including farming and processing. The application of these techniques is effective to computerize laborious tasks in a risk-free manner, thereby producing sufficient data for subsequent investigation. These techniques are applicable to monitor the disease severity thereby timely controlling diseases in crops with reduced losses and increased yield. Here, we propose a deep 3-Stage CNN model and showed how to use transfer learning, progressive scaling, and a split-and-train strategy to improve upon a pre-trained deep CNN of EfficientNetB7. In addition, the thick layers of the model were activated using the PReLU, a generalisation of the classic rectified unit. This was done to improve the accuracy of the simulation and ensure that the representation was as accurate as possible. PReLU reduces the risk of overfitting while increasing model fitting quality with negligible computational overhead.
This study considered the four most common diseases affecting rice plants: leaf blast, bacterial blight, brown spot, and tungro. We conducted experiments by splitting the entire dataset into training and testing sets at varying ratios. Our proposed model achieved a classification accuracy of 93.99% for rice diseases. However, the lack of standard labelled rice disease images made it inappropriate to benchmark the proposed model against the literature. Nevertheless, our suggested 3-Stage CNN architecture has better performance, shorter execution time, and fewer parameters than the other architectures of the literature on rice leaf benchmark datasets. The model took shorter execution time as we have implemented transfer learning and fine-tuned the hyperparameters, and it has fewer parameters as compared to other models. A larger dataset of rice disease images would further improve the model’s performance. Framework’s application can be effectively extended to other crops and diseases. The proposed framework can be effectively used for more accurate detection of diseases affecting rice as well as other crops, which cause a significant economic loss in the agricultural sector.

Author Contributions

Investigation, methodology, data curation, writing-original manuscript draft, M.G. and V.K.; formal analysis, methodology, writing-review and editing, S.A.B., N.S. and S.K.; investigation, supervision, resources, S.K. All authors have read and agreed to the published version of the manuscript.

Funding

This research received no external funding.

Institutional Review Board Statement

Not applicable.

Data Availability Statement

Data is available on request from authors.

Conflicts of Interest

The authors declare no conflict of interest.

References

  1. Laborte, A.G.; Gutierrez, M.A.; Balanza, J.G.; Saito, K.; Zwart, S.J.; Boschetti, M.; Murty, M.V.R.; Villano, L.; Aunario, J.K.; Reinke, R.; et al. RiceAtlas, a Spatial Database of Global Rice Calendars and Production. Sci. Data 2017, 4, 170074. [Google Scholar] [CrossRef] [PubMed]
  2. Fukagawa, N.K.; Ziska, L.H. Rice: Importance for Global Nutrition. J. Nutr. Sci. Vitaminol. 2019, 65, S2–S3. [Google Scholar] [CrossRef] [PubMed] [Green Version]
  3. Rezvi, H.U.A.; Tahjib-Ul-Arif, M.; Azim, M.A.; Tumpa, T.A.; Tipu, M.M.H.; Najnine, F.; Dawood, M.F.A.; Skalicky, M.; Brestič, M. Rice and Food Security: Climate Change Implications and the Future Prospects for Nutritional Security. Food Energy Secur. 2023, 12, e430. [Google Scholar] [CrossRef]
  4. Agrios, G.N. Plant Diseases Caused by Viruses. In Plant Pathology, 5th ed.; Elsevier Inc.: Amsterdam, The Netherlands, 2005; pp. 723–824. [Google Scholar] [CrossRef]
  5. Wang, Y.; Wang, H.; Peng, Z. Rice Diseases Detection and Classification Using Attention Based Neural Network and Bayesian Optimization. Expert Syst. Appl. 2021, 178, 114770. [Google Scholar] [CrossRef]
  6. Kumar, K.S.A.; Karthika, K.S. Abiotic and Biotic Factors Influencing Soil Health and/or Soil Degradation. In Soil Health; Springer: Cham, Switzerland, 2020; Volume 59, pp. 145–161. [Google Scholar]
  7. Latif, G.; Abdelhamid, S.E.; Mallouhy, R.E.; Alghazo, J.; Kazimi, Z.A. Deep Learning Utilization in Agriculture: Detection of Rice Plant Diseases Using an Improved CNN Model. Plants 2022, 11, 2230. [Google Scholar] [CrossRef]
  8. Phadikar, S.; Sil, J.; Das, A.K. Rice Diseases Classification Using Feature Selection and Rule Generation Techniques. Comput. Electron. Agric. 2013, 90, 76–85. [Google Scholar] [CrossRef]
  9. Sarker, I.H. Deep Learning: A Comprehensive Overview on Techniques, Taxonomy, Applications and Research Directions. SN Comput. Sci. 2021, 2, 420. [Google Scholar] [CrossRef]
  10. Alzubaidi, L.; Zhang, J.; Humaidi, A.J.; Al-Dujaili, A.; Duan, Y.; Al-Shamma, O.; Santamaría, J.; Fadhel, M.A.; Al-Amidie, M.; Farhan, L. Review of Deep Learning: Concepts, CNN Architectures, Challenges, Applications, Future Directions. J. Big Data 2021, 8, 53. [Google Scholar] [CrossRef]
  11. Handa, N.; Kaushik, Y.; Sharma, N.; Dixit, M.; Garg, M. Image Classification Using Convolutional Neural Networks. Commun. Comput. Inf. Sci. 2021, 1393, 510–517. [Google Scholar]
  12. Yamashita, R.; Nishio, M.; Do, R.K.G.; Togashi, K. Convolutional Neural Networks: An Overview and Application in Radiology. Insights Imaging 2018, 9, 611–629. [Google Scholar] [CrossRef] [Green Version]
  13. Lu, Y.; Yi, S.; Zeng, N.; Liu, Y.; Zhang, Y. Identification of Rice Diseases Using Deep Convolutional Neural Networks. Neurocomputing 2017, 267, 378–384. [Google Scholar] [CrossRef]
  14. Rajmohan, R.; Pajany, M.; Rajesh, R.; Raman, D.R.; Prabu, U. Smart Paddy Crop Disease Identification and Management Using Deep Convolution Neural Network and SVM Classifier. Int. J. Pure Appl. Math. 2018, 118, 255–264. [Google Scholar]
  15. Simhadri, C.G.; Kondaveeti, H.K. Automatic Recognition of Rice Leaf Diseases Using Transfer Learning. Agronomy 2023, 13, 961. [Google Scholar] [CrossRef]
  16. Ho, N.; Kim, Y.C. Evaluation of Transfer Learning in Deep Convolutional Neural Network Models for Cardiac Short Axis Slice Classification. Sci. Rep. 2021, 11, 1839. [Google Scholar] [CrossRef]
  17. Ali, A.H.; Yaseen, M.G.; Aljanabi, M.; Abed, S.A. ChatGPT Transfer Learning: A New Promising Techniques. Mesopotamian J. Big Data 2023, 2023, 31–32. [Google Scholar] [CrossRef]
  18. Yang, D.; Ngoc, K.M.; Shin, I.; Hwang, M. DPReLU: Dynamic Parametric Rectified Linear Unit and Its Proper Weight Initialization Method. Int. J. Comput. Intell. Syst. 2023, 16, 11. [Google Scholar] [CrossRef]
  19. Choudhary, K.; DeCost, B.; Chen, C.; Jain, A.; Tavazza, F.; Cohn, R.; Park, C.W.; Choudhary, A.; Agrawal, A.; Billinge, S.J.L.; et al. Recent Advances and Applications of Deep Learning Methods in Materials Science. NPJ Comput. Mater. 2022, 8, 59. [Google Scholar] [CrossRef]
  20. Agrawal, A.; Choudhary, A. Deep Materials Informatics: Applications of Deep Learning in Materials Science. MRS Commun. 2019, 9, 779–792. [Google Scholar] [CrossRef] [Green Version]
  21. Kamilaris, A.; Prenafeta-Boldú, F.X. Deep learning in agriculture: A survey. Comput. Electron. Agric. 2018, 147, 70–90. [Google Scholar] [CrossRef] [Green Version]
  22. Khirade, S.D.; Patil, A.B. Plant Disease Detection Using Image Processing. In Proceedings of the 2015 International Conference on Computing Communication Control and Automation, Pune, India, 26–27 February 2015; pp. 768–771. [Google Scholar] [CrossRef]
  23. Sahu, P.K.; Chattopadhyay, S. A Survey on Application Mapping Strategies for Network-on-Chip Design. J. Syst. Archit. 2013, 59, 60–76. [Google Scholar] [CrossRef]
  24. Mukherjee, M.; Pal, T.; Samanta, D. Damaged Paddy Leaf Detection Using Image Processing. J. Glob. Res. Comput. Sci. 2012, 3, 7–10. [Google Scholar]
  25. Islam, R.; Rafiqul, M. An Image Processing Technique to Calculate Percentage of Disease Affected Pixels of Paddy Leaf. Int. J. Comput. Appl. 2015, 123, 28–34. [Google Scholar] [CrossRef]
  26. Hu, G.; Wu, H.; Zhang, Y.; Wan, M. A Low Shot Learning Method for Tea Leaf’s Disease Identification. Comput. Electron. Agric. 2019, 163, 104852. [Google Scholar] [CrossRef]
  27. Chung, C.L.; Huang, K.J.; Chen, S.Y.; Lai, M.H.; Chen, Y.C.; Kuo, Y.F. Detecting Bakanae Disease in Rice Seedlings by Machine Vision. Comput. Electron. Agric. 2016, 121, 404–411. [Google Scholar] [CrossRef]
  28. Ding, W.; Taylor, G. Automatic Moth Detection from Trap Images for Pest Management. Comput. Electron. Agric. 2016, 123, 17–28. [Google Scholar] [CrossRef] [Green Version]
  29. Arnal Barbedo, J.G. Plant Disease Identification from Individual Lesions and Spots Using Deep Learning. Biosyst. Eng. 2019, 180, 96–107. [Google Scholar] [CrossRef]
  30. Anami, B.S.; Malvade, N.N.; Palaiah, S. Deep Learning Approach for Recognition and Classification of Yield Affecting Paddy Crop Stresses Using Field Images. Artif. Intell. Agric. 2020, 4, 12–20. [Google Scholar] [CrossRef]
  31. Picon, A.; Seitz, M.; Alvarez-Gila, A.; Mohnke, P.; Ortiz-Barredo, A.; Echazarra, J. Crop Conditional Convolutional Neural Networks for Massive Multi-Crop Plant Disease Classification over Cell Phone Acquired Images Taken on Real Field Conditions. Comput. Electron. Agric. 2019, 167, 105093. [Google Scholar] [CrossRef]
  32. Kumar, P.; Negi, B.; Bhoi, N. Detection of Healthy and Defected Diseased Leaf of Rice Crop Using K-Means Clustering Technique. Int. J. Comput. Appl. 2017, 157, 24–27. [Google Scholar] [CrossRef]
  33. Atole, R.R.; Juan Bautista, S.; Sur, C.; Daechul Park, P. A Multiclass Deep Convolutional Neural Network Classifier for Detection of Common Rice Plant Anomalies. Int. J. Adv. Comput. Sci. Appl. 2018, 9, 67–70. [Google Scholar]
  34. Pinki, F.; Khatun, T.; Islam, S. Content Based Paddy Leaf Disease Recognition and Remedy Prediction Using Support Vector Machine. In Proceedings of the 20th International Conference of Computer and Information Technology, Bhubaneshwar, India, 21–23 December 2017; pp. 22–24. [Google Scholar]
  35. Ramesh, S.; Vydeki, D. Recognition and Classification of Paddy Leaf Diseases Using Optimized Deep Neural Network with Jaya Algorithm. Inf. Process. Agric. 2020, 7, 249–260. [Google Scholar] [CrossRef]
  36. Liang, W.-J.; Zhang, H.; Zhang, G.-F.; Cao, H.-X. Rice Blast Disease Recognition Using a Deep Convolutional Neural Network. Sci. Rep. 2019, 9, 2869. [Google Scholar] [CrossRef] [Green Version]
  37. Ahmed, K.; Shahidi, T.R.; Alam, S.; Momen, S. Rice Leaf Disease Detection Using Machine Learning Techniques. In Proceedings of the International Conference of Computer Science and Renewable Energies (ICCSRE), Agadir, Morocco, 22–24 July 2019; pp. 1–5. [Google Scholar]
  38. Gayathri Devi, T.; Neelamegam, P. Image Processing Based Rice Plant Leaves Diseases in Thanjavur, Tamilnadu. Clust. Comput. 2019, 22, 13415–13428. [Google Scholar] [CrossRef]
  39. Nalini, S.; Krishnaraj, N.; Jayasankar, T.; Vinothkumar, K.; Britto, A.S.F.; Subramaniam, K.; Bharatiraja, C. Paddy Leaf Disease Detection Using an Optimized Deep Neural Network. Comput. Mater. Contin. 2021, 68, 1117–1128. [Google Scholar] [CrossRef]
  40. Chen, J.; Chen, J.; Zhang, D.; Nanehkaran, Y.A.; Sun, Y. A Cognitive Vision Method for the Detection of Plant Disease Images. Mach. Vis. Appl. 2021, 32, 31. [Google Scholar] [CrossRef]
  41. Aqel, D.; Al-Zubi, S.; Mughaid, A.; Jararweh, Y. Extreme Learning Machine for Plant Diseases Classification: A Sustainable Approach for Smart Agriculture. Clust. Comput. 2022, 25, 2007–2020. [Google Scholar] [CrossRef]
  42. Archana, K.S.; Srinivasan, S.; Bharathi, S.P.; Balamurugan, R.; Prabakar, T.N.; Britto, A.S.F. A Novel Method to Improve Computational and Classification Performance of Rice Plant Disease Identification. J. Supercomput. 2022, 78, 8925–8945. [Google Scholar] [CrossRef]
  43. Narmadha, R.P.; Sengottaiyan, N.; Kavitha, R.J. Deep Transfer Learning Based Rice Plant Disease Detection Model. Intell. Autom. Soft Comput. 2022, 31, 1257–1271. [Google Scholar] [CrossRef]
  44. Foret, P.; Kleiner, A.; Mobahi, H.; Neyshabur, B. Sharpness-Aware Minimization for Efficiently Improving Generalization. Mach. Learn. 2021, 3, 79–89. [Google Scholar]
  45. Chaudhari, M.; Thapa, N.; Ismail, H.; Chopade, S.; Caragea, D.; Köhn, M.; Newman, R.H.; KC, D.B. DTL-DephosSite: Deep Transfer Learning Based Approach to Predict Dephosphorylation Sites. Front. Cell Dev. Biol. 2021, 9, 662983. [Google Scholar] [CrossRef]
  46. Su, J.; Xu, B.; Yin, H. A Survey of Deep Learning Approaches to Image Restoration. Neurocomputing 2022, 487, 46–65. [Google Scholar] [CrossRef]
  47. He, K.; Zhang, X.; Ren, S.; Sun, J. Delving Deep into Rectifiers: Surpassing Human-Level Performance on ImageNet Classification. In Proceedings of the 2015 IEEE International Conference on Computer Vision (ICCV), Santiago, Chile, 7–13 December 2015; pp. 1026–1034. [Google Scholar]
  48. Gogoi, M.; Begum, S.A. Progressive 3-Layered Block Architecture for Image Classification. Int. J. Adv. Comput. Sci. Appl. 2022, 13, 499–508. [Google Scholar] [CrossRef]
  49. Bera, S.; Shrivastava, V.K. Analysis of Various Optimizers on Deep Convolutional Neural Network Model in the Application of Hyperspectral Remote Sensing Image Classification. Int. J. Remote Sens. 2019, 41, 2664–2683. [Google Scholar] [CrossRef]
  50. Shabana, Y.M.; Abdel-Fattah, G.M.; Ismail, A.E.; Rashad, Y.M. Control of Brown Spot Pathogen of Rice (Bipolaris oryzae) Using Some Phenolic Antioxidants. Braz. J. Microbiol. 2008, 39, 438. [Google Scholar] [CrossRef] [PubMed] [Green Version]
  51. Nettleton, D.F.; Katsantonis, D.; Kalaitzidis, A.; Sarafijanovic-Djukic, N.; Puigdollers, P.; Confalonieri, R. Predicting Rice Blast Disease: Machine Learning versus Process-Based Models. BMC Bioinform. 2019, 20, 514. [Google Scholar] [CrossRef] [Green Version]
  52. Niones, J.T.; Sharp, R.T.; Donayre, D.K.M.; Oreiro, E.G.M.; Milne, A.E.; Oliva, R. Dynamics of Bacterial Blight Disease in Resistant and Susceptible Rice Varieties. Eur. J. Plant Pathol. 2022, 163, 1–17. [Google Scholar] [CrossRef]
  53. Chancellor, T.C.B.; Holt, J.; Villareal, S.; Tiongco, E.R.; Venn, J. Spread of Plant Virus Disease to New Plantings: A Case Study of Rice Tungro Disease. Adv. Virus Res. 2006, 65, 1–29. [Google Scholar] [CrossRef]
  54. Galdi, P.; Tagliaferri, R. Data Mining: Accuracy and Error Measures for Classification and Prediction. In Reference Module in Life Sciences; Elsevier: Amsterdam, The Netherlands, 2018; Volume 3, pp. 431–436. ISBN 9780128114322. [Google Scholar]
  55. Liu, S.; Wang, X.; Liu, M.; Zhu, J. Towards Better Analysis of Machine Learning Models: A Visual Analytics Perspective. Vis. Inform. 2017, 1, 48–56. [Google Scholar] [CrossRef]
  56. Brahimi, M.; Boukhalfa, K.; Moussaoui, A. Deep Learning for Tomato Diseases: Classification and Symptoms Visualization. Appl. Artif. Intell. 2017, 31, 299–315. [Google Scholar] [CrossRef]
  57. Mohanty, S.P.; Hughes, D.P.; Salathé, M. Using Deep Learning for Image-Based Plant Disease Detection. Front. Plant Sci. 2016, 7, 1419. [Google Scholar] [CrossRef] [Green Version]
  58. Picon, A.; Alvarez-Gila, A.; Seitz, M.; Ortiz-Barredo, A.; Echazarra, J.; Johannes, A. Deep Convolutional Neural Networks for Mobile Capture Device-Based Crop Disease Classification in the Wild. Comput. Electron. Agric. 2019, 161, 280–290. [Google Scholar] [CrossRef]
  59. Srivastava, N.; Hinton, G.; Krizhevsky, A.; Salakhutdinov, R. Dropout: A Simple Way to Prevent Neural Networks from Overfitting. J. Mach. Learn. Res. 2014, 15, 1929–1958. [Google Scholar]
  60. Cubuk, E.D.; Zoph, B.; Mané, D.; Vasudevan, V.; Le, Q.V. AutoAugment: Learning Augmentation Strategies from Data. In Proceedings of the IEEE/CVF Conference on Computer Vision and Pattern Recognition (CVPR), Long Beach, CA, USA, 15–20 June 2019; pp. 113–123. [Google Scholar]
Figure 1. Study area of rice disease for analysis.
Agriculture 13 01505 g001
Figure 2. Image classification workflow.
Agriculture 13 01505 g002
Figure 3. Deep learning network for image classification.
Agriculture 13 01505 g003
Figure 4. Progressive re-sizing of images into different dimensions.
Agriculture 13 01505 g004
Figure 5. System architecture of Deep 3-Stage CNN architecture with transfer learning [48].
Agriculture 13 01505 g005
Figure 6. Sample images of the disease dataset.
Agriculture 13 01505 g006
Figure 7. Accuracy comparison of the CNN model in progressive resizing and activation function setup.
Agriculture 13 01505 g007
Figure 8. Loss and accuracy plot of the model on rice leaf dataset.
Agriculture 13 01505 g008
Figure 9. Representation of accuracy, parameters, and training hours of the Deep model.
Agriculture 13 01505 g009
Table 1. Published research work examples of disease detection in plants using deep learning models.
YearTechniquesTarget DataData SetNumber of ClassesAccuracy Rate (%)Error Rate (%)References
2012SVM/Baye’s ClassifierRice
Diseases
4502SVM = 68.10, Bayes = 79.5020.5[24]
2017CNN, HOG, SVMRice
Diseases
50010CNN = 95.54.5[13]
2015SVMRice leaves-1SVM= 82.0018[25]
2015SVM, C-DCGANTea leaves150039010[26]
2016SVMRice seedlings7001SVM= 87.013.0[27]
2016CNNInsect pests10331295.014.99[28]
2019CNNDifferent crop leaves15751075.025.0[29]
2020Deep-CNNMultiple crops diseases30,0001292.897.11[30]
2017KNNMultiple crop plant disease121,9551792.08.0[31]
2017K-means ClusteringLeaves-27822[32]
2018AlexNetLeaves600391.238.77[33]
2017SVMRice leaves50792.08.0[34]
2020ANN, DAE and DNN-JOARice disease 400590.579.47[35]
2018SVM/CNNRice disease leaves5808295.834.17[36]
2019SVM/CNNLeaves700491.378.63[37]
2019SVMRice disease leaves970296.73.3[38]
2019DNN-CSA and 10-fold SVMRice disease leaves120387.4612.54[39]
2021CNNGrape leaves500493.756.25[40]
2022ELM Lemon leaves73494.06.0[41]
2022NSVMBPN NetworkRice leaves790395.24.8[42]
2022DenseNet169-MLPRice leaves1500397.682.32[43]
Table 2. Hyperparameter values of the CNN model.
Hyper-ParametersValues
OptimizerAdam
Batch size32
Momentum0.8
Learning RateDecay learning rate
Table 3. Dataset description of training and validation images.
Name of ClassTraining ImagesValidation Images
Brown Spot1770443
Leaf Blast1860465
Tungro1201300
BLB1300324
Healthy980220
Table 4. The model’s progressive rescaling setup parameters.
Training StagesImage SizeRand AugmentDropout
Min MaxMinMaxMinMax
First Training Stage642245100.10.3
Second Training Stage642245150.20.5
Third Training Stage642245200.10.5
Table 5. Classification accuracy of rice dataset deep model.
Training StagesActivation Function Rand AugmentDropout RateImage Size in PixelsAccuracy
MinMaxMinMax
Stage IReLU5100.10.364 × 6468.61
128 × 12875.73
224 × 22486.55
PReLU5100.10.364 × 6471.77
128 × 12878.63
224 × 22490.91
Stage IIReLU5150.20.564 × 6469.90
128 × 12876.65
224 × 22487.79
PReLU5150.20.564 × 6471.95
128 × 12879.56
224 × 22491.97
Stage IIIReLU5200.10.564 × 6470.09
128 × 12876.89
224 × 22489.99
PReLU5200.10.564 × 6472.57
128 × 12883.34
224 × 22493.99
Disclaimer/Publisher’s Note: The statements, opinions and data contained in all publications are solely those of the individual author(s) and contributor(s) and not of MDPI and/or the editor(s). MDPI and/or the editor(s) disclaim responsibility for any injury to people or property resulting from any ideas, methods, instructions or products referred to in the content.

