Article

The Influence of Good Agricultural Practice (GAP) on the Productivity and Well-Being of Malaysian Sustainable Palm Oil (MSPO)-Certified Independent Smallholders in Malaysia

by
Nurul Atiqah binti Mohd Suib
1,
Norlida Hanim Mohd Salleh
1,*,
Md Shafiin Shukor
1,
Norshamliza Chamhuri
1,
Shahida Shahimi
1,
Kamalrudin Mohamed Salleh
2 and
Khairuman Hashim
3
1
Center for Sustainable and Inclusive Development Studies, Faculty of Economics and Management, Universiti Kebangsaan Malaysia(UKM), Bangi 43600, Selangor, Malaysia
2
Economics and Industry Development Division, Malaysian Palm Oil Board (MPOB), Bandar Baru Bangi, Kajang 43000, Selangor, Malaysia
3
Smallholder Development Research Division, Malaysian Palm Oil Board (MPOB), Bandar Baru Bangi, Kajang 43000, Selangor, Malaysia
*
Author to whom correspondence should be addressed.
Agriculture 2023, 13(5), 990; https://doi.org/10.3390/agriculture13050990
Submission received: 31 March 2023 / Revised: 21 April 2023 / Accepted: 22 April 2023 / Published: 29 April 2023

Abstract

:
Good agricultural practice (GAP) helps increase productivity by producing fresh fruit bunches (FFBs), and selling FFBs will increase Independent Smallholders’ (ISH) income. However, although GAP promotes increased productivity, the effectiveness of GAP in delivering the well-being of the ISH in oil palm production areas remains to be determined. To that end, this study (i) measures the smallholder’s well-being index, (ii) compares the well-being index by states in Malaysia, and (iii) maps the relationship between GAP implementation, productivity, and well-being. The study selected respondents using purposive sampling (PS). PS identifies and selects individuals with Malaysian Sustainable Palm Oil (MSPO) certification and knowledge and experience of GAP. As a result, the research interviewed 564 ISHs with MSPO certification from 162 Sustainable Palm Oil Clusters (SPOC). The study used Principal Components Analysis (PCA) and the Structural Equation Model (SEM) framework to achieve the objectives. The study found that the average ISH well-being index was 0.62, and ISHs in Sabah had the highest well-being, with 0.73 compared to other states. The study also found that GAP influences productivity and is positively and significantly related to well-being. Therefore, it indicates to ISHs and the government the importance of GAP implementation to increase ISHs’ productivity and well-being.

1. Introduction

The scientific name of palm oil from West African woods is Elaeis Guineesis. The name “Guineesis” denotes that the original specimen originated in Guinea, a country in West Africa. However, the world’s oil palm industry is seen to be more developed in Southeast Asian regions such as Malaysia. The history of the oil palm industry in Malaysia began in 1848, when four seedlings of this plant were brought to and planted in the Bogor Botanical Garden, Indonesia. The first plant was used on the roadside as an ornamental plant in Deli, Sumatra, because it has a beautiful clump. In 1911, it was brought to Malaysia in Rantau Panjang, Kuala Selangor, with the same purpose. However, its economic potential was first realized by the government in the 1960s through the establishment of the Federal Land Development Authority (FELDA) to eradicate the people’s poverty by cultivating oil palm and rubber plants. In the late 1970s and 1980s, Malaysia’s oil palm industry was developed very widely and made oil palm the country’s main commodity crop.
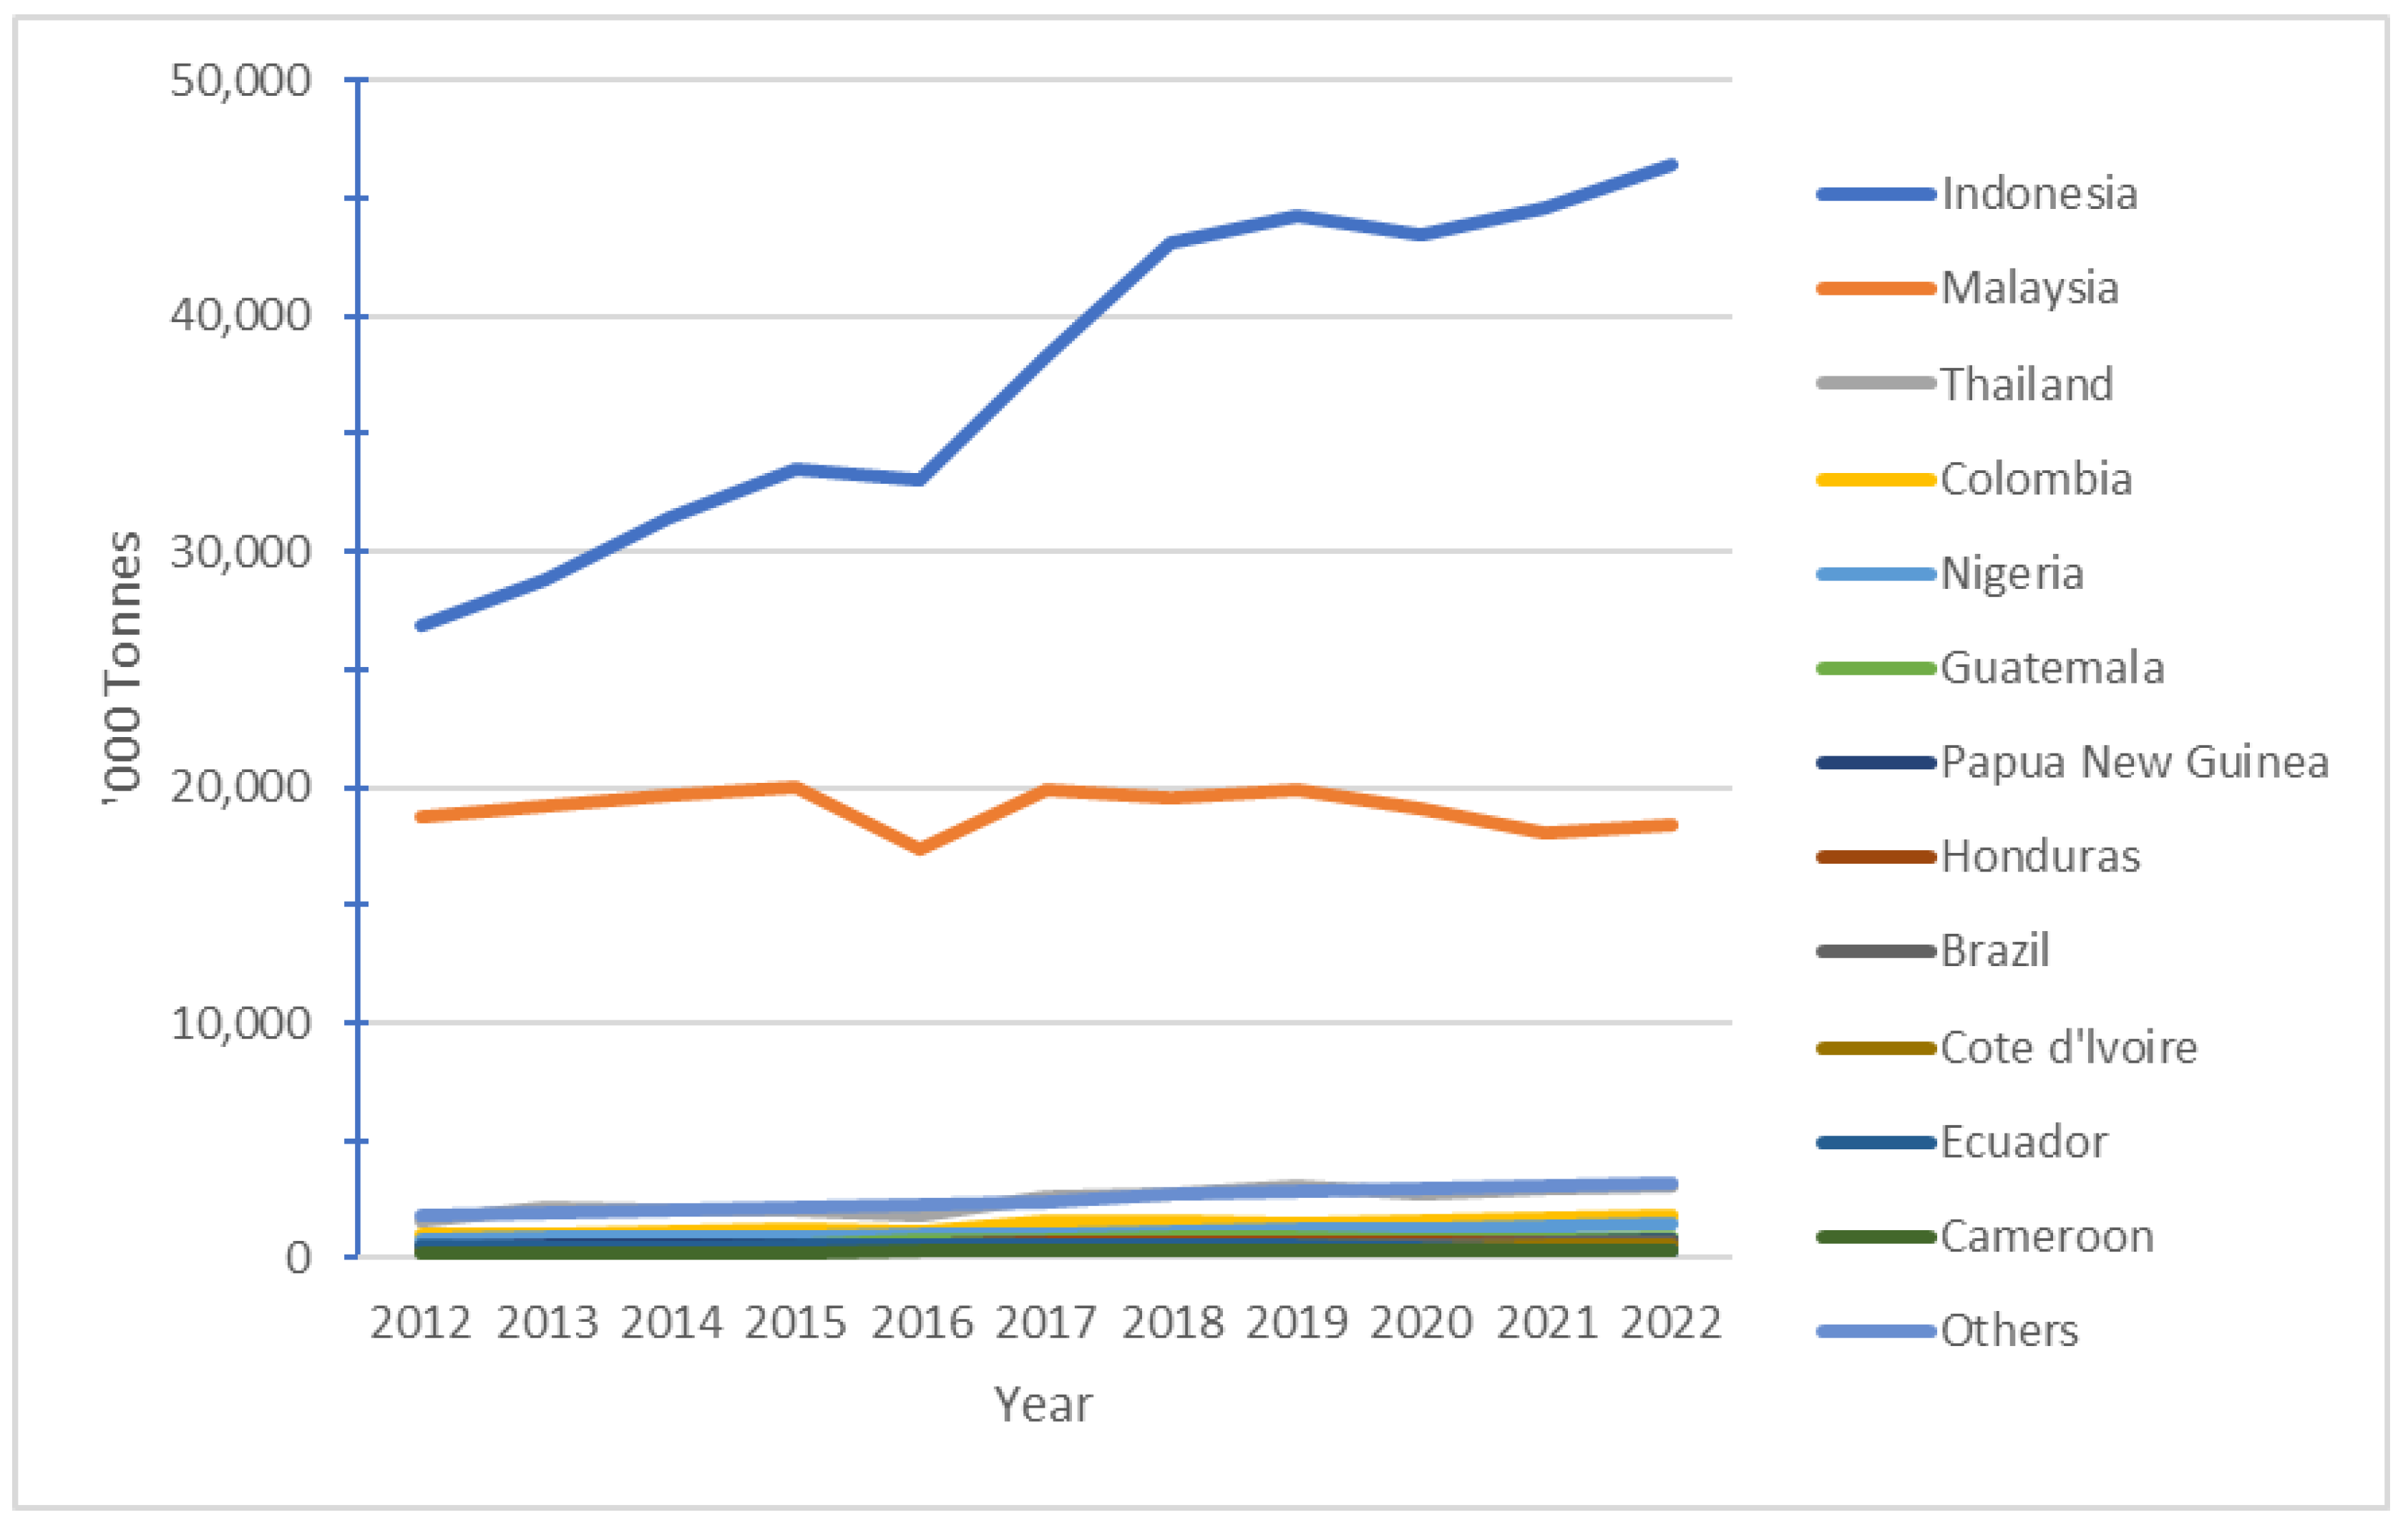
Now, Malaysia is the world’s second-largest oil palm producer after Indonesia, followed by Thailand, Colombia, and Nigeria (Figure 1). Malaysia recorded production between 18 and 20 million tons per year, with a growth rate of around 2% in 2020–2022. Meanwhile, Indonesia’s production has increased yearly, reaching 46 million tons in 2022. Indonesia’s production growth rate is around 4% for the same period. The production growth rate in other countries also increased, although on a small scale. According to [1], the increase in palm oil production is due to the rapid demand for vegetable oil, widely used in foods, industrial applications, and bioenergy.
However, the development of the palm oil industry in this region has led to severe environmental issues. Because of the haze issue affecting most countries in Southeast Asia in the late 1990s, the world’s oil palm industry has often received strong criticism from non-governmental organisations and environmental activists [3]. Among the other criticisms, the issue of afforestation on a large scale for the opening of oil palm plantations, which affects the environment and land ownership, is also often debated worldwide. The change in land use from forest areas to oil palm cultivation destroys biodiversity, causes soil erosion and the existence of crop residues, and reduces water and air quality [4,5,6,7,8]. In addition, palm oil-producing countries practice cutting and burning for land clearing and drainage in peatland areas [9]. This practice harms the ecological system and causes forest burning and carbon dioxide emissions, ultimately contributing to climate change [10,11]. As a result, some countries have launched anti-palm oil campaigns, such as the European Union, which restricts the import of palm oil to stop deforestation in Indonesia and Malaysia [12,13].
Another issue involving palm oil is global consumer awareness of the importance of sustainability for every product produced. For example, Ref. [14] found that consumers in the United Kingdom (UK) view products containing palm oil as having a negative impact on the environment and sustainable development in the production area. A similar consumer perception of the presence of palm oil in foodstuffs in Spain and Peru was found in [15]. Peruvian consumers believe that the selection of palm oil products is one of the worst compared to other vegetable oils when considering the environmental impact. Meanwhile, Spanish consumers consider the content of palm oil terrible for their health and the environment. This increase in consumer awareness is supported by [14,15,16,17,18]’s analysis of consumer perceptions of products containing palm oil. Although they know the benefits of palm oil and still buy products containing palm oil, they believe it has harmed the environment and society [14]. The world’s palm oil industry continues to face this pressure when the primary users of palm oil stipulate that they only use palm oil made by certified producers.
The Malaysian government, through the Malaysian Palm Oil Certification Council (MPOCC), has introduced the Malaysian Sustainable Palm Oil (MSPO) certification to counter these negative perceptions and address consumer issues that arise. MSPO is a national scheme introduced to Malaysia’s smallholders and oil palm milling industry. MSPO has seven principles, one of which is good practice, which includes good agricultural practice (GAP). According to [19], GAP is a set of agricultural management practices used at the farm and post-production levels for producing safe and quality artificial products and food that are sensitive to economic, social, and environmental considerations. Meanwhile, the Department of Agriculture (as cited in [20]) stated that GAP is a resource management system for sustainable agricultural production, increasing productivity and producing safe and quality food. However, the use of the term GAP differs according to the smallholder’s needs, the type of agriculture, and the producing country.
For example, in Ethiopia, GAP implementation for soybean farming consists of seven techniques: land selection and preparation, variety and seed selection, inoculation, applying fertiliser, planting, field management, and harvesting. Smallholders implement this GAP to produce good output and minimise costs. It also increase smallholders’ productivity, with output as high as 3500–4000 kg/ha (sole crop) [21]. Therefore, soybean GAP is needed in Ethiopia to improve productivity and product quality while also saving costs. Singapore applies GAP in the production of vegetables. Six key areas are used as guidelines for small vegetable farmers: farm location, farm structure, farm environment, farm maintenance, farming practices, and farm management. These practices are formulated based on the Hazard Analysis of Critical Control Points (HACCP) [22]. Thus, the need for vegetable GAP in Singapore emphasises environmental care.
As for palm oil GAP in Malaysia, it comprises nine management techniques: land preparation, soil conservation, weed control, fertiliser application, pruning, pest control, disease control, harvesting, and record keeping. The implementation of GAP by palm oil smallholders is divided into three levels of compliance: compulsory practice, mandatory practice, and encouraged practice. According to [23], palm oil GAP in Malaysia is the basis for increasing productivity and is a requirement for sustainability certification. Therefore, it is necessary to include GAP in MSPO criteria. The purpose for GAP for palm oil in Malaysia is to increase productivity and protect the environment. Although the formation of GAP differs according to the needs of smallholders, the type of agriculture, and the producing country, the goal of GAP is broad and continuous, as it considers the interests of the whole society [24].
Moreover, GAP compliance by smallholders through sustainability certification is more effectively encouraged. Although the impact of GAP is diverse, for this study, only the impact of GAP on the productivity of smallholders is discussed. Regarding productivity effectiveness, Ref. [25] argue that certification schemes such as that of the Roundtable on Sustainable Palm Oil (RSPO) actively promote GAP compliance by palm oil smallholders, which can guarantee increased productivity. A study by [26] in Jambi, Indonesia, found that fresh fruit bunch (FFB) weight increased to 21 kg after the first six months of GAP implementation. The authors of [27,28] also support applying GAP, which is part of the principles and criteria of the RSPO, and found that it achieves high yields. A study by [28] in Kotawaringin Barat District, Indonesia, found that GAP produces significantly higher yields, which increased from 14.5 t/ha/yr to 22.5 t/ha/yr. Therefore, it is clear that implementing GAP through sustainability certification can help increase the productivity of smallholders.
Although there is still no empirical study on the effectiveness of implementing GAP through MSPO on productivity, according to [29], increasing FFB yield up to 30 t/ha/yr can be achieved if smallholders implement GAP according to MSPO. Additionally, according to Mansor (as cited in [30]), it is estimated that the yield of FFBs will increase by at least 30% from the current productivity within three years after the implementation of GAP with technology adoption by MSPO-certified smallholders. In line with such studies, this study also expected the productivity of MSPO-certified oil palm smallholders to increase by implementing GAP in managing their plantations. Nevertheless, although GAP through MSPO promotes increased productivity, the effectiveness of GAP in delivering the well-being of smallholders in oil palm production areas still needs to be determined.
According to [31], well-being is a combination of good feelings that consists of positive experiences, having purpose in actions, and positive relationships. In [32], five indicators of well-being were suggested, namely positive emotions, engagement, relationships, meaning, and achievement (PERMA). These indicators reflect human nature. However, according to [
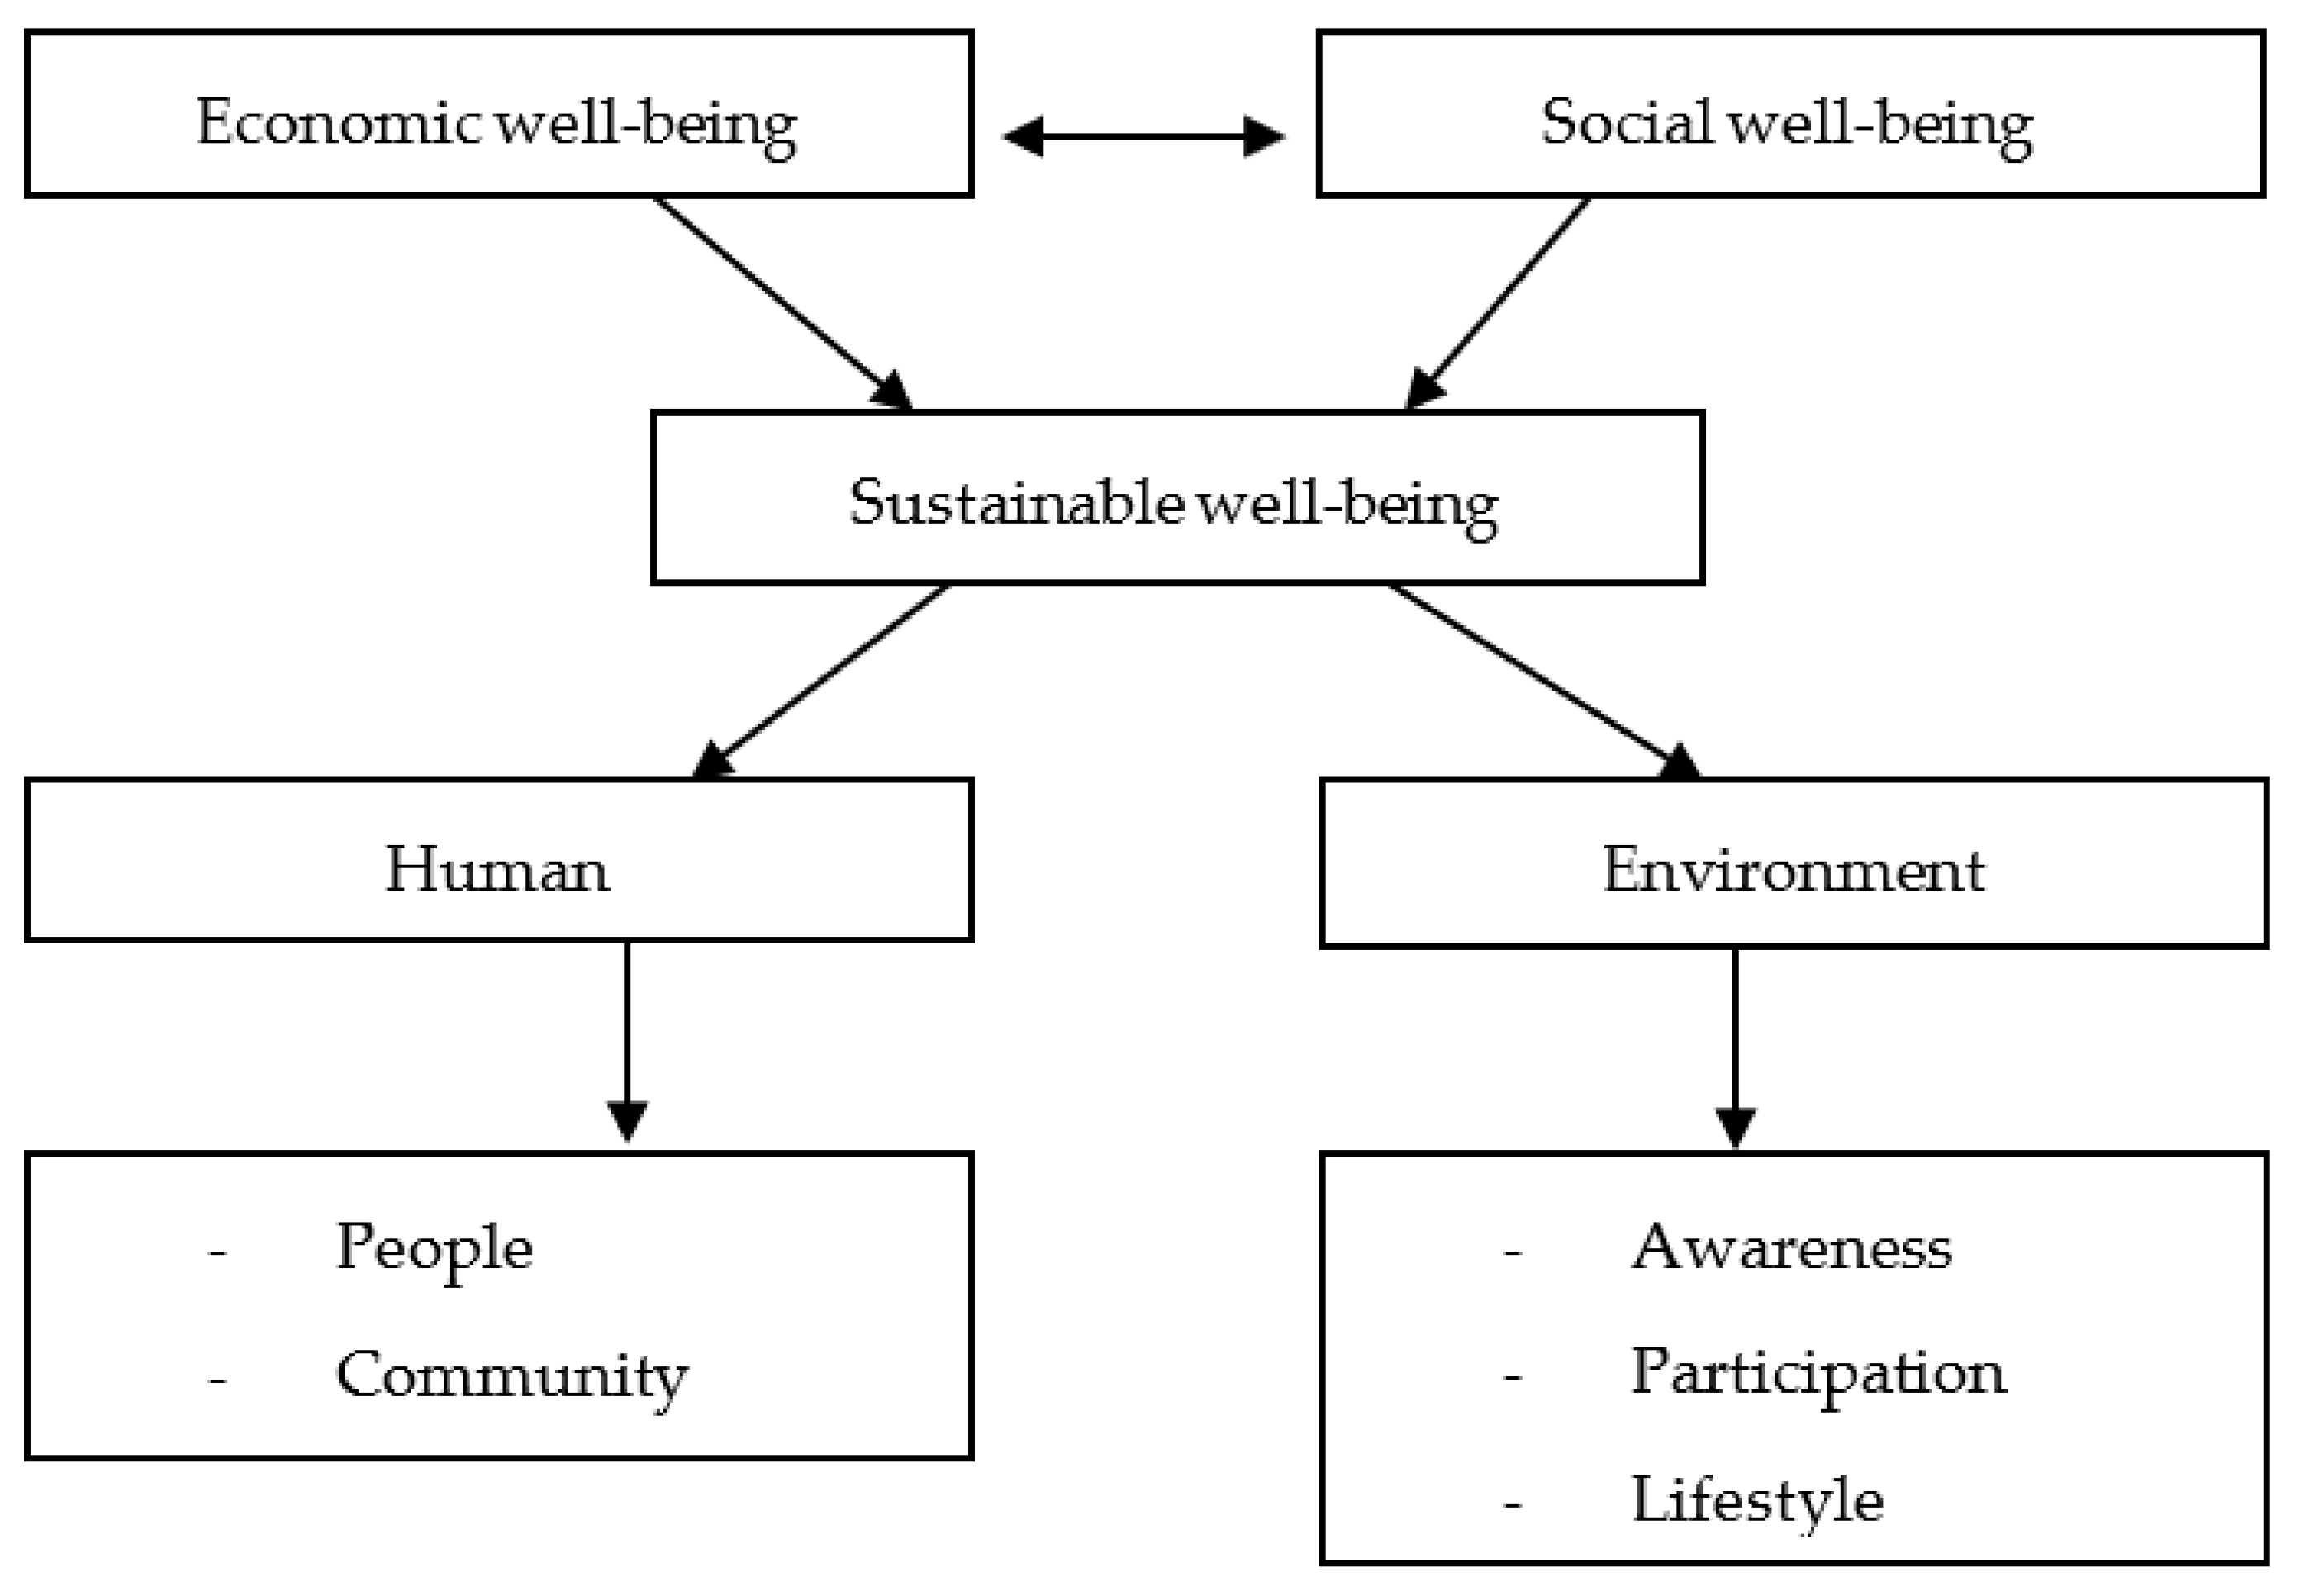
33], sustainable well-being can be achieved through economic and social well-being. Figure 2 shows the sustainable well-being chart introduced by [33] which involves humans (people and community) and the environment (awareness, participation, and lifestyle).
Since well-being is key to productivity [34], it is not limited to smallholders. The authors of [35] found that factors such as technology, optimal resources, insurance, market pricing, and tax policy will first impact smallholders’ economic well-being and, subsequently, their social well-being. However, previous studies often relate the Sustainable Development Goals (SDGs) when discussing the well-being of smallholders, such as [36,37,38], which include the well-being of oil palm smallholders [39,40,41,42]. The SDGs comprise 17 goals, among which are to end poverty, preserve the planet, and ensure that all people live in peace and harmony by 2030 [43]. According to [44] smallholder palm oil, especially in Indonesia, played a role in achieving 13 goals out of the total SDG goals. Furthermore, the SDGs emphasise that sustainable development must balance social, economic and environmental considerations. For example, the literature review by [40] discussed the impact of palm oil on social, economic, and environmental aspects in addition to health and biodiversity across 234 articles. The study also discussed future strategies based on the SDGs for each of the effects found.
The field of research began to be developed by relating the impact of sustainability certification to the well-being of oil palm smallholders, considering that various certifications had been introduced. Among the palm oil sustainability certifications often used by the world palm industry are those issued by the RSPO, International Sustainability and Carbon Certification (ISCC), Indonesia Sustainable Palm Oil (ISPO), and MSPO. However, most previous studies discussed the impact of RSPO and ISPO on the well-being of oil palm smallholders, such as [39,45,46], with no study on MSPO. Notably, most of the research results found that sustainability certificates help to improve the well-being of oil palm smallholders [45,46,47].
Furthermore, most previous studies discussed the impact of the oil palm industry on smallholders in terms of poverty and environmental problems, which are important indicators of their well-being [41,45,48,49,50]. In principle, the income earned by oil palm smallholders can improve households’ living standards, eventually ending poverty. A study by [51,52,53], conducted using data from Malaysia, showed that oil palm cultivation positively affected smallholders’ income. This was also found to be the case in Indonesia by [54,55,56,57], one of the two countries which are the world’s largest palm oil producers. Other producing countries have also proven that oil palm cultivation can increase income and eliminate poverty, such as Ghana [45] and Guatemala [58]. Although the increase in income and poverty can be reduced, the environment’s well-being is often at risk.
The environmental issues the oil palm industry faces have negatively impacted the well-being of smallholders and the local community. In addition, palm oil production activities in farms, such as using excessive fertilisers, inefficient wastewater management, using gasoline to kill weeds, and so on, performed by smallholders [59], will harm the environment and humans. Furthermore, according to [9], burning forests and peat land to prepare land for oil palm cultivation will cause the release of carbon dioxide (CO2), affecting the health of smallholders and local communities. Therefore, GAP is expected to solve the dilemma, curbing environmental issues caused by the oil palm industry, especially those affecting smallholders, in addition to increasing their income and, subsequently, their well-being.
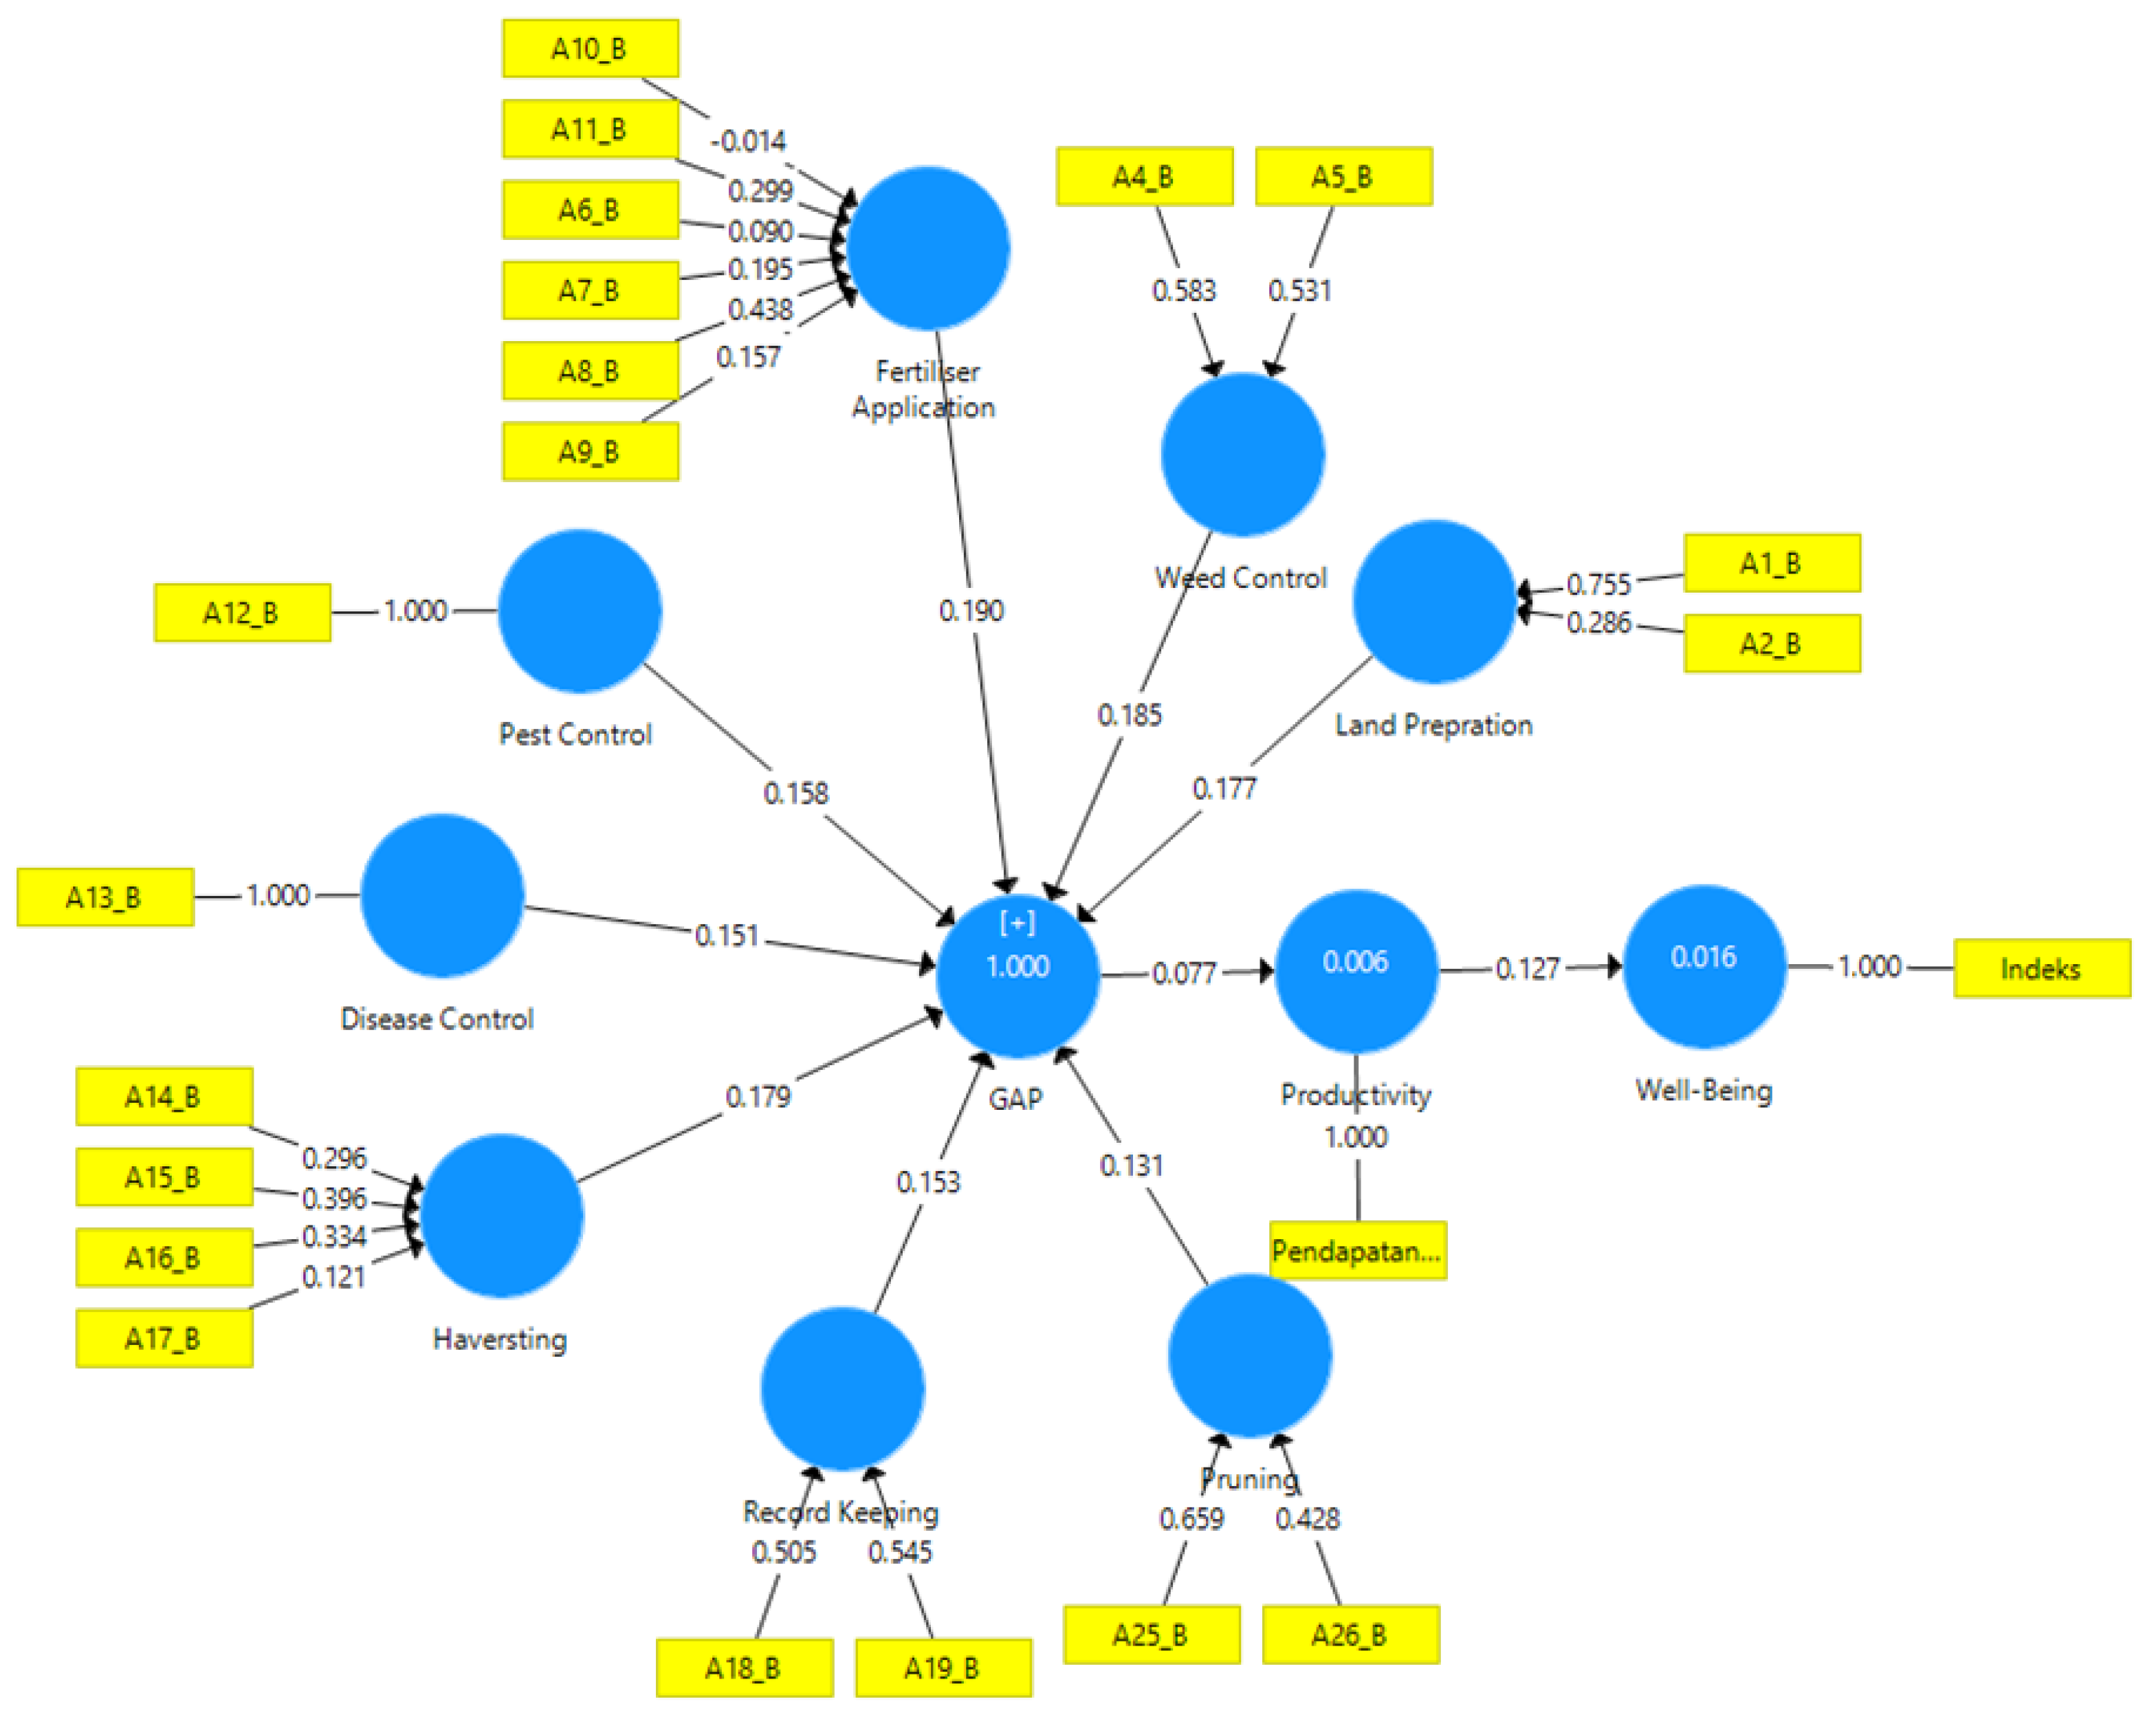
This study aims to (i) measure the smallholder’s well-being index, (ii) compare the well-being index by states in Malaysia, and (iii) analyse the relationship between GAP implementation, productivity, and well-being. For objective (iii), this study made the following hypotheses:
Hypothesis 1 (H1).
GAP has a positive correlation with productivity.
Hypothesis 2 (H2).
Productivity has a positive correlation with well-being.
This study focuses on the well-being of smallholders, specifically Independent Smallholders (ISHs) who have obtained the MSPO certificate. There are two types of oil palm smallholders in Malaysia: organised smallholders and ISHs. Farm management for organised smallholders is better than that for ISH because they are regulated by several agencies (for example, FELDA, FELCRA, and RISDA), and usually, farm preparation materials and assistance are provided by these agencies. Therefore, they will receive wages monthly even if there is no production that month. On the other hand, compared to organised smallholders, the farm management of ISHs is poor because, according to Mansor (as cited in [23]), from 400 ISH, only 26% apply GAP.

2. Materials and Methods

2.1. Study Area

This study used a quantitative approach to accurately measure respondents’ behaviour and levels of knowledge [60]. The population of this study was ISHs with MSPO certification. As of 2020, 129,307 ISHs have obtained MSPO certification (see Table 1). MSPO certification for ISHs is achieved by establishing a Sustainable Palm Oil Cluster (SPOC). A SPOC is established by grouping ISHs into several small clusters, with between 1000 and 2000 ISHs in each cluster [61]. Therefore, each ISH under the same SPOC will be jointly certified under one MSPO certificate. As a result, 162 SPOCs have been formed. Figure 3 shows the distribution of SPOCs in Peninsular Malaysia, Sabah, and Sarawak.
Purposive sampling (PS) was conducted on all the SPOCs. PS is also known as judgement sampling. This sampling involves the identification and selection of individuals or groups who are knowledgeable about the phenomenon of interest [62] and are willing to participate in the research by conveying their experiences and opinions in a clear, expressive, and reflective manner [63]. Therefore, the total population sampling (TPS) method was used for this study by selecting ISHs with experience and knowledge of GAP and who have MSPO certification. TPS is a method that involves all populations that meet criteria such as skill sets, experience, and others in the research conducted [18]. The study determined the minimum sample size by referring to [64,65]. Determination of the minimum sample size according to the method of [64] was determined by the equation below:
x 2 · N P ( 1 P ) N 1 d 2 + x 2 P ( 1 P ) = n
where n is the sample size, N is population size: 129,307, x 2 is chi-square value: 3.841, P is population proportion: 0.5 (95%), and d is estimation error (0.05). In numerical form, the equation will be:
3.841 ( 129,307 ) 0.5 1 0.5 129,307 1 0.05 2 + 3.841 ( 1 0.5 ) = 381.83 = 382
wherein, according to [65], the minimum sample size should be ten times the maximum number of arrows indicating latent variables in the constructed SEM structural model. Since the PLS–SEM framework in Figure 4 has 32 arrows, the minimum sample size for this study is 320 samples. Therefore, based on the determination of the sample size by [64,65], the study required a sample size of 320 to 382 for a total population of 129,307 ISHs with MSPO. A total of 564 ISH in Malaysia were interviewed and given a set of questionnaires related to the study. However, only 475 questionnaires were answered completely and used for analysis.

2.2. Instrument and Data Collection

The study used primary data in which a questionnaire was the main instrument used for data collection. A semi-structured interview method with selected ISHs was conducted. The constructed questions were from discussions with the Malaysian Palm Oil Board (MPOB) and [66]. The questionnaire has three parts. The first part contains questions related to the respondent’s demographic profile and farm information, comprising six questions. The questions are in the form of multiple-choice, two-choice, and open-ended questions. Further, the second part is a question related to the level of GAP implementation, which consists of nine constructs. The nine constructs are land preparation (two items), soil conservation (one item), weed control (two items), fertiliser application (six items), pruning (two items), disease control (one item), harvesting (four items), and record keeping (two items).
The final part is related to the perceptions of their level of well-being after achieving MSPO certification and comprises 50 questions. The questions are from eight constructs, namely income and wealth (ten items), employment and income (two items), living conditions (five items), health (eight items), work and life balance (nine items), education and skills (six items), environmental quality (four items), and subjective well-being (six items). For the second and third parts, the questions are in the form of a Likert scale on a five-point scale. In the second part, scale 1 represents not fully implemented, and scale five is fully implemented, while in the final part, scale one is strongly disagree, and scale five is strongly agree.
Initially, the questionnaire was constructed using Malay and then translated into English by an accredited translator. After that, the study ensured that every word was translated accurately and consistently reflects the initial questionnaire. Next, pre-testing was carried out before the actual data collection. The validity of the questionnaire for this study was evaluated by an MPOB officer and a lecturer from Universiti Utara Malaysia (UUM), an agricultural economics scholar. A total of seven (7) questionnaires were distributed to five (5) ISHs who had obtained MSPO certificates, and two (2) lecturers involved in the field of agricultural economics. Meanwhile, reliability was determined by using Cronbach’s Alpha (α) test to determine whether the questionnaire could give the same answer to each population size and sample. The Cronbach’s Alpha (α) results at this pre-testing stage showed a value of 0.70 and above, which means that the data obtained is good and effective for this study.
In order to ensure that data collection was done well, TUNAS (Tunjuk Ajar dan Nasihat Sawit) officers were appointed as enumerators to distribute questionnaires and interview respondents in each SPOC in Malaysia. A briefing on how to answer the questionnaire was performed in stages. The first stage involved ICS (Internal Control System) officers, who are the TUNAS officers’ supervisors, to inform them of the needs of the study. At the same time, the ICS reviewed the questionnaire to ensure that the questionnaire was ready to be distributed. Then, the ICS explained the results of the briefing to their TUNAS officers. In the second stage, the briefing was given directly to TUNAS officials. This was done to ensure that TUNAS officers understood the needs of the study, and if there were any problems in implementing data collection, the problems could be solved earlier. Afterwards, the questionnaire was ready to be distributed to the actual respondents. The data collection was conducted from April to November 2022.
In addition, this study has obtained ethical approval, since this study is an interventional study involving humans. The Research Ethics Committee of Universiti Kebangsaan Malaysia (REC-UKM) is the authority that provided approval for the research, and the code is UKM PPI/111/8/JEP-2023-018.

2.3. Data Analysis

This study had two steps to achieve its objectives. First was a Principal Component Analysis (PCA) to determine the well-being index [67,68] with STATA 14, and the second was Partial Least Squares Structural Equation Modelling (PLS–SEM) to analyse the relationship between dependent and independent variables [69]. PCA was used to build a new construct to form a well-being index. Before PCA is done, some conditions need to be met: the data does not require normality and homoscedasticity. A sufficient number of data obtained by PCA adequately represent the theoretical construct under study. It can be defined by: (i) the relative values of the eigenvalues (variances of the components); (ii) the total variance explained by the components, which are all components with eigenvalues greater than one that should be retained. The justification is that if all variables were uncorrelated, each eigenvalue (λ) would equal 1. If λ < 1, the component provides less information than the original variable and should not be used [70].
The well-being index was constructed from 50 items measured using a 1–5 Likert scale indicating the degree of agreement with increasing well-being. A Likert scale measures the indicators from 1 (strongly disagree) to 5 (strongly agree). These items were formed into eight constructs: income and wealth (IW), employment and income (EI), residential (R), work and life balance (WB), health (H), education and skills (ES), environmental quality (EQ), and subjective well-being (SW). Because the construct score generated by PCA might have a positive or negative value, normalisation was carried out by transforming the value using the rank of percentiles to the index, in which the score ranged from 0 to 1. This situation made the total variance explained by the components exceed 50%, which meets the requirements of PCA. Then, indicator scores were assigned with weights derived from the PCA to estimate the well-being index (WI) as below:
W e l l b e i n g   i n d e x = i n W i X i
where Wi is the weight of the indicator, Xi is the indicator score, and n is the number of indicators.
In the second step, PLS–SEM analysis was used in this study. SEM was chosen because it can show a clear relationship between GAP implementation, productivity, and well-being. Moreover, it can give a simple evaluation compared to other methods, even though the model developed is complex and involves many linear equations [71]. The study uses “smart” partial least squares (SmartPLS) software, version 3.0. SmartPLS, one of the most popular and powerful statistical techniques available to calculate path estimates and model parameters without the concern of normality of data [72], is suitable for both large and small samples. In addition, this study evaluates items for each construct developed. Therefore, SmartPLS is suitable for that analysis.
SmartPLS consists of the measurement model and the structural model properties of data. The measurement model for formative indicators uses variance inflation factor (VIF) and outer weight. The VIF test was used to assess the multicollinearity issue. If the VIF value is less than 3.33, it indicates no multicollinearity [73]. At the same time, the outer weight of the items should be significant [65]. If a particular outer weight is insignificant (p-value < 0.050 and t-value < 1.96), then outer loading and the minimum required value of 0.50 is checked. That indicator is removed if both weights are not significant and outer loadings are less than 0.50.
The structural model was assessed by examining the values of the coefficient of determination (R2), predictive relevance (Q2), and path coefficients. The value of Q2 must be more than 0, which indicates predictive relevance; Q square: 0.02, 0.15, 0.35 for weak, moderate, and strong effects of predictive relevance [74]. The path coefficients should be greater than 0.10 or 0.20 [75] with t-statistics and a significant level [76]. A two-tailed T-test is considered with 1.645, 1.96, and 2.576 critical values of t at a significant level (p-value) of 0.1, 0.05, and 0.01, respectively.

3. Results and Discussion

3.1. Profile of Respondent

The information presented in Table 2 shows that the majority of respondents had an SPM and MCE level of education (39.4%). They were followed by respondents with SRP, LCE and equivalent (18.1%), and UPSR and equivalent (12.6%) education levels. Then, most respondents had experience managing oil palm production for 11 to 20 years, at 40.0%, and 1 to 10 years, at 32.8%. Next, they planted oil palms, starting in 1957, on their farms certified by MSPO, and most respondents planted them from 2001 to 2010, at 38%. Therefore, most of the palm trees were under 20 years old, at 85.7%, and most of the respondents earned income below MYR 20,000, at 50.3%. Regarding farm size, the majority were 1.01–10.00 acres (76.2%).

3.2. Principal Component Analysis (PCA)

Table 3 shows the mean value exceeded 2.50, meaning respondents “agree” with each construct statement. The Pearson correlation matrix for the eight constructs used in the PCA analysis is shown in Table 4. Statistically significant correlations were observed for all variables (p < 0.01).
Table 5 contains the eigenvalues for the first four principal components and the eigenvectors related to each of the principal eigenvalues. Based on Kaiser’s criterion [70], only the components with eigenvalues greater than one could be maintained. Thus, in our analysis, we kept only one PC (λ1 = 5.797). As regards the covering proportion, those four principal components preserved roughly 0.725 or 72.5% of the total variance. Therefore, a remarkable dimensional reduction was achieved if the information from the first component was used. Kaiser–Meyer–Olkin (KMO) shows 0.9401, indicating the variance proportion in the adequate construct. The coefficients of the eight constructs in the first principal component after standardisation are given in Table 6. It can be observed that all coefficients are positive and almost equal, implying that the five variables participate with equal weights to the formation of the first principal component and, therefore, to the proposed well-being index having the formula:
W e l l b e i n g   i n d e x = 0.3664 I W + 0.3118 E I + 0.3613 R + 0.3393 W B + 0.3826 H + 0.3650 E S + 0.3489 E Q + 0.3487 S W
Table 7 shows that the mean well-being index was 0.6190, and the mean level of well-being for ISHs (MSPO) was 61.90% in Malaysia. The index indicated that the well-being of those with MSPO certification is positive and acceptable. The finding corresponds with [41,42], which reported that oil palm smallholders had received many benefits through certifications such as MSPO and RSPO. There is no denying that oil palm smallholders have obtained many benefits by participating in being sustainably certified. However, given that 61.90% is slightly more than half, ISH’s well-being and quality of life need to be continuously enhanced.
Furthermore, the highest ISH’s well-being was in Sabah (0.7345), followed by Terengganu (0.7217) and Sarawak (0.6619). Conversely, the lowest well-being level was of ISHs in Melaka (0.3264). The result is interesting, given that ISHs in Sabah and Sarawak face greater challenges implementing GAP and being sustainably certified. It was reported in [77] that most smallholders in Sabah and Sarawak have limited access to a broader market, making them dependent on traders willing to travel long distances to collect harvested FFBs. Additionally, smallholders in both states need more support in getting access to seeds, fertiliser, and a workforce.

3.3. PLS–SEM Analysis

3.3.1. Measurement Model

Table 8 shows the mean value exceeded 2.50, meaning respondents “agree” with each construct statement. Table 8 also show the VIFs of all the indicators of land preparation, soil conservation, weed control, fertiliser application, pruning, pest control, disease control, harvesting, and record keeping, ensuring that multicollinearity is not present. The result shows that all VIF values are below the threshold limit of 3.33; thus, there is no issue of multicollinearity of the indicator with the construct. Table 8 also shows the significance and relevance of the formative indicators. In the bootstrapping procedure of 2000 sub-samples, the results indicated that all outer weights are significant, with t-statistics > 1.96 and p-value < 0.05, except for two indicators on fertiliser application and one indicator on harvesting. However, all the indicators were retained because the outer loadings exceeded 0.50.

3.3.2. Assessment Structural Model of Second-Order Constructs

In this study, GAP was specified as a second-order formative construct that comprised eight first-order formative constructs (disease control, fertiliser application, harvesting, land preparation, pest control, pruning, record keeping, and weed control). All the path coefficients of all factors in the first-order to good agricultural practices were greater than 0.10 and significant at p-value < 0.01, meaning all factors were essential for building good agricultural practices of palm oil smallholders (Table 9).

3.3.3. Assessment Structural Model of Hypothesis Test

The R2 value, the statistical significance of the Q2 value, and path coefficient values were used to measure the structural model’s overall explanatory capacity of constructs. Figure 5 illustrates the structural model’s output. Table 10 shows that the R2 obtained for member activism is 1.000, which means that 100% of the variance in GAP by all factors is in the second order, whereas the R2 obtained for productivity is 0.006, which means that GAP explains 0.6% of the variance in productivity. Further, the R2 obtained for well-being is 0.016, which means that 1.6% of the variance in well-being is explained by productivity. The results for Q2 for each construct are 0.447 (GAP), 0.004 (productivity), and 0.015 (well-being). Both constructs yielded a Q2 of more than 0.0, thus showing that the model has predictive relevance.
Furthermore, Table 11 and Figure 5 show the path coefficients along with their t-values and p-values. The relationship between GAP and productivity shows that the effect of GAP and productivity (β = 0.077; t-value = 1.826, p-value = 0.068) is considered positive and significant, indicating that H1 is supportive. This result supports [21], which states that sustainable agricultural production will increase productivity (income). Further, the relationship between productivity and well-being with a 0.127 value of path coefficients (β) (t-value = 3.040; p-value = 0.002) is considered positive and significant, indicating that H2 is supportive. It explains that productivity can directly enhance well-being. This result supports [51,52], who state that economic productivity (income) can increase the well-being of palm oil smallholders in Malaysia, and where one of the impacts of MSPO is shown.

3.4. Limitations of the Study and Areas for Further Studies

There were several limitations when this study was conducted. First, respondents in rural areas, especially in the states of Sabah and Sarawak, prefer to be interviewed using their native language. This caused the data collection process to take a long time because the enumerator had to explain the questions one by one. The study also found a limitation in the PLS–SEM analysis when the data was analysed; this analysis cannot be applied when structural models contain causal loops or circular relationships between the latent variables.
Therefore, the study suggests that for future studies, the chosen analysis must have the strength to diversify the research findings, which can bring innovation when data analysis activities are carried out. In addition, index measurement can be done according to [33], which classifies well-being into economic and social well-being to see their well-being from various aspects and as an entirety.

4. Conclusions

Palm oil GAP in Malaysia is the basis for increasing productivity and is a requirement for MSPO [23]. Although GAP through MSPO promotes increased productivity, the effectiveness of GAP in delivering the well-being of smallholders in FFB production areas still needs to be determined. Therefore, an extensive literature review was undertaken to understand GAP’s influence on ISHs’ productivity and well-being with MSPO certification. As a result, much literature has discussed how good agricultural practices and certification benefit and increase crop productivity [21,27,28]. Nevertheless, some literature reflected otherwise, with results in sustainability certification not necessarily bringing a positive outcome [41]. Therefore, this research was undertaken to (i) identify measures of the smallholder’s well-being index, (ii) compare the well-being index by states in Malaysia, and (iii) look at the relationship between the implementation of GAP, productivity, and well-being.
The study used quantitative methods and questionnaires to collect data for 564 ISHs in Malaysia. Then, the study analysed the data using PCA and SEM methods to achieve the objectives. The results showed that when using PCA, Malaysia’s ISHs’ well-being index was reported at 61.86%, and the ISHs in Sabah had the highest well-being index (0.7345). The study also found that GAP can increase productivity and directly increase ISHs’ well-being. Therefore, the ISHs must improve their knowledge, skills, and attitude to ensure that GAP implementation succeeds. This study also provides valuable input to stakeholders such as MPOB, MPOCC, and the Ministry of Plantation and Commodities to ensure that the well-being of ISHs is constantly improved and, at the same time, the sustainability of the oil palm industry can be guaranteed.

Author Contributions

Conceptualization, N.A.b.M.S., N.H.M.S., N.C., S.S., K.M.S. and K.H.; methodology, N.A.b.M.S., N.H.M.S. and M.S.S.; software, M.S.S.; validation, K.M.S. and K.H.; formal analysis, N.A.b.M.S., N.H.M.S. and M.S.S.; investigation, N.A.b.M.S., N.H.M.S. and K.H.; data curation, N.A.b.M.S. and N.H.M.S.; writing—original draft preparation, N.A.b.M.S.; writing—review and editing, N.H.M.S., M.S.S., N.C. and S.S.; visualization, K.M.S. and K.H.; supervision, N.H.M.S.; project administration, N.H.M.S., N.C., S.S., K.M.S. and K.H.; funding acquisition, N.H.M.S., N.C. and S.S. All authors have read and agreed to the published version of the manuscript.

Funding

This research was funded by MPOB-UKM Endowment Chair Grant, Malaysia, grant number: EP-2020-031.

Institutional Review Board Statement

The study was conducted in accordance with the Declaration of Helsinki, ICH and Malaysian GCP Guidelines, and approved by the UKM Research Ethics Committee (UKM PPI/111/8/JEP-2023-018 and 10 February 2023).

Data Availability Statement

The data presented in this study are available on request from the corresponding author. The data are not publicly available due to might containing information that could compromise the privacy of research participants.

Acknowledgments

We would like to express our deep gratitude to the Malaysian Palm Oil Board (ICS & TUNAS) for their able guidance and support in completing this project.

Conflicts of Interest

The authors declare no conflict of interest.

References

  1. Forests and Deforestation. Available online: https://ourworldindata.org/forests-and-deforestation (accessed on 17 April 2023).
  2. Oil World. Oil World Annual 2022; ISTA Mielke GmbH: Hamburg, Germany, 2023. [Google Scholar]
  3. Dauvergne, P. Is the power of brand-focused activism rising? The case of tropical deforestation. J. Environ. Dev. 2017, 26, 135–155. [Google Scholar] [CrossRef]
  4. De Almeida, A.S.; Vieira, I.C.G.; Ferraz, S.F. Long-term assessment of oil palm expansion and landscape change in the eastern Brazilian Amazon. Land Use Policy 2020, 90, 104321. [Google Scholar] [CrossRef]
  5. Guillaume, T.; Kotowska, M.M.; Hertel, D.; Knohl, A.; Krashevska, V.; Murtilaksono, K.; Scheu, S.; Kuzyakov, Y. Carbon costs and benefits of Indonesian rainforest conversion to plantations. Nat. Commun. 2018, 9, 2388. [Google Scholar] [CrossRef] [PubMed]
  6. Moreno-Peñaranda, R.; Gasparatos, A.; Stromberg, P.; Suwa, A.; Puppim de Oliveira, J.A. Stakeholder perceptions of the ecosystem services and human well-being impacts of palm oil biofuels in Indonesia and Malaysia. In Biofuels and Sustainability; Springer: Tokyo, Japan, 2018; pp. 133–173. [Google Scholar]
  7. Paterson, R.R.M.; Lima, N. Climate change affecting oil palm agronomy, and oil palm cultivation increasing climate change, require amelioration. Ecol. Evol. 2018, 8, 452–461. [Google Scholar] [CrossRef]
  8. Vijay, V.; Pimm, S.L.; Jenkins, C.N.; Smith, S.J. The impacts of oil palm on recent deforestation and biodiversity loss. PLoS ONE 2016, 11, e0159668. [Google Scholar] [CrossRef]
  9. Febria, D.; Fithriyana, R.; Isnaeni, L.M.A.; Librianty, N.; Irfan, A. Interaction between Environment, Economy, Society and Health in the Concept of Environmental Health: Studies on Peatland Communities. Maced. J. Med. Sci. 2021, 9, 919–923. [Google Scholar] [CrossRef]
  10. Miettinen, J.; Shi, C.; Liew, S.C. Land cover distribution in the peatlands of Peninsular Malaysia, Sumatra and Borneo in 2015 with changes since 1990. Glob. Ecol. Conserv. 2016, 6, 67–78. [Google Scholar] [CrossRef]
  11. Varkkey, H. Oil palm plantations and transboundary haze: Patronage networks and land licensing in Indonesia’s peatlands. Wetlands 2013, 33, 679–690. [Google Scholar] [CrossRef]
  12. Kushairi, A.; Ong-Abdullah, M.; Nambiappan, B.; Hishamuddin, E.; Bidin, M.N.I.Z.; Ghazali, R.; Subramaniam, V.; Sundram, S.; Parveez, G.K.A. Oil palm economic performance in Malaysia and R & D progress in 2018. J. Oil Palm Res. 2019, 31, 165–194. [Google Scholar]
  13. Winners and Losers from the EU’s Proposed Ban on Palm Oil. Available online: https://www.eco-business.com/opinion/winners-and-losers-from-the-eus-proposed-ban-on-palm-oil/ (accessed on 10 January 2023).
  14. Aguiar, L.K.; Martinez, D.C.; Caleman, S.M. Consumer awareness of palm oil as an ingredient in food and non-food products. J. Food Prod. Mark. 2018, 24, 297–310. [Google Scholar] [CrossRef]
  15. Guadalupe, G.A.; Lerma-García, M.J.; Fuentes, A.; Barat, J.M.; del Carmen Bas, M.; Fernández-Segovia, I. Presence of palm oil in foodstuffs: Consumers’ perception. Br. Food J. 2019, 121, 2148–2162. [Google Scholar] [CrossRef]
  16. Hinkes, C.; Christoph-Schulz, I. Consumer attitudes toward palm oil: Insights from focus group discussions. J. Food Prod. Mark. 2019, 25, 875–895. [Google Scholar] [CrossRef]
  17. Machová, R.; Ambrus, R.; Zsigmond, T.; Bakó, F. The impact of green marketing on consumer behavior in the market of palm oil products. Sustainability 2022, 14, 1364. [Google Scholar] [CrossRef]
  18. Plasek, B.; Lakner, Z.; Badak-Kerti, K.; Kovács, A.; Temesi, Á. Perceived consequences: General or specific? the case of palm oil-free products. Sustainability 2021, 13, 3550. [Google Scholar] [CrossRef]
  19. Srisopaporn, S.; Jourdain, D.; Perret, S.R.; Shivakoti, G. Adoption and continued participation in a public Good Agricultural Practices program: The case of rice farmers in the Central Plains of Thailand. Technol. Forecast. Soc. Chang. 2015, 96, 242–253. [Google Scholar] [CrossRef]
  20. Nawi, N.F.M.; Er, A.C.; Karudan, R.; Ibrahim, Y.; Arifin, A. Good Agricultural Practices Amongst Oil Palm Smallholders: A Case Study in Sabah. Religacion 2019, 4, 347–355. [Google Scholar]
  21. Better Soybean through Good Agricultural Practices [Leaflet]. Available online: http://africasoilhealth.cabi.org/wpcms/wp-content/uploads/2014/09/362-N2Africa-Ethiopia-soybean-booklet.pdf (accessed on 23 January 2023).
  22. Singapore Certification Scheme on GAP-VF Good Agricultural Practice (COP). Available online: https://www.sfa.gov.sg/docs/default-source/tools-and-resources/resources-for-businesses/gapvf.pdf (accessed on 15 January 2023).
  23. Mansor, N.H.; Che Jaafar, N.; Johari, M.A.; Kannan, P.; Tan, S.P. Acceptance of Good Agricultural Practices (GAP) among Independent Oil Palm Smallholders in Malaysia. Int. J. Mod. Trends Soc. Sci. 2021, 4, 1–12. [Google Scholar] [CrossRef]
  24. Opitz, R.; De Smedt, P.; Mayoral-Herrera, V.; Campana, S.; Vieri, M.; Baldwin, E.; Perna, C.; Sarri, D.; Verhegge, J. Practicing Critical Zone Observation in Agricultural Landscapes: Communities, Technology, Environment and Archaeology. Land 2023, 12, 179. [Google Scholar] [CrossRef]
  25. Rietberg, P.I.; Slingerland, M.A. Cost and Benefits of RSPO Certification for Independent Smallholders: A Science for Policy Paper for the RSPO; Wageningen University: Wageningen, The Netherlands, 2016; pp. 1–38. [Google Scholar]
  26. On Yield Gaps and Better Management Practices in Indonesian Smallholder Oil Palm Plantations. Available online: https://www.proquest.com/dissertations-theses/on-yield-gaps-better-management-practices/docview/2565160349/se-2 (accessed on 15 January 2023).
  27. Brandi, C.; Cabani, T.; Hosang, C.; Schirmbeck, S.; Westermann, L.; Wiese, H. Sustainability Certification in the Indonesian Palm Oil Sector: Benefits and Challenges for Smallholders; Deutsches Institut für Entwicklungspolitik (DIE): Bonn, Germany, 2013; pp. 94–98. [Google Scholar]
  28. De Vos, R.E.; Suwarno, A.; Slingerland, M.; Van Der Meer, P.J.; Lucey, J.M. Independent oil palm smallholder management practices and yields: Can RSPO certification make a difference? Environ. Res. Lett. 2021, 16, 065015. [Google Scholar] [CrossRef]
  29. Senawi, R.; Rahman, N.K.; Mansor, N.; Kuntom, A. Transformation of oil palm independent smallholders through Malaysian sustainable palm oil. J. Oil Palm Res. 2019, 31, 496–507. [Google Scholar] [CrossRef]
  30. Syarifudin, S.M.; Zareen, Z. Impact of the agricultural technology transfer to the production of independent palm oil smallholders: A review. Food Res. 2021, 5, 110–124. [Google Scholar]
  31. Ruggeri, K.; Garcia-Garzon, E.; Maguire, Á.; Matz, S.; Huppert, F.A. Well-being is more than happiness and life satisfaction: A multidimensional analysis of 21 countries. Health Qual. Life Outcomes 2020, 18, 192. [Google Scholar] [CrossRef]
  32. Csikszentmihalyi, M.; Seligman, M. Positive psychology. Am. Psychol. 2000, 55, 5–14. [Google Scholar]
  33. Bakar, A.A.; Osman, M.M.; Bachok, S.; Ibrahim, M.; Mohamed, M.Z. Modelling economic wellbeing and social wellbeing for sustainability: A theoretical concept. Procedia Environ. Sci. 2015, 28, 286–296. [Google Scholar] [CrossRef]
  34. Why Employee Wellbeing Is the Key to Productivity. 2020. Employee Benefits. Available online: https://employeebenefits.co.uk/why-employee-wellbeing-is-the-key-to-productivity/ (accessed on 20 January 2023).
  35. Mohd Suib, N.A.B.; Salleh, N.H.M.; Ahmad, M.F. The economic well-being of smallholders and challenges during COVID-19 pandemic: A review. Agric. Econ. 2023, 69, 35–44. [Google Scholar] [CrossRef]
  36. Gauchan, D.; Shrestha, R.B. Improve Socio-Economic Inclusion, Resilience and Wellbeing of Family Farmers, Rural Households and Communities in South Asia. In Regional Action Plan to Implement the UNDFF for Achieving the SDGs in South Asia; Rudra, B.S., Pierre, F., Ma, E.P., Mohit, D., Younus, A., Eds.; SA ARC Agriculture Center: Dhaka, Bangladesh; Food and Agriculture Organization of the United Nations (FAO): Rome, Italy; Asian Farmer’s Association (AFA): Makati, The Philippines; International Cooperative Alliance Asia and Pacific (ICA-AP): Delhi, India, 2021; pp. 161–173. [Google Scholar]
  37. Melendres, C.N.; Lee, J.Y.; Kim, B.; Nayga Jr, R.M. Increasing yield and farm income of upland farmers: The case of Panay Island Upland Sustainable Rural Development Project in the Philippines. J. Asian Econ. 2022, 82, 101524. [Google Scholar] [CrossRef]
  38. Wijayanto, H.W.; Lo, K.A.; Toiba, H.; Rahman, M.S. Does Agroforestry Adoption Affect Subjective Well-Being? Empirical Evidence from Smallholder Farmers in East Java, Indonesia. Sustainability 2022, 14, 10382. [Google Scholar] [CrossRef]
  39. Ayompe, L.M.; Schaafsma, M.; Egoh, B.N. Towards sustainable palm oil production: The positive and negative impacts on ecosystem services and human wellbeing. J. Clean. Prod. 2021, 278, 123914. [Google Scholar] [CrossRef]
  40. Mohd Hanafiah, K.; Abd Mutalib, A.H.; Miard, P.; Goh, C.S.; Mohd Sah, S.A.; Ruppert, N. Impact of Malaysian palm oil on sustainable development goals: Co-benefits and trade-offs across mitigation strategies. Sustain. Sci. 2021, 17, 1639–1661. [Google Scholar] [CrossRef]
  41. Santika, T.; Wilson, K.A.; Meijaard, E.; Budiharta, S.; Law, E.E.; Sabri, M.; Struebig, M.; Ancrenaz, M.; Poh, T.-M. Changing landscapes, livelihoods and village welfare in the context of oil palm development. Land Use Policy 2019, 87, 104073. [Google Scholar] [CrossRef]
  42. Tambi, N.; Choy, E.A.; Yusoff, N.H.; Abas, A.; Halim, U.L. Well-being Challengers of Palm Oil Smallholder Community. E-Bangi 2021, 18, 262–278. [Google Scholar]
  43. What are the Sustainable Development Goals? Sustainable Development Goals. Available online: https://www.undp.org/sustainable-development-goals (accessed on 15 January 2023).
  44. Sukiyono, K.; Romdhon, M.M.; Mulyasari, G.; Yuliarso, M.Z.; Nabiu, M.; Trisusilo, A.; Reflis; Napitupulu, D.M.T.; Nugroho, Y.; Puspitasari, M.S.; et al. The Contribution of Oil Palm Smallholders Farms to the Implementation of the Sustainable Development Goals-Measurement Attempt. Sustainability 2022, 14, 6843. [Google Scholar] [CrossRef]
  45. Brako, D.E.; Richard, A.; Alexandros, G. Do voluntary certification standards improve yields and wellbeing? Evidence from oil palm and cocoa smallholders in Ghana. Int. J. Agric. Sustain. 2021, 19, 16–39. [Google Scholar] [CrossRef]
  46. Santika, T.; Wilson, K.A.; Law, E.A.; St John, F.A.; Carlson, K.M.; Gibbs, H.; Morgans, C.L.; Ancrenaz, M.; Meijaard, E.; Struebig, M.J. Impact of palm oil sustainability certification on village well-being and poverty in Indonesia. Nat. Sustain. 2021, 4, 109–119. [Google Scholar] [CrossRef]
  47. Goenadi, D.H.; Setyobudi, R.H.; Yandri, E.; Siregar, K.; Winaya, A.; Damat, D.; Widodo, W.; Wahyudi, A.; Adinurani, P.G.; Mel, M.; et al. Land Suitability Assesment and Soil Organic Carbon Stocks as Two Keys for Achieving Sustainability of Oil Palm (Elaeis guineensis Jacq). Sarhad J. Agric. 2021, 37, 184–196. [Google Scholar]
  48. Jensen, H.T.; Keogh-Brown, M.R.; Shankar, B.; Aekplakorn, W.; Basu, S.; Cuevas, S.; Dangour, A.D.; Gheewala, S.H.; Green, R.; Joy, E.J.; et al. Palm oil and dietary change: Application of an integrated macroeconomic, environmental, demographic, and health modelling framework for Thailand. Food Policy 2019, 83, 92–103. [Google Scholar] [CrossRef]
  49. Syahza, A.; Bakce, D.; Nasrul, B.; Mustofa, R. Utilization of peatlands based on local wisdom and community welfare in Riau Province, Indonesia. Int. J. Sustain. Dev. Plan. 2020, 15, 1119–1126. [Google Scholar] [CrossRef]
  50. Abokyi, E.; Strijker, D.; Asiedu, K.F.; Daams, M.N. Buffer Stock Operations and Well-Being: The Case of Smallholder Farmers in Ghana. J. Happiness Stud. 2022, 23, 125–148. [Google Scholar] [CrossRef]
  51. Junaidi, A.B.; Mohd Fuad, M.J.; Ahmad Rizal, M.Y.; Al-Amril, O.; Rosmadi, F. Socio-economic development of palm oil smallholders in Malaysia. Int. J. Adv. Appl. Sci. 2020, 7, 109–118. [Google Scholar]
  52. Saifullah, M.K.; Kari, F.B.; Othman, A. Poverty among the small-scale plantation holders: Indigenous communities in Peninsular Malaysia. Int. J. Soc. Econ. 2018, 45, 230–245. [Google Scholar] [CrossRef]
  53. Awang, A.H.; Rela, I.Z.; Abas, A.; Johari, M.A.; Marzuki, M.E.; Mohd Faudzi, M.N.R.; Musa, A. Peat land oil palm farmers’ direct and indirect benefits from good agriculture practices. Sustainability 2021, 13, 7843. [Google Scholar] [CrossRef]
  54. Chrisendo, D.; Krishna, V.V.; Siregar, H.; Qaim, M. Land-use change, nutrition, and gender roles in Indonesian farm households. For. Policy Econ. 2020, 118, 102245. [Google Scholar] [CrossRef]
  55. Dib, J.B.; Krishna, V.V.; Alamsyah, Z.; Qaim, M. Land-use change and livelihoods of non-farm households: The role of income from employment in oil palm and rubber in rural Indonesia. Land Use Policy 2018, 76, 828–838. [Google Scholar] [CrossRef]
  56. Euler, M.; Krishna, V.; Schwarze, S.; Siregar, H.; Qaim, M. Oil palm adoption, household welfare, and nutrition among smallholder farmers in Indonesia. World Dev. 2017, 93, 219–235. [Google Scholar] [CrossRef]
  57. Ramadhana, A.; Ahmed, F.; Thongrak, S. The Impact of Oil Palm Farming on Household Income and Expenditure in Indonesia. J. Asian Financ. Econ. Bus. 2021, 8, 539–547. [Google Scholar]
  58. Mingorría, S.; Gamboa, G.; Martín-López, B.; Corbera, E. The oil palm boom: Socio-economic implications for Q’eqchi’households in the Polochic valley, Guatemala. Environ. Dev. Sustain. 2014, 16, 841–871. [Google Scholar] [CrossRef]
  59. Saswattecha, K.; Kroeze, C.; Jawjit, W.; Hein, L. Assessing the environmental impact of palm oil produced in Thailand. J. Clean. Prod. 2015, 100, 150–169. [Google Scholar] [CrossRef]
  60. Cooper, D.R.; Schindler, P.S.; Sun, J. Business Research Methods; Mcgraw-Hill: New York, NY, USA, 2006. [Google Scholar]
  61. Kannan, P.; Mansor, N.H.; Rahman, N.K.; Peng, T.; Mazlan, S.M. A review on the Malaysian sustainable palm oil certification process among independent oil palm smallholders. J. Oil Palm Res. 2021, 33, 171–180. [Google Scholar] [CrossRef]
  62. Creswell, J.W.; Plano Clark, V.L. Designing and Conducting Mixed Method Research, 3rd ed.; Sage: Los Angeles, CA, USA, 2017. [Google Scholar]
  63. Etikan, I.; Musa, S.A.; Alkassim, R.S. Comparison of convenience sampling and purposive sampling. Am. J. Theor. Appl. Stat. 2016, 5, 1–4. [Google Scholar] [CrossRef]
  64. Krejcie, R.V.; Morgan, D.W. Determining sample size for research activities. Educ. Psychol. Meas. 1970, 30, 607–610. [Google Scholar] [CrossRef]
  65. Hair, J.F.; Hult, G.T.M.; Ringle, C.M.; Sarstedt, M.; Danks, N.P.; Ray, S. An introduction to structural equation modeling. In Partial Least Squares Structural Equation Modeling (PLS-SEM) Using R; Hair, J.F., Hult, G.T.M., Ringle, C.M., Sarstedt, M., Danks, N.P., Ray, S., Eds.; Springer: Cham, Switzerland, 2021; pp. 1–29. [Google Scholar]
  66. How’s Life? 2020: Measuring Well-Being. Available online: https://doi.org/10.1787/9870c393-en (accessed on 20 January 2023).
  67. Krishna, V.R.; Paramesh, V.; Arunachalam, V.; Das, B.; Elansary, H.O.; Parab, A.; Reddy, D.D.; Shashidhar, K.S.; El-Ansary, D.O.; Mahmoud, E.A.; et al. Assessment of sustainability and priorities for development of Indian west coast region: An Application of Sustainable Livelihood Security Indicators. Sustainability 2020, 12, 8716. [Google Scholar] [CrossRef]
  68. Brejda, J.J.; Karlen, D.L.; Smith, J.L.; Allan, D.L. Identification of regional soil quality factors and indicators II. Northern Mississippi Loess Hills and Palouse Prairie. Soil Sci. Soc. Am. J. 2020, 64, 2125–2135. [Google Scholar] [CrossRef]
  69. Sarstedt, M.; Ringle, C.M.; Hair, J.F. Partial least squares structural equation modeling. In Handbook of Market Research; Springer International Publishing: Cham, Switzerland, 2021; pp. 587–632. [Google Scholar]
  70. Kaiser, H.F. The application of electronic computers to factor analysis. Educ. Psychol. Meas. 1960, 20, 141–151. [Google Scholar] [CrossRef]
  71. Tomarken, A.J.; Waller, N.G. Structural Equation Modeling: Strengths, Limitations, and Misconceptions. Annu. Rev. Clin. Psychol. 2005, 1, 31–65. [Google Scholar] [CrossRef] [PubMed]
  72. Hulland, J. Use of partial least squares (PLS) in strategic management research: A review of four recent studies. Strateg. Manag. J. 1999, 20, 195–204. [Google Scholar] [CrossRef]
  73. Montgomery, D.C.; Peck, E.A.; Vining, G.G. Linear Regression Analysis; Wiley & Sons: New York, NY, USA, 1982. [Google Scholar]
  74. Cohen, J. Statistical Power Analysis for the Behavioral Sciences, 2nd ed.; Routledge: New York, NY, USA, 1988; pp. 77–83. [Google Scholar]
  75. Chin, W.W. The partial least squares approach to structural equation modeling. In Modern Methods for Business Research, 2nd ed.; George, A.M., Ed.; Psychology Press: East Sussex, UK, 2013; pp. 295–336. [Google Scholar]
  76. Ringle, C.M.; Wende, S.; Will, A. Smart PLS 2.0 M3; University of Hamburg: Hamburg, Germany, 2005. [Google Scholar]
  77. Oil Palm Smallholders in Sabah and Sarawak. Available online: https://www.mpocc.org.my/mspo-blogs/oil-palm-smallholders-in-sabah-and-sarawak (accessed on 2 January 2023).
Figure 1. World’s major producers of palm oil, 2012–2022. Source: Adapted from [2].
Agriculture 13 00990 g001
Figure 2. Well-being sustainability flow chart.
Agriculture 13 00990 g002
Figure 3. SPOC distribution in Peninsular, Sabah, and Sarawak, Malaysia. Source: Reproduced from [61].
Agriculture 13 00990 g003
Figure 4. Path model on the relationship between GAP, Productivity and Well-being
Agriculture 13 00990 g004
Figure 5. Output Model.
Agriculture 13 00990 g005
Table 1. Number of MSPO-certified Independent Smallholders by area.
AreasNumber of MSPO-Certified Independent Smallholder
20132014201520162017201820192020Total
Peninsular-82113438776414215,73256,79878,081
Sabah--42421131021341816,75821,394
Sarawak--233233521869767020,77229,832
Total-821554801410603226,82094,328129,307
Note: MSPO was launched in 2013; there was no certificate ownership by ISHs in this year.
Table 2. Profiles of respondents.
InformationFrequency%
Level of education:
Non-formal education275.7
UPSR and equivalent6012.6
SRP, LCE, and equivalent8618.1
SPM and MCE18739.4
Skills certificate153.2
Diploma/matriculation5110.7
Degree367.6
Masters132.7
Experience managing oil palm (year):
1–1015632.8
11–2019040.0
21–307916.6
41–50347.2
51–60112.3
61–7051.1
Year planting started
1957–1990439.1
1991–20008317.5
2001–201018338.5
2011–201816634.9
Age of palm oil (year):
4–1017436.6
11–2023349.1
21–306714.1
31–4010.2
Income after MSPO (RM):
1000–10,00013628.6
10,001–20,00010822.7
20,001–30,0008417.7
30,001–40,000347.2
40,001 and above11323.8
Farm size (Ha):
0.10–1.008016.8
1.01–10.0036276.2
10.01–20.00194.0
20.01–30.00102.1
30.01–40.0040.8
Table 3. Mean construct of well-being.
ConstructMean
Income and wealth (IW)3.859
Employment and income (EI)3.735
Residential (R)4.019
Work and life balance (WB)3.804
Health (H)4.115
Education and skills (ES)4.248
Environmental quality (EQ)4.085
Subjective well-being (SW)4.457
Table 4. Correlation matrix of the eight constructs used in the PCA.
Variables(1)(2)(3)(4)(5)(6)(7)(8)
Income and wealth (1)1.0000
Employment and income (2)0.6677 *1.0000
Residential (3)0.7918 *0.6238 *1.0000
Work and life balance (4)0.7062 *0.5829 *0.7166 *1.0000
Health (5)0.7744 *0.6275 *0.7638 *0.7108 *1.0000
Education and skills (6)0.7050 *0.5608 *0.6855 *0.6442 *0.8413 *1.0000
Environmental quality (7)0.6870 *0.5939 *0.6427 *0.5891 *0.7590 *0.7465 *1.0000
Subjective well-being (8)0.6615 *0.5044 *0.6845 *0.6180 *0.7656 *0.7715 *0.6930 *1.000
* significant at level 0.01.
Table 5. Principal Components Analysis.
ComponentEigenvalueDifferenceProportionCumulative
Comp15.7975.2040.7250.725
Comp20.5930.1440.0740.799
Comp30.4490.1470.0560.855
Comp40.3020.0190.0380.893
Comp50.2830.0450.0350.928
Comp60.2380.0430.0300.958
Comp70.1950.0520.0240.982
Comp80.143 0.0181.000
Number of observations475
Number of components8
Trace8
Table 6. Kaiser–Meyer–Olkin (KMO) and coefficient measure of sampling adequacy of the first principal component for the eight constructs.
VariableKMOCoefficient
Income and wealth (IW)0.93600.3664
Employment and income (EI)0.95550.3118
Residential (R)0.93350.3613
Work and life balance (WB)0.96190.3393
Health (H)0.92630.3826
Education and skills (ES)0.91870.3650
Environmental quality (EQ)0.95490.3489
Subjective well-being (SW)0.94750.3487
Overall0.9401
Table 7. Analysis mean of well-being index according to state.
StatesIndex
Sarawak0.6619
Sabah0.7345
Johor0.5096
Perak0.6104
Pulau Pinang0.5246
Kedah0.4904
Selangor0.6387
Negeri Sembilan0.6469
Melaka0.3264
Terengganu0.7217
Pahang0.6295
Kelantan0.6123
Overall0.6190
Table 8. Mean, standard deviation, and weight loadings.
Construct/ItemMeanWeight Loadingt-Valuep-ValueVIFOuter Loading
Land Preparation:
1. The harvest lane is in good condition4.3850.75510.8730.0002.8890.986
2. The road is in good condition4.3520.2863.8030.0002.8890.896
Weed Control:
1. Palm oil tree is free from weeds (in radius 2 m)4.3050.58311.10.0001.6000.908
2. No parasitic plants on the oil palm stems4.1160.5319.7230.0001.6000.888
Fertiliser Application:
1. Palm oil trees are fertilised in proportion4.3240.091.3810.1683.7240.821
2. Palm oil trees are fertilised according to nutritional needs4.2820.1952.7970.0053.6090.835
3. Fertiliser is spread around the tree/in the frond pile aisle4.4990.4386.4980.0002.6940.925
4. Fertilising frequency for young trees
(<3 years old)
4.2210.1572.010.0453.2650.784
5. Fertilising frequency for mature trees
(>4 years old)
4.312−0.0140.2070.8363.4980.773
6. Fertiliser is sown within 1 month after receipt/purchase4.4380.2995.6760.0001.9260.821
Pruning:
1. Pruning the fronds according to the age of the tree4.3220.6595.8320.0002.1510.949
2. Pruned fronds are arranged according to contours or rows4.4250.4283.520.0001.9790.875
Pest Control:
1. Farms are free from pest attacks4.1221.000--1.0001.000
Disease Control:
1. Farms are free from Ganoderma4.2321.000--1.0001.000
Harvesting:
1. Harvesting the ripe FFBs only4.6740.2963.3260.0012.7650.87
2. The stalks are cut (≤5 cm)4.5680.3965.2760.0002.3940.902
3. All the loose fruits are collected4.5810.3344.9940.0002.1220.856
4. FFB and loose fruits are delivered in 24 h4.6910.1211.3760.1692.7560.673
Record Keeping:
1. Keeping a complete record book4.2150.5054.0060.0002.9510.948
2. Record plantation activity immediately4.0840.5454.3850.0002.9510.956
Table 9. Assessment of second-order constructs.
RelationshipPath Coefficients
(β)
SDT-Statisticsp-Values
Disease Control → GAP0.1510.00625.8620.000
Fertiliser Application → GAP0.1900.00632.0700.000
Harvesting → GAP0.1790.00535.3370.000
Land Preparation → GAP0.1770.00627.5770.000
Pest Control → GAP0.1580.00529.2030.000
Pruning → GAP0.1310.01111.8380.000
Record Keeping → GAP0.1530.00625.2170.000
Weed Control → GAP0.1850.00537.1550.000
Table 10. R square and Q square.
ConstructR SquareR Square AdjustedQ Square
GAP1.0001.0000.447
Productivity0.0060.0040.004
Well-being0.0160.0140.015
Table 11. Hypothesis testing.
RelationshipPath Coefficients
(β)
SDT-Statisticsp-Values
Relation: GAP–Productivity0.0770.0421.8260.068
Relation: Productivity–Well-being0.1270.0423.0400.002
Disclaimer/Publisher’s Note: The statements, opinions and data contained in all publications are solely those of the individual author(s) and contributor(s) and not of MDPI and/or the editor(s). MDPI and/or the editor(s) disclaim responsibility for any injury to people or property resulting from any ideas, methods, instructions or products referred to in the content.

