Article

Insights into Cottonseed Cultivar Identification Using Raman Spectroscopy and Explainable Machine Learning

1
School of Information Engineering, Tarim University, Alaer 843300, China
2
Southern Xinjiang Research Center for Information Technology in Agriculture, Tarim University, Alaer 843300, China
3
Henan Kaifeng College of Science Technology and Communication, Kaifeng 475000, China
4
Analysis and Testing Center, Tarim University, Alar 843300, China
*
Authors to whom correspondence should be addressed.
These authors contributed equally to this work.
Agriculture 2023, 13(4), 768; https://doi.org/10.3390/agriculture13040768
Submission received: 8 March 2023 / Revised: 23 March 2023 / Accepted: 24 March 2023 / Published: 26 March 2023
(This article belongs to the Section Seed Science and Technology)

Abstract

:
Securing authentic cottonseed identity information is crucial for preserving the livelihoods of farmers. Traditional seed identification methods are generally time-consuming, and have a high degree of difficulty. Raman spectroscopy, in combination with machine learning (ML), has opened up new avenues for seed identification. In this study, we explored the feasibility of using Raman spectroscopy combined with ML for cottonseed identification. Using Raman confocal microscopy, we constructed fingerprints of cottonseeds and analyzed their important Raman peaks. We integrated two feature exploration methods (Principal Component Analysis and Harris Hawk optimization) and three ML algorithms (Support Vector Machine, eXtreme Gradient Boosting, and Multi-Layer Perceptron) into a Raman spectroscopy analysis framework to accurately identify cottonseed cultivars. Through the utilization of SHapley Additive exPlanations (SHAP), we provide an in-depth explanation of the model’s decision-making process. Our results demonstrate that XGBoost, a tree-based model, exhibits outstanding accuracy (overall accuracy of 0.94–0.88) in cottonseed identification. Notably, lignin emerged as a pivotal factor that strongly influenced the model’s prediction of cottonseed cultivars, as revealed by the XGBoost interpretation. Overall, our study illustrates the effectiveness of combining Raman spectroscopy with ML to precisely identify cottonseed cultivars. The SHAP framework used in our study enables seed-related personnel to better comprehend the model’s prediction mechanism. These valuable insights are expected to enhance seed planting and management practices in the future.

1. Introduction

Cotton occupies a significant position in the economic development of nations [1,2]. This crop is a sustainable source of employment and income for farmers worldwide. According to a report by the United Nations, the cotton industry supports the livelihoods of 28.67 million cotton farmers worldwide, with an average of five year-round employment opportunities per ton of cotton, particularly in impoverished areas [3]. Hence, boosting cotton production is crucial to elevating income levels and alleviating poverty in economically challenged regions.
Researchers have primarily devoted their efforts to developing high-quality cotton cultivars to fulfill the production demands of cotton-growing regions [4,5]. Nevertheless, the cotton industry’s value chain is long and intricate. The opaque circulation of cottonseeds may result in the indiscriminate planting of various cotton cultivars in the same production area, which has been overlooked to date [2,6]. In fact, confusion in planting cultivars results in low uniformity, poor consistency, and uneven quality of the cotton fibers produced. Securing cottonseed identity information is crucial to guaranteeing profitability and promoting the high-quality advancement of the cotton industry.
To date, some scholars have redirected their emphasis from laboratory-based to field-oriented investigations. Traditional seed identification methods can be broadly divided into two categories: protein analysis techniques and DNA analysis techniques. These include high-performance liquid chromatography (HPLC), an enzyme-linked immunosorbent assay (ELISA), gas chromatography (GC), and a polymerase chain reaction (PCR) [7,8,9]. These class techniques are generally considered time-consuming, with a high degree of difficulty. The detection process for transgenic products is further complicated because the target components (proteins or DNA) are prone to degradation or damage [9]. In addition, these methods often require complex sample preparation, which can easily cause environmental pollution [10]. Thus, the development of an automated and ecofriendly tool for identifying cottonseed has significant potential value for cottonseed identity security.
Digital phenotyping based on Raman spectroscopy has opened up new avenues for seed identification [11,12,13]. Raman spectroscopy utilizes the inelastic scattering of monochromatic light (laser) to probe the energy levels and symmetry of molecules in the sample [7,12]. Raman spectral fingerprints can provide information on specific chemical bonds or functional groups owing to the properties of the Raman Effect [7]. Therefore, Raman spectroscopy provides a natural optical probe for seeds, enabling the analysis of seed biochemical components such as proteins, lipids, and starch. However, the high-dimensional and complex nature of Raman spectroscopy presents a challenge for traditional chemical metrology methods.
The advent of the big data era has seen machine learning (ML) as a formidable tool for analyzing vast datasets. With the aid of various cutting-edge algorithms in ML, remarkable potential has been demonstrated in areas such as land cover classification and smart farm [14,15]. These advances have yielded significant benefits, including enhanced efficiency, improved resource management, and increased productivity. In particular, the integration of ML with Raman spectroscopy has yielded impressive results in various fields such as food analysis, drug detection, and bacterial identification [12,16]. Despite these achievements, there is a growing concern among scholars that many ML models are opaque and lacking interpretability; hence, they are dubbed as “black boxes” [17]. In the realm of seed identity information security, understanding the decision-making processes of these models is crucial. An insightful identification scheme not only aids in accurately identifying critical biochemical components associated with seeds but also provides valuable insights, enabling improvements in planting and management strategies.
To the best of our knowledge, the use of Raman spectroscopy in conjunction with ML to investigate cottonseed-related issues must be explored. Current investigations into identification methodologies are limited to the post hoc analysis of Raman spectroscopic signatures. This hinders the dissemination of pre-existing knowledge regarding the analyzed substance in the broader scientific community.
In light of these challenges, we present a pioneering cottonseed Raman spectroscopy exploration model that leverages the synergistic application of ML and explainable artificial intelligence (XAI) (Figure 1). Our methodology comprises two key elements: (1) We present a comprehensive Raman spectroscopic analysis framework for the identification of cottonseeds. This framework encompasses various stages, including data preprocessing, feature exploration, and the application of three diverse supervised ML models. (2) SHapley Additive exPlanations (SHAP) was used to quantitatively assess the underlying bridge between the model’s predictions and features. This facilitated in-depth analysis of the crucial features necessary to establish highly efficacious and lucid cottonseed identification models. Therefore, our study provides a paradigm for broader applications of Raman spectroscopy.

2. Materials and Methods

2.1. Sample Collection

The selection of cottonseed cultivars is a crucial step towards developing a robust and reliable identification model. To ensure the model performance is not compromised by any limitations, it is imperative to include a diverse selection of cultivars from various growing regions, breeding techniques, and traits. In this study, three cottonseed cultivars were investigated and analyzed: Zhongmian 88 (ZH-88), Zhongmian 75 (ZH-75), and Zhongmian 70 (ZH-70). These cultivars are primarily grown in China and exhibit certain disparities in their cultivar characteristics (Table 1).
Specifically, ZH-88 is a cotton cultivar developed through a hybridization selection process aimed at addressing the issue of inadequate heat accumulation in production regions. The cultivar ZH-75, on the other hand, is differentiated by its rapid germination and satisfactory growth performance throughout its entire growing period. ZH-70 exhibits robust growth during the middle growth period, although it may have weaker growth during the seedling stage.
All the samples were provided by the Institute of Cotton Research of the Chinese Academy of Agricultural Sciences.

2.2. Sample Preparation

A meticulous examination of the cottonseeds was conducted. For each cultivar, 20 seeds were selected based on stringent criteria, including proper preservation, uniform shape and size, and the absence of deformations or fractures.
To ensure the acquisition of unadulterated Raman spectral signals of the cottonseeds, a 60% acetone concentration was used to wash the seeds for 2 min, thereby eliminating the majority of coating agents. Residual acetone on the seed surface was quickly removed using pure water to minimize its impact on the resulting Raman spectra [18]. To prevent sprouting in actively growing dry cottonseeds, the seeds were dried using a water-absorbent paper after coating removal and then stored in properly labeled self-sealing bags under controlled laboratory conditions (temperature, 4 °C; relative humidity, 20%).

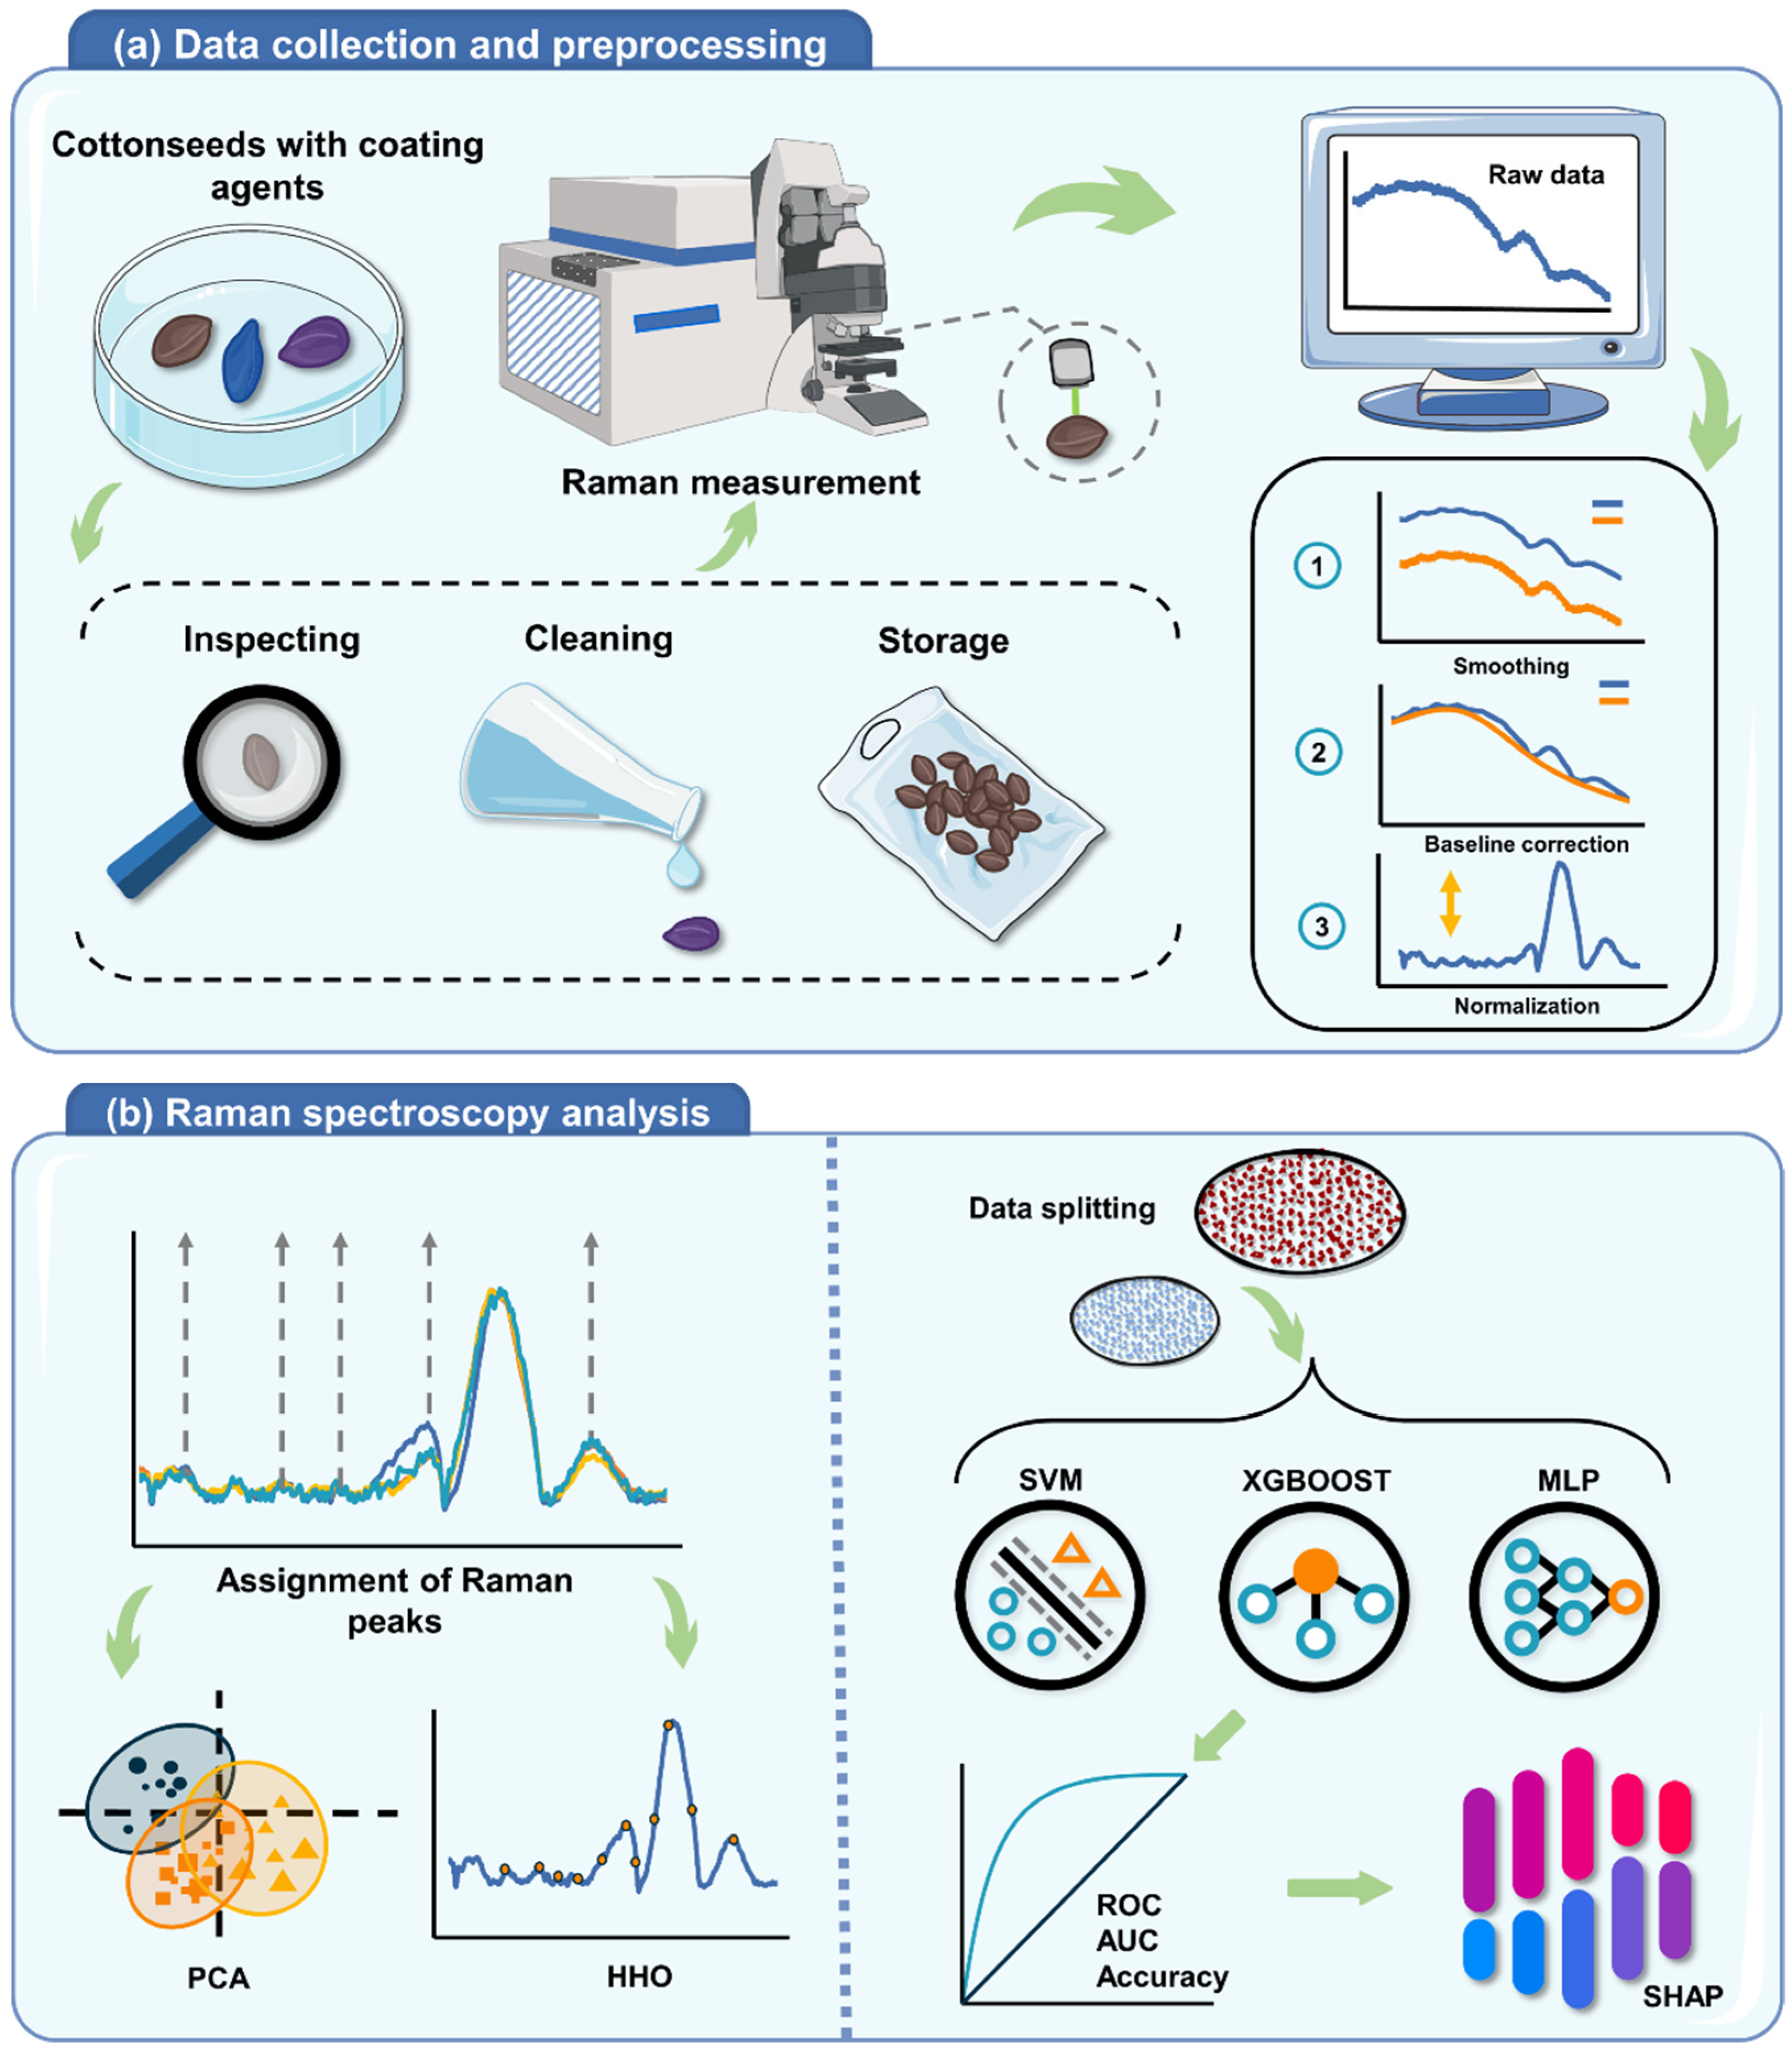
2.3. Raman Measurements of Cottonseed

Raman spectra of cottonseeds were obtained using LabRAM Soleil Raman Microscope (HORIBA, Paris, France). A 785 nm laser was used to excite the Raman spectra, avoiding interference from a strong fluorescence background. Raman spectra (range: 400–2500 cm−1, resolution: 1.15 cm−1) were obtained under stringent measurement parameters (laser power: 75 Mw, scanning time: 30 s, Raman grating: 500 nm, 50× objective lens, 100% lens). Three measurements were taken by randomly selected points on the surface of each seed and retained the averaged spectrum. Furthermore, Raman measurements were performed in a controlled laboratory environment at a temperature of 20 ± 1 °C and a humidity of 60% to minimize any potential perturbations from the external environment.

2.4. Data Preprocessing

Raw Raman spectra obtained from the instrument are often characterized by the presence of fluorescence and systematic and environmental noise [19,20,21]. The Raman spectrum of cottonseed exhibits a strong fluorescence background and substantial noise, despite the application of confocal microscopy with a low-fluorescence wavelength excitation source (Figure 1a). Consequently, all spectra were preprocessed using Origin software, including smoothing, baseline correction, and normalization. Cosmic rays were manually removed, and Savitzky–Golay (SG) filtering was applied to mitigate noise and enhance the signal quality. Subsequently, asymmetric least squares smoothing (ALS) was used to effectively eliminate the fluorescence spectral background. Finally, the Raman spectra were normalized to prevent errors due to sample instability and enhance the reliability of the analysis.

2.5. Exploratory Analysis of Features

Feature exploration is a critical step in the analysis of the complex Raman spectra. This enhances the efficiency and effectiveness of the algorithms used and facilitates the analysis of meaningful conclusions regarding the nature of the sample under investigation [22].
We conducted an exploratory analysis of the Raman spectra, using Principal Component Analysis (PCA) and Harris Hawk optimization (HHO) as our analytical methods. These two techniques differ significantly in their attributes and objectives, leading to different results in their analyses, although both aimed at characterizing the nature of the samples.
We utilized PCA to analyze the clustering trend of the Raman spectra and effectively projected high-dimensional data onto two-dimensional planes, thus reducing the complexity of the original data. PCA enables effective analysis and interpretation of spectral information by identifying the principal components as a new feature space.
The HHO algorithm is a metaheuristic optimization technique designed to identify optimal features. Nonetheless, in the context of feature selection research based on Raman spectroscopy, the implementation of optimization algorithms aims to efficiently determine the optimal features, specifically the best subset of features, to address the challenges of NP-hard problems [23,24]. By strengthening the information within the feature subset, HHO effectively selects the most crucial Raman shifts, thus providing a comprehensive evaluation of the impact of chemical composition in identifying cottonseeds.

2.6. Machine Learning Methods

A substantial number of ML algorithms have been verified to be effective methods for spectral information analysis. However, finding the optimal approach to achieve the research goal often requires repeated experimentation, as no algorithm is perfect. Therefore, we used three different supervised classification algorithms with varying capabilities in this study, including Support Vector Machine (SVM), eXtreme Gradient Boosting (XGBoost), and Multi-Layer Perceptron (MLP).
SVM is an optimization-based discriminative algorithm that finds the optimal decision boundary in the problem space to divide data into different categories [14,25]. The principle of SVM classifier is as follows:
Assuming the optimal hyperplane is represented as  w T x i + b = 0 , the weight vector  w and bias  b must satisfy the following constraints:
y i w T x i + b 1 ξ i
where  ξ i in Equation (1) is the slack variable that reflects the degree of deviation between the model and the ideal linear situation. The goal of SVM is to find a hyperplane that minimizes the average error of misclassification of training data. Therefore, the following optimization problem can be derived:
ϕ w , ξ = 1 2 w T w + C i = 1 N ξ i
where  C is a positive parameter (penalty parameter) that needs to be set, which represents the degree of punishment for misclassified samples by the SVM.
In contrast, XGBoost is a tree-based learning algorithm that adopts the concept of ensemble learning, making it highly effective in handling large-scale high-dimensional data [26]. The principle of XGBoost can be summarized as follows:
Assuming a training dataset  D = { ( x i , y i ) , i = 1 , . . . , n } with size  n , where  x i = ( x i 1 , x i 2 , . . . , x i m ) represents an m-dimensional feature vector and the corresponding (output) class label  y i :
y ^ i = k = 1 K f k x i , f k F
where  K in Equation (3) represents the number of trees,  f k x i denotes the scores associated with the  k t h tree of the model, and  F denotes the space of available scoring functions for all boosting trees.
MLP, on the other hand, is a feed-forward neural network with a complex structure but excellent performance in solving nonlinear problems compared with the models mentioned above [14].
The output of the hidden neurons is computed as follows:
H k = ( i w i k x k + μ i )
In Equation (4),  x k is the value of the  k t h input variable,  μ i represents the bias of the  i t h neuron,  w i k represents the interconnection weight between the  k t h input variable and the  i t h hidden neuron, and  denotes the activation function.
Three multiclass classification algorithms were implemented using the publicly available standard library in Python 3.10. The dataset was randomly divided into a training set containing 80% of the samples and a test set containing the remaining 20%. To assess the performance of these algorithms on both the training and test datasets, we calculated three key metrics: accuracy, receiver operating characteristic (ROC), and area under the curve (AUC) [27]. These metrics comprehensively evaluated the ability of the model to predict cottonseed cultivars accurately.

2.7. Model Interpretation

SHapley Additive exPlanations (SHAP) is a methodology used to explain the prediction of ML models [28,29]. The calculated SHAP values were used to assess the mean marginal contribution of the input features, that is, to gauge the mean impact of the features on the model’s outcome [28]. Remarkably, the SHAP value allocates an individual contribution to each feature of each sample, with the mean absolute value of these contributions constituting the mean marginal contribution. Furthermore, SHAP is a model-agnostic framework that provides a universal approach for explaining the predictions of any ML model [30]. In this study, we used the SHAP methodology to gain a deeper understanding of the decision-making process of the optimal model and to identify key features.

3. Results and Discussion

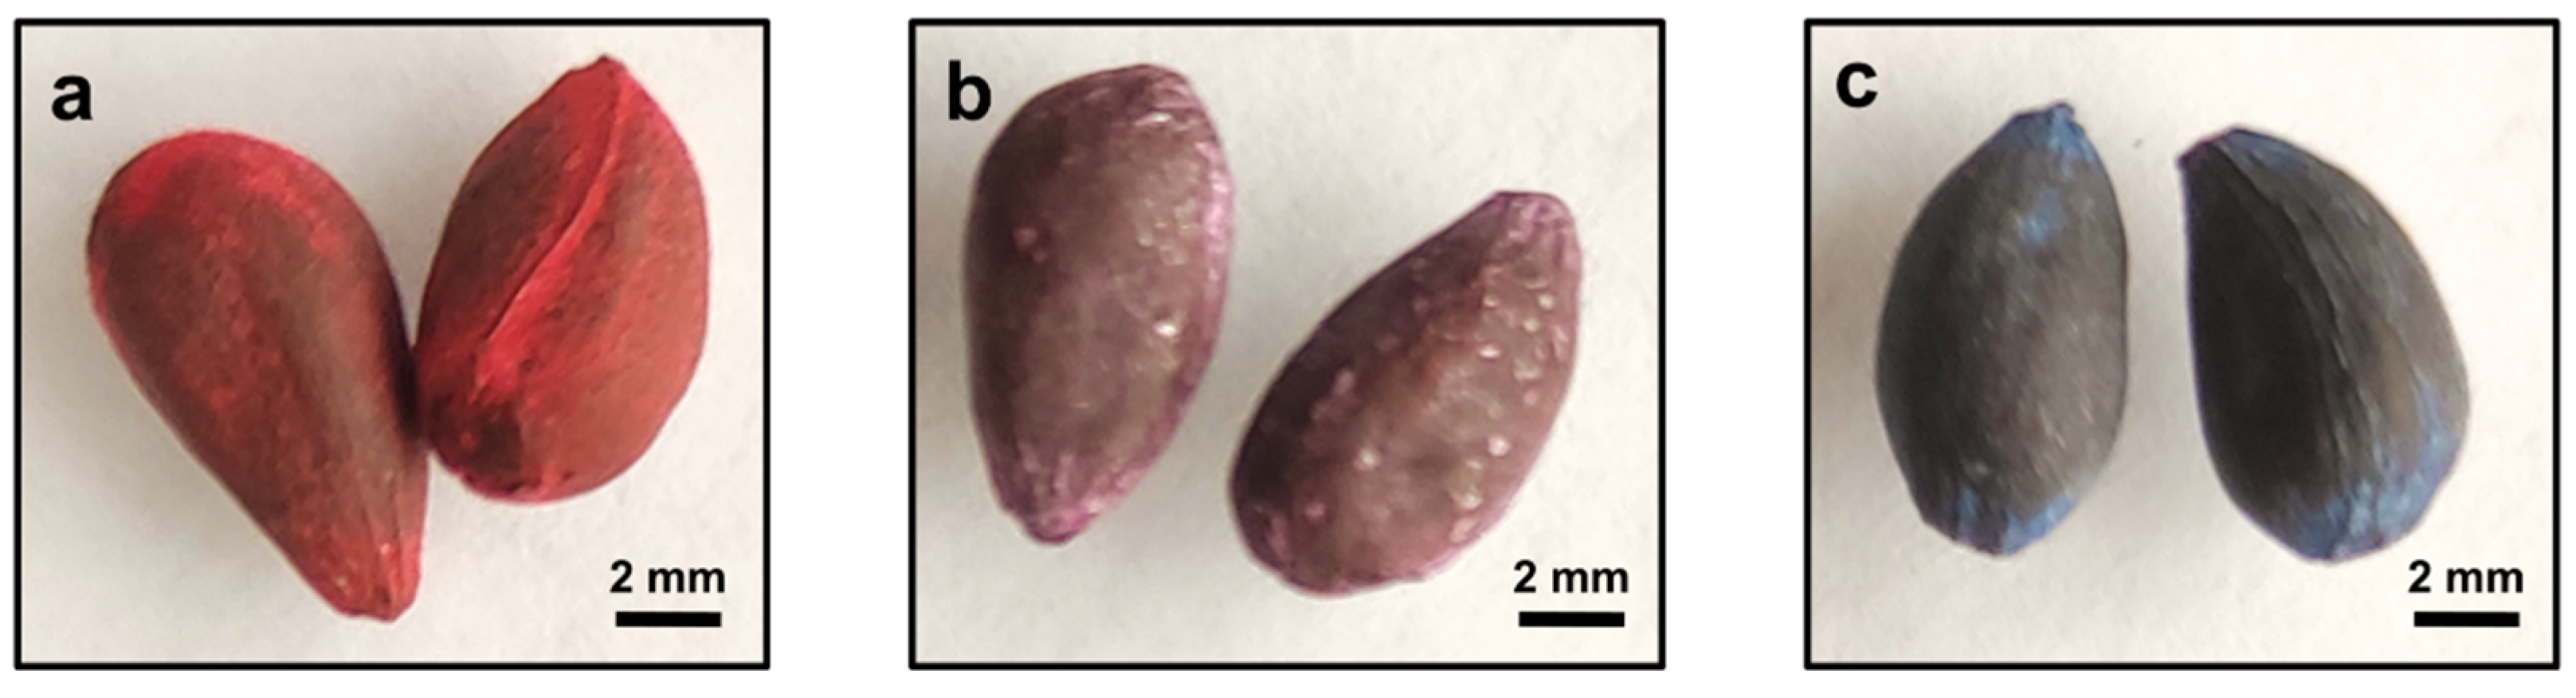
3.1. Visual Characteristics Analysis of Cottonseed

As depicted in Figure 2, minimal variation in morphological characteristics was observed among the cottonseeds. All seeds exhibited an irregular fusiform, featuring a sharp protrusion (micropyle) at one end and a more rounded contour (chalaza) at the opposing end. In addition, discernible veins were evident in the outer layer of the hull. The scarcity of pronounced morphological distinctions between cultivars makes manual visual analysis a formidable task for accurately identifying cultivars.

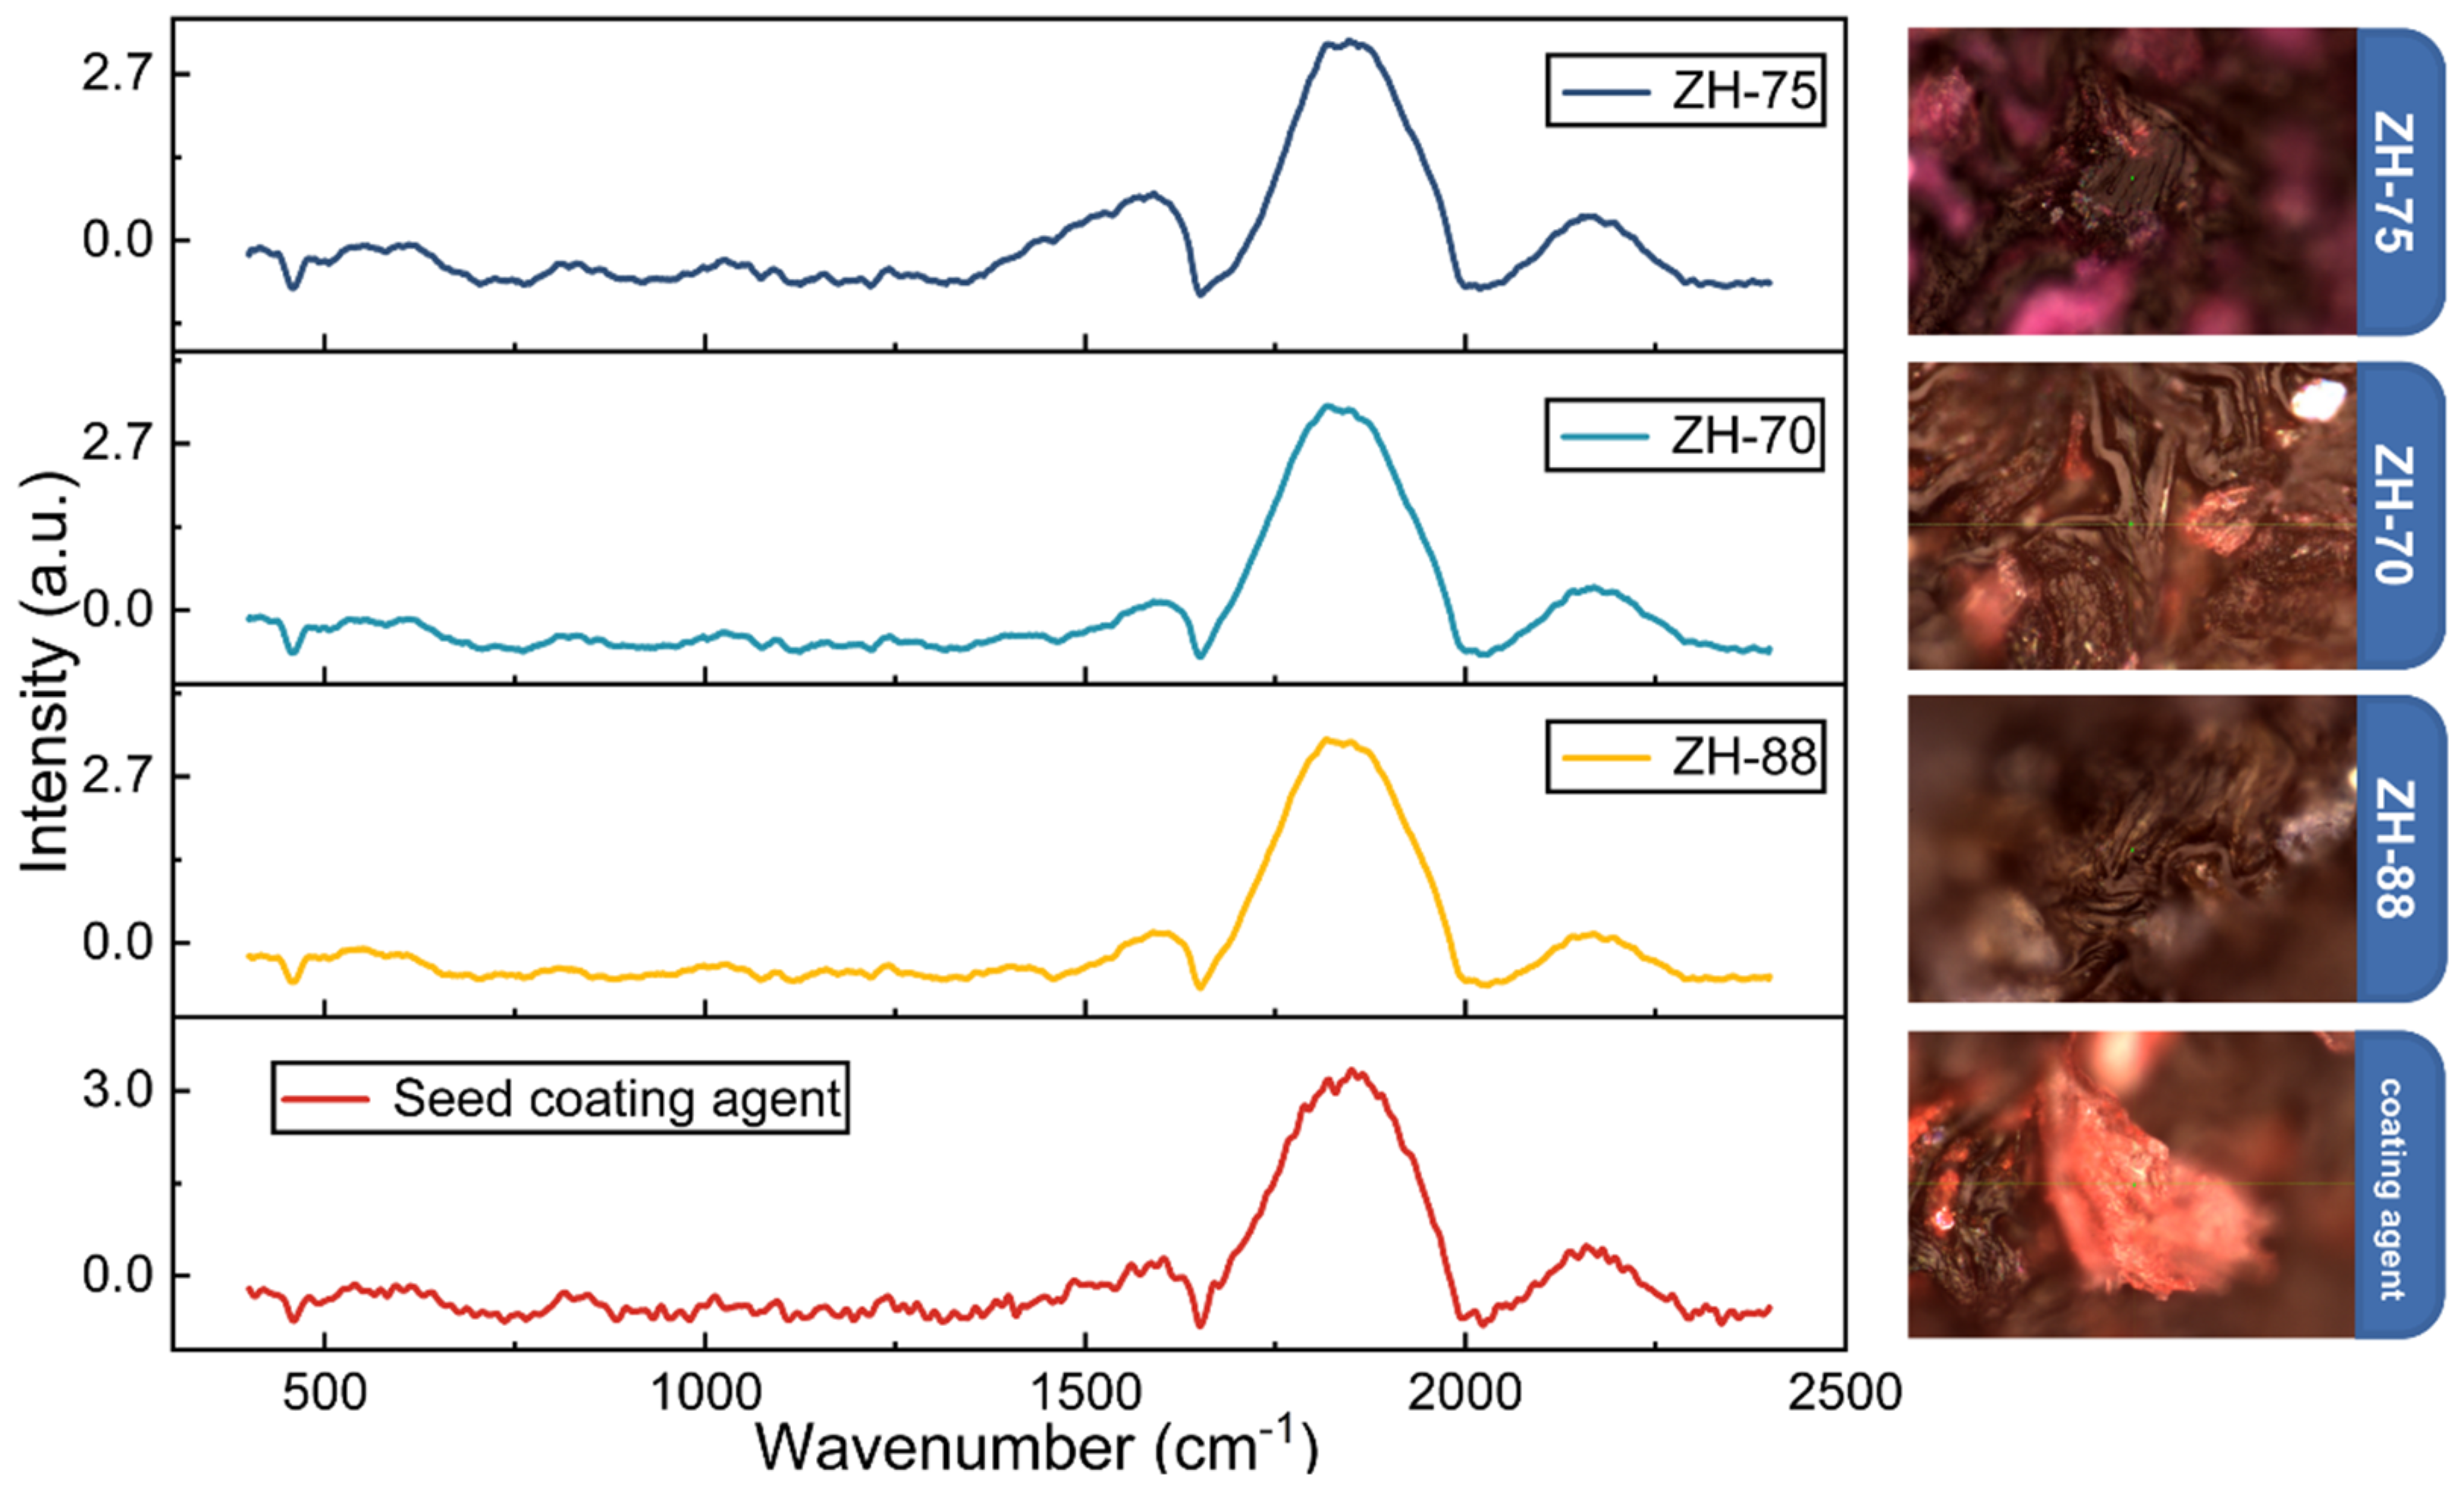
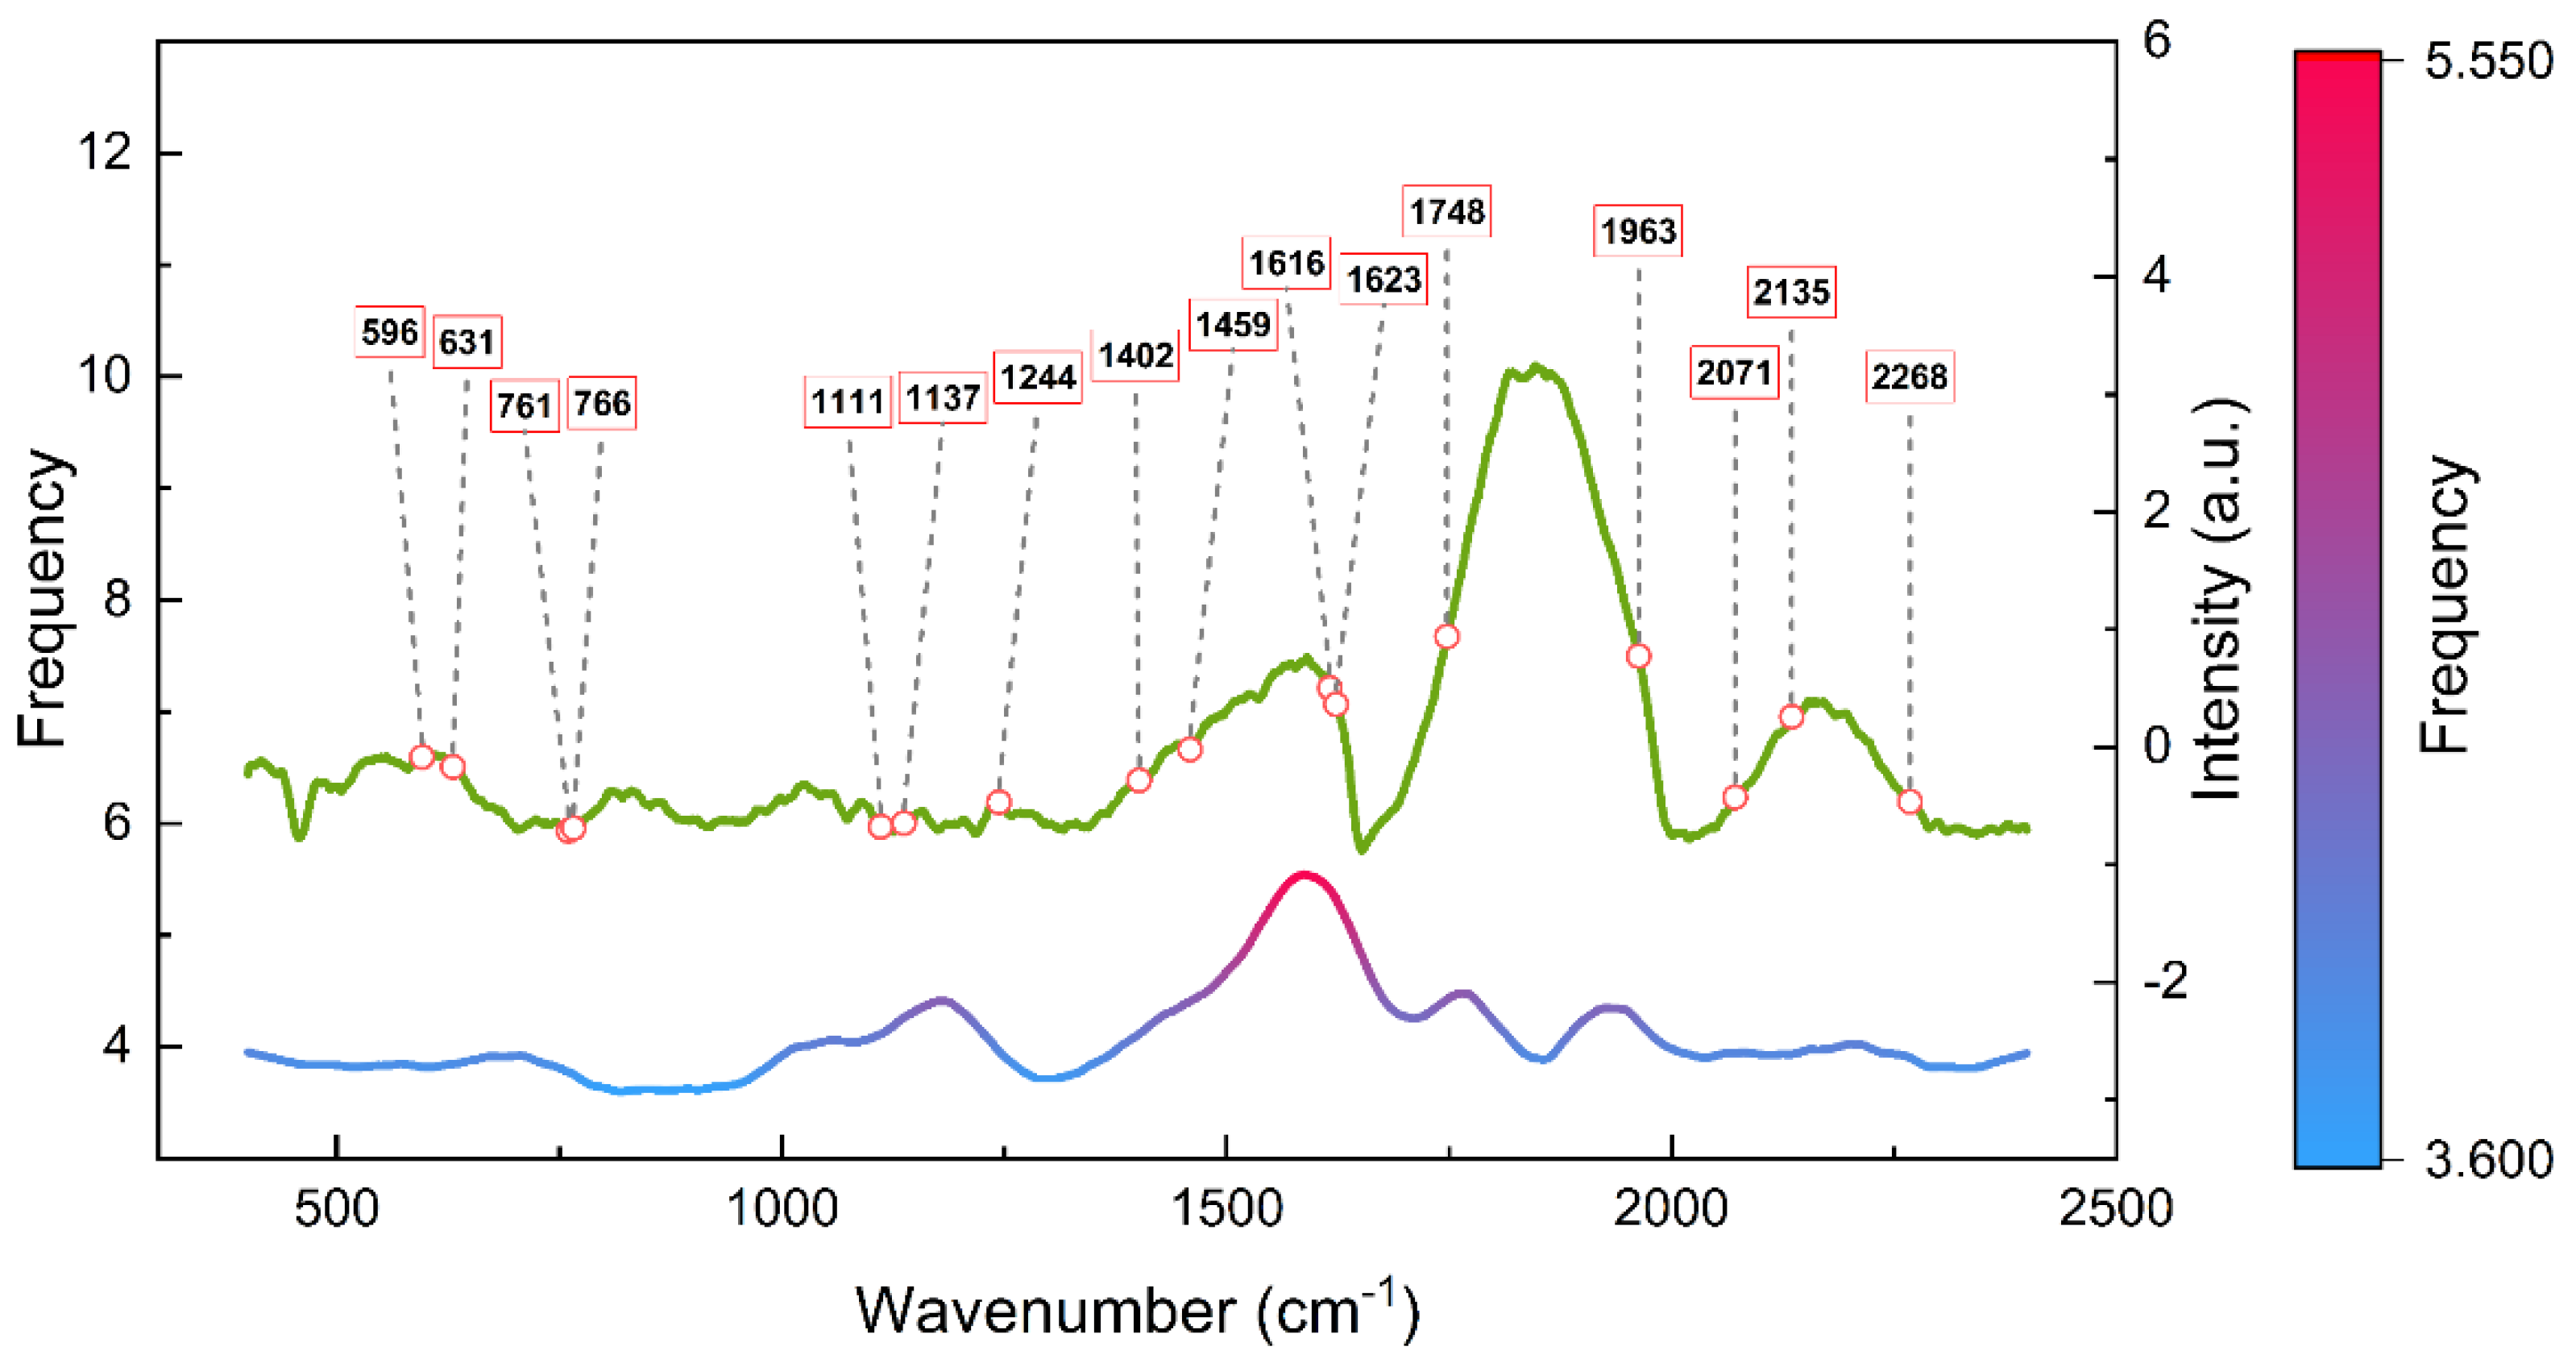
3.2. Raman Analysis of Cottonseed

Raman spectra of ZH-88, ZH-75, and ZH-70 in the range of 400–2500 cm−1 were subjected to analysis (Figure 3). To the best of our knowledge, a comprehensive interpretation of the Raman spectra of cottonseeds has yet to be established. Hence, our focus was directed toward the tentative assignment of Raman shifts. Our preliminary analysis focused on the chemosynthetic components of cottonseed, which include the chemical functional group vibrations of lignin, cellulose, and proteins [31].
The two Raman peaks were attributed to lignin and centered at 1029 and 1610 cm−1. The first Raman band near 1029 cm−1 corresponds to lignin CH3 wagging and aromatic skeletal vibrations. The second peak, near 1610 cm−1, may belong to lignin aromatic skeletal vibrations [32,33]. Of note is the relatively high intensity in the Raman spectra of cottonseeds near 1610 cm−1. Lignin, a potent Raman scattering agent, exhibits a prominent deposition within the palisade layer of the seed coat [31,33,34,35]. This serves as compelling evidence in corroboration with our findings from cottonseed Raman spectra analysis.
In general, the Raman signal at 607 cm−1 is attributed to the torsional vibrations of cellulose in the CCH bond. In addition, the Raman signals in the vicinity of 1037 cm−1, 1092 cm−1, and 1121 cm−1 are assigned to the stretching vibrations of the CC and CO bonds of cellulose [33].
The Raman peak near 1238 cm−1 is attributed to protein vibrations of coupled CN stretching and NH bending of the peptide group, as evidenced by the Amide III signal [36]. However, our results differ from those of previous reports, as no distinct Amide I signal was detected in the range of 1650–1680 cm−1 [37]. This discrepancy could be due to the presence of a high-intensity lignin peak at 1610 cm−1, which may have overshadowed the contribution of Amide I to the spectra.
Additionally, in the Raman spectra obtained from cottonseed, two heightened and broadened peaks were observed at approximately 1813 cm−1 and 2170 cm−1, respectively. Despite diligent efforts, these peaks could not be attributed to any of the primary compounds present in the cottonseed. The anomalous peaks could be attributed to the residual coating agents near the sampling location. The remarkable adhesive properties of the coating agents may have contributed to interference in the spectra [38]. Consequently, we extended our investigation to include Raman spectra of the coating agents present on the surface of the cottonseed. The specific sampling locations are shown in Figure 3. The impact of the coating agent spectra was primarily observed in the 1813 cm−1 and 2160 cm−1 regions, whereas the effect on the spectra within the 400–1800 cm−1 range was minimal. Given the crucial role of coating agents in the commercial distribution of seeds, we preserved this signal component.
The overall Raman spectroscopic analysis of cottonseed depicted in Figure 3 shows variations in the intensities of the spectral bands. Notably, a marked disparity was noted near 1610 cm−1, with the Raman peak intensity of ZH-75 surpassing those of ZH-88 and ZH-70. Additionally, slight variations can be discerned in the spectral ranges of 690–750 cm−1, 930–940 cm−1, 1160–1230 cm−1, and 1400–1570 cm−1. These observations suggest that these bands may be instrumental in the classification of cottonseed cultivars; however, the exact cause of these variations remains unclear.
In summary, the Raman spectra demonstrated a marked level of similarity among different cultivars. Therefore, identifying these Raman spectra by visual inspection alone is challenging and highly subjective. The implementation of more objective chemometric methods is crucial for extracting meaningful information from the data. Subsequently, in the following section, we conduct a comprehensive exploratory analysis of the spectra to further explain cottonseed characteristics.

3.3. Exploratory Analysis of Raman Features

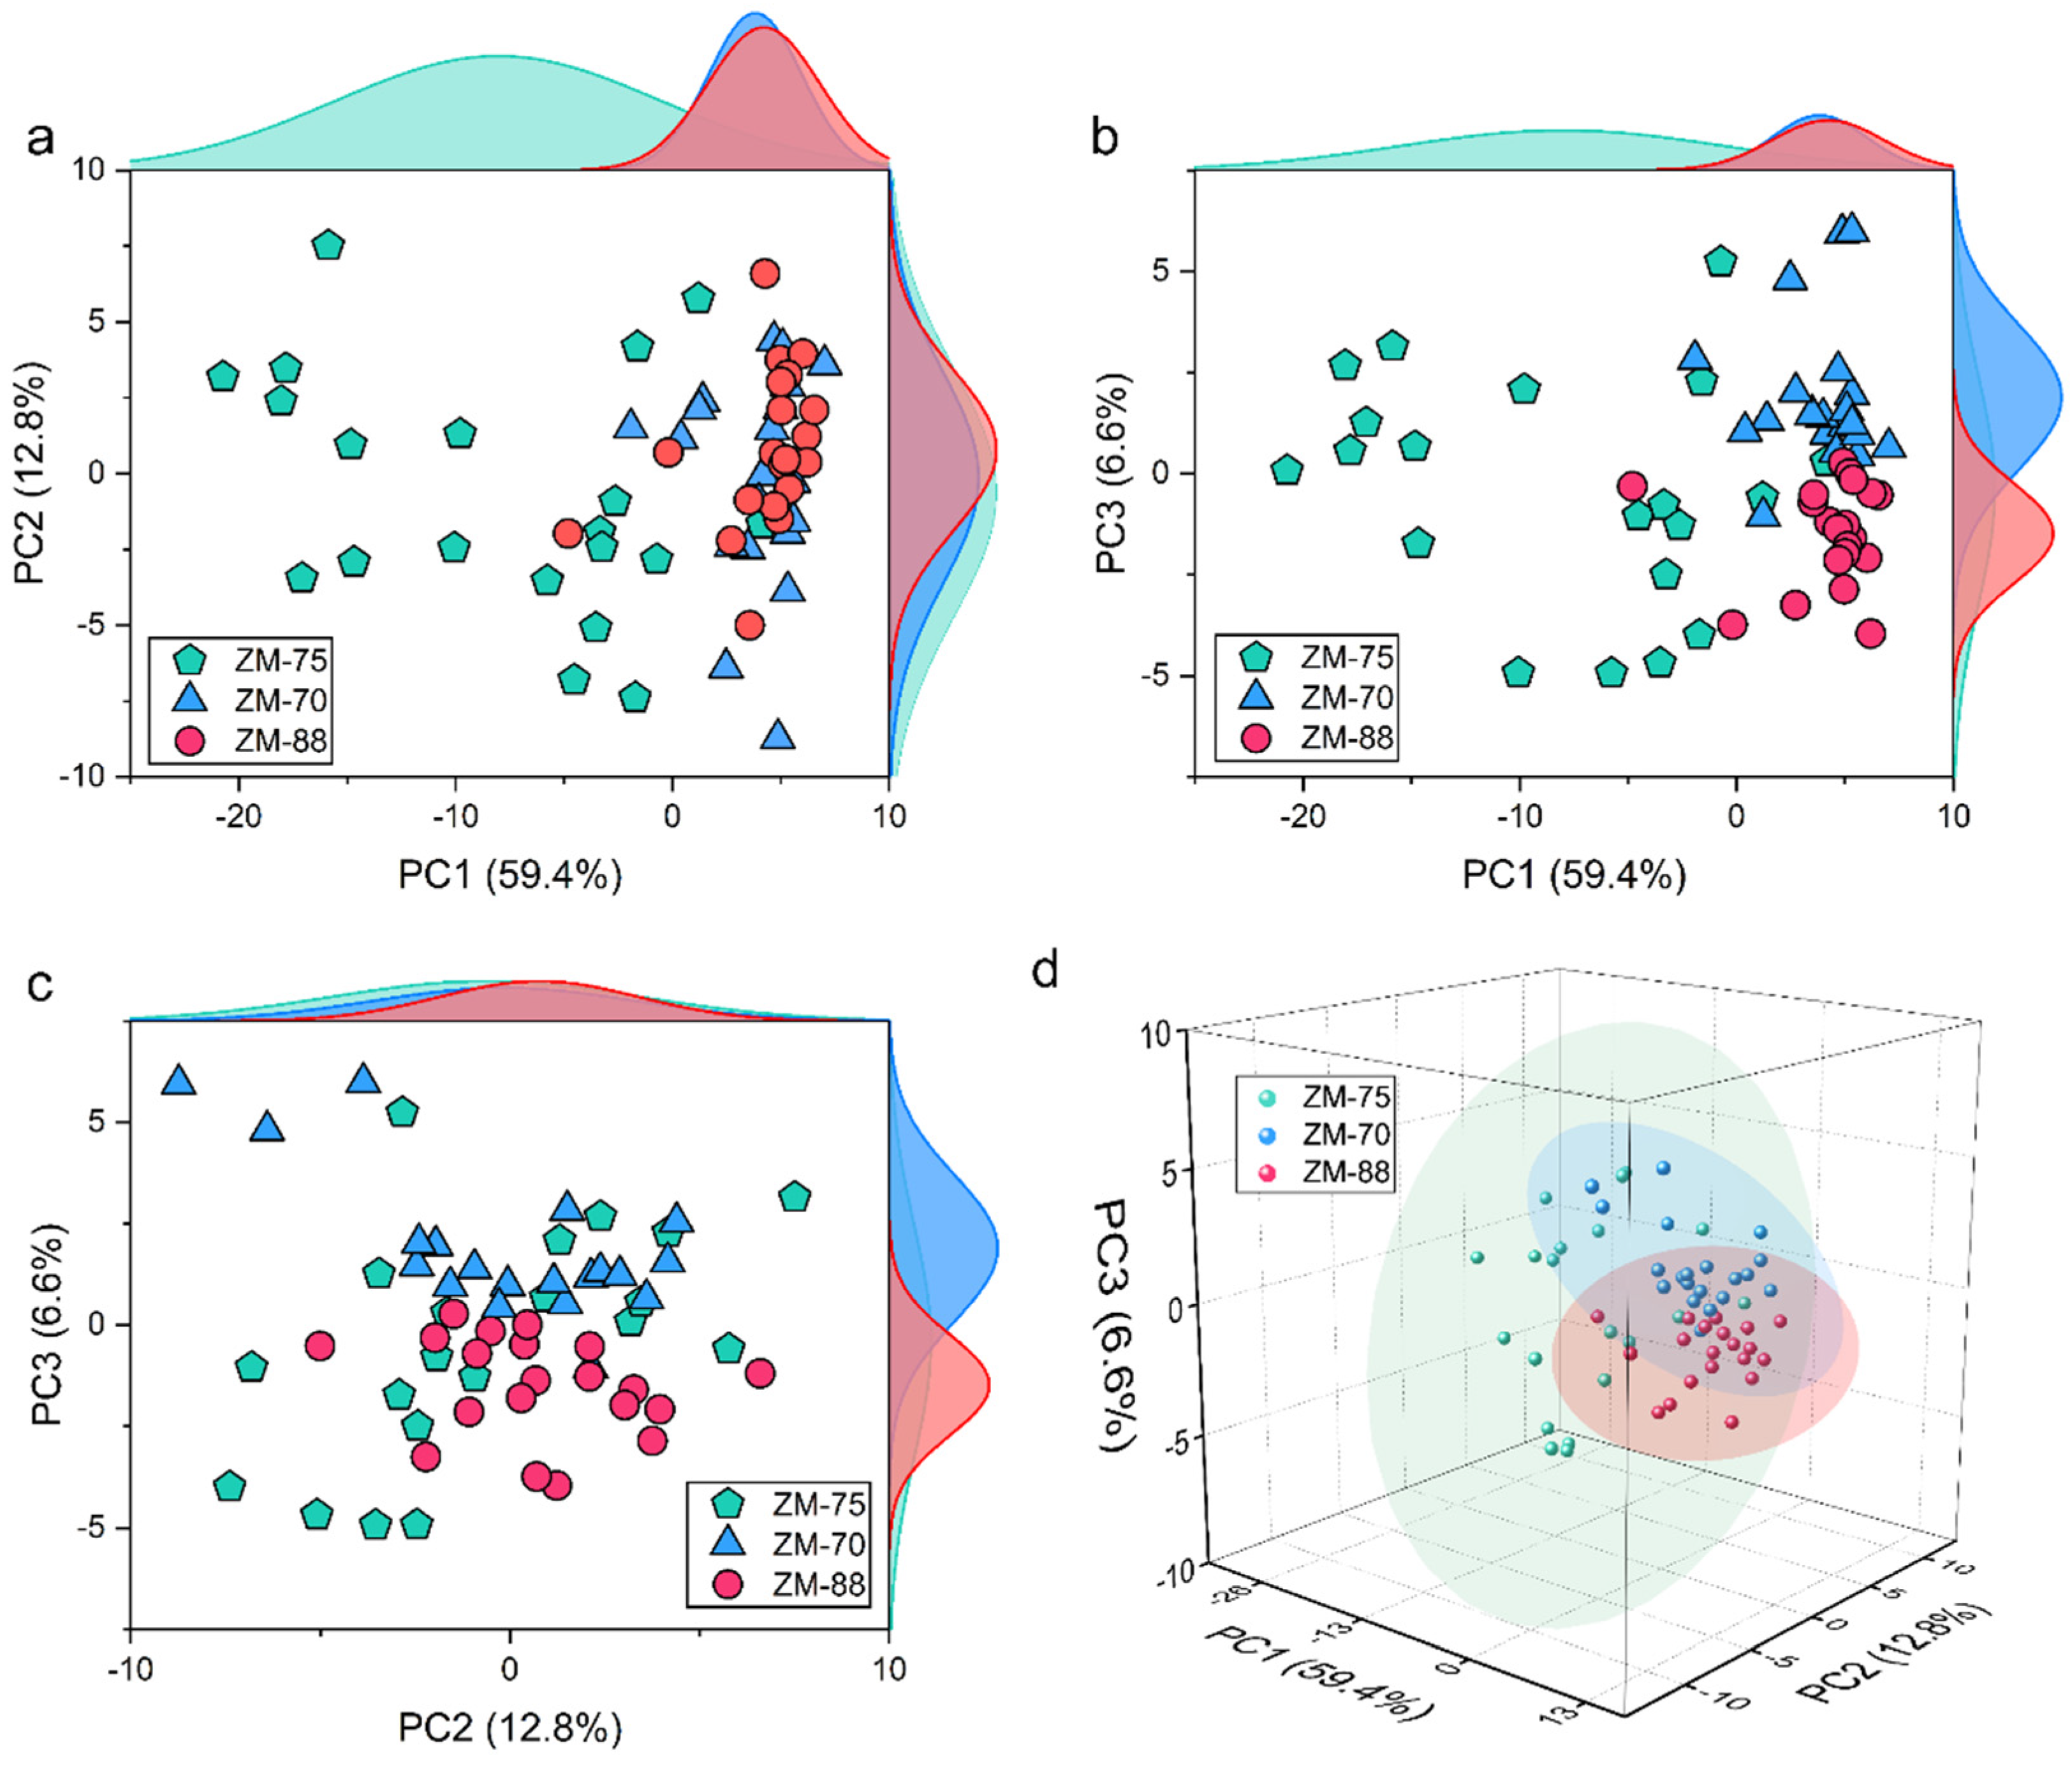
3.3.1. Exploratory Analysis of Clustering Trend

All Raman spectra were subjected to Principal Component Analysis (PCA) to assess the clustering trend of cottonseed (Figure 4). The cumulative contribution of the first three principal components was 78.8%, effectively encompassing most spectral characteristics.
We contrasted the projections of the three sample groups onto the first three principal components, where PC1 and PC3 demonstrated distinct clustering patterns (Figure 4b). Specifically, PC1 and PC3 roughly divided the data into three separate clusters, including ZH-88 and ZH-70, distinguished along PC3. ZH-75 in PC1 displayed a distinct clustering trend compared with those of the other samples. The substantial degree of dispersion observed in the distribution of ZH-75 in the scatter plot underscores its considerable variability, which is likely due to the heterogeneous composition of the samples.
These results suggest that the Raman spectra of the different cottonseed cultivars displayed clustering tendencies, despite their similarities in the spectra. However, the findings also illustrate that the relationship between cultivars remains complex, as evidenced by the lack of a definitive separation between ZH-75 and the other cultivars in PC2 and PC3 (Figure 4c). Thus, the obtained Raman spectral data establish a robust foundation for cottonseed identification. However, the use of supervised models may be imperative for precisely differentiating subtle variations among samples.

3.3.2. Exploratory Analysis of Critical Raman Wavenumbers
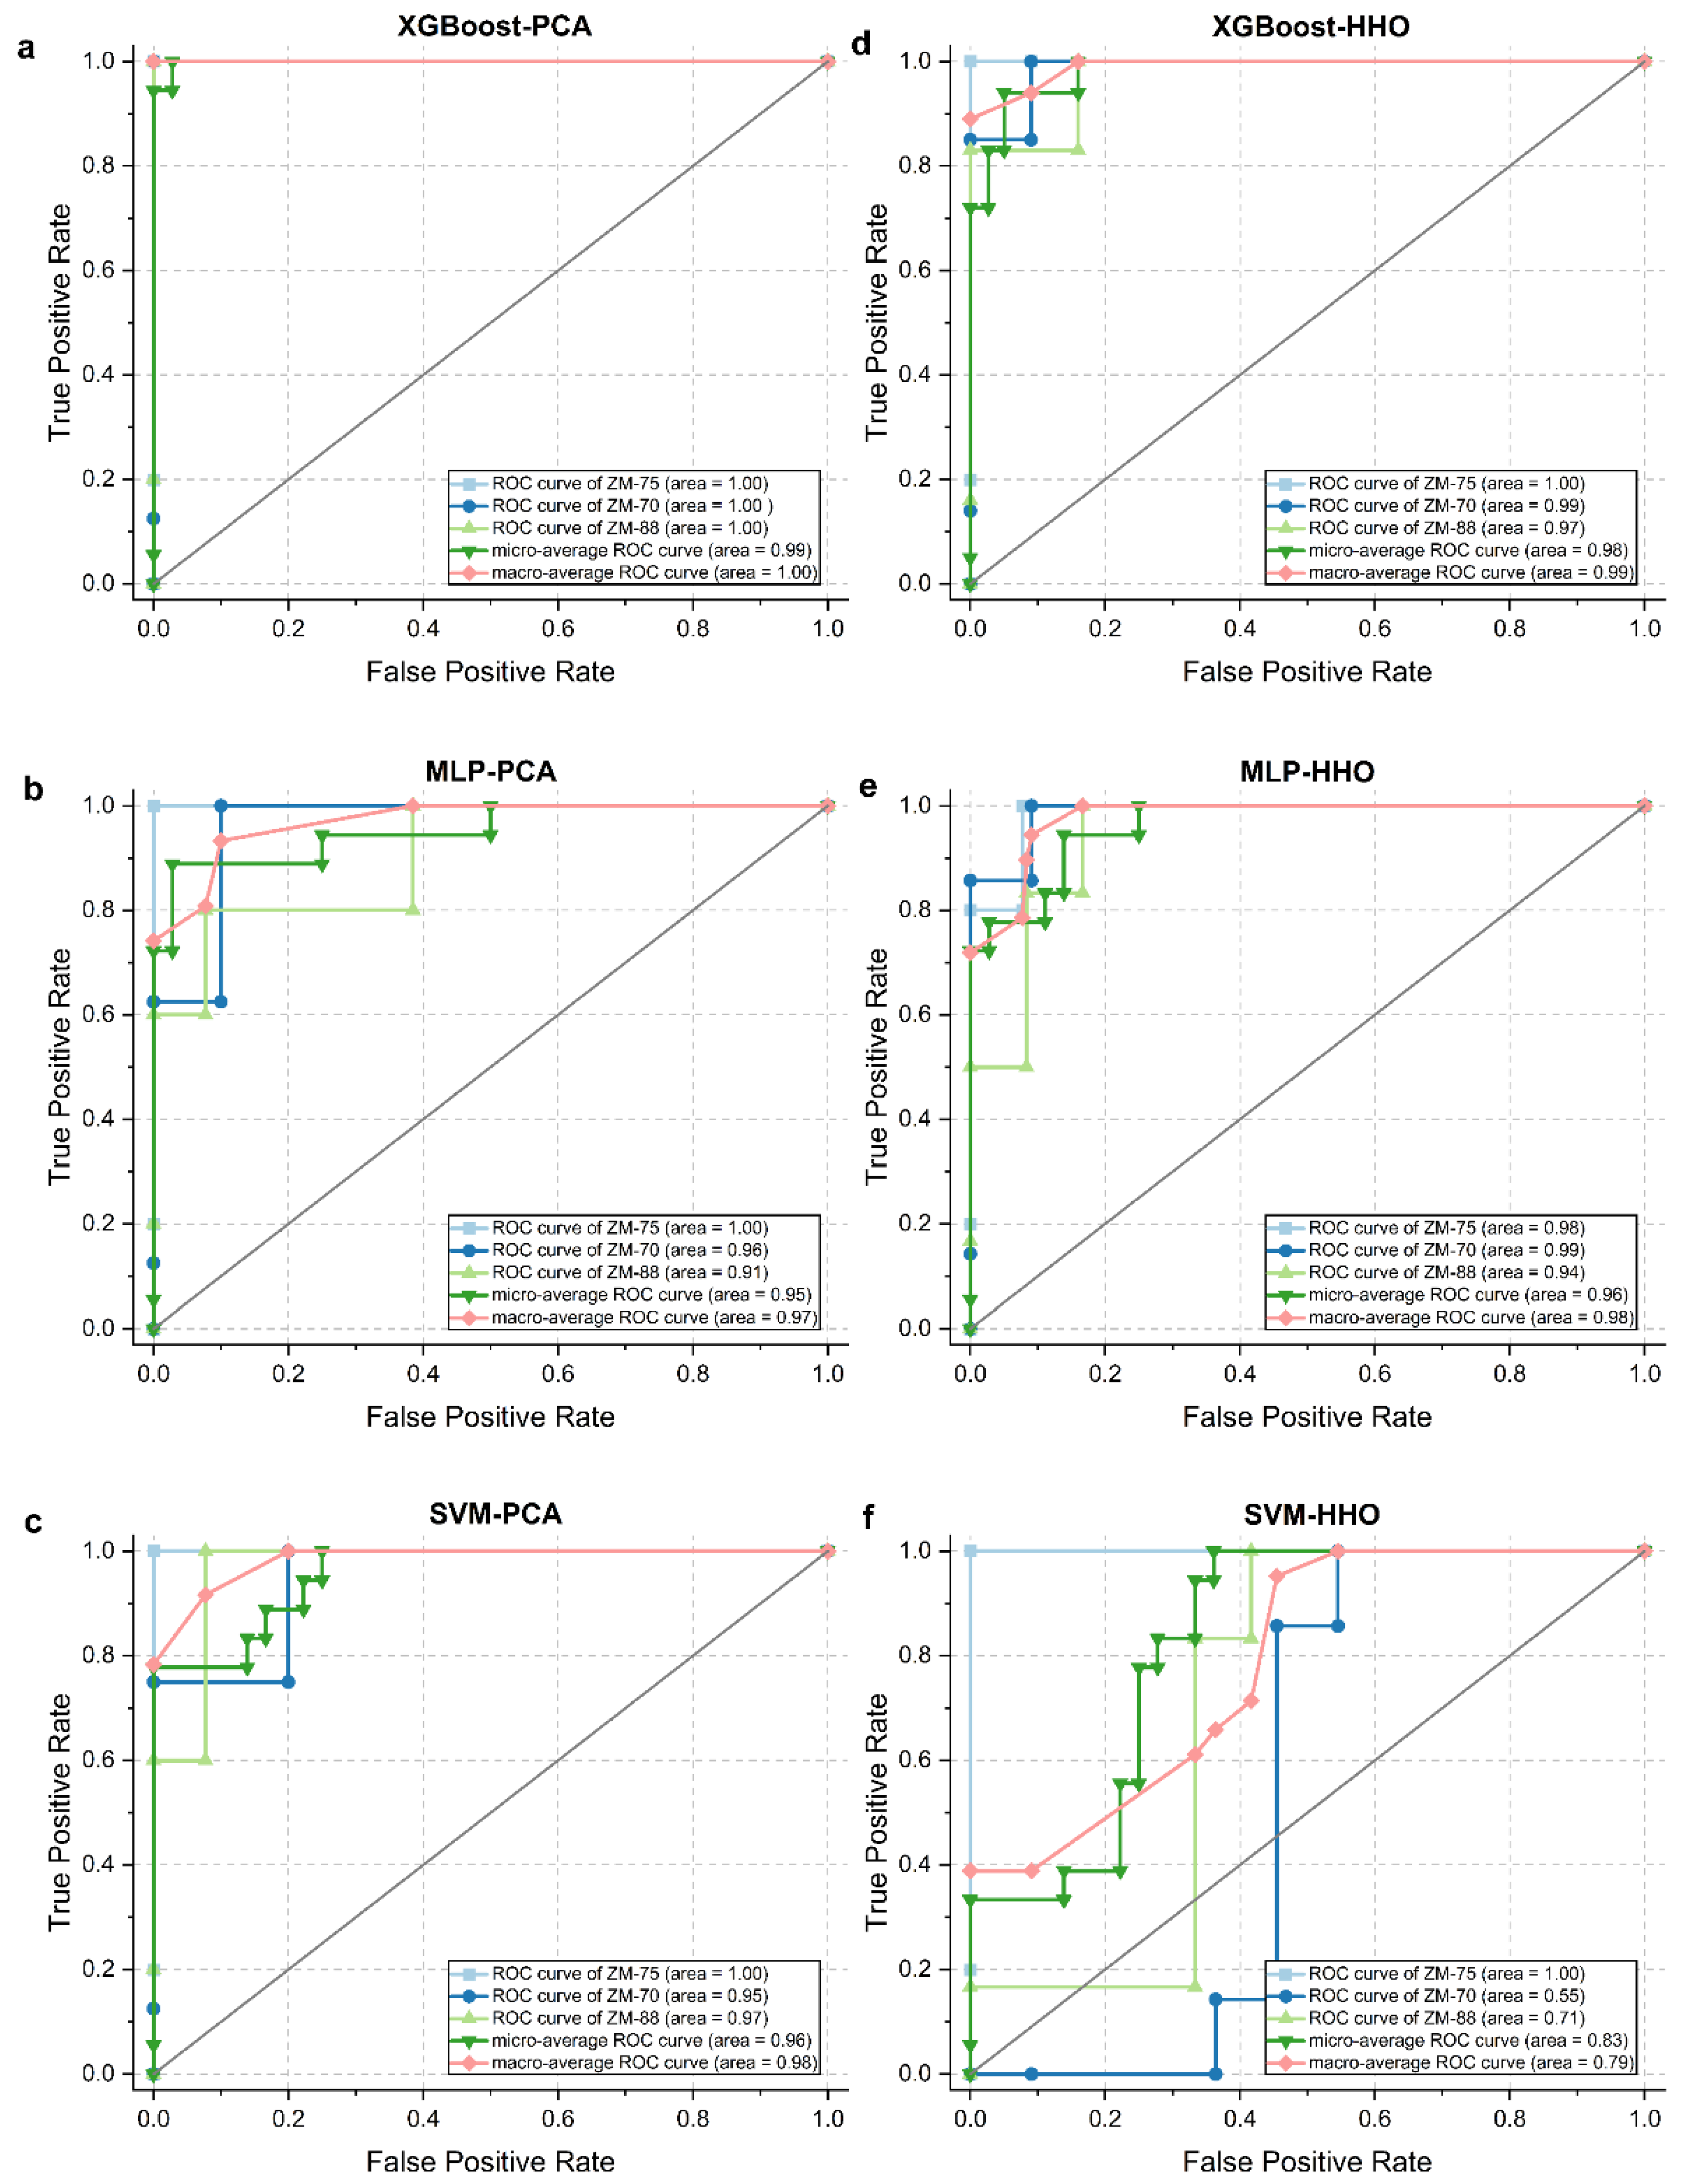
The Harris Hawk optimization (HHO) algorithm was applied to discern the most critical spectral bands. To enhance the precision and detectability of our analysis, we subjected the results of 100 runs (each run 100 iterations) to an in-depth analysis [39].
The Raman shifts reveal high frequencies centered around 1616 cm−1, 1459 cm−1, 1244 cm−1, 1111 cm−1, and 1748 cm−1 (Figure 5). These selected wavenumbers with high-frequency modes may facilitate the identification of cottonseeds, and are primarily attributed to lignin, cellulose, protein, and pectin. In particular, the Raman peaks at 1616 cm−1 and 1459 cm−1 correspond to the aromatic skeletal vibrations and methoxy deformations of lignin, respectively. The peak near 1111 cm−1 indicates the CC and CO stretching of the cellulose. The Raman feature centered near 1244 cm−1 is predominantly associated with Amide III bands. The Raman signal near 1748 cm−1 is correlated with the CO stretching of pectin [33].
The complexity of cottonseed identification poses challenges in determining which component plays a crucial role, owing to the broad coverage of features selected by the HHO algorithm (Figure 5). Although the frequency calculation of the selected features is applicable, it may not always yield an optimal subset of features. To address these limitations, we propose using SHAP for a more comprehensive evaluation of selected features, with the ultimate goal of obtaining reliable and robust experimental results.

3.4. Model Analysis

In this section, we present the classification results obtained using several methods to compare the performance of our proposed hybrid approach with that of filtered sets obtained through PCA and HHO. Three commonly used metrics, namely, accuracy, receiver operating characteristics (ROC), and area under the curve (AUC), were used to evaluate the classifier’s performance. Accuracy serves as a measure of the efficacy of a classifier’s predictions to match actual results. The ROC, with its associated AUC metric, was used to assess the ability of each method to discriminate between counterexamples (misclassified samples).
The performance of the three classifiers, XGBoost, MLP, and SVM, was evaluated for cottonseed identification using the filtered sets obtained through PCA (Table 2 and Figure 6). Our comparison reveals that XGBoost outperforms the other classifiers in terms of identification performance, achieving an identification accuracy of 0.94 on the test set accuracy. Moreover, XGBoost showed exceptional performance for cottonseed cultivar identification (AUC = 1). These outstanding metrics demonstrated the accuracy and robustness of the XGBoost model for cottonseed identification. MLP has the advantage of faster prediction accuracy when handling large feature datasets, owing to its architecture and back-propagation [14,40]. Given the limited size of the dataset used in our study, it is unsurprising that the test set accuracy of MLP (0.89) is slightly lower than that of XGBoost. Finally, SVM obtained the lowest classifier accuracy. This is likely due to the “rbf” kernel function not capturing the underlying structure of the data well, leading to subpar discriminative accuracy for ZH-70 (AUC = 0.95) and ZH-88 (AUC = 0.97). However, SVM still showed excellent identification performance for ZH-75 (AUC = 1), indicating its relative effectiveness in cottonseed identification.
The evaluation of classifiers using the HHO-filtered dataset revealed a consistent order of performance: the best was XGBoost, followed by MLP and SVM (Table 2 and Figure 6). Unlike the PCA results, the accuracy of the classifiers based on the HHO-filtered set demonstrated varying degrees of degradation. In particular, SVM demonstrated a limited ability to distinguish between ZH-70 (AUC = 0.55) and ZH-88 (AUC = 0.71). Additionally, the accuracy of XGBoost and MLP test sets decreased to 0.89 and 0.78, respectively. These outcomes suggest that the selected Raman shift subset after HHO optimization may have lost crucial information, leading to a reduced ability of the classifiers to accurately identify inter-sample relationships.
Overall, these results illustrate the effectiveness of combining Raman spectroscopy with ML for cottonseed identification. We present evidence that XGBoost-PCA and XGBoost-HHO can accurately predict the cottonseed cultivars in this dataset. Given the limited size of the dataset, the performance of the MLP aligns with expectations. However, when applied to larger datasets, neural networks can potentially demonstrate a higher utility. It is worth highlighting that numerous researchers have integrated deep learning with diverse digital phenotyping methods to tackle the challenge of seed qualitative and quantitative analysis [12,41,42,43,44]. Notably, Lei Feng et al. effectively combined hyperspectral imaging with deep learning to identify cottonseed cultivars, achieving an impressive accuracy of 0.89 using the CNN-SoftMax method [45]. Hence, we anticipate that the growing demand for large-scale seed phenotype data analysis will drive the future utility enhancement of neural networks. Our results suggest that tree-based ML models, particularly XGBoost, represent the most efficient cottonseed identification strategies currently available. We anticipate that our findings will pave the way for the development of more advanced and accurate ML techniques for cottonseed identification.

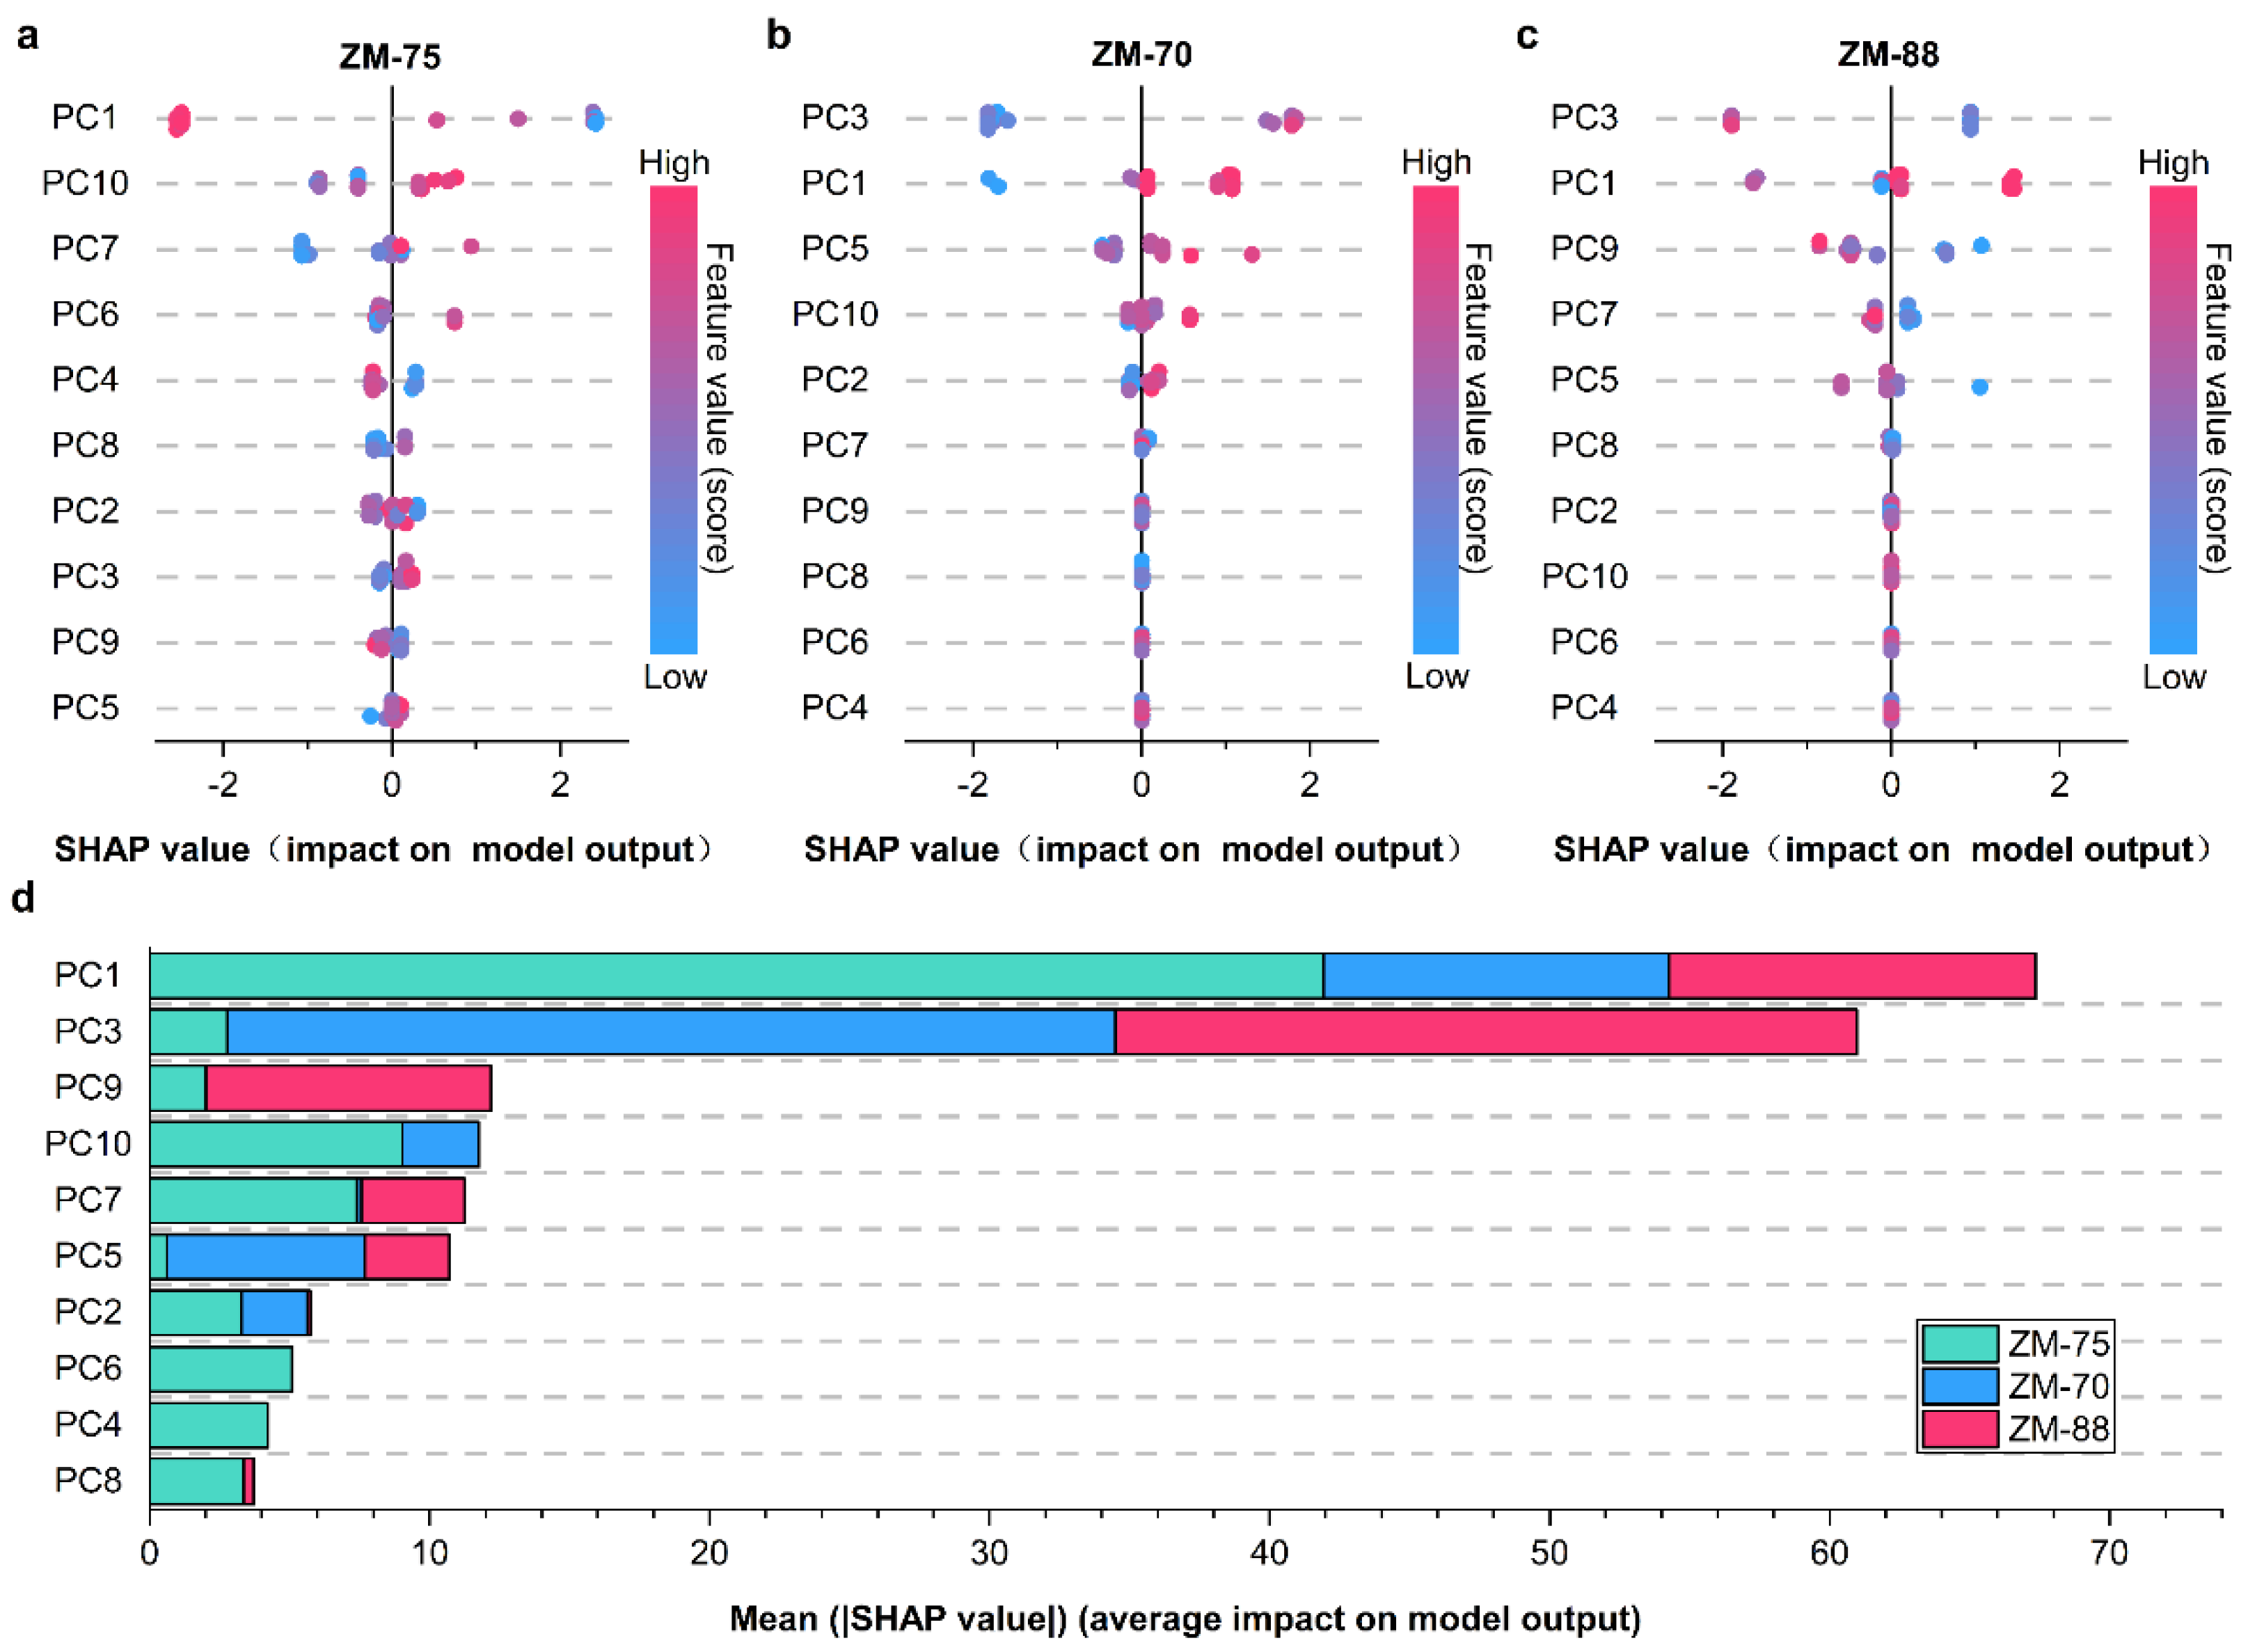
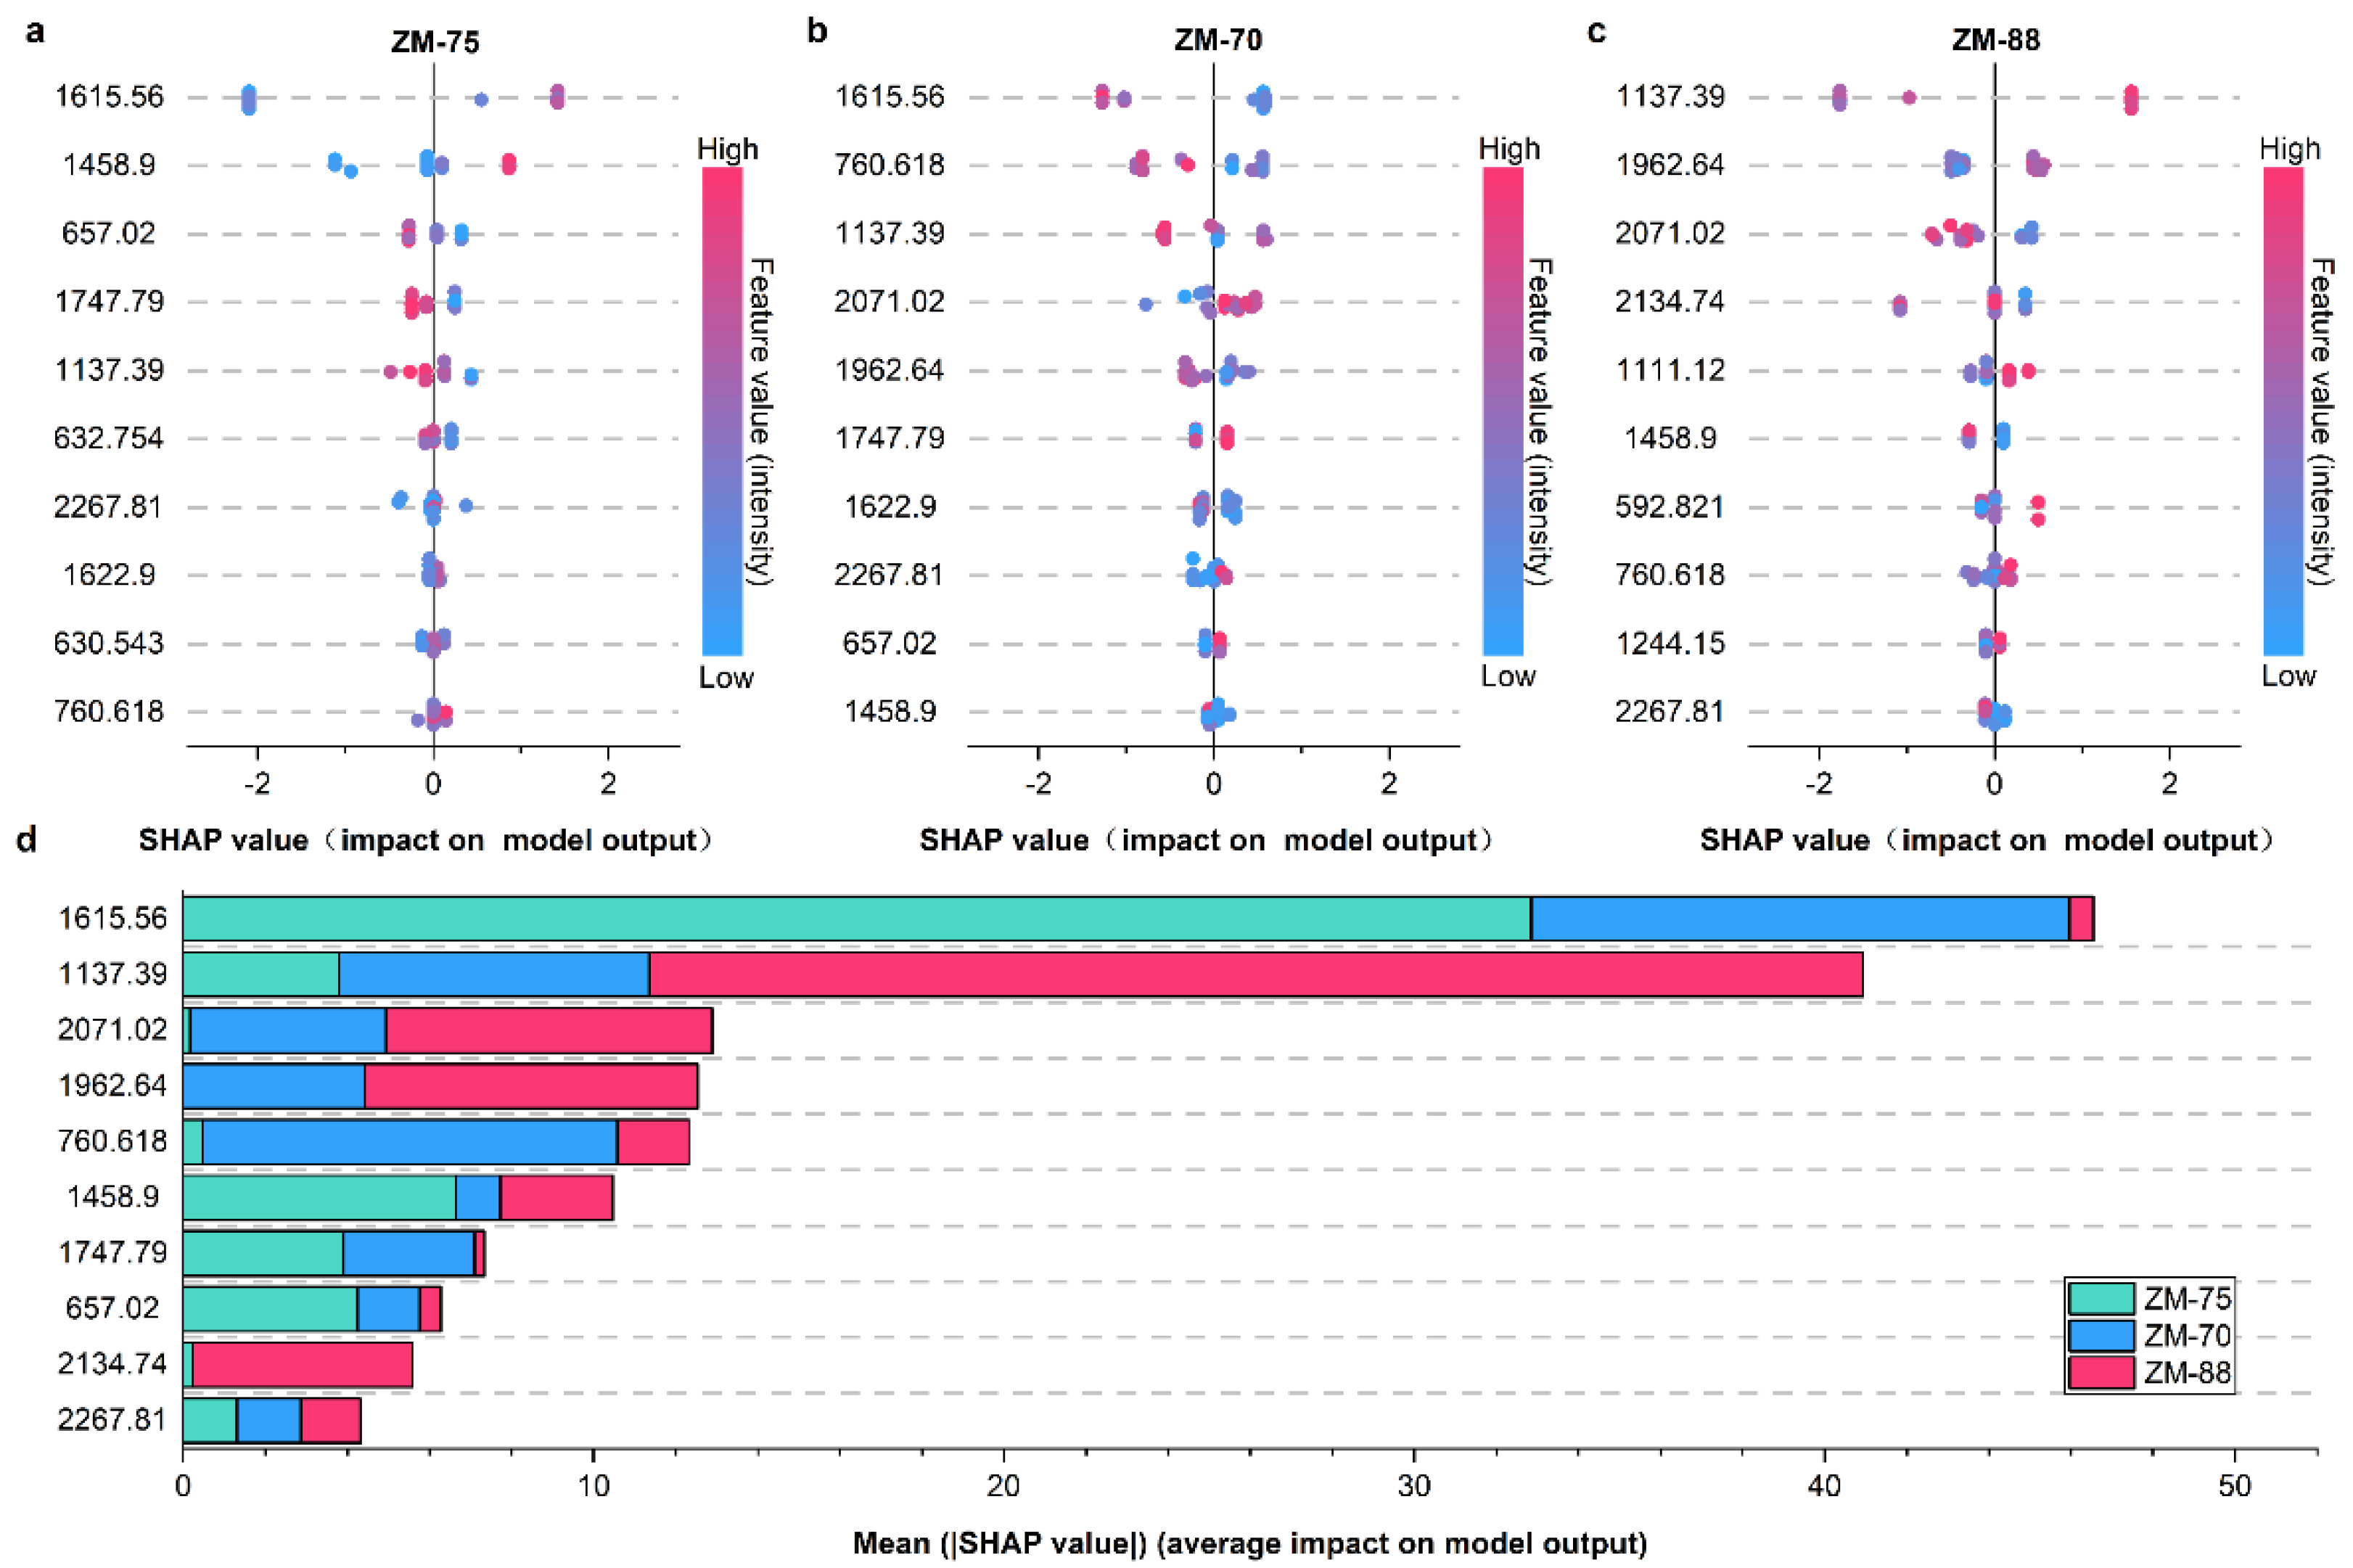
3.5. Model Interpretation

In this study, our emphasis was on objectively and impartially analyzing the impact of input features on XGBoost predictions, despite prior evidence of the algorithm’s outstanding discriminatory capability (Table 2). The analysis of feature contributions not only offers insights into the model’s decision-making process but also has the potential to further our understanding of the underlying mechanisms of the sample.
The importance of the input features can be obtained through the invocation of the built-in API interface of XGBoost. However, the calculated results may be prone to inaccuracies and subjectivity owing to the high sensitivity of XGBoost to multicollinearity and noise in the dataset [29].
The SHAP based on cooperative game theory effectively addresses this issue [29,46,47]. Therefore, we used the TreeExplainer algorithm within the SHAP library to efficiently and accurately interpret XGBoost outputs. In this instance, the computed SHAP values can establish the feature ranking.
Figure 7 illustrates the XGBoost-PCA model interpretation, displaying the cumulative absolute average SHAP values for each principal component: PC1 and PC3 emerged as the most influential features in the XGBoost predictions across the principal components. The distribution of the SHAP values for the ZH-75, ZH-70, and ZH-88 identification models are shown in Figure 7a–c, respectively. The samples exhibiting elevated PC1 scores negatively influenced the discrimination of ZH-75 (Figure 7a). High PC3 scores had a positive effect on the identification of ZH-70 but a negative effect on ZH-88 (Figure 7b,c). These results are consistent with the experimental outcomes of the PCA analysis. The identification of ZH-75 by XGBoost primarily depends on the lower PC1 scores in the samples, and the identification of ZH-70 and ZH-88 is contingent upon the clustering tendencies of PC3. These findings emphasize the effectiveness of XGBoost in learning the clustering trends of cottonseed Raman spectral mapping across PCs, thus resulting in remarkable classification efficiency.
A comprehensive interpretation of XGBoost-HHO (Figure 8) shows the impact of the top ten most significant Raman wavenumbers on cottonseed identification. According to a synthesis of the analysis of the influence of Raman wavenumbers on the average output amplitude of XGBoost (Figure 8d) and the distribution of SHAP values (Figure 8a–c), 1615 cm−1 and 1137 cm−1 are the most critical features in the Raman spectroscopic fingerprints of cottonseeds. Specifically, XGBoost identifies ZH-75 and ZH-70 based on the intensity differences of the Raman signals at 1615 cm−1: positive SHAP values (red) for the prediction of ZH-75 and negative SHAP values (blue) for ZH-70 samples. The identification of ZH-88 using XGBoost was primarily based on the intensity of the Raman peak at 1137 cm−1. The Raman peaks at 1615 cm−1 and 1137 cm−1 can be attributed to the aromatic skeleton vibrations of lignin.
Consequently, the deposition of lignin in cottonseeds is likely a key factor in cottonseed discrimination according to the model interpretation results. Therefore, future research on lignin in cottonseeds may have significant implications for enhancing the accuracy of cottonseed discrimination and managing cottonseed genetic resources. Lignin is a complex polymer present in the cell walls of many plants, including cotton [35]. In cottonseeds, lignin plays a crucial role in protecting the seeds from damage and biological and nonbiological stresses [48,49].
The conclusion and discussion of the XGBoost model interpretation based on SHAP analysis are as follows: XGBoost-PCA is capable of effectively deciphering the intricate nonlinear relationships between the sample data, with significant superiority in terms of stability and precision. Meanwhile, the XGBoost-HHO model provides more robust interpretation results that are chemically meaningful, although it exhibits slightly lower classification accuracy than XGBoost-PCA. Our research complements recent efforts to use Raman spectroscopy for cottonseed cultivar identification [37]. Our study presents an interpretable approach to identifying schemes that use ML models, thereby clarifying the impact of multiple variables on model output amplitude. Importantly, our work emphasizes the potential of the interpretation of the model, particularly post hoc Raman feature importance ranking, in generating new hypotheses for designing prospective studies on future seed identification. We believe that using explainable ML for seed identification will contribute to the development of more advanced and targeted seed identification methods.

4. Conclusions

In this study, we contribute to the growing research on the use of Raman spectroscopy for cottonseed identification. We presented a novel cottonseed identification model that combines Raman spectroscopy, ML, and XAI. Our findings highlight the feasibility of using ML for accurate cottonseed identification, and the interpretability of complex ML models to guide the design of future cottonseed identification methods.
First, we provide a comprehensive analysis of the Raman spectra of cottonseeds, followed by an exploration of the complex relationships among cottonseed cultivars. To achieve this, we used PCA and HHO to establish a Raman spectral exploration model. Subsequently, we applied three different ML models of varying complexity to perform cottonseed discrimination and demonstrated that XGBoost outperformed the other models in terms of accuracy. Finally, we used the SHAP method to analyze the decision-making process of XGBoost and to gain insights into the intricate relationships between cottonseed cultivars. Our results suggest that lignin may hold promise in the design of future cottonseed identification methods.
This study provides a precise approach for cottonseed identification based on Raman spectroscopy. This approach can expand the scope of seed cultivar identification and is a valuable tool for seed practitioners.

Author Contributions

Conceptualization, J.C. and N.Z.; methodology, J.C., X.B., and L.W.; software, J.C. and X.B.; validation, X.Z. and N.Z.; formal analysis, J.C. and X.B.; investigation, N.Z.; resources, L.W. and N.Z.; data curation, J.C. and X.Z.; writing—original draft preparation, X.B. and J.C.; writing—review and editing, X.Z. and N.Z.; visualization, J.C. and X.B.; supervision, X.Z. and N.Z.; project administration, N.Z.; funding acquisition, N.Z. All authors have read and agreed to the published version of the manuscript.

Funding

This work was partly supported by the National Natural Science Foundation of China (32101621, 62061041, and 31960503), Bingtuan Science and Technology Program (2022CB001-05 and 2021BB023-02).

Institutional Review Board Statement

Not applicable.

Informed Consent Statement

Not applicable.

Data Availability Statement

The data that support the findings of this study are available on request from the corresponding author.

Conflicts of Interest

The authors declare no conflict of interest.

References

  1. Khan, M.A.; Wahid, A.; Ahmad, M.; Tahir, M.T.; Ahmed, M.; Ahmad, S.; Hasanuzzaman, M. World Cotton Production and Consumption: An Overview. In Cotton Production and Uses: Agronomy, Crop Protection, and Postharvest Technologies; Ahmad, S., Hasanuzzaman, M., Eds.; Springer: Singapore, 2020; pp. 1–7. ISBN 9789811514722. [Google Scholar]
  2. Feng, L.; Dai, J.; Tian, L.; Zhang, H.; Li, W.; Dong, H. Review of the Technology for High-Yielding and Efficient Cotton Cultivation in the Northwest Inland Cotton-Growing Region of China. Field Crop. Res. 2017, 208, 18–26. [Google Scholar] [CrossRef]
  3. Nations, U. World Cotton Day. Available online: https://www.un.org/en/observances/cotton-day (accessed on 18 February 2023).
  4. Yang, Z.; Gao, C.; Zhang, Y.; Yan, Q.; Hu, W.; Yang, L.; Wang, Z.; Li, F. Recent Progression and Future Perspectives in Cotton Genomic Breeding. J. Integr. Plant Biol. 2023, 65, 548–569. [Google Scholar] [CrossRef] [PubMed]
  5. Wang, M.; Li, J.; Qi, Z.; Long, Y.; Pei, L.; Huang, X.; Grover, C.E.; Du, X.; Xia, C.; Wang, P.; et al. Genomic Innovation and Regulatory Rewiring during Evolution of the Cotton Genus Gossypium. Nat. Genet. 2022, 54, 1959–1971. [Google Scholar] [CrossRef] [PubMed]
  6. Hussain, A.; Sajid, M.; Iqbal, D.; Sarwar, M.I.; Farooq, A.; Siddique, A.; Khan, M.Q.; Kim, I.-S. Impact of Novel Varietal and Regional Differences on Cotton Fiber Quality Characteristics. Materials 2022, 15, 3242. [Google Scholar] [CrossRef] [PubMed]
  7. Wang, K.Q.; Li, Z.L.; Li, J.J.; Lin, H. Raman Spectroscopic Techniques for Nondestructive Analysis of Agri-Foods: A State-of-the-Art Review. Trends Food Sci. Technol. 2021, 118, 490–504. [Google Scholar] [CrossRef]
  8. Zareef, M.; Arslan, M.; Hassan, M.M.; Ahmad, W.; Ali, S.; Li, H.H.; Qin, O.Y.; Wu, X.Y.; Hashim, M.M.; Chen, Q.S. Recent Advances in Assessing Qualitative and Quantitative Aspects of Cereals Using Nondestructive Techniques: A Review. Trends Food Sci. Technol. 2021, 116, 815–828. [Google Scholar] [CrossRef]
  9. Salisu, I.B.; Shahid, A.A.; Yaqoob, A.; Ali, Q.; Bajwa, K.S.; Rao, A.Q.; Husnain, T. Molecular Approaches for High Throughput Detection and Quantification of Genetically Modified Crops: A Review. Front. Plant Sci. 2017, 8, 1670. [Google Scholar] [CrossRef] [Green Version]
  10. Bahadoran, Z.; Mirmiran, P.; Jeddi, S.; Azizi, F.; Ghasemi, A.; Hadaegh, F. Nitrate and Nitrite Content of Vegetables, Fruits, Grains, Legumes, Dairy Products, Meats and Processed Meats. J. Food Compos. Anal. 2016, 51, 93–105. [Google Scholar] [CrossRef]
  11. Payne, W.Z.; Kurouski, D. Raman Spectroscopy Enables Phenotyping and Assessment of Nutrition Values of Plants: A Review. Plant Methods 2021, 17, 78. [Google Scholar] [CrossRef]
  12. Weng, S.; Zhu, W.; Zhang, X.; Yuan, H.; Zheng, L.; Zhao, J.; Huang, L.; Han, P. Recent Advances in Raman Technology with Applications in Agriculture, Food and Biosystems: A Review. Artif. Intell. Agric. 2019, 3, 1–10. [Google Scholar] [CrossRef]
  13. Jentzsch, P.V.; Ciobota, V.; Salinas, W.; Kampe, B.; Aponte, P.M.; Rosch, P.; Popp, J.; Ramos, L.A. Distinction of Ecuadorian Varieties of Fermented Cocoa Beans Using Raman Spectroscopy. Food Chem. 2016, 211, 274–280. [Google Scholar] [CrossRef]
  14. Oo, T.K.; Arunrat, N.; Sereenonchai, S.; Ussawarujikulchai, A.; Chareonwong, U.; Nutmagul, W. Comparing Four Machine Learning Algorithms for Land Cover Classification in Gold Mining: A Case Study of Kyaukpahto Gold Mine, Northern My-anmar. Sustainability 2022, 14, 10754. [Google Scholar] [CrossRef]
  15. Balducci, F.; Impedovo, D.; Pirlo, G. Machine Learning Applications on Agricultural Datasets for Smart Farm Enhancement. Machines 2018, 6, 38. [Google Scholar] [CrossRef] [Green Version]
  16. Lussier, F.; Thibault, V.; Charron, B.; Wallace, G.Q.; Masson, J.-F. Deep Learning and Artificial Intelligence Methods for Raman and Surface-Enhanced Raman Scattering. Trac-Trends Anal. Chem. 2020, 124, 115796. [Google Scholar] [CrossRef]
  17. Adadi, A.; Berrada, M. Peeking Inside the Black-Box: A Survey on Explainable Artificial Intelligence (XAI). IEEE Access 2018, 6, 52138–52160. [Google Scholar] [CrossRef]
  18. Jia, S.Q.; An, D.; Liu, Z.; Gu, J.C.; Li, S.M.; Zhang, X.D.; Zhu, D.H.; Guo, T.T.; Yan, Y.L. Variety Identification Method of Coated Maize Seeds Based on Near-Infrared Spectroscopy and Chemometrics. J. Cereal Sci. 2015, 63, 21–26. [Google Scholar] [CrossRef]
  19. Engel, J.; Gerretzen, J.; Szymanska, E.; Jansen, J.J.; Downey, G.; Blanchet, L.; Buydens, L.M.C. Breaking with Trends in Pre-Processing? Trac-Trends Anal. Chem. 2013, 50, 96–106. [Google Scholar] [CrossRef]
  20. Chen, S.; Lin, X.; Yuen, C.; Padmanabhan, S.; Beuerman, R.W.; Liu, Q. Recovery of Raman Spectra with Low Signal-to-Noise Ratio Using Wiener Estimation. Opt. Express 2014, 22, 12102–12114. [Google Scholar] [CrossRef]
  21. Bocklitz, T.; Walter, A.; Hartmann, K.; Rösch, P.; Popp, J. How to Pre-Process Raman Spectra for Reliable and Stable Models? Anal. Chim. Acta 2011, 704, 47–56. [Google Scholar] [CrossRef]
  22. Morais, C.L.M.; Lima, K.M.G.; Singh, M.; Martin, F.L. Tutorial: Multivariate Classification for Vibrational Spectroscopy in Biological Samples. Nat. Protoc. 2020, 15, 2143–2162. [Google Scholar] [CrossRef]
  23. Heidari, A.A.; Mirjalili, S.; Faris, H.; Aljarah, I.; Mafarja, M.; Chen, H. Harris Hawks Optimization: Algorithm and Applications. Future Gener. Comput. Syst.-Int. J. Esci. 2019, 97, 849–872. [Google Scholar] [CrossRef]
  24. Elgamal, Z.M.; Yasin, N.B.M.; Tubishat, M.; Alswaitti, M.; Mirjalili, S. An Improved Harris Hawks Optimization Algorithm with Simulated Annealing for Feature Selection in the Medical Field. IEEE Access 2020, 8, 186638–186652. [Google Scholar] [CrossRef]
  25. Abbott, D. Foreword 2 for 1st Edition. In Handbook of Statistical Analysis and Data Mining Applications, 2nd ed.; Nisbet, R., Miner, G., Yale, K., Eds.; Academic Press: Boston, MA, USA, 2018; pp. xv–xvi. ISBN 978-0-12-416632-5. [Google Scholar]
  26. Chen, T.; Guestrin, C. XGBoost: A Scalable Tree Boosting System. In Proceedings of the 22nd ACM SIGKDD International Conference on Knowledge Discovery and Data Mining, San Francisco, CA, USA, 13–17 August 2016; pp. 785–794. [Google Scholar]
  27. Cichosz, P. Assessing the Quality of Classification Models: Performance Measures and Evaluation Procedures. Open Eng. 2011, 1, 132–158. [Google Scholar] [CrossRef]
  28. Vilone, G.; Longo, L. Explainable Artificial Intelligence: A Systematic Review. arXiv 2020, arXiv:2006.00093. [Google Scholar]
  29. Aas, K.; Jullum, M.; Loland, A. Explaining Individual Predictions When Features Are Dependent: More Accurate Approximations to Shapley Values. Artif. Intell. 2021, 298, 103502. [Google Scholar] [CrossRef]
  30. Alabi, R.O.; Almangush, A.; Elmusrati, M.; Leivo, I.; Makitie, A.A. An Interpretable Machine Learning Prognostic System for Risk Stratification in Oropharyngeal Cancer. Int. J. Med. Inf. 2022, 168, 104896. [Google Scholar] [CrossRef]
  31. Yan, H.; Hua, Z.; Qian, G.; Wang, M.; Du, G.; Chen, J. Analysis of the Chemical Composition of Cotton Seed Coat by Fourier-Transform Infrared (FT-IR) Microspectroscopy. Cellulose 2009, 16, 1099–1107. [Google Scholar] [CrossRef]
  32. Gao, W.; Zhou, L.; Liu, S.; Guan, Y.; Gao, H.; Hui, B. Machine Learning Prediction of Lignin Content in Poplar with Raman Spectroscopy. Bioresour. Technol. 2022, 348, 126812. [Google Scholar] [CrossRef]
  33. Lupoi, J.S.; Gjersing, E.; Davis, M.F. Evaluating Lignocellulosic Biomass, Its Derivatives, and Downstream Products with Raman Spectroscopy. Front. Bioeng. Biotechnol. 2015, 3, 50. [Google Scholar] [CrossRef] [Green Version]
  34. Bock, P.; Gierlinger, N. Infrared and Raman Spectra of Lignin Substructures: Coniferyl Alcohol, Abietin, and Coniferyl Aldehyde. J. Raman Spectrosc. 2019, 50, 778–792. [Google Scholar] [CrossRef]
  35. Macmillan, C.; Birke, H.; Bedon, F.; Pettolino, F. Lignin Deposition in Cotton Cells—Where Is the Lignin? J. Plant Biochem. Physiol. 2014, 1, e106. [Google Scholar] [CrossRef]
  36. Rygula, A.; Majzner, K.; Marzec, K.M.; Kaczor, A.; Pilarczyk, M.; Baranska, M. Raman Spectroscopy of Proteins: A Review. J. Raman Spectrosc. 2013, 44, 1061–1076. [Google Scholar] [CrossRef]
  37. da Mata, M.M.; Rocha, P.D.; Teles de Farias, I.K.; Brasil da Silva, J.L.; Medeiros, E.P.; Silva, C.S.; Simoes, S.d.S. Distinguishing Cotton Seed Genotypes by Means of Vibrational Spectroscopic Methods (NIR and Raman) and Chemometrics. Spectrochim. Acta Part-Mol. Biomol. Spectrosc. 2022, 266, 120399. [Google Scholar] [CrossRef]
  38. Afzal, I.; Javed, T.; Amirkhani, M.; Taylor, A.G. Modern Seed Technology: Seed Coating Delivery Systems for Enhancing Seed and Crop Performance. Agriculture 2020, 10, 526. [Google Scholar] [CrossRef]
  39. Ren, G.; Wang, Y.; Ning, J.; Zhang, Z. Highly Identification of Keemun Black Tea Rank Based on Cognitive Spectroscopy: Near Infrared Spectroscopy Combined with Feature Variable Selection. Spectrochim. Acta Part-Mol. Biomol. Spectrosc. 2020, 230, 118079. [Google Scholar] [CrossRef]
  40. Du, K.-L.; Leung, C.-S.; Mow, W.H.; Swamy, M.N.S. Perceptron: Learning, Generalization, Model Selection, Fault Tolerance, and Role in the Deep Learning Era. Mathematics 2022, 10, 4730. [Google Scholar] [CrossRef]
  41. Li, Y.; Jia, J.; Zhang, L.; Khattak, A.M.; Sun, S.; Gao, W.; Wang, M. Soybean Seed Counting Based on Pod Image Using Two-Column Convolution Neural Network. IEEE Access 2019, 7, 64177–64185. [Google Scholar] [CrossRef]
  42. Loddo, A.; Loddo, M.; Di Ruberto, C. A Novel Deep Learning Based Approach for Seed Image Classification and Retrieval. Comput. Electron. Agric. 2021, 187, 106269. [Google Scholar] [CrossRef]
  43. Uzal, L.C.; Grinblat, G.L.; Namias, R.; Larese, M.G.; Bianchi, J.S.; Morandi, E.N.; Granitto, P.M. Seed-per-Pod Estimation for Plant Breeding Using Deep Learning. Comput. Electron. Agric. 2018, 150, 196–204. [Google Scholar] [CrossRef]
  44. Ma, T.; Tsuchikawa, S.; Inagaki, T. Rapid and Non-Destructive Seed Viability Prediction Using near-Infrared Hyperspectral Imaging Coupled with a Deep Learning Approach. Comput. Electron. Agric. 2020, 177, 9. [Google Scholar] [CrossRef]
  45. Zhu, S.; Zhou, L.; Gao, P.; Bao, Y.; He, Y.; Feng, L. Near-Infrared Hyperspectral Imaging Combined with Deep Learning to Identify Cotton Seed Varieties. Molecules 2019, 24, 3268. [Google Scholar] [CrossRef] [PubMed] [Green Version]
  46. Bannigan, P.; Bao, Z.; Hickman, R.J.; Aldeghi, M.; Häse, F.; Aspuru-Guzik, A.; Allen, C. Machine Learning Models to Accelerate the Design of Polymeric Long-Acting Injectables. Nat. Commun. 2023, 14, 35. [Google Scholar] [CrossRef] [PubMed]
  47. Nagpal, S.; Singh, R.; Taneja, B.; Mande, S.S. MarkerML—Marker Feature Identification in Metagenomic Datasets Using Interpretable Machine Learning. J. Mol. Biol. 2022, 434, 167589. [Google Scholar] [CrossRef] [PubMed]
  48. Kumari, S.; Verma, V.K. Cycocel Induced Lignin Deposition in Cotton Cells and Its Role in Crop Growth. Int. J. Curr. Microbiol. Appl. Sci. 2019, 8, 1567–1573. [Google Scholar] [CrossRef]
  49. Xu, L.; Zhu, L.; Tu, L.; Liu, L.; Yuan, D.; Jin, L.; Long, L.; Zhang, X. Lignin Metabolism Has a Central Role in the Resistance of Cotton to the Wilt Fungus Verticillium Dahliae as Revealed by RNA-Seq-Dependent Transcriptional Analysis and Histochemistry. J. Exp. Bot. 2011, 62, 5607–5621. [Google Scholar] [CrossRef] [Green Version]
Figure 1. Workflow for cottonseed identification based on Raman spectroscopy and explainable ML algorithms. (a) Sample processing: The collected cottonseeds are meticulously inspected and treated with acetone to wash off the coating agents adhering to the seed surface. Raman spectroscopy measurements: Raman spectra of the cottonseeds are obtained based on Raman confocal microscopy. Data preprocessing: The spectra are processed using smoothing, baseline correction, and standardization. (b) Tentative assignment: Assignment of Raman peaks according to the chemosynthetic components of cottonseed. Exploratory analysis: The clustering trends and significant wavenumbers of the Raman spectra are explored using PCA and HHO, respectively. Dataset splitting: Data are randomly partitioned into 80% for training and 20% for testing. Classification: Cottonseed identification is performed using the SVM, XGBoost, and MLP classification algorithms. Evaluation: Common metrics (accuracy, ROC, and AUC) in multiclass classifiers are used to gauge the predictive performance of the algorithms. Interpretation: SHAP technology is leveraged to identify the contribution of features to the ML algorithms.
Agriculture 13 00768 g001
Figure 2. Phenomics analysis of the three cottonseed cultivars (cf. labels in the inset). Insets: (a) ZH-75, (b) ZH-70, and (c) ZH-88.
Agriculture 13 00768 g002
Figure 3. The average confocal Raman spectra (400−2500 cm−1) of the three cottonseed cultivars and coating agents, following appropriate preprocessing procedures. The spectral preprocessing methodology involved the implementation of the SG algorithm for noise reduction, the ALS approach for baseline correction, and normalization to enhance the reliability of the analysis.
Agriculture 13 00768 g003
Figure 4. Decoding clustering trends in Raman spectra using PCA. (ac) Detailed information on each PC in two-dimensional score plots. (d) A three-dimensional scatter plot visualizes the clustering trends of the first three PCs.
Agriculture 13 00768 g004
Figure 5. HHO revealed crucial Raman features for cottonseed identification. The frequency curve (results of 100 runs, each run with 100 iterations) of the selected features was used to confirm the crucial Raman wavenumbers, denoted by red dots in the analysis.
Agriculture 13 00768 g005
Figure 6. Comparative analysis of the performance prediction for each cottonseed cultivar using ML models. The ROC curves in (af) illustrate the true positive and false positive rates of the model’s predictions for each cottonseed cultivar. For each curve, AUC was calculated to assess the overall performance of the model. The plots in (ac) display the performance of XGBoost (a), MLP (b), and SVM (c) on the PCA-filtered dataset that was trained to identify cottonseed cultivars. The plots in (df) show the ROC curves and AUC of XGBoost (d), MLP (e), and SVM (f), respectively, utilizing the HHO-filtered dataset to scrutinize the performance differences between PCA and HHO.
Agriculture 13 00768 g006
Figure 7. Quantifying the impact of PCs on XGBoost prediction through analysis of the SHAP. (ac) For each cottonseed cultivar, ZH-75 (a), ZH-70 (b), and ZH-88 (c), the distribution of the SHAP values of the PCs is presented. The color of each point (according to the color bar; blue represents low feature values, and red represents high feature values) indicates the feature value, which represents the magnitude of each PC score. The plot in (d) shows the sum of the absolute SHAP values averaged across each PC (i.e., the average influence of each PC on the XGBoost predictions). All plots in (ad) were sorted by the mean absolute SHAP value of the PCs, from the highest to the lowest.
Agriculture 13 00768 g007
Figure 8. Quantification of the impact of Raman features on XGBoost predictions using SHAP analysis. (ac) For each cottonseed cultivar, ZH-75 (a), ZH-70 (b), and ZH-80 (c), the SHAP value distribution for each Raman wavenumber is presented. The plot in (d) shows the average impact of each Raman wavenumber (the top 10 most impactful Raman features) on the XGBoost predictions. In all images (ad), the Raman wavenumbers are sorted from top (most significant) to bottom (least significant) based on their predicted importance.
Agriculture 13 00768 g008
Table 1. Summary of cotton cultivar characteristics.
CultivarBreedingGrowth Period
(Days)
Micronaire (MIC)Resistance/
Tolerance
Growing Region
ZH-75Transgenic Bt hybrid1235.1Fusarium wilt (t)
Verticillium wilt (t)
Cotton bollworm (r)
Yellow River
basin
ZH-70Transgenic Bt + CpTI hybrid1214.3Fusarium wilt (t)
Verticillium wilt (t)
Cotton bollworm (r)
Yellow River
basin
ZH-88Hybridization1454.1Fusarium wilt (r)Northwestern inland
r = resistance, t = tolerance.
Table 2. Cottonseed identification using different filtered sets using ML algorithms based on Raman spectroscopy.
MethodsTraining AccuracyTesting Accuracy
Machine learningSVM + PCA0.900.78
SVM + HHO0.670.63
XGBoost + PCA1.000.94
XGBoost + HHO1.000.89
Deep learningMLP + PCA0.980.89
MLP + HHO1.000.78
Disclaimer/Publisher’s Note: The statements, opinions and data contained in all publications are solely those of the individual author(s) and contributor(s) and not of MDPI and/or the editor(s). MDPI and/or the editor(s) disclaim responsibility for any injury to people or property resulting from any ideas, methods, instructions or products referred to in the content.

