
Does Farmers’ Lottery Participation Affect Technical Efficiency of Banana Production in Rural China?

Abstract
:1. Introduction
2. Estimation Strategy
2.1. DEA-CCR Model
2.2. The Endogenous Switching Regression Model
2.3. The Quantile Regression Model
2.4. Mediation Model
3. Data Description
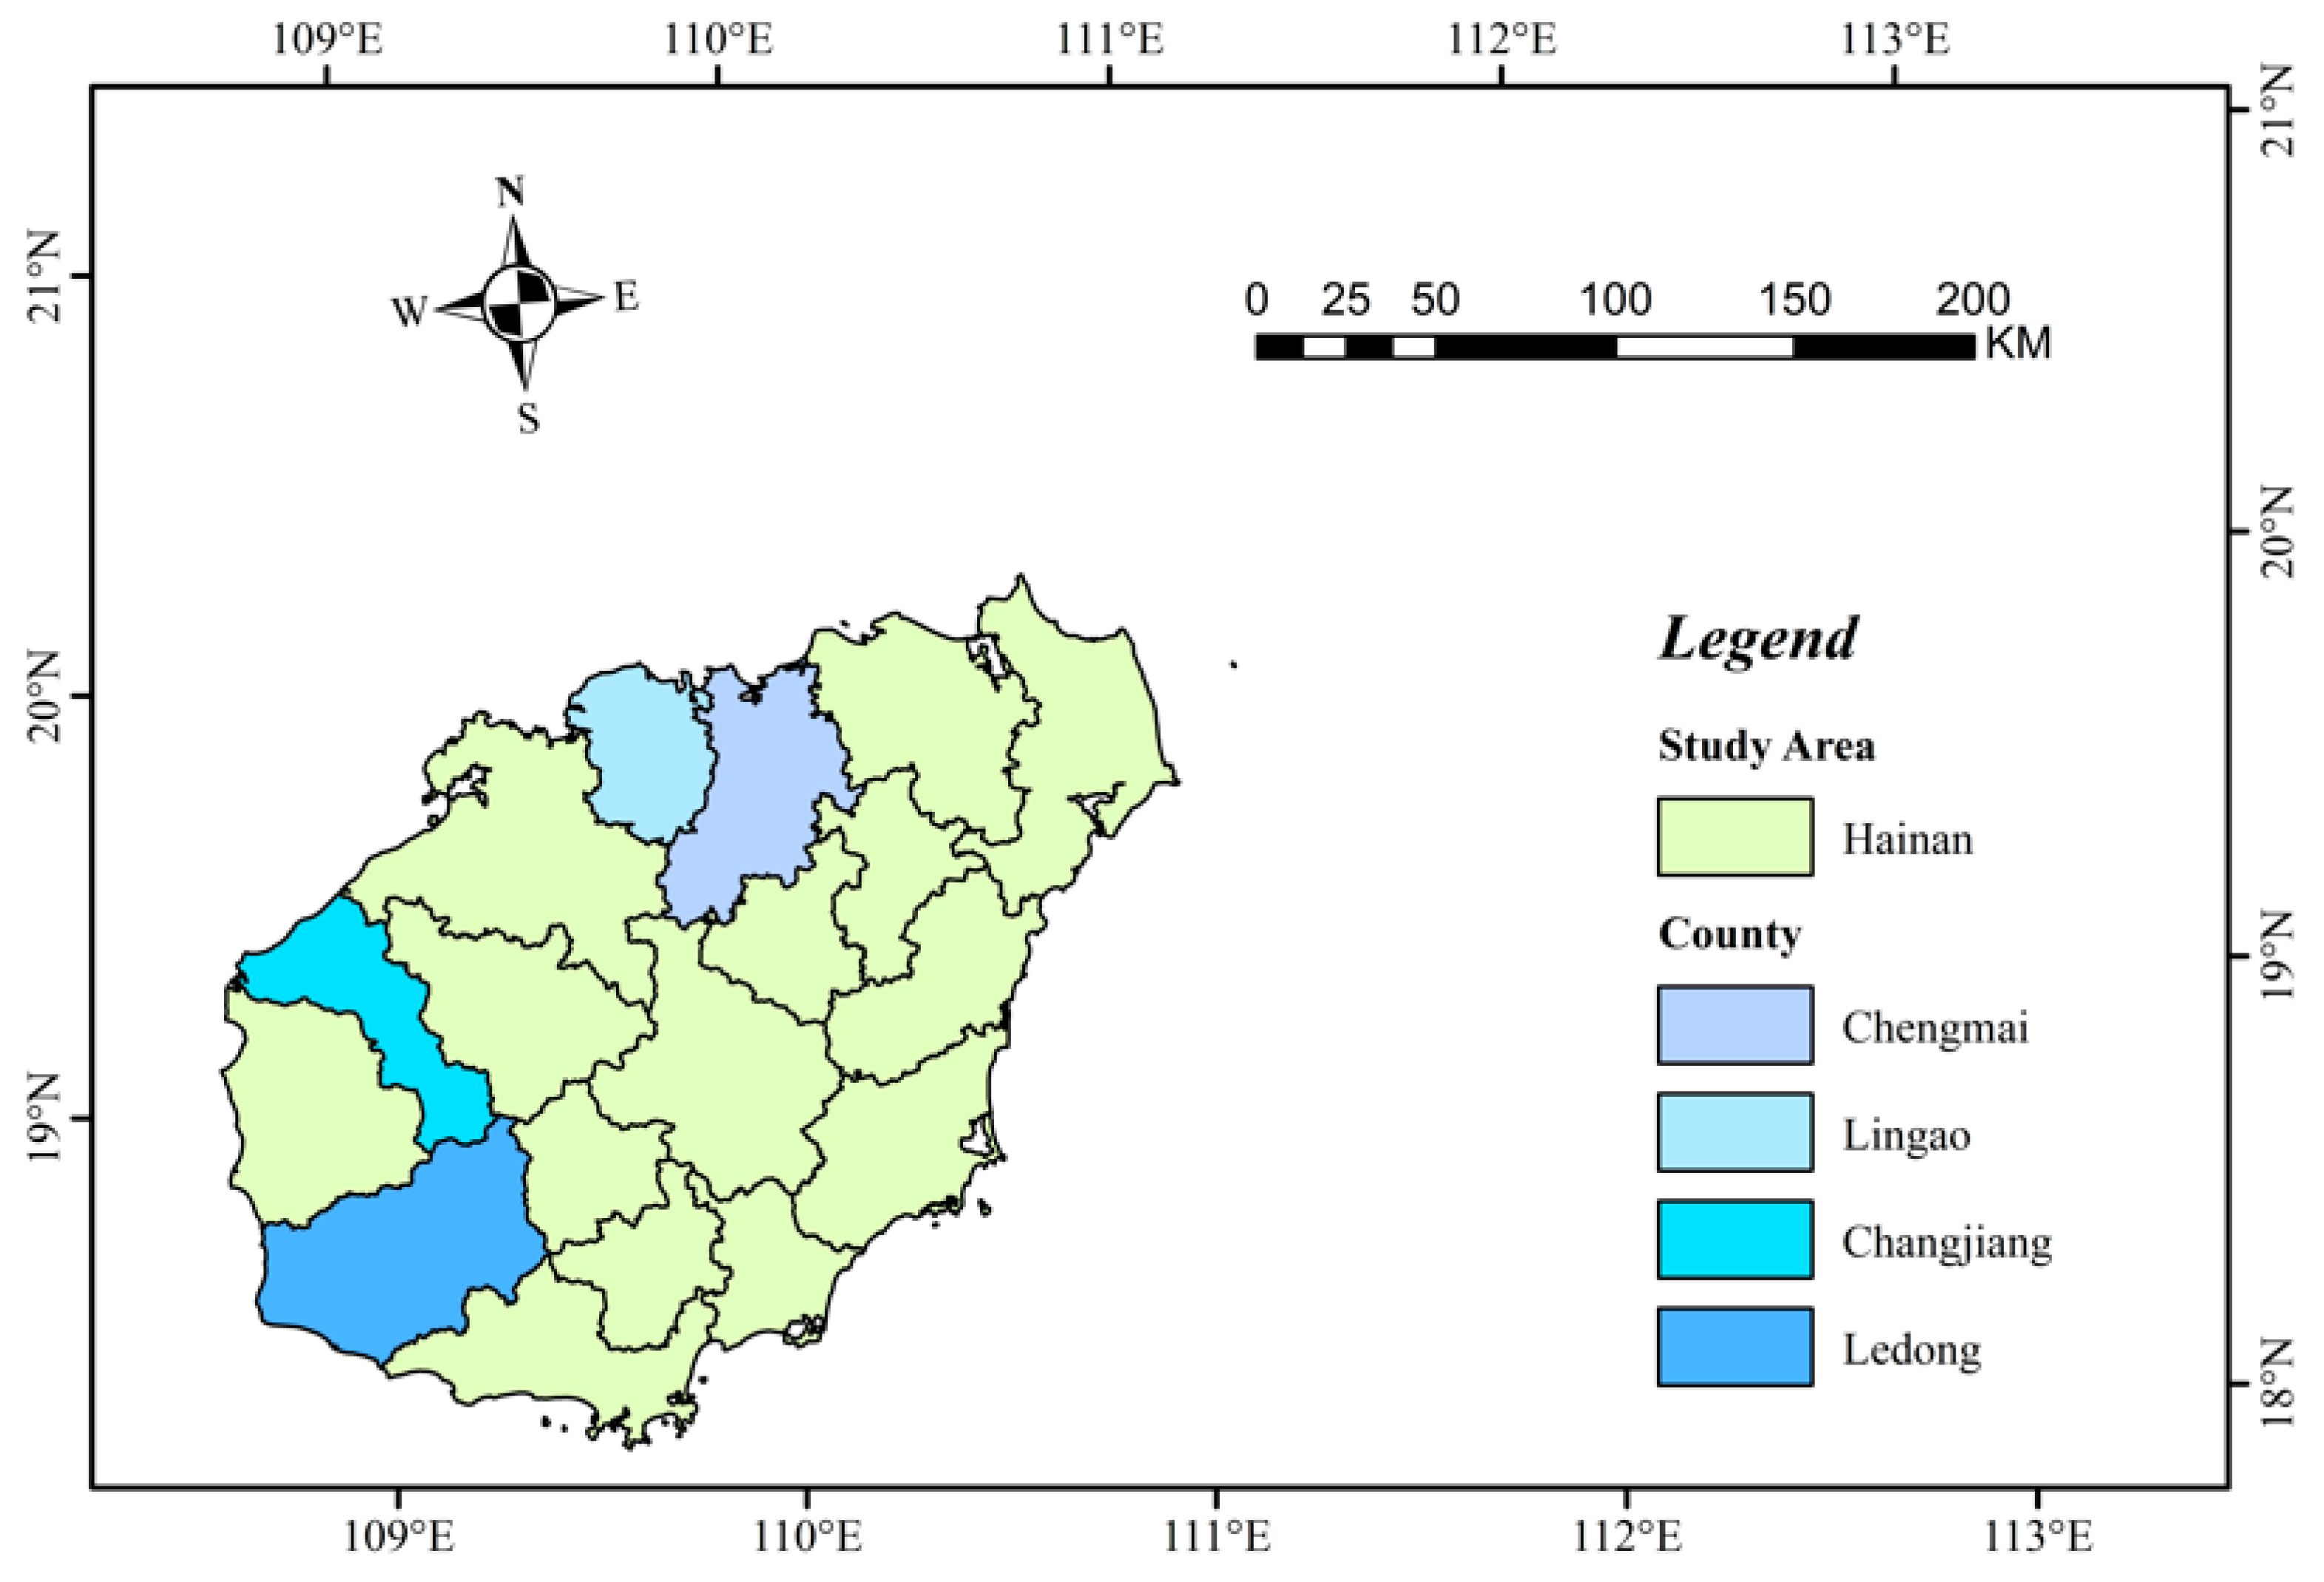
3.1. Study Area and Data Collection
3.2. Descriptive Statistics
3.2.1. Variables and Measurement
3.2.2. Comparison between Participants and Non-Participants
4. Results and Discussion
4.1. Impact of Farmers’ Lottery Participation on Technical Efficiency
4.2. Average Treatment Effect of Farmers’ Lottery Participation on Technical Efficiency
4.3. Heterogeneous Analysis
4.4. Analysis of Mediating Factors
5. Conclusions and Policy Implications
Author Contributions
Funding
Institutional Review Board Statement
Data Availability Statement
Conflicts of Interest
References
- Wongnaa, C.A.; Awunyo-Vitor, D.; Mensah, A.; Adams, F. Profit efficiency among maize farmers and implications for poverty alleviation and food security in Ghana. Sci. Afr. 2019, 6, e206. [Google Scholar] [CrossRef]
- Ivanic, M.; Martin, W. Sectoral Productivity Growth and Poverty Reduction: National and Global Impacts. World Dev. 2018, 109, 429–439. [Google Scholar] [CrossRef]
- Mellor, J.W.; Malik, S.J. The Impact of Growth in Small Commercial Farm Productivity on Rural Poverty Reduction. World Dev. 2017, 91, 1–10. [Google Scholar] [CrossRef]
- Christiaensen, L.; Martin, W. Agriculture, structural transformation and poverty reduction: Eight new insights. World Dev. 2018, 109, 413–416. [Google Scholar] [CrossRef]
- Wang, J.; Zhang, Z.; Liu, Y. Spatial shifts in grain production increases in China and implications for food security. Land Use Policy 2018, 74, 204–213. [Google Scholar] [CrossRef]
- Ma, W.; Renwick, A.; Yuan, P.; Ratna, N. Agricultural cooperative membership and technical efficiency of apple farmers in China: An analysis accounting for selectivity bias. Food Policy 2018, 81, 122–132. [Google Scholar] [CrossRef]
- Hao, J.; Bijman, J.; Gardebroek, C.; Heerink, N.; Heijman, W.; Huo, X. Cooperative membership and farmers’ choice of marketing channels—Evidence from apple farmers in Shaanxi and Shandong Provinces, China. Food Policy 2018, 74, 53–64. [Google Scholar] [CrossRef]
- Michalek, J.; Ciaian, P.; Pokrivcak, J. The impact of producer organizations on farm performance: The case study of large farms from Slovakia☆. Food Policy 2018, 75, 80–92. [Google Scholar] [CrossRef]
- Schultz, T.W. Transforming Traditional Agriculture: Reply. Am. J. Agric. Econ. 1966, 48, 1015–1018. [Google Scholar] [CrossRef]
- Zhou, Y.; Guo, L.; Liu, Y. Land consolidation boosting poverty alleviation in China: Theory and practice. Land Use Policy 2019, 82, 339–348. [Google Scholar] [CrossRef]
- Liu, J.; Jin, X.; Xu, W.; Sun, R.; Han, B.; Yang, X.; Gu, Z.; Xu, C.; Sui, X.; Zhou, Y. Influential factors and classification of cultivated land fragmentation, and implications for future land consolidation: A case study of Jiangsu Province in eastern China. Land Use Policy 2019, 88, 104185. [Google Scholar] [CrossRef]
- Akalu, T.; Jan, G.; Coen, R.; Menale, K. Farmers’ Perceptions about the Influence of Land Quality, Land Fragmentation and Tenure Systems onSustainable Land Management in the North Western Ethiopian Highlands. Land Degrad. Dev. 2016, 27, 884–898. [Google Scholar]
- Holden, S.T.; Otsuka, K. The roles of land tenure reforms and land markets in the context of population growth and land use intensification in Africa. Food Policy 2014, 48, 88–97. [Google Scholar] [CrossRef] [Green Version]
- Gao, Y.; Zhao, D.; Yu, L.; Yang, H. Influence of a new agricultural technology extension mode on farmers’ technology adoption behavior in China. J. Rural Stud. 2020, 76, 173–183. [Google Scholar] [CrossRef]
- Fanglei, Z.; Lili, L.; Aijun, G.; Xiaoyu, S.; Qingping, C.; Yongnian, Z.; Xiaojiang, D. Quantifying the Influence Path of Water Conservation Awareness on Water-Saving Irrigation Behavior Based on the Theory of Planned Behavior and Structural Equation Modeling: A Case Study from Northwest China. Sustainability 2019, 11, 4967. [Google Scholar]
- Li, Z.; Deng, X.; Zhang, Y. Evaluation and convergence analysis of socio-economic vulnerability to natural hazards of Belt and Road Initiative countries. J. Clean. Prod. 2021, 282, 125406. [Google Scholar] [CrossRef]
- Klomp, J.; Hoogezand, B. Natural disasters and agricultural protection: A panel data analysis. World Dev. 2018, 104, 404–417. [Google Scholar] [CrossRef]
- Zhang, L.; Ruiz-Menjivar, J.; Luo, B.; Liang, Z.; Swisher, M.E. Predicting climate change mitigation and adaptation behaviors in agricultural production: A comparison of the theory of planned behavior and the Value-Belief-Norm Theory. J. Environ. Psychol. 2020, 68, 101408. [Google Scholar] [CrossRef]
- Senger, I.; Borges, J.A.R.; Machado, J.A.D. Using the theory of planned behavior to understand the intention of small farmers in diversifying their agricultural production. J. Rural Stud. 2017, 49, 32–40. [Google Scholar] [CrossRef]
- Zhu, Y.; Yang, Q.; Zhang, C. Adaptation strategies and land productivity of banana farmers under climate change in China. Clim. Risk Manag. 2021, 34, 100368. [Google Scholar] [CrossRef]
- Wu, M.; Zhu, Y.; Yang, Q. Diversification or specialisation? Farmers’ cropping strategy and economic performance under climate change in China. Int. J. Clim. Chang. Strateg. Manag. 2021, 14, 20–38. [Google Scholar] [CrossRef]
- Shah, H.; Siderius, C.; Hellegers, P. Cost and effectiveness of in-season strategies for coping with weather variability in Pakistan’s agriculture. Agric. Syst. 2020, 178, 102746. [Google Scholar] [CrossRef]
- Iyer, P.; Bozzola, M.; Hirsch, S.; Meraner, M.; Finger, R. Measuring Farmer Risk Preferences in Europe: A Systematic Review. J. Agric. Econ. 2020, 71, 3–26. [Google Scholar] [CrossRef] [Green Version]
- Mao, H.; Zhou, L.; Ifft, J.; Ying, R. Risk preferences, production contracts and technology adoption by broiler farmers in China. China Econ. Rev. 2019, 54, 147–159. [Google Scholar] [CrossRef]
- Mishra, A.K.; Kumar, A.; Joshi, P.K.; D’Souza, A. Production Risks, Risk Preference and Contract Farming: Impact on Food Security in India. Appl. Econ. Perspect. Policy 2018, 40, 353–378. [Google Scholar] [CrossRef]
- Kangogo, D.; Dentoni, D.; Bijman, J. Adoption of climate-smart agriculture among smallholder farmers: Does farmer entrepreneurship matter? Land Use Policy 2021, 109, 105666. [Google Scholar] [CrossRef]
- Zhang, L.; Li, X.; Yu, J.; Yao, X. Toward cleaner production: What drives farmers to adopt eco-friendly agricultural production? J. Clean. Prod. 2018, 184, 550–558. [Google Scholar] [CrossRef]
- Wang, Y.; Zhu, Y.; Zhang, S.; Wang, Y. What could promote farmers to replace chemical fertilizers with organic fertilizers? J. Clean. Prod. 2018, 199, 882–890. [Google Scholar] [CrossRef]
- Pan, D.; He, M.; Kong, F. Risk attitude, risk perception, and farmers’ pesticide application behavior in China: A moderation and mediation model. J. Clean. Prod. 2020, 276, 124241. [Google Scholar] [CrossRef]
- Dohmen, T.; Falk, A.; Huffman, D.; Sunde, U.; Schupp, J.; Wagner, G.G. Individual Risk Attitudes: Measurement, Determinants, and Behavioral Consequences. J. Eur. Econ. Assoc. 2011, 9, 522–550. [Google Scholar] [CrossRef] [Green Version]
- Kassas, B.; Palma, M.A.; Porter, M. Happy to take some risk: Estimating the effect of induced emotions on risk preferences. J. Econ. Psychol. 2022, 91, 102527. [Google Scholar] [CrossRef]
- Arslan, R.C.; Brümmer, M.; Dohmen, T.; Drewelies, J.; Hertwig, R.; Wagner, G.G. How people know their risk preference. Sci. Rep. 2020, 10, 15365. [Google Scholar] [CrossRef] [PubMed]
- Arata, L.; Donati, M.; Sckokai, P.; Arfini, F. Incorporating risk in a positive mathematical programming framework: A dual approach. Aust. J. Agric. Resour. Econ. 2017, 61, 265–284. [Google Scholar] [CrossRef] [Green Version]
- Yang, R.; Chen, T.; Chen, Q. The impact of lotteries on cooperation in the public goods game. Phys. A Stat. Mech. Its Appl. 2018, 512, 925–934. [Google Scholar] [CrossRef]
- Wärneryd, K. Risk attitudes and risky behavior. J. Econ. Psychol. 1996, 17, 749–770. [Google Scholar] [CrossRef]
- Binswanger, H.P. Attitudes Toward Risk: Experimental Measurement in Rural India. Am. J. Agric. Econ. 1980, 62, 395–407. [Google Scholar] [CrossRef] [Green Version]
- Lutter, M.; Tisch, D.; Beckert, J. Social Explanations of Lottery Play: New Evidence Based on National Survey Data. J. Gamb. Stud. 2018, 34, 1185–1203. [Google Scholar] [CrossRef] [PubMed] [Green Version]
- Gustavo, C.M.; Eric, W.L.; Sarah, A.R.; Ana, Y.; Mirella, M.; Hermano, T.; Jon, E.G. A cross-cultural study of gambling disorder: A comparison between women from Brazil and the United States. Rev. Bras. Psiquiatr. 2016, 38, 53–57. [Google Scholar]
- Charnes, A.; Cooper, W.W.; Rhodes, E. Measuring the efficiency of decision making units. Eur. J. Oper. Res. 1978, 2, 429–444. [Google Scholar] [CrossRef]
- Tone, K. A slacks-based measure of efficiency in data envelopment analysis. Eur. J. Oper. Res. 2001, 130, 498–509. [Google Scholar] [CrossRef] [Green Version]
- Streimikis, J.; Miao, Z.; Balezentis, T. Creation of climate-smart and energy-efficient agriculture in the European Union: Pathways based on the frontier analysis. Bus. Strateg. Env. 2021, 30, 576–589. [Google Scholar] [CrossRef]
- Ayerst, S.; Brandt, L.; Restuccia, D. Market constraints, misallocation, and productivity in Vietnam agriculture. Food Policy 2020, 94, 101840. [Google Scholar] [CrossRef] [Green Version]
- Baráth, L.; Fert, I.; Bojnec, T. The Effect of Investment, LFA and Agri-environmental Subsidies on the Components of Total Factor Productivity: The Case of Slovenian Farms. J. Agric. Econ. 2020, 71, 853–876. [Google Scholar] [CrossRef]
- Ma, W.; Abdulai, A. IPM adoption, cooperative membership and farm economic performance: Insight from apple farmers in China. China Agric. Econ. Rev. 2019, 11, 218–236. [Google Scholar] [CrossRef]
- Teklewold, H.; Kassie, M.; Shiferaw, B.; Köhlin, G. Cropping system diversification, conservation tillage and modern seed adoption in Ethiopia: Impacts on household income, agrochemical use and demand for labor. Ecol. Econ. 2013, 93, 85–93. [Google Scholar] [CrossRef]
- Lee, L. Unionism and Wage Rates: A Simultaneous Equations Model with Qualitative and Limited Dependent Variables. Int. Econ. Rev. 1978, 19, 415–433. [Google Scholar] [CrossRef]
- Michael, L.; Zurab, S. Maximum Likelihood Estimation of Endogenous Switching Regression Models. Stata J. 2004, 4, 282–289. [Google Scholar]
- Koenker, R.; Bassett, J.G. Regression Quantiles. Econom. J. Econom. Soc. 1978, 46, 33–50. [Google Scholar] [CrossRef]
- Xu, B.; Lin, B. Investigating the differences in CO2 emissions in the transport sector across Chinese provinces: Evidence from a quantile regression model. J. Clean Prod. 2018, 175, 109–122. [Google Scholar] [CrossRef]
- Yang, Q.; Zhu, Y.; Wang, F. Social Media Participation, Low-Carbon Agricultural Practices, and Economic Performance of Banana Farmers in Southern China. Front. Psychol. 2021, 12, 790808. [Google Scholar] [CrossRef]
- Brian, S.C.; Barry, R.N. A Gentle Introduction to Quantile Regression for Ecologists. Front. Ecol. Env. 2003, 1, 412–420. [Google Scholar]
- Baron, R.M.; Kenny, D.A. The moderator–mediator variable distinction in social psychological research: Conceptual, strategic, and statistical considerations. J. Personal. Soc. Psychol. 1986, 51, 1173. [Google Scholar] [CrossRef] [PubMed]
- Haihong, X.; Yanmin, L.; Caiyou, Z. Prediction models of sports lottery revenue in China. Int. J. Electr. Eng. Educ. 2020, 0020720920940589. [Google Scholar] [CrossRef]
- Yang, Q.; Zhu, Y.; Liu, L.; Wang, F. Land tenure stability and adoption intensity of sustainable agricultural practices in banana production in China. J. Clean Prod. 2022, 338, 130553. [Google Scholar] [CrossRef]
- Ma, W.; Zheng, H.; Zhu, Y.; Qi, J. Effects of cooperative membership on financial performance of banana farmers in China: A heterogeneous analysis. Ann. Public Coop. Econ. 2022, 93, 5–27. [Google Scholar] [CrossRef]
- Ayuya, O.I.; Gido, E.O.; Bett, H.K.; Lagat, J.K.; Kahi, A.K.; Bauer, S. Effect of Certified Organic Production Systems on Poverty among Smallholder Farmers: Empirical Evidence from Kenya. World Dev. 2015, 67, 27–37. [Google Scholar] [CrossRef]
- Wooldridge, J.M. Control Function Methods in Applied Econometrics. J. Hum. Resour. 2015, 50, 420–445. [Google Scholar] [CrossRef]
- Vergura, D.T.; Luceri, B. The antecedents of gambling behaviour from a social marketing perspective. J. Gambl. Bus. Econ. 2015, 9, 1–12. [Google Scholar] [CrossRef]
- Törrönen, J.; Samuelsson, E.; Gunnarsson, M. Online gambling venues as relational actors in addiction: Applying the actor-network approach to life stories of online gamblers. Int. J. Drug Policy 2020, 85, 102928. [Google Scholar] [CrossRef]
- Emond, A.M.; Griffiths, M.D. Gambling in children and adolescents. Br. Med. Bull 2020, 136, 21–29. [Google Scholar] [CrossRef]
- Picchio, M.; Suetens, S.; van Ours, J.C. Labour Supply Effects of Winning a Lottery. Econ. J. 2018, 128, 1700–1729. [Google Scholar] [CrossRef]
- Qing, Y.; Moyu, C.; Yu, S.; Jikun, H. Mechanization services, farm productivity and institutional innovation in China. China Agric. Econ. Rev. 2019, 11, 536–554. [Google Scholar] [CrossRef]
- Min, S.; Liu, M.; Huang, J. Does the application of ICTs facilitate rural economic transformation in China? Empirical evidence from the use of smartphones among farmers. J. Asian Econ. 2020, 70, 101219. [Google Scholar] [CrossRef]
- Quandt, A.; Salerno, J.D.; Neff, J.C.; Baird, T.D.; Herrick, J.E.; Mccabe, J.T.; Xu, E.; Hartter, J. Mobile phone use is associated with higher smallholder agricultural productivity in Tanzania, East Africa. PLoS ONE 2020, 15, e237337. [Google Scholar] [CrossRef] [PubMed]
- Huang, Y.; Luo, X.; Tang, L.; Yu, W. The power of habit: Does production experience lead to pesticide overuse? Environ. Sci. Pollut. Res. 2020, 27, 25287–25296. [Google Scholar] [CrossRef]
- Lloret, E.; Pascual, J.A.; Brodie, E.L.; Bouskill, N.J.; Insam, H.; Juárez, M.F.; Goberna, M. Sewage sludge addition modifies soil microbial communities and plant performance depending on the sludge stabilization process. Appl. Soil Ecol. 2016, 101, 37–46. [Google Scholar] [CrossRef] [Green Version]
- Sapbamrer, R.; Thammachai, A. A Systematic Review of Factors Influencing Farmers’ Adoption of Organic Farming. Sustainability 2021, 13, 3842. [Google Scholar] [CrossRef]
- Agarwal, B. Can group farms outperform individual family farms? Empirical insights from India. World Dev. 2018, 108, 57–73. [Google Scholar] [CrossRef]
- Elahi, E.; Khalid, Z.; Weijun, C.; Zhang, H. The public policy of agricultural land allotment to agrarians and its impact on crop productivity in Punjab province of Pakistan. Land Use Policy 2020, 90, 104324. [Google Scholar] [CrossRef]
- Sheng, Y.; Ding, J.; Huang, J. The Relationship between Farm Size and Productivity in Agriculture: Evidence from Maize Production in Northern China. Am. J. Agric. Econ. 2019, 101, 790–806. [Google Scholar] [CrossRef]
- Ji, L.; Zhang, B.; Huang, G.; Lu, Y. Multi-stage stochastic fuzzy random programming for food-water-energy nexus management under uncertainties. Resour. Conserv. Recycl. 2020, 155, 104665. [Google Scholar] [CrossRef]
- Constantine, K.L.; Kansiime, M.K.; Mugambi, I.; Nunda, W.; Chacha, D.; Rware, H.; Makale, F.; Mulema, J.; Lamontagne-Godwin, J.; Williams, F.; et al. Why don’t smallholder farmers in Kenya use more biopesticides? Pest Manag. Sci. 2020, 76, 3615–3625. [Google Scholar] [CrossRef] [PubMed]
- Fred, G.; Zachary, S.B.; Jennifer, K. Wicked evolution: Can we address the sociobiological dilemma of pesticide resistance? Science 2018, 360, 728–732. [Google Scholar]
- Srinivasan, R.; Sevgan, S.; Ekesi, S.; Tamò, M. Biopesticide based sustainable pest management for safer production of vegetable legumes and brassicas in Asia and Africa. Pest Manag. Sci. 2019, 75, 2446–2454. [Google Scholar] [CrossRef] [PubMed]


| Indicator | Variables | Description of Indicators (Units) |
|---|---|---|
| Output | Banana production | Total banana production in 2020 (Kg) |
| Input | Land | Area of bananas grown in 2020 (Mu a) |
| Capital | Farmers’ expenditure on seedlings, machinery, irrigation, hired labour (CNY) | |
| Labour | Number of household labours multiplied by the actual number of working days in the farm (Days) | |
| Intermediate input | Farmers’ expenditure on pesticides, fertilisers and other inputs (CNY) |
| County | Town | Observations | Percentage (%) |
|---|---|---|---|
| Chengmai | Dafeng, Jinjiang | 100 | 23.70 |
| Lingao | Huangtong, Dongying, Diaolou, Lincheng | 101 | 23.93 |
| Changjiang | Changhua, Shiyuetian, Shilu | 105 | 24.88 |
| Ledong | Liguo, Huangliu | 116 | 27.49 |
| Variables | Definition | Mean | Std. Dev. |
|---|---|---|---|
| Explained variable | |||
| Technical efficiency | Actual values obtained from measurements using the DEA model | 0.546 | 0.254 |
| Explanatory variable | |||
| Lottery participation | Have you participated in the lottery in the last year? 1 = yes, 0 = otherwise | 0.590 | 0.492 |
| Control variables | |||
| Age | Farmers’ age (years) | 47.137 | 11.039 |
| Gender | 1 = male, 0 = female | 0.730 | 0.445 |
| Education | Farmer’s education level (years) | 8.422 | 3.209 |
| Farming experience | Experience in agriculture (years) | 24.806 | 12.521 |
| Health condition | Farmer’s health condition: 1 = very bad health, 5 = very good health | 3.637 | 1.098 |
| Working hours | Average daily working hours a day of the respondents | 9.314 | 2.550 |
| Family labour | Number of family members engaged in banana production | 2.602 | 1.281 |
| Loans | Does the household have a loan from the bank? 1 = Yes, 0 = No | 0.408 | 0.492 |
| Land area | cropping area in mu | 21.862 | 35.435 |
| Internet use | 1 = if farmer uses the WI-FI, 0 = otherwise | 0.711 | 0.454 |
| Smartphone | Do you use your smartphone to access agricultural information? 1 = yes, 0 = otherwise | 0.372 | 0.484 |
| Off-farm work | 1 = the farmer was engaged in off-farm work, 0 = otherwise | 0.467 | 0.500 |
| Cooperative member | 1 = cooperative member, 0 = otherwise | 0.078 | 0.269 |
| Tie to extension workers | Degree of contact with the extension workers? 1 = no contact, 5 = extremely close contact | 1.607 | 1.042 |
| Tie to agricultural retailers | Degree of contact with the agricultural retailers? 1 = no contact, 5 = extremely close contact | 3.700 | 1.091 |
| mediator variables | |||
| Biopesticides | Use of biopesticides? 1 = yes, 0 = otherwise | 0.393 | 0.489 |
| Soil improvement | Adopt soil improvement techniques? 1 = yes, 0 = otherwise | 0.685 | 0.465 |
| Instrumental variable | |||
| Attitude of family members | Attitude of family members towards participation in the lottery? 1 = against, 2 = neutral, 3 = support | 1.765 | 0.592 |
| Variables | Treated Group | Control Group | p-Value |
|---|---|---|---|
| Technical efficiency | 0.564 | 0.521 | 0.088 |
| Age | 46.811 | 47.607 | 0.467 |
| Gender | 0.775 | 0.665 | 0.012 |
| Education | 8.538 | 8.254 | 0.372 |
| Farming experience | 24.165 | 25.728 | 0.207 |
| Health condition | 3.683 | 3.572 | 0.310 |
| Working hours | 9.094 | 9.630 | 0.034 |
| Family labour | 2.538 | 2.694 | 0.221 |
| Loans | 0.394 | 0.428 | 0.483 |
| Land area | 20.879 | 23.277 | 0.495 |
| Internet use | 0.735 | 0.676 | 0.192 |
| Smartphone | 0.410 | 0.318 | 0.055 |
| Off-farm work | 0.486 | 0.439 | 0.346 |
| Cooperative member | 0.072 | 0.087 | 0.589 |
| Tie to extension workers | 1.618 | 1.590 | 0.780 |
| Tie to agricultural retailers | 3.618 | 3.815 | 0.069 |
| Biopesticides | 0.430 | 0.341 | 0.067 |
| Soil improvement | 0.695 | 0.671 | 0.599 |
| Observations | 249 | 173 |
| Category | Variables | Selection | Outcome: Technical Efficiency | |
|---|---|---|---|---|
| Lottery Participation | Treated Group | Control Group | ||
| Individual | Age | −0.004 (0.011) | 0.003 (0.003) | −0.006 ** (0.003) |
| Gender | 0.565 *** (0.161) | 0.032 (0.048) | 0.185 *** (0.050) | |
| Education | −0.017 (0.022) | 0.001 (0.006) | −0.013 ** (0.006) | |
| Farming experience | −0.002 (0.010) | −0.004 (0.003) | 0.004 (0.003) | |
| Health condition | −0.017 (0.064) | −0.010 (0.018) | 0.009 (0.017) | |
| Working hours | −0.052 ** (0.025) | 0.014 * (0.007) | 0.007 (0.008) | |
| Household | Family labour | −0.111 ** (0.051) | 0.011 (0.015) | 0.027 * (0.015) |
| Loans | −0.204 (0.133) | −0.004 (0.037) | −0.056 (0.036) | |
| Land area | 0.000 (0.002) | 0.001 * (0.001) | 0.001 *** (0.001) | |
| Internet use | 0.199 (0.141) | −0.089 ** (0.042) | 0.021 (0.040) | |
| Smartphone | 0.285 ** (0.145) | −0.076 * (0.039) | 0.012 (0.045) | |
| Social | Off-farm work | 0.046 (0.133) | 0.034 (0.037) | −0.042 (0.037) |
| Cooperative member | −0.117 (0.235) | 0.006 (0.068) | 0.093 (0.062) | |
| Tie to extension workers | 0.022 (0.063) | −0.014 (0.018) | 0.017 (0.017) | |
| Tie to agricultural retailers | −0.139 ** (0.062) | 0.051 *** (0.017) | −0.007 (0.020) | |
| IV | Attitudes of family members | 0.450 *** (0.105) | - | - |
| _cons | 0.600 (0.686) | 0.430 (0.176) | 0.509 (0.232) | |
| lnσ1 | - | −1.194 *** (0.086) | - | |
| ρ1 | - | −1.310 *** (0.314) | - | |
| lnσ0 | - | - | −1.511 *** (0.055) | |
| ρ0 | - | - | −0.049 (0.401) | |
| likelihood ratio test | 6.75 ** | |||
| Wald test | 57.46 *** | |||
| Observations | 422 | |||
| Technical Efficiency | Whether Lottery Participation | ATE | t-Value | Standard Errors | Change (%) | |
|---|---|---|---|---|---|---|
| Treated Group | Control Group | |||||
| 0.732 | 0.517 | 0.215 *** | 28.136 | 0.008 | 41.59 | |
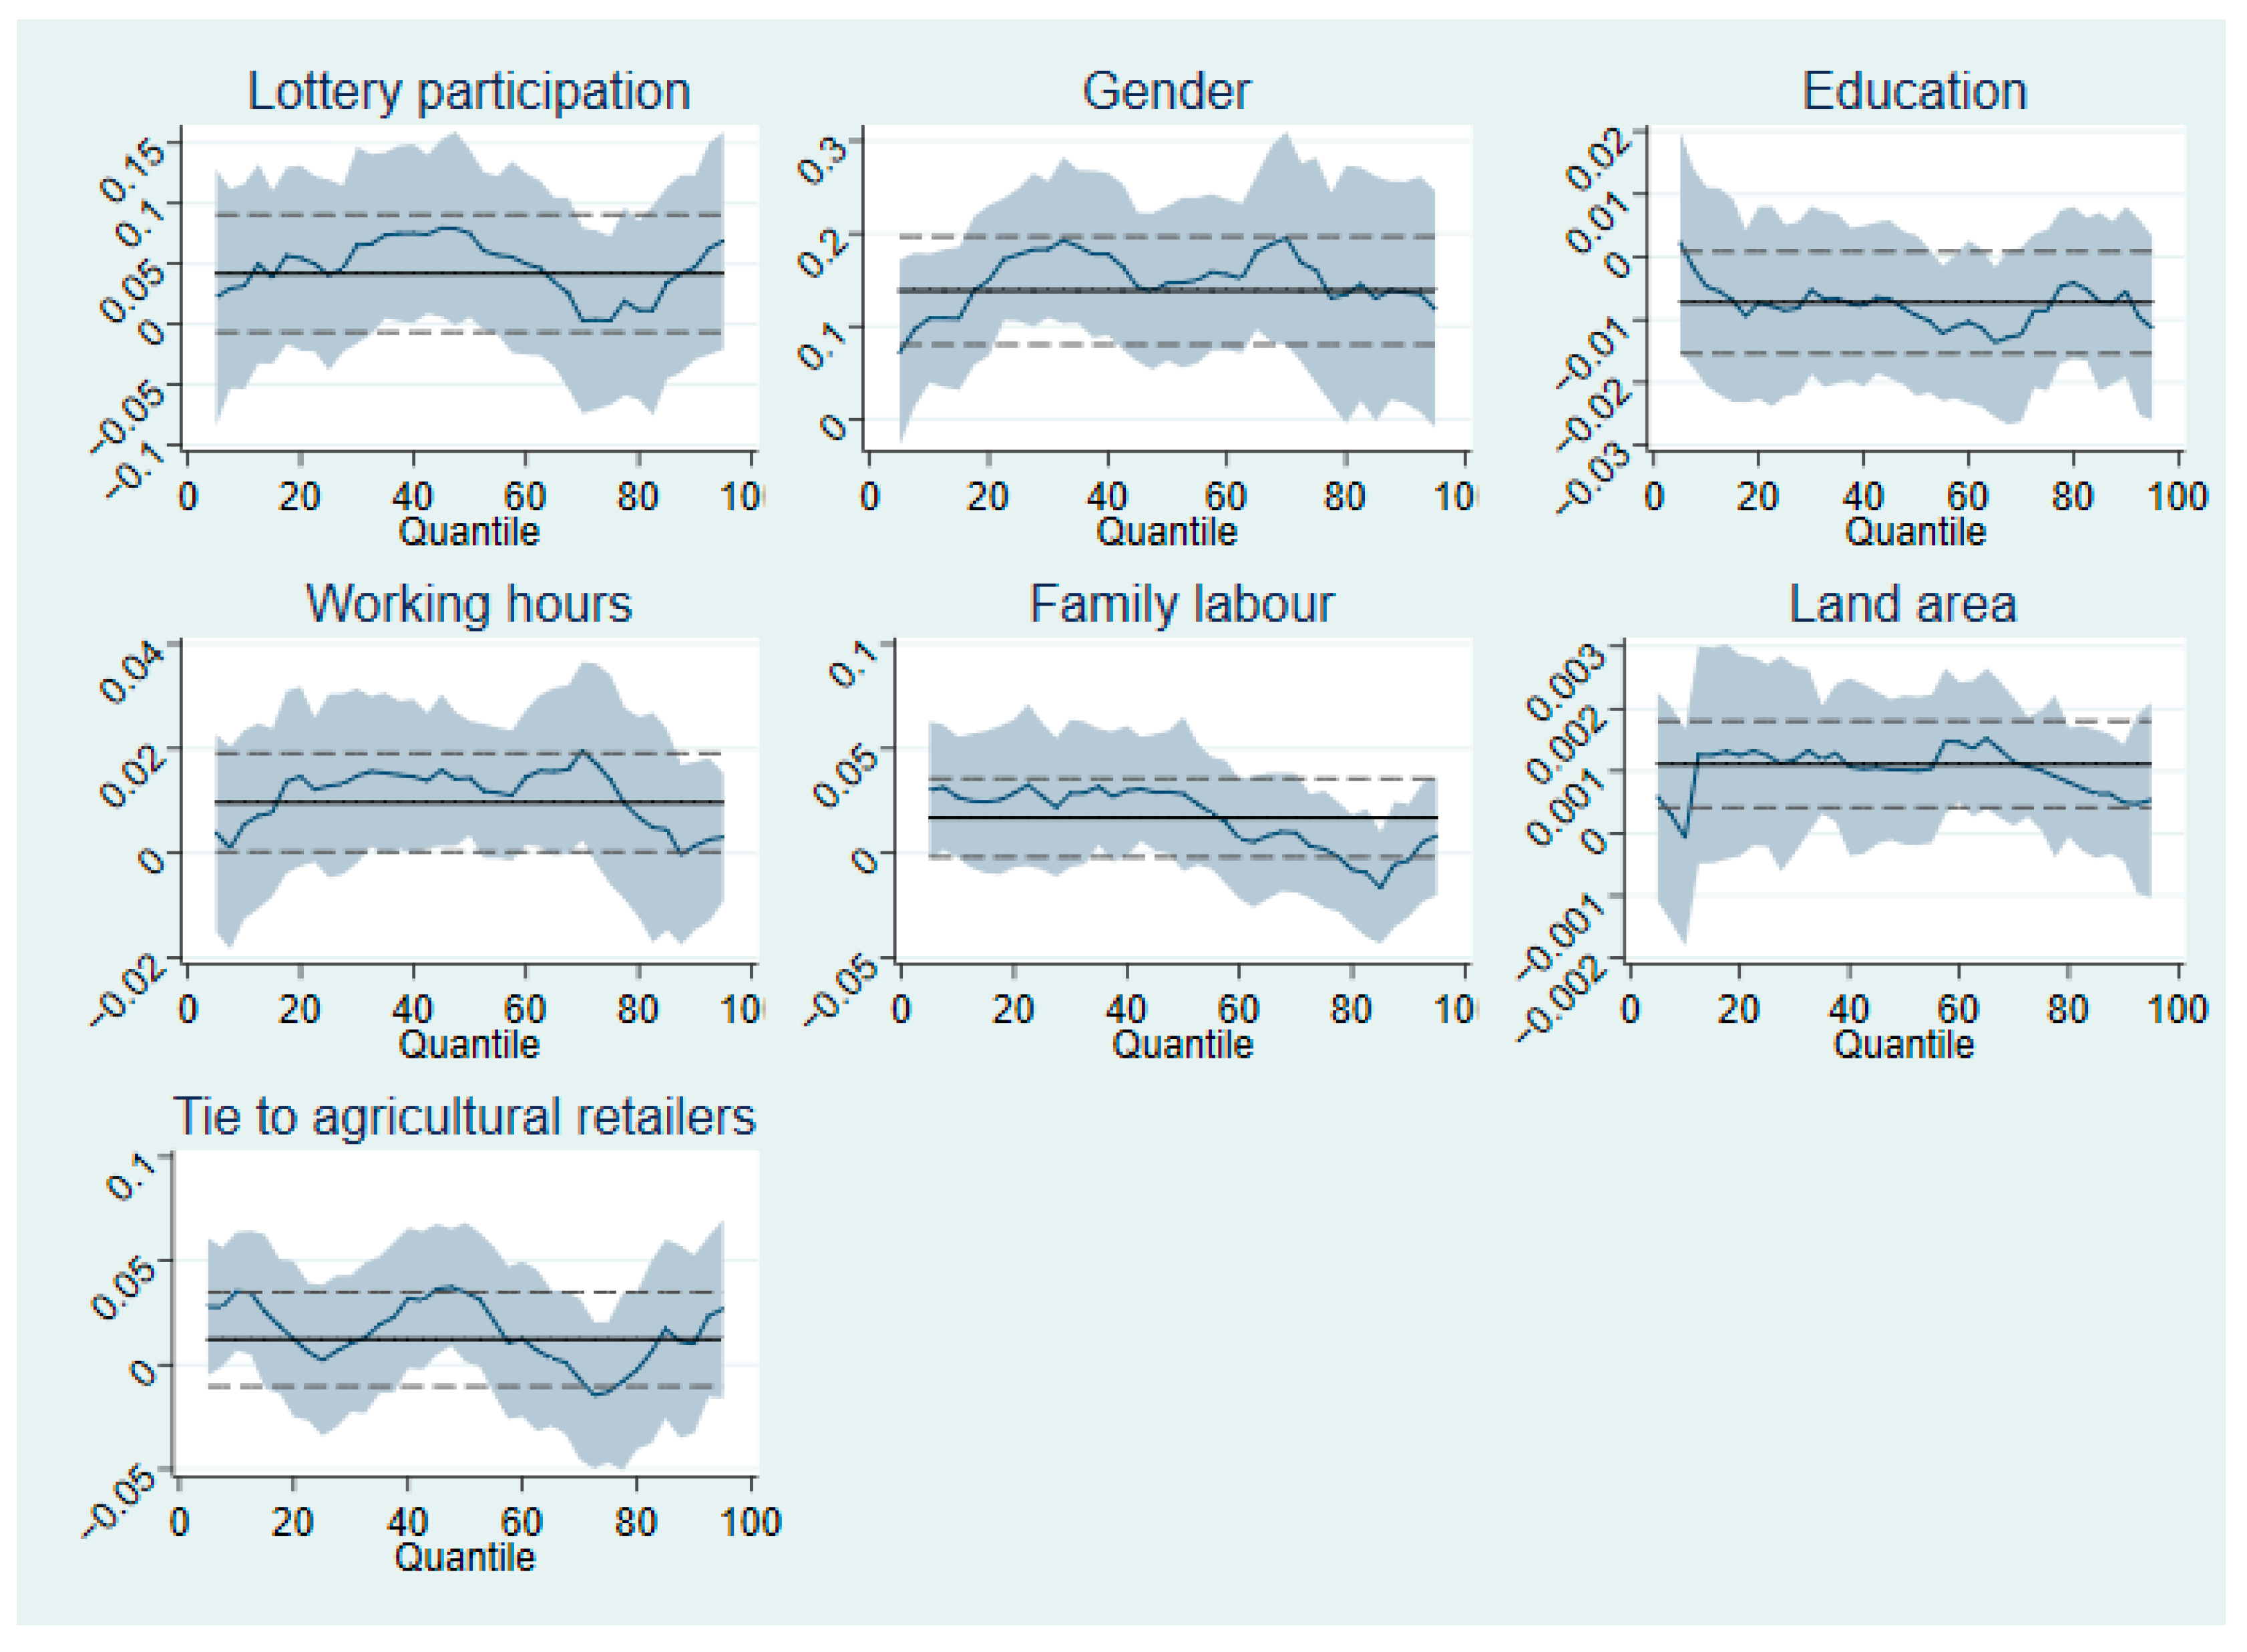
| Variables | 10th Quant | 30th Quant | 50th Quant | 70th Quant | 90th Quant |
|---|---|---|---|---|---|
| Lottery participation | 0.032 (0.046) | 0.066 * (0.040) | 0.075 ** (0.035) | 0.003 (0.039) | 0.047 (0.040) |
| Control variables | Controlled | ||||
| _cons | 0.203 (0.210) | −0.023 (0.222) | 0.157 (0.180) | 0.485 ** (0.198) | 0.951 *** (0.211) |
| Observations | 422 | ||||
| Path1 | Path2 | |||||
|---|---|---|---|---|---|---|
| (1) PE | (2) Biopesticides | (3) PE | (4) PE | (5) Soil Improvement | (6) PE | |
| Lottery participation | 0.042 * (0.025) | 0.094 * (0.047) | 0.033 (0.024) | 0.042 * (0.025) | 0.035 (0.046) | 0.040 * (0.025) |
| Biopesticides | 0.096 *** (0.026) | |||||
| Soil improvement | 0.053 ** (0.027) | |||||
| Control variables | Controlled | Controlled | ||||
Disclaimer/Publisher’s Note: The statements, opinions and data contained in all publications are solely those of the individual author(s) and contributor(s) and not of MDPI and/or the editor(s). MDPI and/or the editor(s) disclaim responsibility for any injury to people or property resulting from any ideas, methods, instructions or products referred to in the content. |
© 2023 by the authors. Licensee MDPI, Basel, Switzerland. This article is an open access article distributed under the terms and conditions of the Creative Commons Attribution (CC BY) license (https://creativecommons.org/licenses/by/4.0/).
Share and Cite
Wu, M.; Zhu, Y. Does Farmers’ Lottery Participation Affect Technical Efficiency of Banana Production in Rural China? Agriculture 2023, 13, 767. https://doi.org/10.3390/agriculture13040767
Wu M, Zhu Y. Does Farmers’ Lottery Participation Affect Technical Efficiency of Banana Production in Rural China? Agriculture. 2023; 13(4):767. https://doi.org/10.3390/agriculture13040767
Chicago/Turabian StyleWu, Mingze, and Yueji Zhu. 2023. "Does Farmers’ Lottery Participation Affect Technical Efficiency of Banana Production in Rural China?" Agriculture 13, no. 4: 767. https://doi.org/10.3390/agriculture13040767