
Honeybee (Apis spp.) (Hymenoptera: Apidae) Colony Monitoring Using Acoustic Signals from the Beehive: An Assessment by Global Experts and Our Feedback

Abstract
:1. Introduction
2. Materials and Methods
2.1. Designing and Distribution of the Questionnaire
2.2. Delineations of Scores
2.3. Compilation of Experts’ Remarks through a Rigorous Procedure
2.4. Data Analysis
3. Results
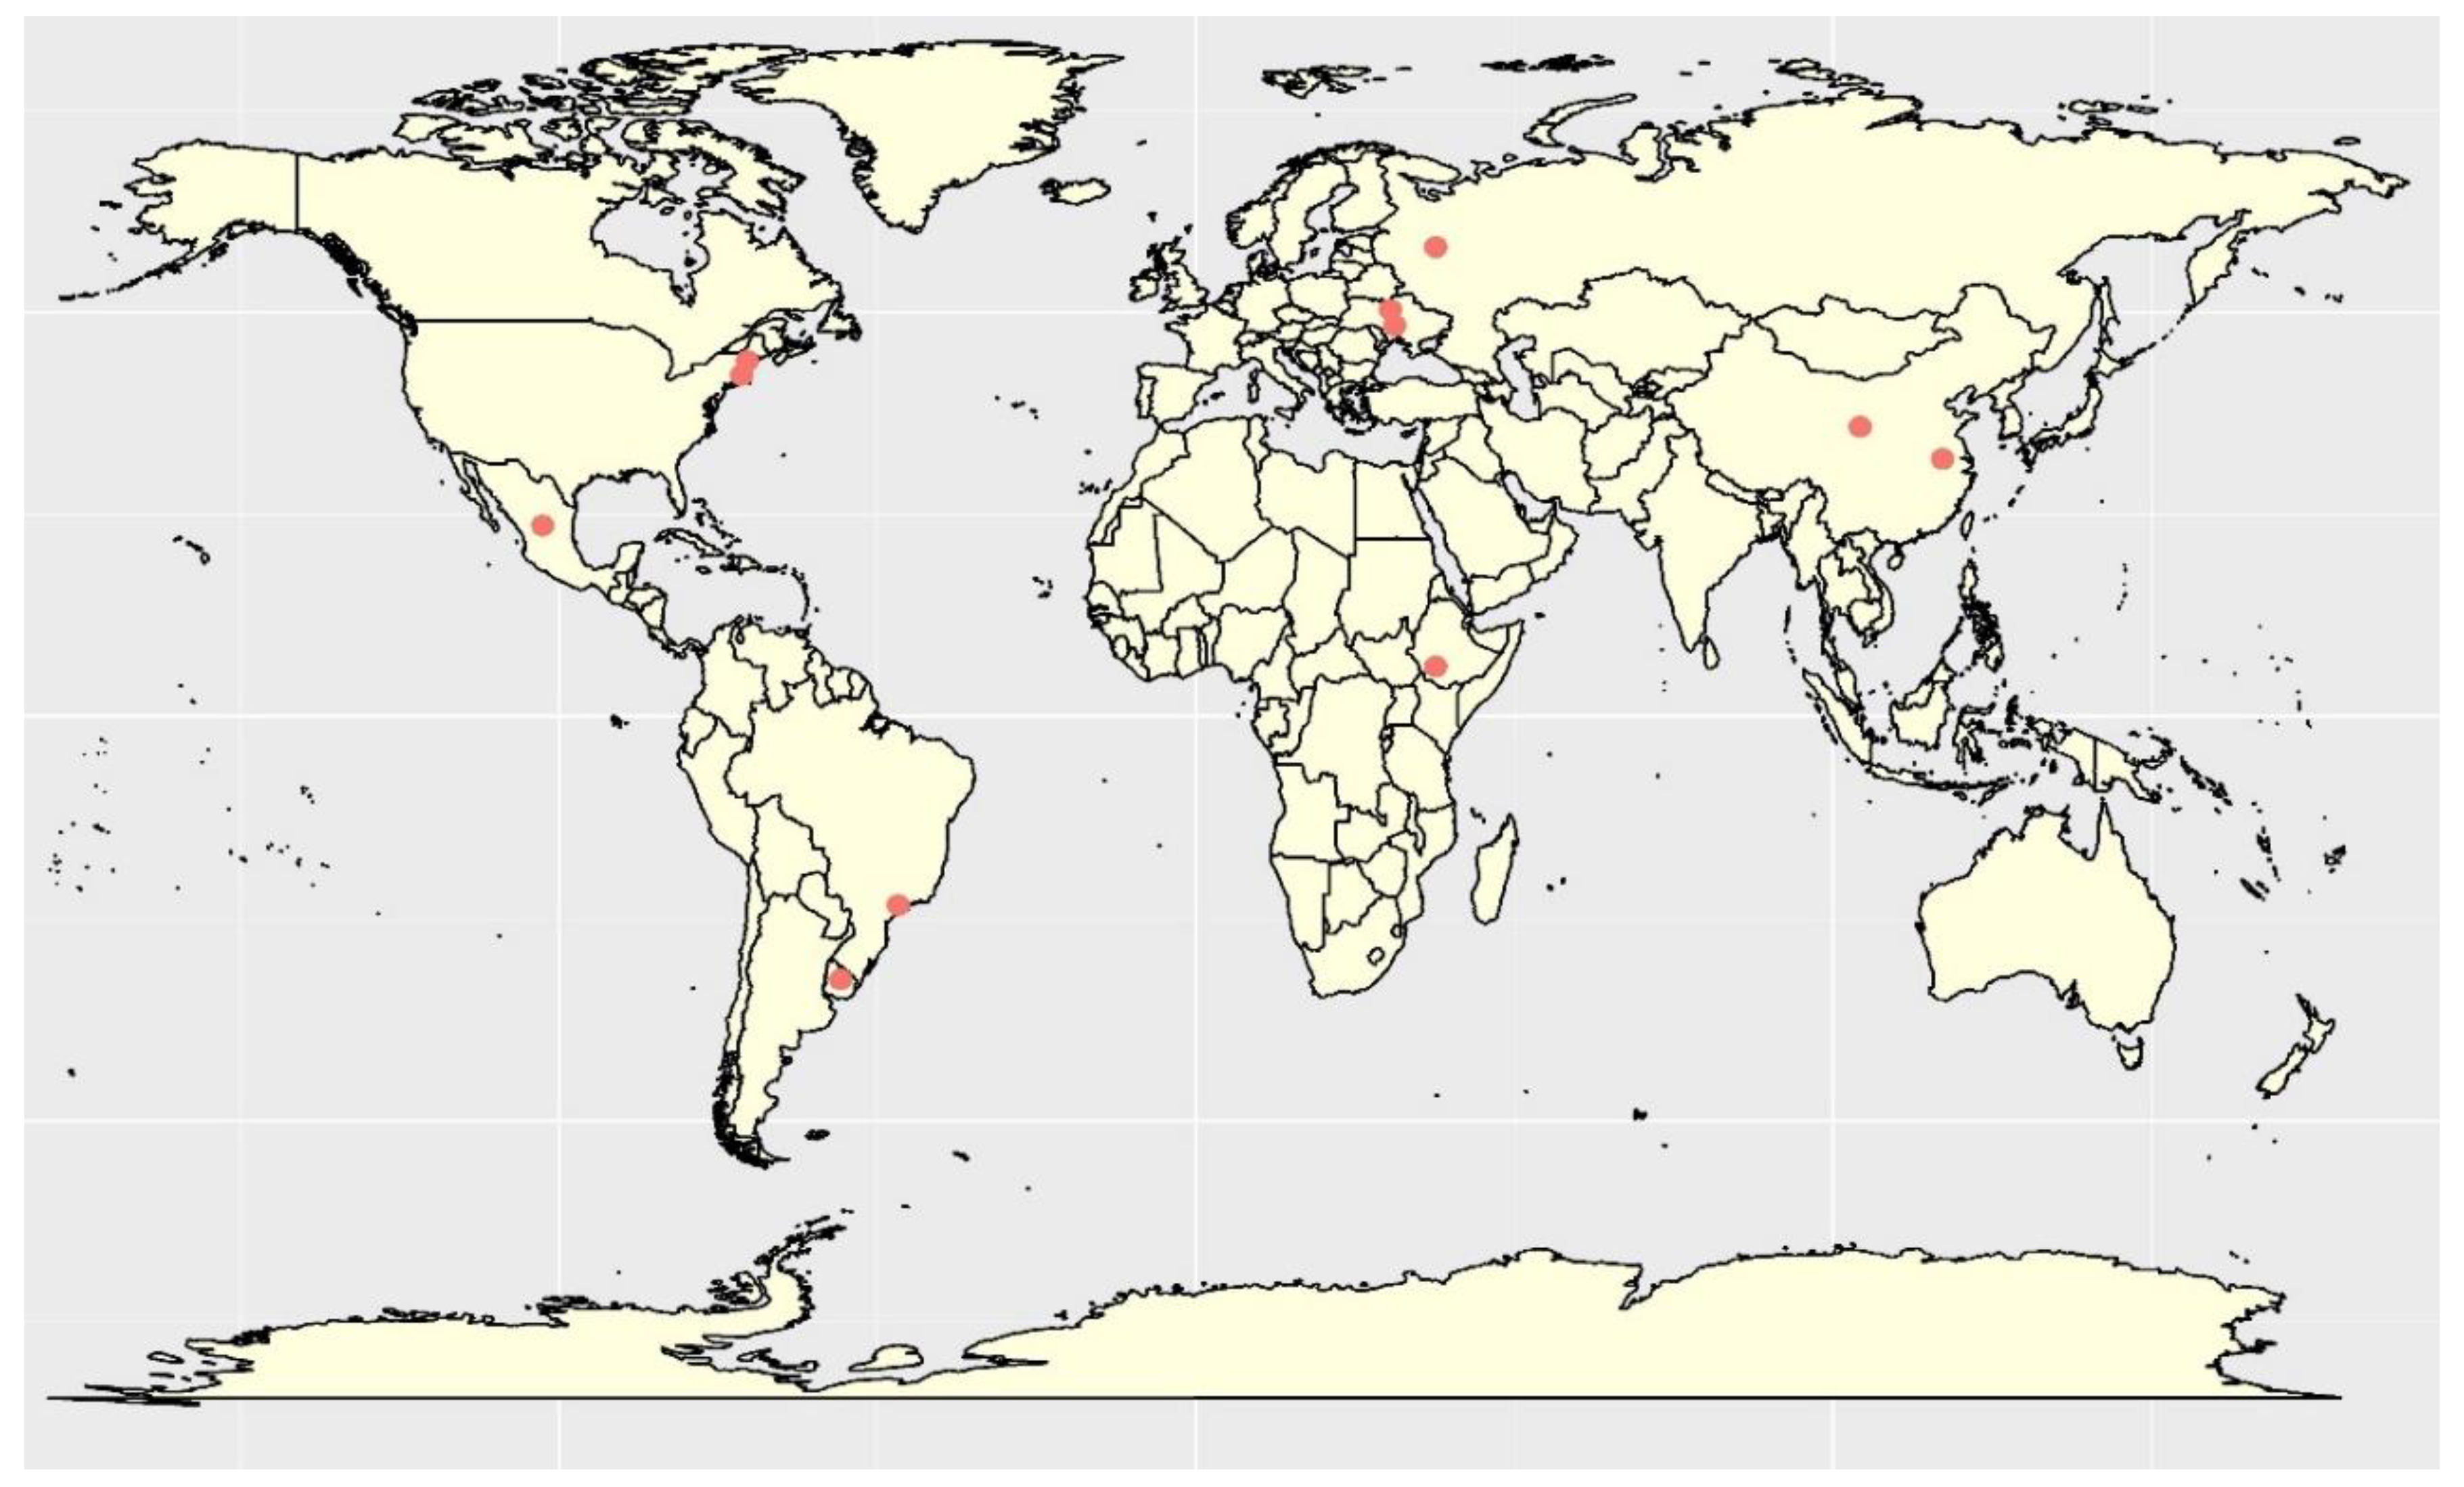
3.1. Description of Personal Information of Experts
3.2. Description of Research-Related Questions
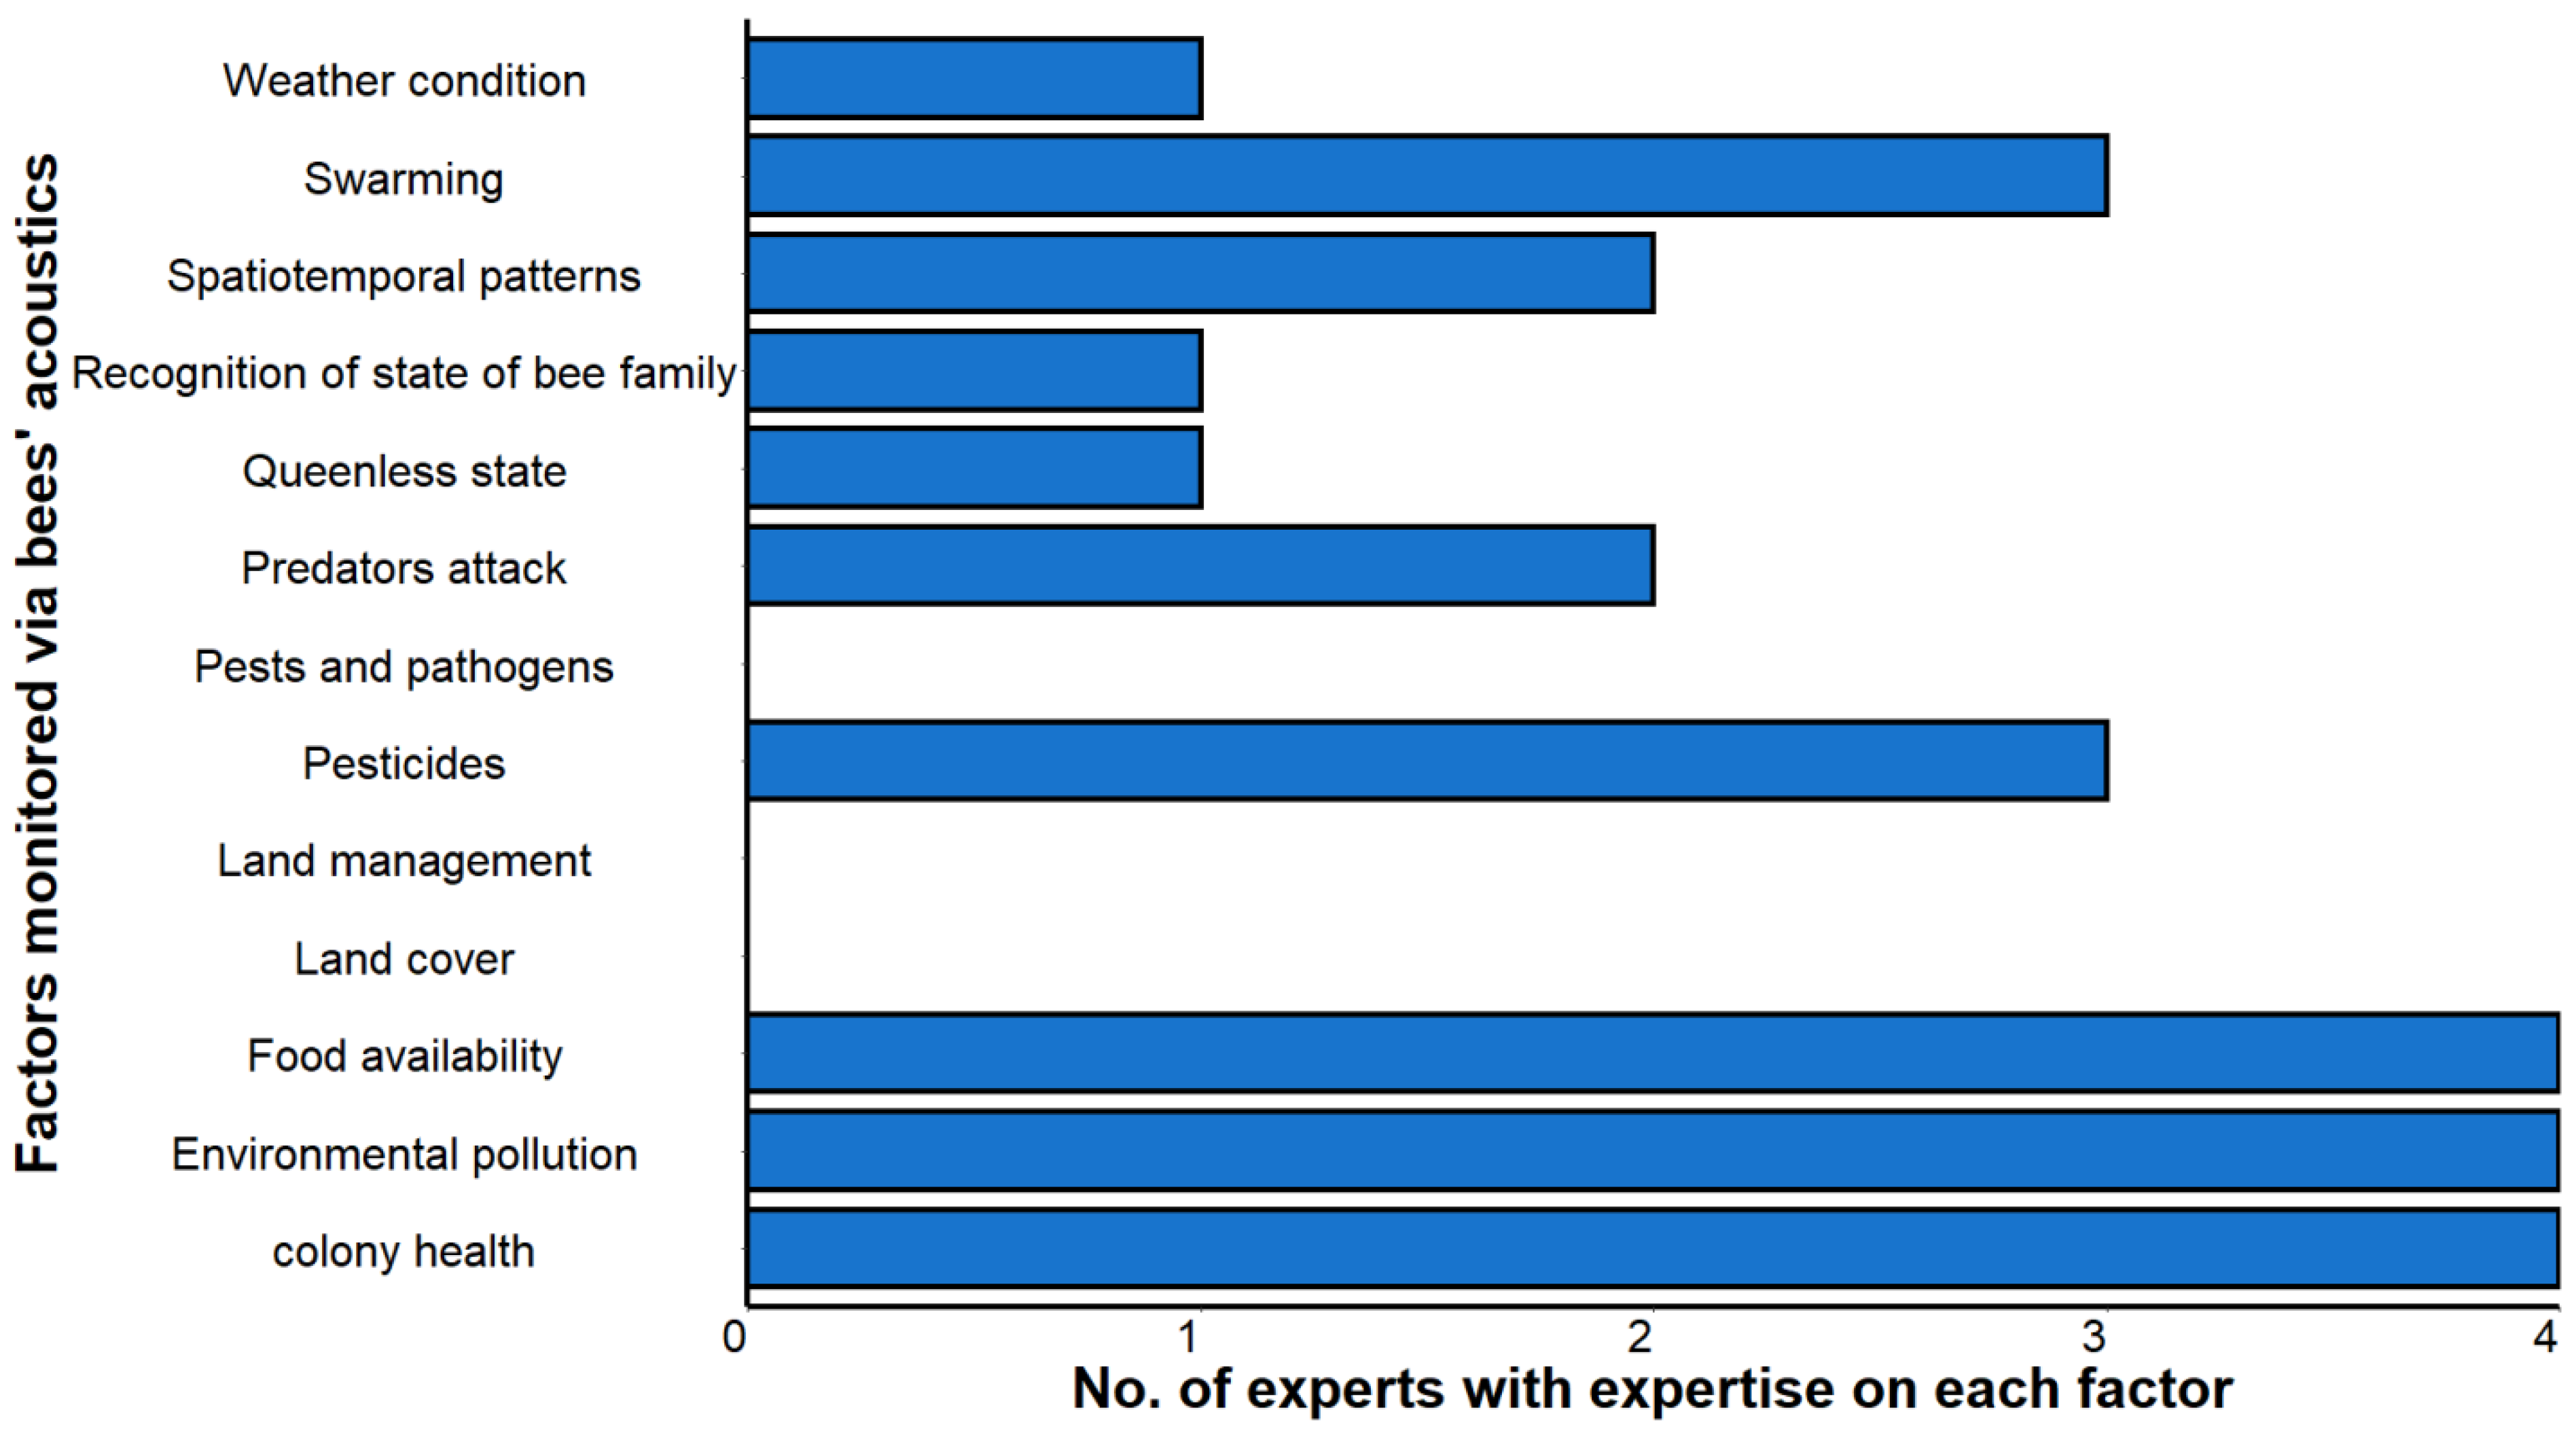
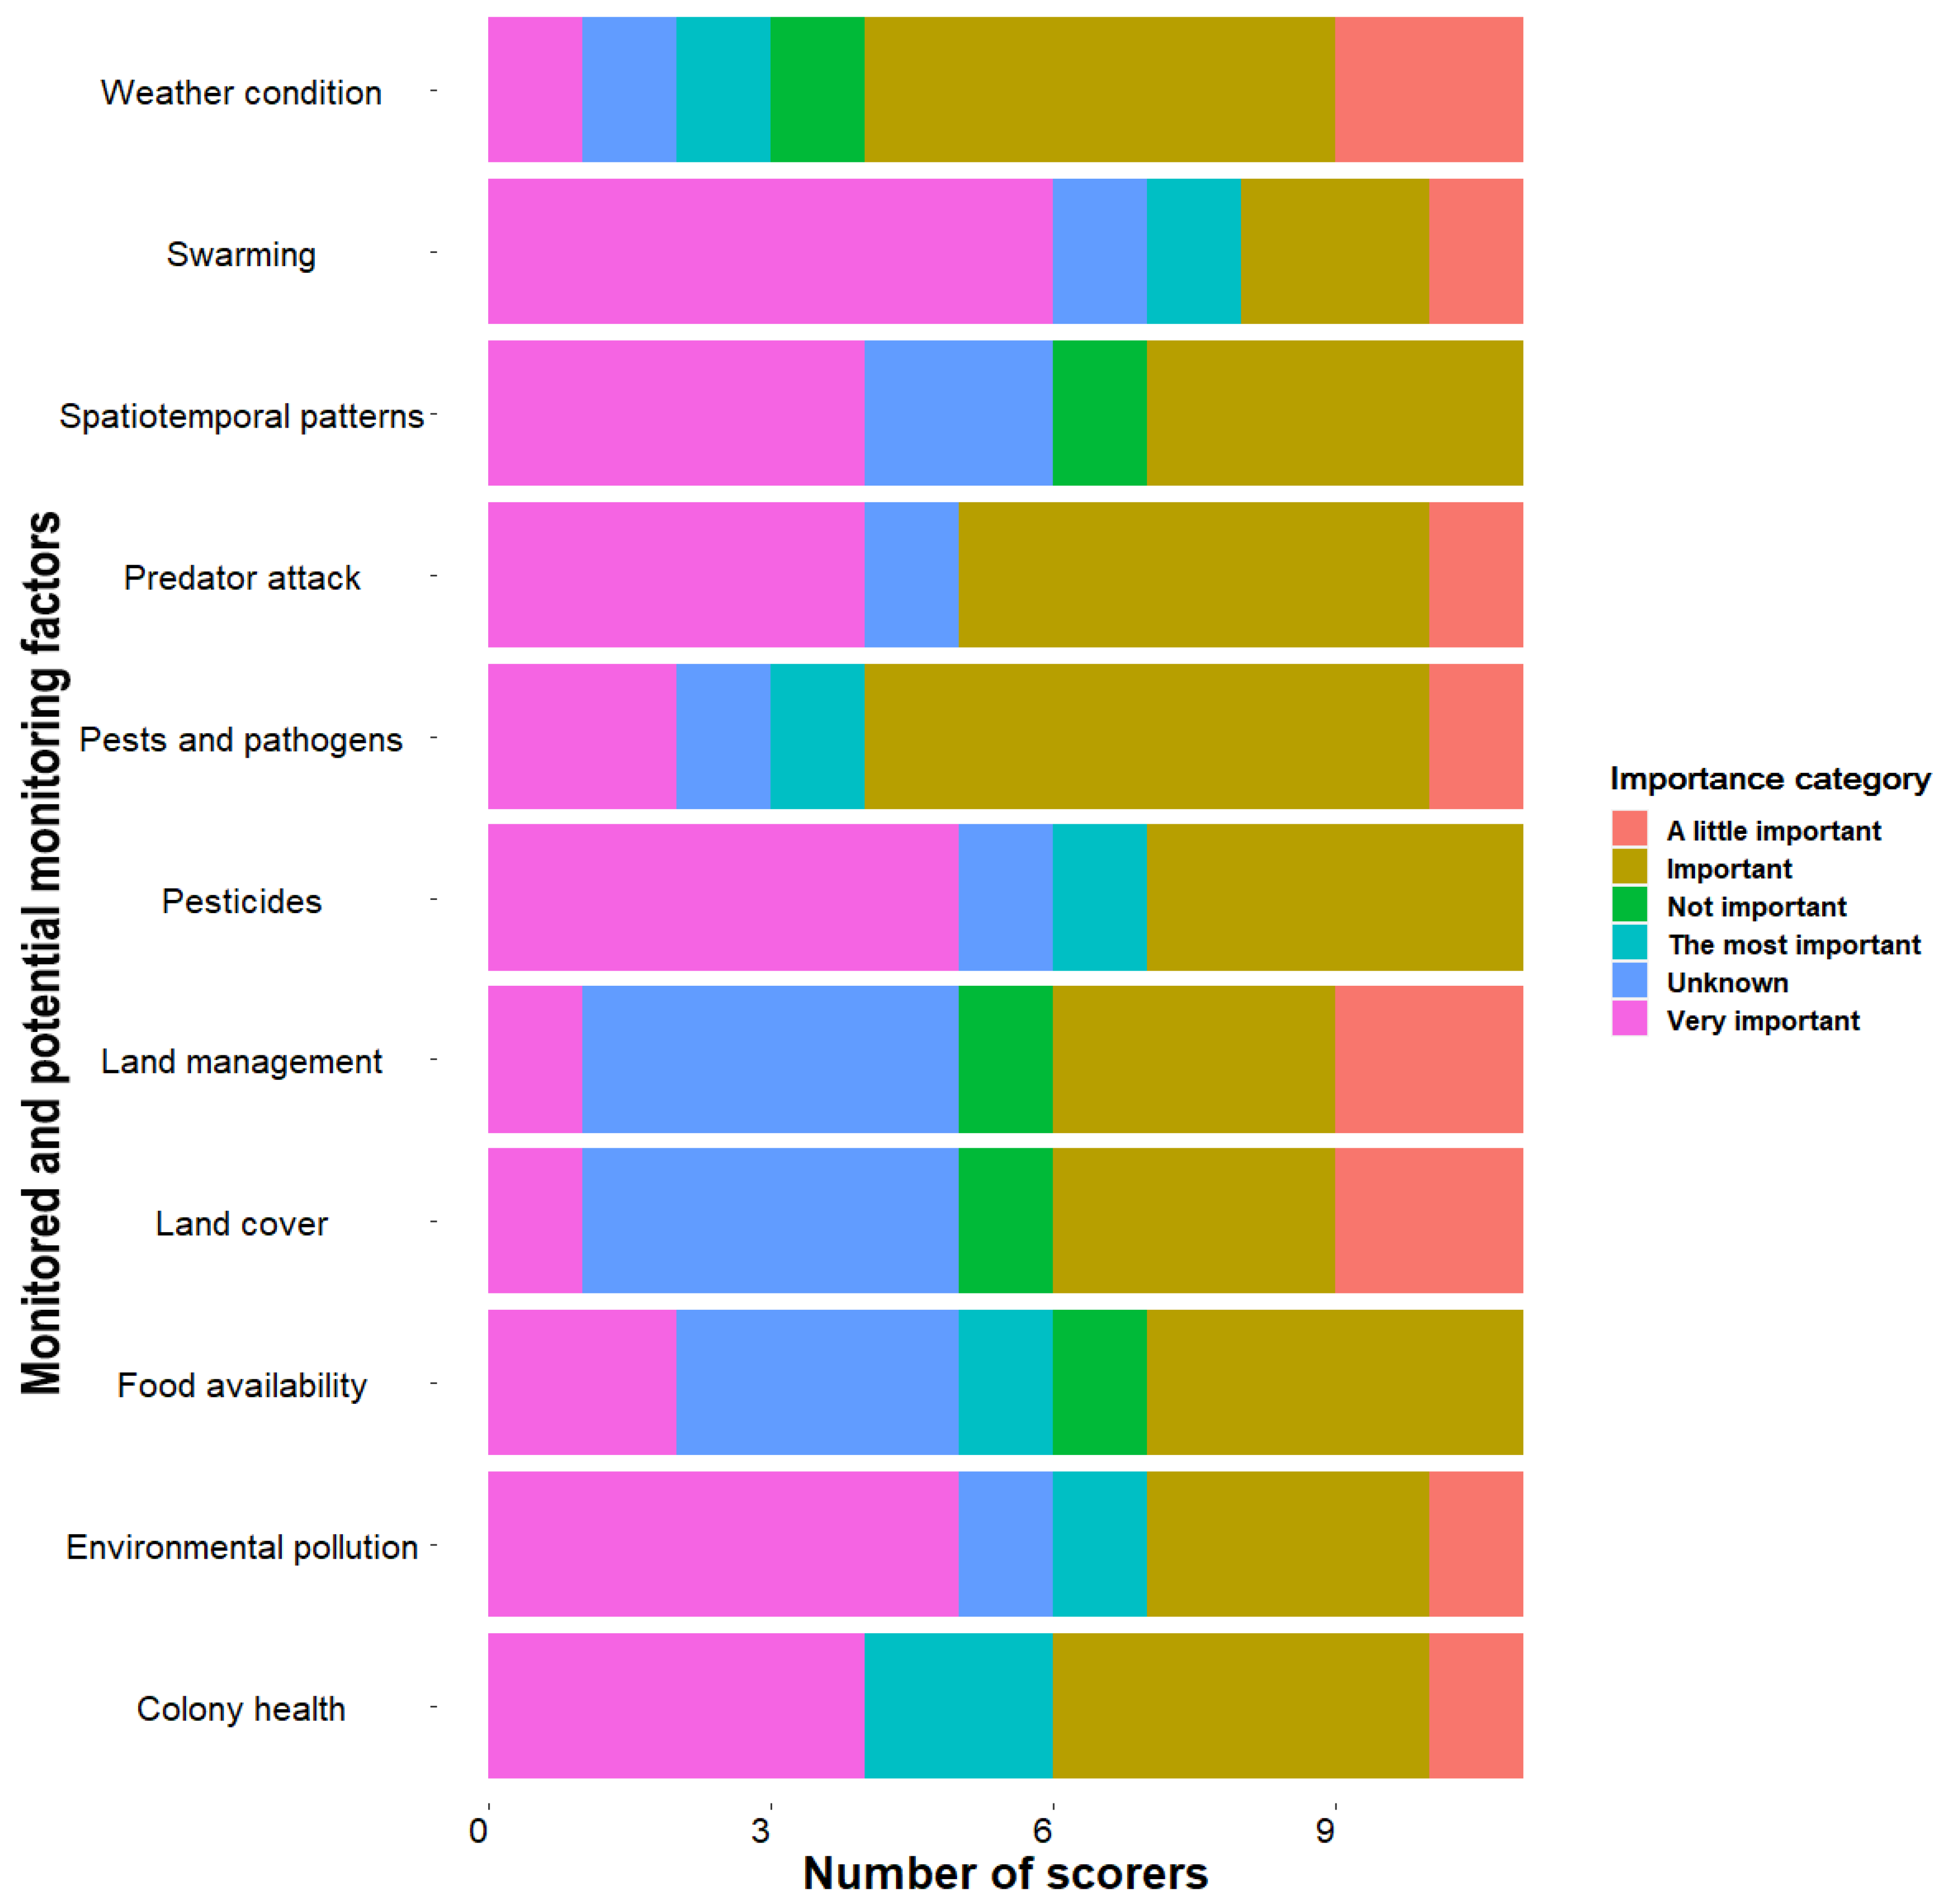
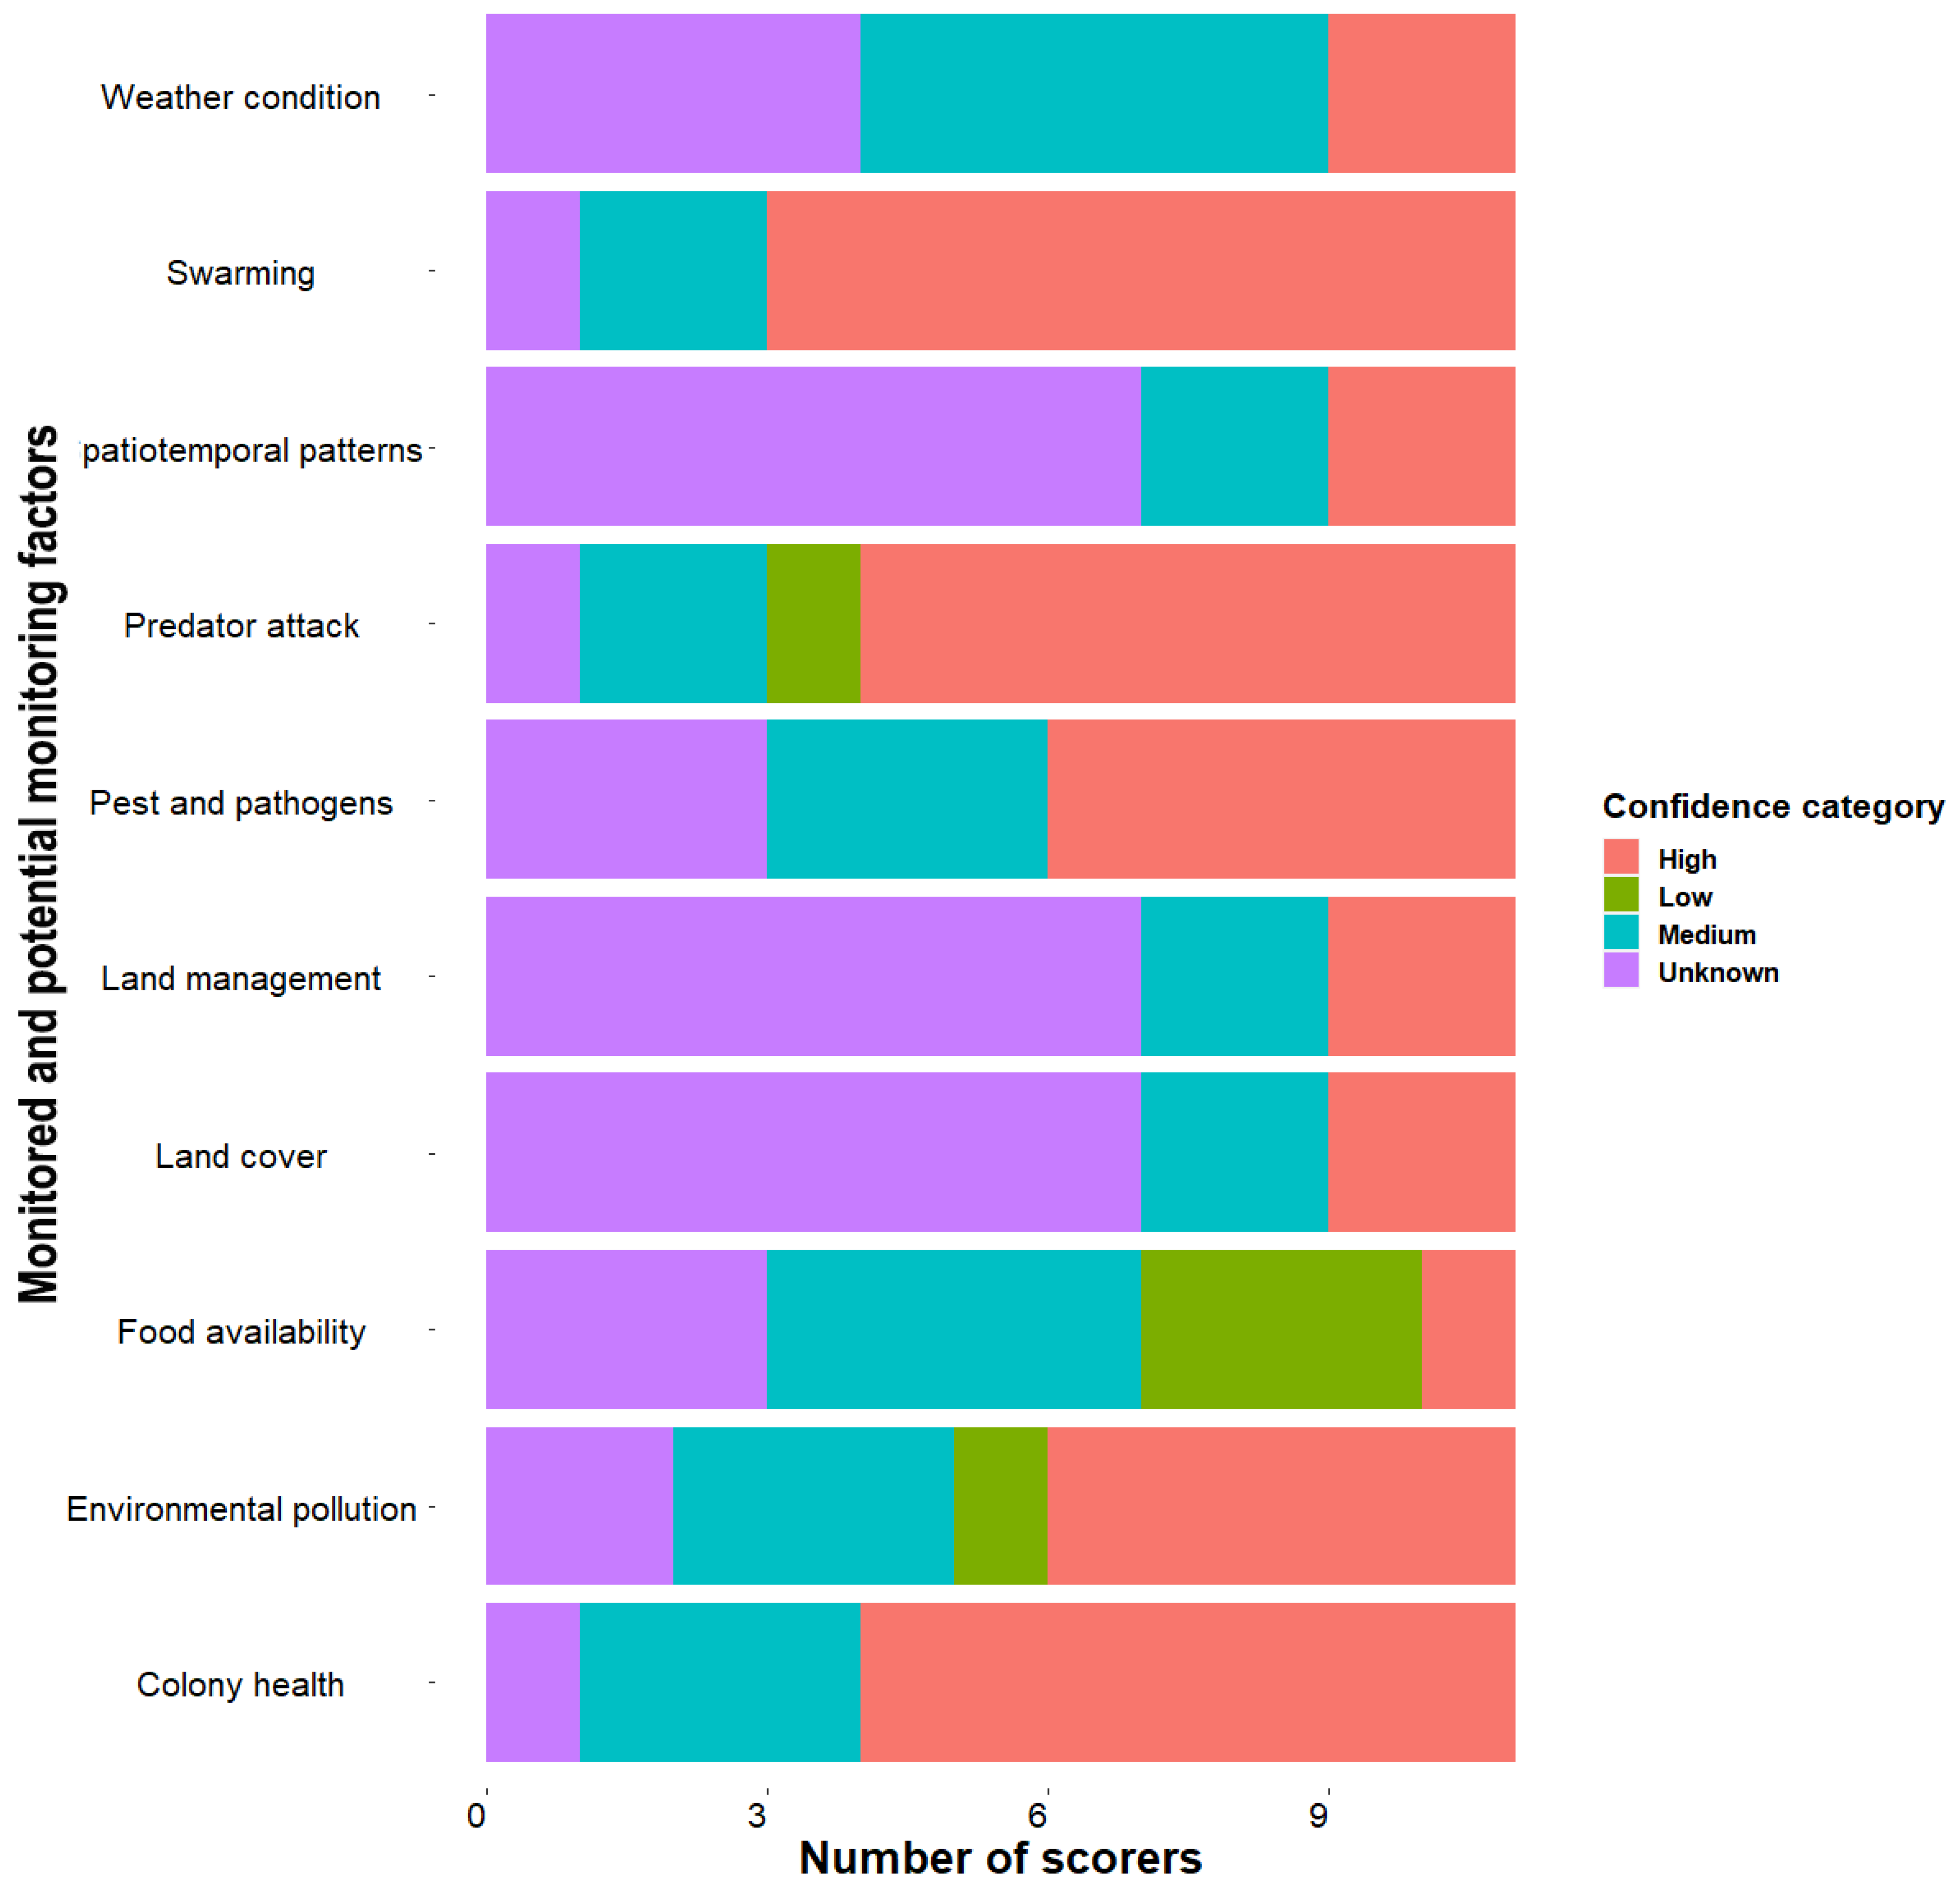
3.2.1. Importance and Confidence to Monitor Different Factors via Honeybee Colony Acoustics
3.2.2. Experts’ Comments on the Importance and New Directions of Colony Acoustics
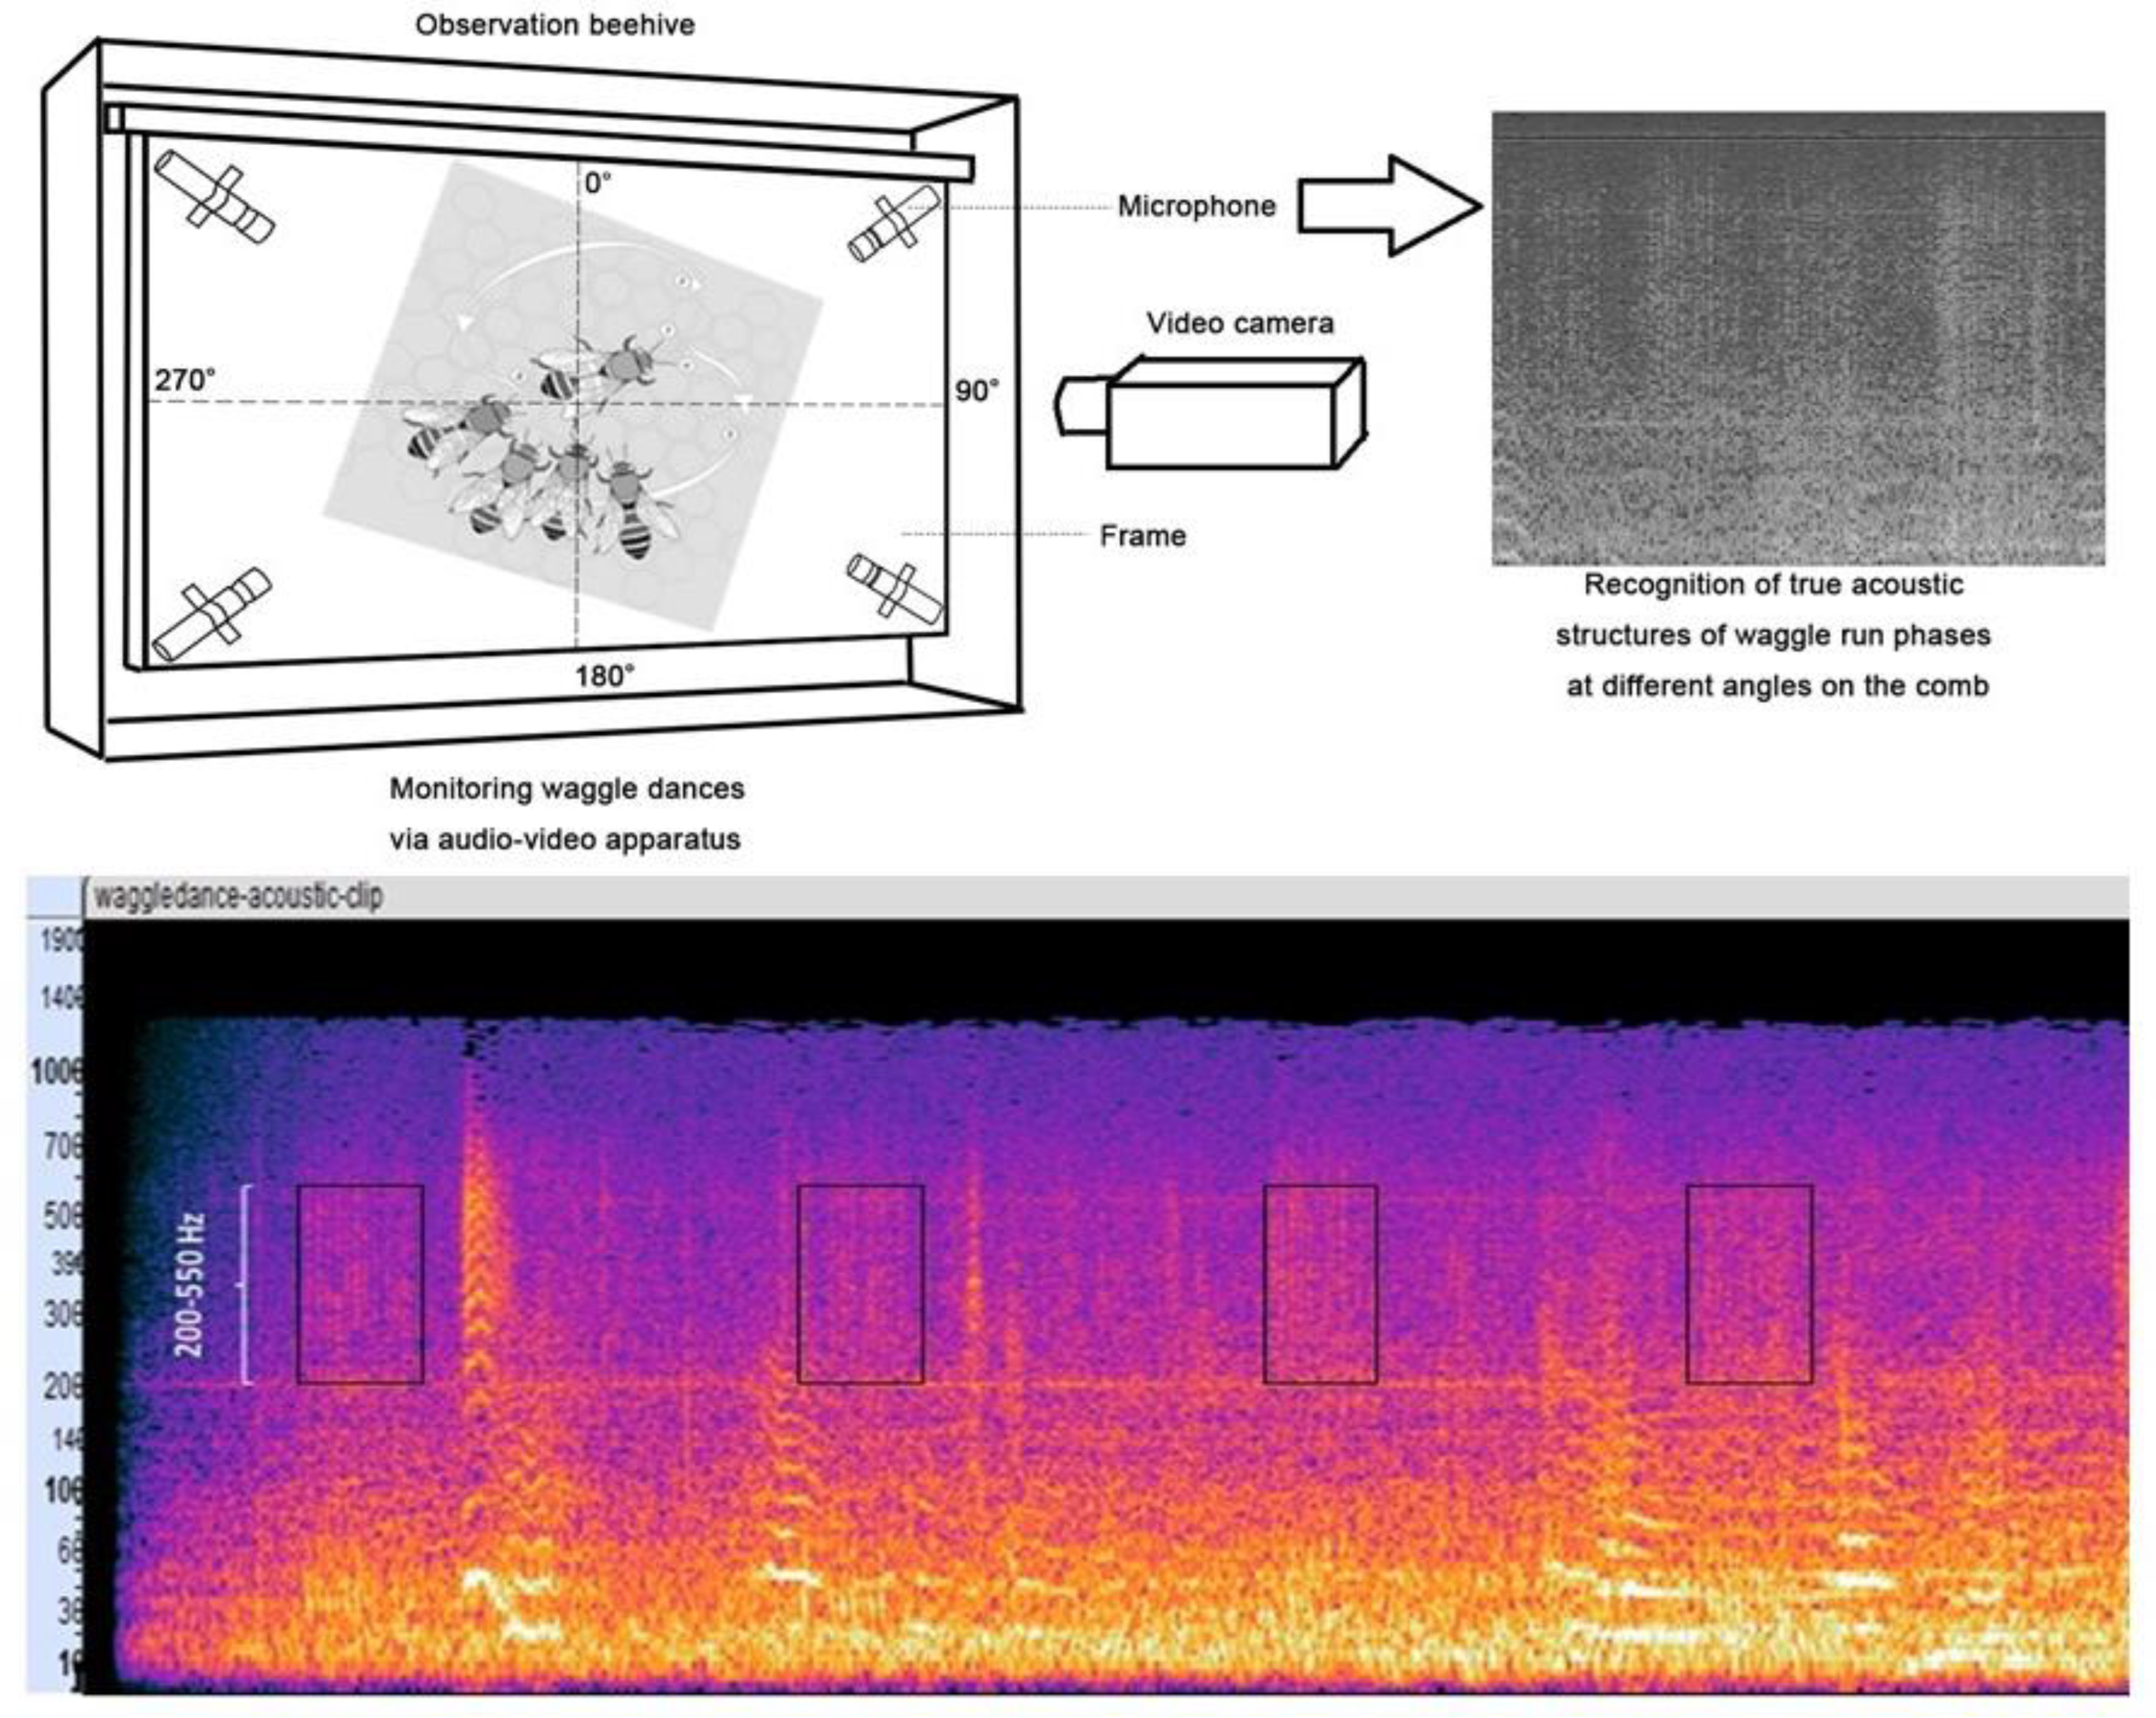
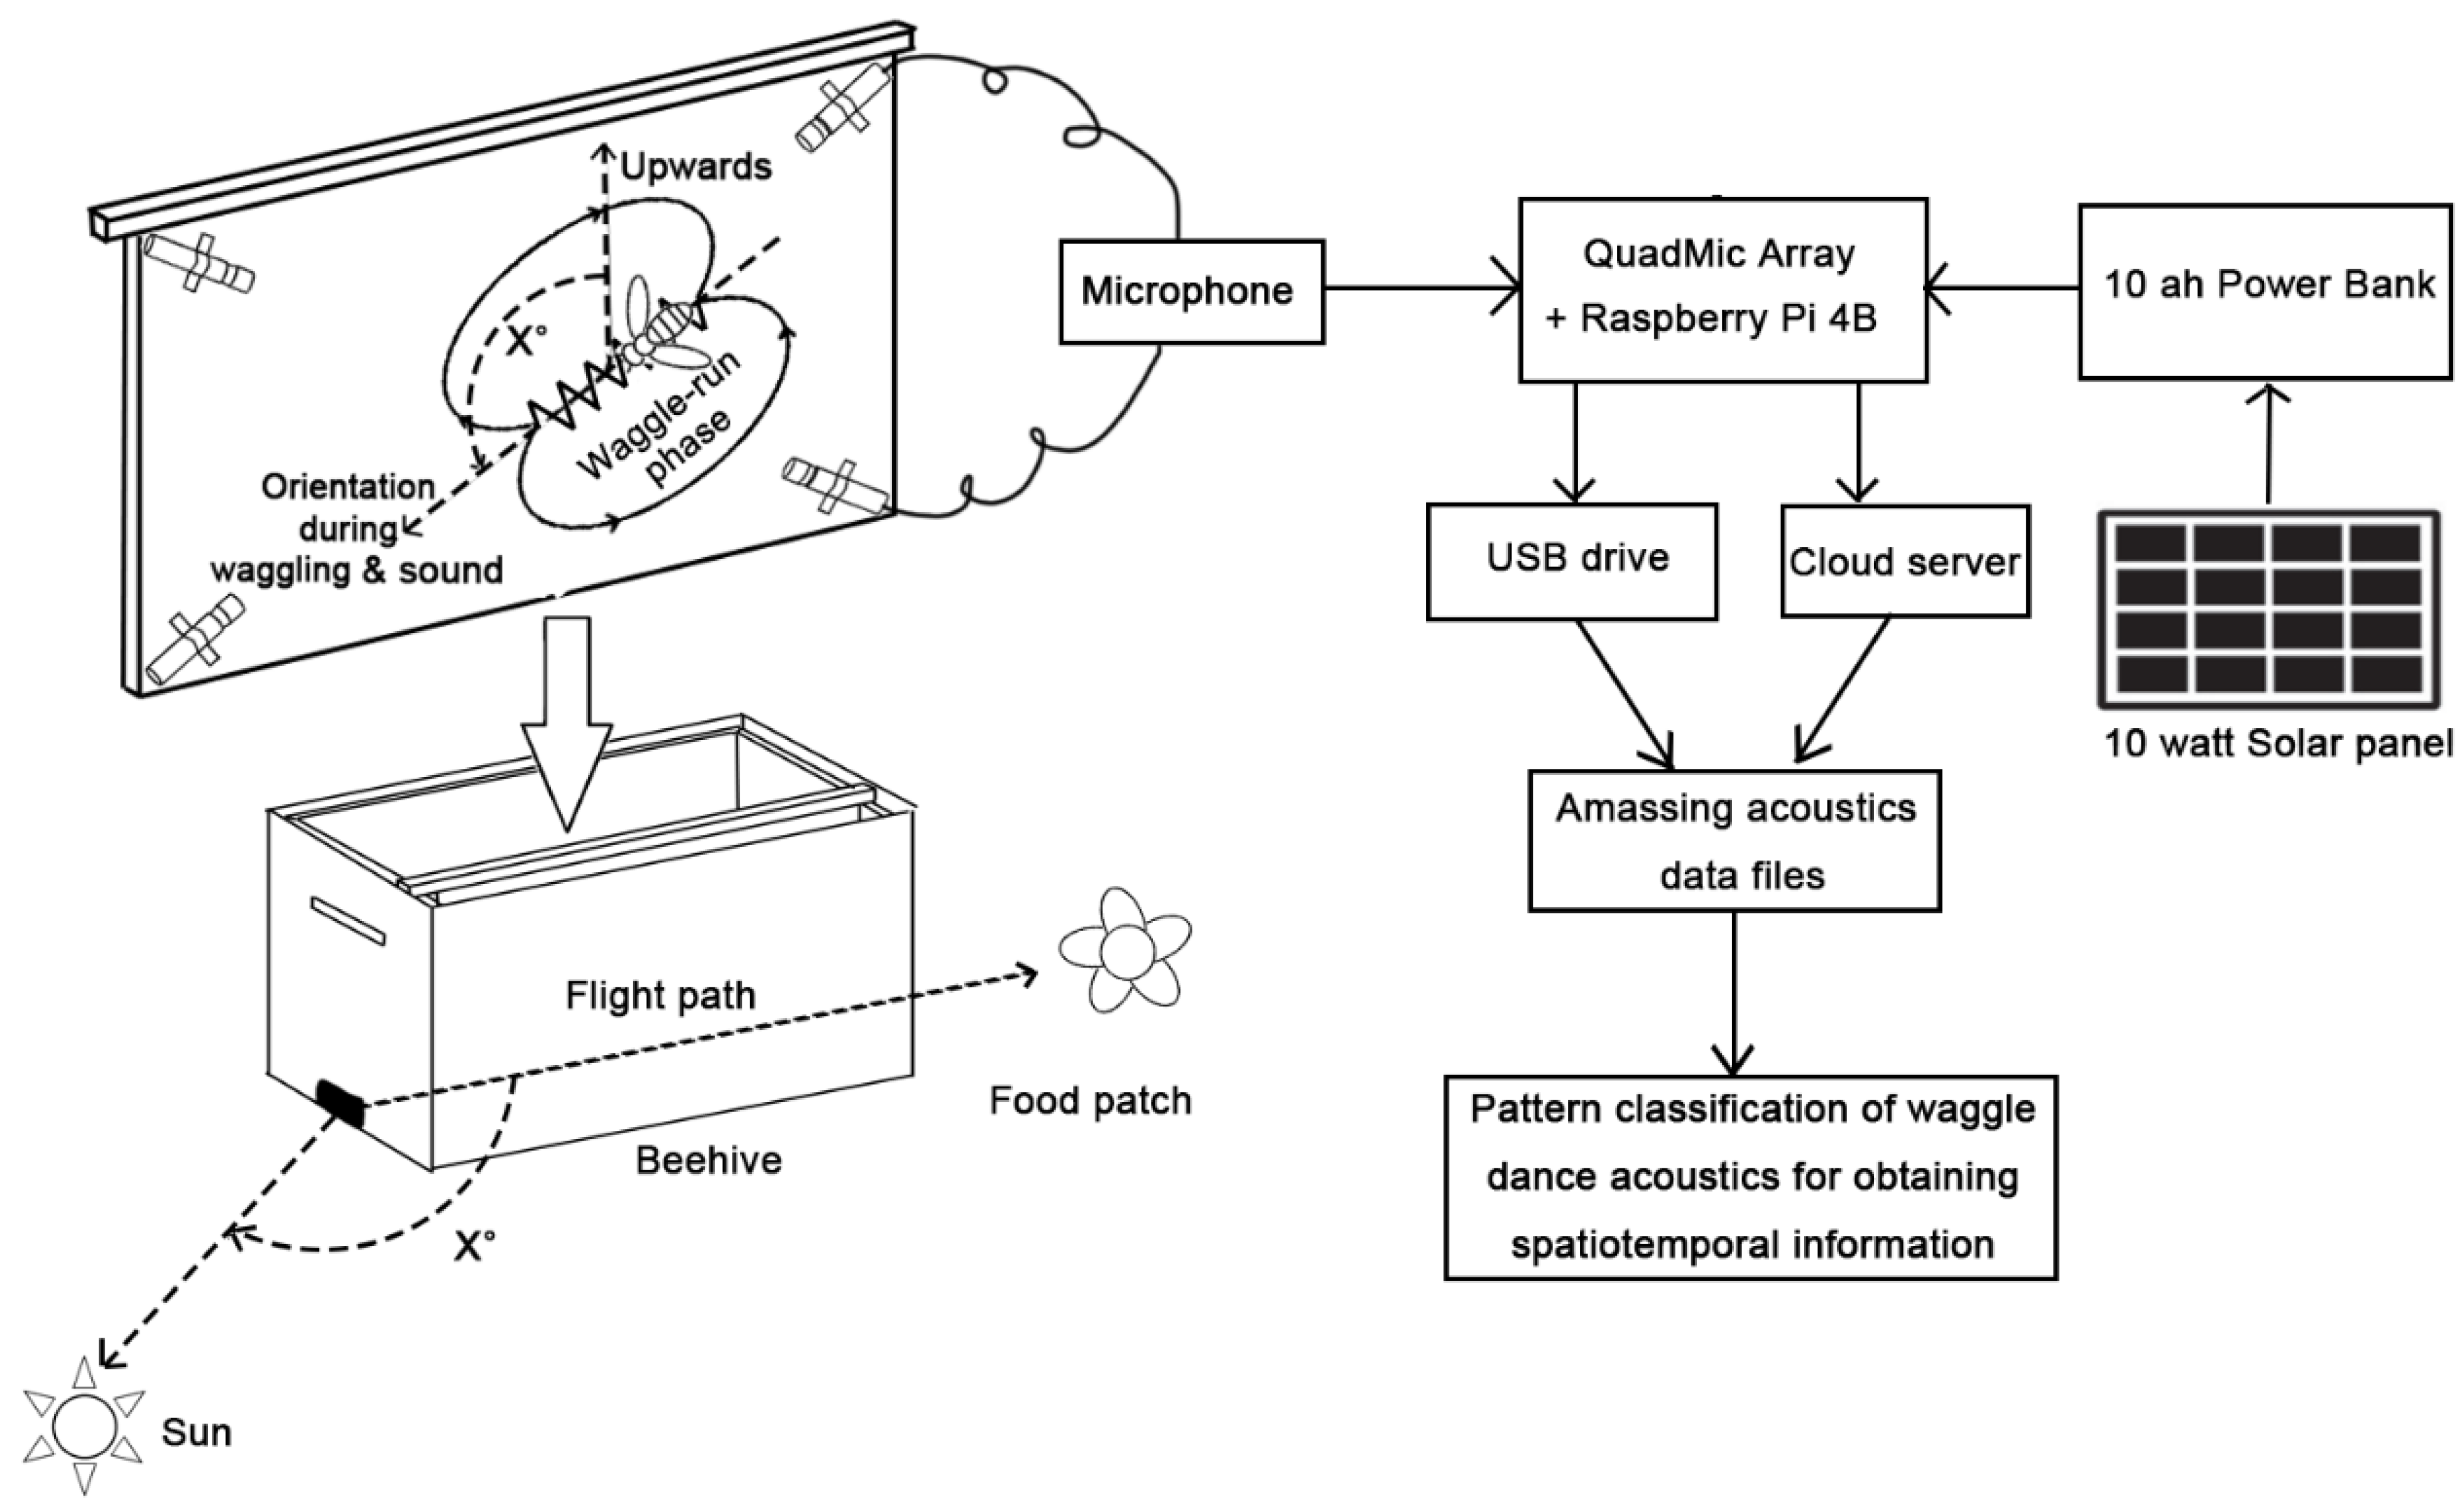
3.3. Waggling Dance in a Colony and Its Effective Monitoring through Our Proposed Acoustics Recording Setup
4. Discussion
Supplementary Materials
Author Contributions
Funding
Institutional Review Board Statement
Data Availability Statement
Acknowledgments
Conflicts of Interest
References
- Abrol, D.P. Pollination Biology: Biodiversity Conservation and Agricultural Production; Springer: Berlin/Heidelberg, Germany, 2012. [Google Scholar]
- Klein, A.-M.; Vaissière, B.E.; Cane, J.H.; Steffan-Dewenter, I.; Cunningham, S.A.; Kremen, C.; Tscharntke, T. Importance of pollinators in changing landscapes for world crops. Proc. R. Soc. B Biol. Sci. 2007, 274, 303–313. [Google Scholar] [CrossRef] [PubMed] [Green Version]
- Chaplin-Kramer, R.; Dombeck, E.; Gerber, J.; Knuth, K.A.; Mueller, N.D.; Mueller, M.; Ziv, G.; Klein, A.-M. Global malnutrition overlaps with pollinator-dependent micronutrient production. Proc. R. Soc. B Biol. Sci. 2014, 281, 20141799. [Google Scholar] [CrossRef] [PubMed] [Green Version]
- Gray, A.; Adjlane, N.; Arab, A.; Ballis, A.; Brusbardis, V.; Bugeja Douglas, A.; Cadahía, L.; Charrière, J.-D.; Chlebo, R.; Coffey, M.F. Honey bee colony loss rates in 37 countries using the COLOSS survey for winter 2019–2020: The combined effects of operation size, migration and queen replacement. J. Apic. Res. 2022, 62, 204–210. [Google Scholar] [CrossRef]
- EPA. Pesticide Issues in the Works: Honey Bee Colony Collapse Disorder; Environmental Protection Agency: Washington, DC, USA, 2011. Available online: http://www.epa.gov/pesticides/about/intheworks/honeybee.hlm (accessed on 5 January 2023).
- Abdollahi, M.; Giovenazzo, P.; Falk, T.H. Automated beehive acoustics monitoring: A comprehensive review of the literature and recommendations for future work. Appl. Sci. 2022, 12, 3920. [Google Scholar] [CrossRef]
- Sanford, M.T. Diseases and Pests of the Honey Bee; University of Florida: Gainesville, FL, USA, 1987. [Google Scholar]
- Thimmegowda, G.G.; Mullen, S.; Sottilare, K.; Sharma, A.; Mohanta, S.S.; Brockmann, A.; Dhandapany, P.S.; Olsson, S.B. A field-based quantitative analysis of sublethal effects of air pollution on pollinators. Proc. Natl. Acad. Sci. USA 2020, 117, 20653–20661. [Google Scholar] [CrossRef]
- Henry, M.; Decourtye, A.J.S. A Common Pesticide Decreases Foraging Success and Survival in Honey Bees. Science 2012, 336, 348–350. [Google Scholar] [CrossRef]
- APHA. Asian Hornet: UK Sightings. Available online: https://www.gov.uk/government/publications/asian-hornet-uk-sightings (accessed on 12 December 2022).
- Flores, J.M.; Gil-Lebrero, S.; Gámiz, V.; Rodríguez, M.I.; Ortiz, M.A.; Quiles, F.J. Effect of the climate change on honey bee colonies in a temperate Mediterranean zone assessed through remote hive weight monitoring system in conjunction with exhaustive colonies assessment. Sci. Total Environ. 2019, 653, 1111–1119. [Google Scholar] [CrossRef] [PubMed]
- Zacepins, A.; Brusbardis, V.; Meitalovs, J.; Stalidzans, E. Challenges in the development of Precision Beekeeping. Biosyst. Eng. 2015, 130, 60–71. [Google Scholar] [CrossRef]
- Ramsey, M.-T.; Bencsik, M.; Newton, M.I.; Reyes, M.; Pioz, M.; Crauser, D.; Delso, N.S.; Le Conte, Y. The prediction of swarming in honeybee colonies using vibrational spectra. Sci. Rep. 2020, 10, 9798. [Google Scholar] [CrossRef]
- Terenzi, A.; Cecchi, S.; Spinsante, S. On the importance of the sound emitted by honey bee hives. Vet. Sci. 2020, 7, 168. [Google Scholar] [CrossRef]
- Puswal, S.M.; Jinjun, M.; Liu, F. Effects of temperature and season on birds’ dawn singing behavior in a forest of eastern China. J. Ornithol. 2021, 162, 447–459. [Google Scholar] [CrossRef]
- Puswal, S.M.; Mei, J.; Wang, M.; Liu, F. Daily and seasonal patterns in the singing activity of birds in East China. Ardea 2022, 110, 5–14. [Google Scholar] [CrossRef]
- Cejrowski, T.; Szymanski, J. Buzz-based honeybee colony fingerprint. Comput. Electron. Agric. 2021, 191, 106489. [Google Scholar] [CrossRef]
- Vancata, I.O. Using acoustic technology to monitor your hives. Am. Bee J. 1995, 135, 615–618. [Google Scholar]
- Ferrari, S.; Silva, M.; Guarino, M.; Berckmans, D. Monitoring of swarming sounds in bee hives for early detection of the swarming period. Comput. Electron. Agric. 2008, 64, 72–77. [Google Scholar] [CrossRef]
- Robles-Guerrero, A.; Saucedo-Anaya, T.; González-Ramérez, E.; Galván-Tejada, C.E. Frequency Analysis of Honey Bee Buzz for Automatic Recognition of Health Status: A Preliminary Study. Res. Comput. Sci. 2017, 142, 89–98. [Google Scholar] [CrossRef]
- Ruvinga, S.; Hunter, G.; Duran, O.; Nebel, J.C. Use of LSTM Networks to Identify “Queenlessness” in Honeybee Hives from Audio Signals. In Proceedings of the 2021 17th International Conference on Intelligent Environments (IE), Dubai, United Arab Emirates, 21–24 June 2021. [Google Scholar]
- Papachristoforou, A.; Sueur, J.; Rortais, A.; Angelopoulos, S.; Thrasyvoulou, A.; Arnold, G. High frequency sounds produced by Cyprian honeybees Apis mellifera cypria when confronting their predator, the Oriental hornet Vespa orientalis. Apidologie 2008, 39, 468–474. [Google Scholar] [CrossRef] [Green Version]
- Mattila, H.R.; Kernen, H.G.; Otis, G.W.; Nguyen, L.T.; Pham, H.D.; Knight, O.M.; Phan, N.T. Giant hornet (Vespa soror) attacks trigger frenetic antipredator signalling in honeybee (Apis cerana) colonies. R. Soc. Open Sci. 2021, 8, 211215. [Google Scholar] [CrossRef]
- Sharif, M.Z.; Wario, F.; Di, N.; Xue, R.; Liu, F. Soundscape indices: New features for classifying beehive audio samples. Sociobiology 2020, 67, 566–571. [Google Scholar] [CrossRef]
- Pérez, N.; Jesús, F.; Pérez, C.; Niell, S.; Draper, A.; Obrusnik, N.; Zinemanas, P.; Spina, Y.M.; Letelier, L.C.; Monzón, P. Continuous monitoring of beehives’ sound for environmental pollution control. Ecol. Eng. 2016, 90, 326–330. [Google Scholar] [CrossRef]
- Gentry, K.E.; Luther, D.A. Spatiotemporal patterns of avian vocal activity in relation to urban and rural background noise. J. Ecoacoustics 2017, 1, Z9TQHU. [Google Scholar] [CrossRef]
- Dröge, S.; Martin, D.A.; Andriafanomezantsoa, R.; Burivalova, Z.; Fulgence, T.R.; Osen, K.; Rakotomalala, E.; Schwab, D.; Wurz, A.; Richter, T. Listening to a changing landscape: Acoustic indices reflect bird species richness and plot-scale vegetation structure across different land-use types in north-eastern Madagascar. Ecol. Indic. 2021, 120, 106929. [Google Scholar] [CrossRef]
- Clay, Z.; Smith, C.L.; Blumstein, D.T. Food-associated vocalizations in mammals and birds: What do these calls really mean? Anim. Behav. 2012, 83, 323–330. [Google Scholar] [CrossRef]
- Von Frisch, K. The Dance Language and Orientation of Bees; Harvard University Press: Cambridge, MA, USA, 1967. [Google Scholar]
- Dyer, F. The biology of the dance language. Annu. Rev. Entomol. 2002, 47, 917–949. [Google Scholar] [CrossRef] [PubMed]
- Wario, F.; Wild, B.; Rojas, R.; Landgraf, T. Automatic detection and decoding of honey bee waggle dances. PLoS ONE 2017, 12, e0188626. [Google Scholar] [CrossRef] [Green Version]
- Wario, F.; Wild, B.; Couvillon, M.J.; Rojas, R.; Landgraf, T. Automatic methods for long-term tracking and the detection and decoding of communication dances in honeybees. Front. Ecol. Evol. 2015, 3, 103. [Google Scholar] [CrossRef] [Green Version]
- Okada, R.; Ikeno, H.; Sasayama, N.; Aonuma, H.; Kurabayashi, D.; Ito, E. The dance of the honeybee: How do honeybees dance to transfer food information effectively? Acta Biol. Hung. 2008, 59, 157–162. [Google Scholar] [CrossRef]
- Mukherjee, N.; Huge, J.; Sutherland, W.J.; McNeill, J.; van Opstal, M.; Dahdouh-Guebas, F.; Koedam, N. The Delphi technique in ecology and biological conservation: Applications and guidelines. Methods Ecol. Evol. 2015, 6, 1097–1109. [Google Scholar] [CrossRef] [Green Version]
- Barron, A.B.; Maleszka, R.; Vander Meer, R.K.; Robinson, G.E. Octopamine modulates honey bee dance behavior. Proc. Natl. Acad. Sci. USA 2007, 104, 1703–1707. [Google Scholar] [CrossRef] [Green Version]
- Linn, M.; Glaser, S.M.; Peng, T.; Grüter, C. Octopamine and dopamine mediate waggle dance following and information use in honeybees. Proc. R. Soc. B Biol. Sci. 2020, 287, 20201950. [Google Scholar] [CrossRef]
- Harris, J.W.; Woodring, J. Effects of stress, age, season, and source colony on levels of octopamine, dopamine and serotonin in the honey bee (Apis mellifera L.) brain. J. Insect Physiol. 1992, 38, 29–35. [Google Scholar] [CrossRef]
- Tan, K.; Dong, S.; Li, X.; Liu, X.; Wang, C.; Li, J.; Nieh, J.C. Honey bee inhibitory signaling is tuned to threat severity and can act as a colony alarm signal. PLoS Biol. 2016, 14, e1002423. [Google Scholar] [CrossRef] [PubMed]
- Dong, S.; Wen, P.; Zhang, Q.; Wang, Y.; Cheng, Y.; Tan, K.; Nieh, J.C. Olfactory eavesdropping of predator alarm pheromone by sympatric but not allopatric prey. Anim. Behav. 2018, 141, 115–125. [Google Scholar] [CrossRef] [Green Version]
- Villanueva-Rivera, L.J.; Pijanowski, B.C.; Doucette, J.; Pekin, B. A primer of acoustic analysis for landscape ecologists. Landsc. Ecol. 2011, 26, 1233–1246. [Google Scholar] [CrossRef]
- Boelman, N.T.; Asner, G.P.; Hart, P.J.; Martin, R.E. Multi-trophic invasion resistance in Hawaii: Bioacoustics, field surveys, and airborne remote sensing. Ecol. Appl. 2007, 17, 2137–2144. [Google Scholar] [CrossRef]
- Sueur, J.; Aubin, T.; Simonis, C. Seewave, a free modular tool for sound analysis and synthesis. Bioacoustics 2008, 18, 213–226. [Google Scholar] [CrossRef]
- Mammides, C.; Goodale, E.; Dayananda, S.K.; Kang, L.; Chen, J. Do acoustic indices correlate with bird diversity? Insights from two biodiverse regions in Yunnan Province, south China. Ecol. Indic. 2017, 82, 470–477. [Google Scholar] [CrossRef]
- Eskov, E.K. The diversity of ethological and physiological mechanisms of acoustic communication in insects, Biophysics (Moscow). Biophysics 2017, 62, 466–478. [Google Scholar] [CrossRef]
- Robles-Guerrero, A.; Saucedo-Anaya, T.; Guerrero-Mendez, C.A.; Gómez-Jiménez, S.; Navarro-Solís, D.J. Comparative Study of Machine Learning Models for Bee Colony Acoustic Pattern Classification on Low Computational Resources. Sensors 2023, 23, 460. [Google Scholar] [CrossRef]
- Esch, H.; Burns, J. Distance estimation by foraging honeybees. J. Exp. Biol. 1996, 199, 155–162. [Google Scholar] [CrossRef]
- Hasegawa, Y.; Ikeno, H. How do honeybees attract nestmates using waggle dances in dark and noisy hives? PLoS ONE 2011, 6, e19619. [Google Scholar] [CrossRef] [Green Version]
- Hu, Z.; Miao, C.; Di, N.; Zhou, C.; Zhang, Y.; Yang, J.; Xun, L.; Li, Y. Decoding the dance parameters of eastern honeybee, Apis cerana. Apidologie 2023, 54, 10. [Google Scholar] [CrossRef]
- Kohl, P.L.; Thulasi, N.; Rutschmann, B.; George, E.A.; Steffan-Dewenter, I.; Brockmann, A. Adaptive evolution of honeybee dance dialects. Proc. R. Soc. B 2020, 287, 20200190. [Google Scholar] [CrossRef] [PubMed] [Green Version]
- Tautz, J.; Casas, J.; Sandeman, D. Phase reversal of vibratory signals in honeycomb may assist dancing honeybees to attract their audience. J. Exp. Biol. 2001, 204, 3737–3746. [Google Scholar] [CrossRef]
- Michelsen, A.; Kirchner, W.H.; Andersen, B.B.; Lindauer, M. The tooting and quacking vibration signals of honeybee queens: A quantitative analysis. J. Comp. Physiol. A 1986, 158, 605–611. [Google Scholar] [CrossRef]
- Wenner, A.M. Communication with queen honey bees by substrate sound. Science 1962, 138, 446–448. [Google Scholar] [CrossRef]
- Michelsen, A.; Towne, W.F.; Kirchner, W.H.; Kryger, P. The acoustic near field of a dancing honeybee. J. Comp. Physiol. A 1987, 161, 633–643. [Google Scholar] [CrossRef]
- Cecchi, S.; Terenzi, A.; Orcioni, S.; Piazza, F. Analysis of the sound emitted by honey bees in a beehive. Audio Eng. Soc. Conv. 2019, 147, 10255. [Google Scholar]
- Cejrowski, T.; Szymański, J.; Mora, H.; Gil, D. Detection of the bee queen presence using sound analysis. In Proceedings of the Asian Conference on Intelligent Information & Database Systems, Dong Hoi, Vietnam, 19–21 March 2018; pp. 297–306. [Google Scholar]
- Zgank, A. Bee swarm activity acoustic classification for an IoT-based farm service. Sensors 2020, 20, 21. [Google Scholar] [CrossRef] [Green Version]
- Voudiotis, G.; Kontogiannis, S.; Pikridas, C. Proposed smart monitoring system for the detection of bee swarming. Inventions 2021, 6, 87. [Google Scholar] [CrossRef]
- Sharif, M.Z.; Di, N.; Liu, F. Monitoring honeybees (Apis spp.) (Hymenoptera: Apidae) in climate-smart agriculture: A review. Appl. Entomol. Zool. 2021, 57, 289–303. [Google Scholar] [CrossRef]
- Tlačbaba, J.; Černý, M.; Dostál, P.; Přidal, A. The Acoustic Emission in the Nest of the Honey Bee Depending on the Extreme Weather Conditions. Acta Univ. Agric. Et Silvic. Mendel. Brun. 2014, 62, 27. [Google Scholar] [CrossRef] [Green Version]
- Abdollahi, M.; Henry, E.; Giovenazzo, P.; Falk, T.H. The Importance of Context Awareness in Acoustics-Based Automated Beehive Monitoring. Appl. Sci. 2022, 13, 195. [Google Scholar] [CrossRef]
- Kawakita, S.; Ichikawa, K.; Sakamoto, F.; Moriya, K. Sound recordings of Apis cerana japonica colonies over 24 h reveal unique daily hissing patterns. Apidologie 2019, 50, 204–214. [Google Scholar] [CrossRef] [Green Version]
- Collison, C. A Closer look: Sound Generation and Hearing. Bee Culture: The Magazine of American Beekeeping, 22 February 2016. [Google Scholar]
- Nieh, J.C.; Contrera, F.A.; Rangel, J.; Imperatriz-Fonseca, V.L. Effect of food location and quality on recruitment sounds and success in two stingless bees, Melipona mandacaia and Melipona bicolor. Behav. Ecol. Sociobiol. 2003, 55, 87–94. [Google Scholar] [CrossRef]
- Farina, A.; Lattanzi, E.; Malavasi, R.; Pieretti, N.; Piccioli, L. Avian soundscapes and cognitive landscapes: Theory, application and ecological perspectives. Landsc. Ecol. 2011, 26, 1257–1267. [Google Scholar] [CrossRef]
- Retamosa Izaguirre, M.I.; Segura Sequeira, D.; Barrantes-Madrigal, J.; Spínola Parallada, M.; Ramírez-Alán, Ó. Vegetation, bird and soundscape characterization: A case study in Braulio Carrillo National Park, Costa Rica. Biota Colomb. 2021, 22, 57–73. [Google Scholar] [CrossRef]
- Joo, W.; Gage, S.H.; Kasten, E.P. Analysis and interpretation of variability in soundscapes along an urban–rural gradient. Landsc. Urban Plan. 2011, 103, 259–276. [Google Scholar] [CrossRef]
- Patricelli, G.L.; Dantzker, M.S.; Bradbury, J.W. Differences in acoustic directionality among vocalizations of the male red-winged blackbird (Agelaius pheoniceus) are related to function in communication. Behav. Ecol. Sociobiol. 2007, 61, 1099–1110. [Google Scholar] [CrossRef]
- Otto, C.R.; Roth, C.L.; Carlson, B.L.; Smart, M.D. Land-use change reduces habitat suitability for supporting managed honey bee colonies in the Northern Great Plains. Proc. Natl. Acad. Sci. USA 2016, 113, 10430–10435. [Google Scholar] [CrossRef] [Green Version]
- Morawetz, L.; Köglberger, H.; Griesbacher, A.; Derakhshifar, I.; Crailsheim, K.; Brodschneider, R.; Moosbeckhofer, R. Health status of honey bee colonies (Apis mellifera) and disease-related risk factors for colony losses in Austria. PLoS ONE 2019, 14, e0219293. [Google Scholar] [CrossRef]
- Kulhanek, K.; Steinhauer, N.; Rennich, K.; Caron, D.M.; Sagili, R.R.; Pettis, J.S.; Ellis, J.D.; Wilson, M.E.; Wilkes, J.T.; Tarpy, D.R. A national survey of managed honey bee 2015–2016 annual colony losses in the USA. J. Apic. Res. 2017, 56, 328–340. [Google Scholar]
- Vijayakumar, K.; Neethu, T.; Shabarishkumar, S.; Nayimabanu Taredahalli, M.K.; Bhat, N.; Kuberappa, G. Survey, biology and management of greater wax moth, Galleria mellonella L. in Southern Karnataka, India. J. Entomol. Zool. Stud. 2019, 7, 585–592. [Google Scholar]
- Sohail, M.; Aqueel, M.A.; Ellis, J.D.; Afzal, M.; Raza, A.M. Seasonal abundance of greater wax moth (Galleria mellonella L.) in hives of western honeybees (Apis mellifera L.) correlates with minimum and maximum ambient temperature. J. Apic. Res. 2017, 54, 416–420. [Google Scholar] [CrossRef]
- Core, A.; Runckel, C.; Ivers, J.; Quock, C.; Siapno, T.; DeNault, S.; Brown, B.; DeRisi, J.; Smith, C.D.; Hafernik, J. A new threat to honey bees, the parasitic phorid fly Apocephalus borealis. PLoS ONE 2012, 7, e29639. [Google Scholar] [CrossRef] [PubMed] [Green Version]
- Strauss, U.; Pirk, C.W.W.; Dietemann; Crewe, R.M.; Human, H. Infestation rates of Varroa destructor and Braula coeca in the Savannah honeybee (Apis mellifera seutellata). J. Apic. Res. 2014, 53, 475–477. [Google Scholar] [CrossRef] [Green Version]
- Uthoff, C.; Homsi, M.N.; von Bergen, M. Acoustic and vibration monitoring of honeybee colonies for beekeeping-relevant aspects of presence of queen bee and swarming. Comput. Electron. Agric. 2023, 205, 107589. [Google Scholar] [CrossRef]
- Oldroyd, B.P. What’s killing American honey bees? PLoS Biol. 2007, 5, e168. [Google Scholar] [CrossRef] [Green Version]
- Cox-Foster, D.; VanEngelsdorp, D. Saving the honeybee. Sci. Am. 2009, 300, 40–47. [Google Scholar] [CrossRef]
- Celis-Murillo, A.; Deppe, J.L.; Allen, M.F. Using soundscape recordings to estimate bird species abundance, richness, and composition. J. Field Ornithol. 2009, 80, 64–78. [Google Scholar] [CrossRef]
- Morrison, C.; Auniņš, A.; Benkő, Z.; Brotons, L.; Chodkiewicz, T.; Chylarecki, P.; Escandell, V.; Eskildsen, D.; Gamero, A.; Herrando, S. Bird population declines and species turnover are changing the acoustic properties of spring soundscapes. Nat. Commun. 2021, 12, 6217. [Google Scholar] [CrossRef]
- Di, N.; Sharif, M.Z.; Hu, Z.; Xue, R.; Yu, B. Applicability of VGGish embedding in bee colony monitoring: Comparison with MFCC in colony sound classification. PeerJ 2023, 11, e14696. [Google Scholar] [CrossRef] [PubMed]
- Dicks, L.V.; Breeze, T.D.; Ngo, H.T.; Senapathi, D.; An, J.; Aizen, M.A.; Basu, P.; Buchori, D.; Galetto, L.; Garibaldi, L.A. A global-scale expert assessment of drivers and risks associated with pollinator decline. Nat. Ecol. Evol. 2021, 5, 1453–1461. [Google Scholar] [CrossRef] [PubMed]
- Espregueira Themudo, G.; Rey-Iglesia, A.; Robles Tascón, L.; Bruun Jensen, A.; da Fonseca, R.R.; Campos, P.F. Declining genetic diversity of European honeybees along the twentieth century. Sci. Rep. 2020, 10, 10520. [Google Scholar] [CrossRef]
- Pijanowski, B.; Napoletano, B.; Pieretti, N.; Krause, B.; Bernie, L.; Villanueva, L.; Dumyahn, S.; Farina, A. Sounscape ecology: The Science of Sound in the Landscape. Bioscience 2011, 61, 203–216. [Google Scholar] [CrossRef] [Green Version]
- Tarpy, D.R. Genetic diversity within honeybee colonies prevents severe infections and promotes colony growth. Proc. R. Soc. London Ser. B Biol. Sci. 2003, 270, 99–103. [Google Scholar] [CrossRef] [Green Version]
- Gardner, M.G.; Schönrogge, K.; Elmes, G.; Thomas, J. Increased genetic diversity as a defence against parasites is undermined by social parasites: Microdon mutabilis hoverflies infesting Formica lemani ant colonies. Proc. R. Soc. B Biol. Sci. 2007, 274, 103–110. [Google Scholar] [CrossRef] [Green Version]
- Sharif, M.Z.; Renjie, X.; Puswal, S. Foraging performance of honeybee (Apis mellifera) affected by food richness and experience. Uludağ Arıcılık Derg. Uludag Bee J. 2020, 20, 132–144. [Google Scholar] [CrossRef]
- Eskov, E. The Origin and Organization of the Bee Colony Apis mellifera L.; Cambridge Scholars Publishing: Newcastle upon Tyne, UK, 2019. [Google Scholar]
- Shostak, S.; Prodeus, A. Classification of the bee colony condition using spectral features. In Proceedings of the 2019 IEEE International Scientific-Practical Conference Problems of Infocommunications, Science and Technology (PIC S&T), Kyiv, Ukraine, 8–11 October 2019; pp. 737–740. [Google Scholar]
- Spangler, H.G. Do honey bees encode distance information into the wing vibrations of the waggle dance? J. Insect Behav. 1991, 4, 15–20. [Google Scholar] [CrossRef]


| Sections | Detail/Questions | Questions Type |
|---|---|---|
| Title of the Research and a note for the participants (experts) |
| - |
| Personal Data |
| (d) |
| (d) | |
| (a) | |
| (a) | |
| (d) | |
| (a) | |
| (a) | |
| (b) | |
| Research Questions |
| (c) |
| (c) | |
| (e) | |
| (e) |
| Score | Five-Point Scale | Unknown | ||||
|---|---|---|---|---|---|---|
| Factors | 1 | 2 | 3 | 4 | 5 | |
| Factor x | not important | a little important | important | very important | the most important | unknown |
| Confidence (repeated for every factor) | low | medium | high | unknown | ||
| Factors | Importance (IQR) | Confidence Score (IQR) | No. of Scorers | % Unknown | Confidence Category |
|---|---|---|---|---|---|
| Colony health | 4 (1) | 3 (0.75) | 11 | 9 | Well established |
| Swarming | 4 (0.75) | 3 (0) | 11 | 9 | Well established |
| Pests and pathogens | 3 (0) | 3 (1) | 11 | 27 | Well established |
| Predators attack | 3 (1) | 3 (0.75) | 11 | 9 | Well established |
| Pesticides | 4 (1) | 2.5 (1) | 11 | 27 | Well established |
| Weather condition | 3 (0.75) | 2 (0.5) | 11 | 36 | Established but incomplete |
| Environmental pollution | 4 (1) | 3 (1) | 11 | 18 | Well established |
| Land cover | 3 (1) | 1.5 (1) | 11 | 63 | Inconclusive |
| Land management | 3 (1) | 1.5 (1) | 11 | 63 | Inconclusive |
| Food availability | 3 (1) | 2 (1) | 11 | 27 | Established but incomplete |
| Spatiotemporal patterns | 3 (1) | 2 (1) | 11 | 36 | Established but incomplete |
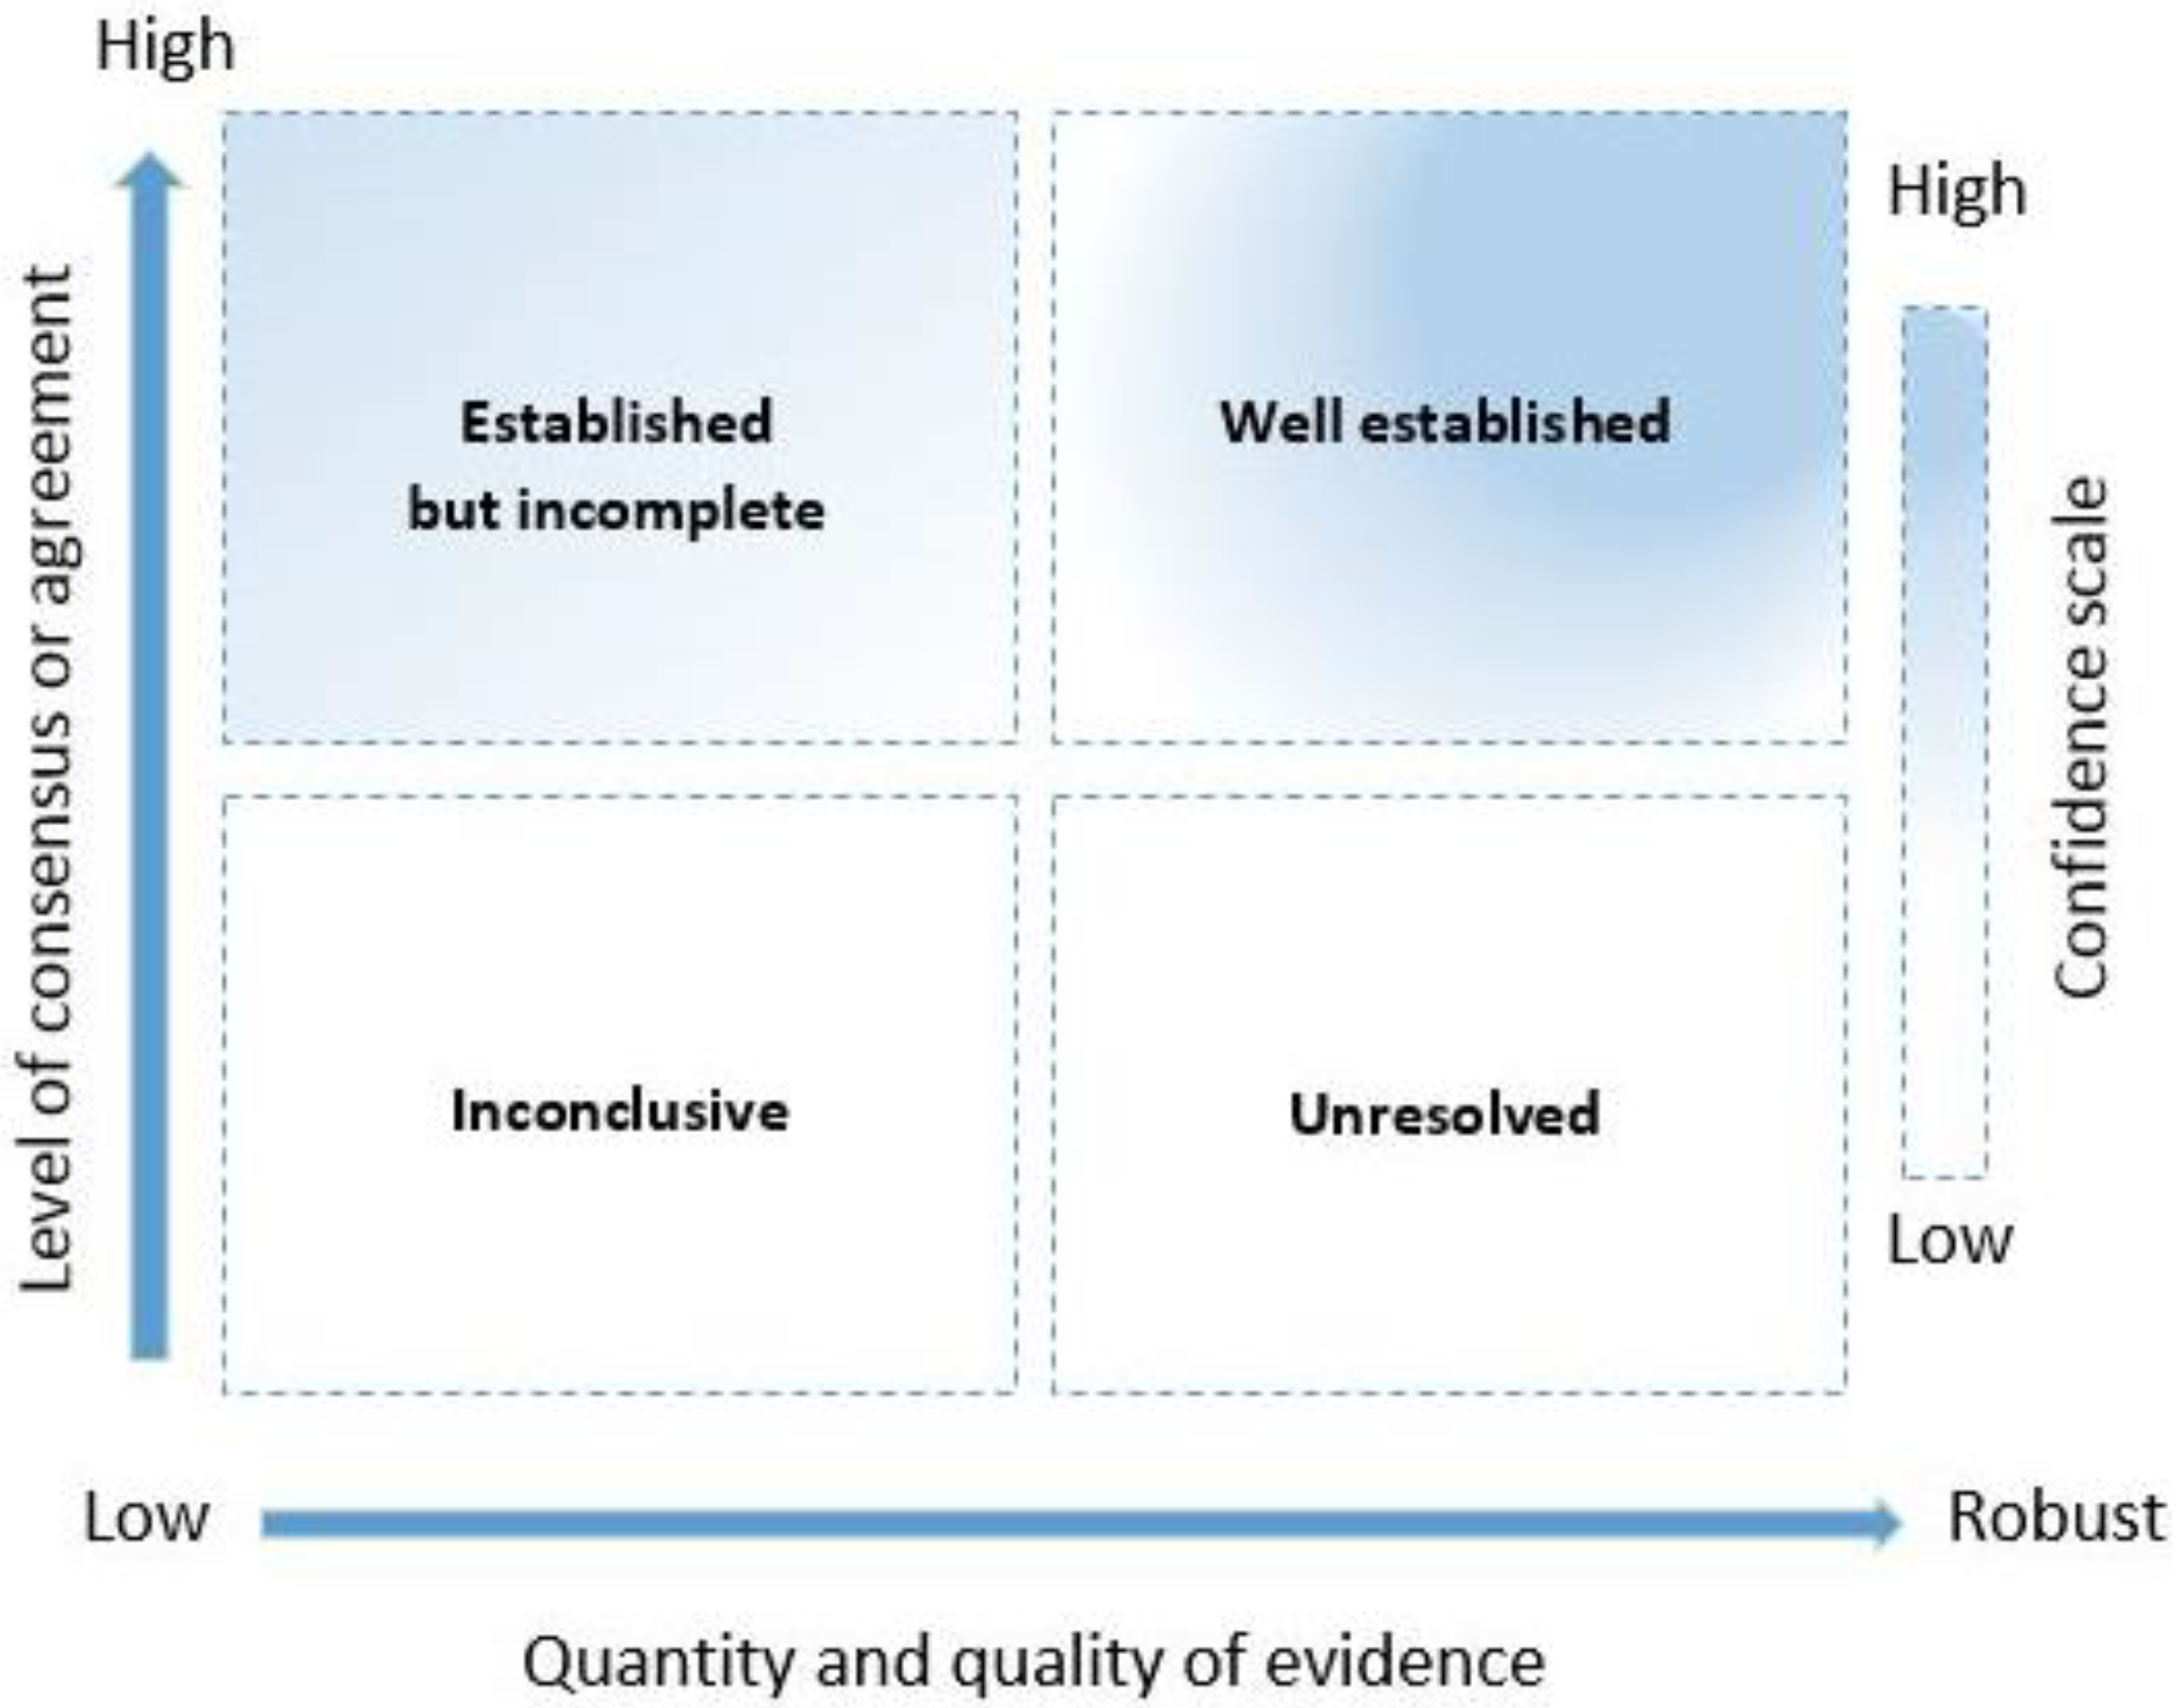
| Confidence Category | Definition | Threshold, Based on Scores of Confidence, % Unknown, and Consensus Indicator (IQR) |
|---|---|---|
| Well established | Robust evidence High agreement or a high level of consensus | Confidence score ≤ 66.7% or the proportion of unknowns is <40% IQR ≤ 1 |
| Established but incomplete | Low-quality evidence High agreement or a high level of consensus | Confidence score < 66.7% and the proportion of unknowns is ≥40% IQR ≤ 1 |
| Unresolved | Robust evidence Low agreement or low level of consensus | Confidence score ≥ 66.7% or the proportion of unknowns is <40% IQR > 1 |
| Inconclusive | Low-quality or no evidence Low agreement or low level of consensus | Confidence score < 66.7% or the proportion of unknown responses is <40% IQR > 1 |
| New Directions to Acoustically Monitoring Honeybee Colonies | Level of Agreement among the Experts (%) for Given Comments | ||
|---|---|---|---|
| Agree | Disagree | Neutral | |
| It can be predicted that environmental stressors (pollution, climate warming, and pesticides) may be monitored indirectly through the foragers’ sounds. It can also be guesstimated that forager sounds and recruitment success change when the bees are exposed to stressful events, since sound production [35] and information use [36] are modulated by neuropeptides, such as octopamine, which, in turn, are modulated by stressors [37]. | 70 | 0 | 30 |
| Researchers have yet to fully realize the potential of using bees sound to probe colony infestation with parasitic mites (Varroa destructor and other varroa mite species), and pests. | 100 | 0 | 0 |
| When a highly threatening predator (for instance, Vespa soror) comes close to the hive, colony workers start shrieking and generating various strong vibroacoustic signals at a frenzied speed and in parallel. Experts say that these vibroacoustic signals fuse or merge with Nasonov and venom gland volatiles generated by terrified colony mates and hornet-generated alarm signals that eavesdropping honeybees use to control their retaliation [23,38,39]. More investigations should be conducted to study the interaction between the level of threat and the above-mentioned gland volatiles (produced by the vibroacoustics of terrified colony workers) in those honeybee species that have not yet been checked for this particular phenomenon. In addition, explore some other frenetic predators that could be detected via the colony’s acoustic signals. Experts believe that if acoustic signatures or patterns of bee colonies are collected for all frenetic predators, it would be promising to generate a database as well as an efficient system to identify the presence or attack of a predator on a beehive. | 80 | 0 | 20 |
| Various soundscape indices, including the Acoustic Diversity Index (ADI), the Acoustic Evenness Index (AEI), the Bioacoustic Index (BI), and the Acoustic Entropy (H), are reported as important indices to determine richness or acoustic diversity as well as abundance in avian species [40,41,42,43]. So, it is likely that these indices can also be used to determine the diversity and abundance of honeybees buzzing in the environment at different spatiotemporal scales. When it comes to vocalizing animals, birds, or amphibians, it is true that soundscapes can reveal diversity. However, this is because soundscapes are described using metrics (based on spatiotemporal variations in frequency patterns, which are richer in cases of higher diversity of vocalizing species in the environment). The reviewers grasped and agreed on a critical point about how the soundscape is supposed to be measured for diversity within the environment of the hive, where the hive monitoring algorithm does not work very effectively. Researchers need to consolidate their efforts to examine if there is another way to localize genetic diversity within this noisy environment of the hive because intra- and interspecific differentiation by acoustic signaling plays an important role in the case of sympatric speciation [44]. Although honeybees flying in the environment/agriculture can be acoustically measured for diversity. | 90 | 0 | 10 |
| Acoustic properties of colony soundscapes can examine population size; this could assist researchers in digging deep into determining whether bees are surviving or collapsing (CCD) during a particular temporal scale. | 80 | 0 | 20 |
| Experienced forager bees may use sound to signal their nestmates for nectar quality, but more research is needed in this area. | 100 | 0 | 0 |
Disclaimer/Publisher’s Note: The statements, opinions and data contained in all publications are solely those of the individual author(s) and contributor(s) and not of MDPI and/or the editor(s). MDPI and/or the editor(s) disclaim responsibility for any injury to people or property resulting from any ideas, methods, instructions or products referred to in the content. |
© 2023 by the authors. Licensee MDPI, Basel, Switzerland. This article is an open access article distributed under the terms and conditions of the Creative Commons Attribution (CC BY) license (https://creativecommons.org/licenses/by/4.0/).
Share and Cite
Sharif, M.Z.; Di, N.; Yu, B. Honeybee (Apis spp.) (Hymenoptera: Apidae) Colony Monitoring Using Acoustic Signals from the Beehive: An Assessment by Global Experts and Our Feedback. Agriculture 2023, 13, 769. https://doi.org/10.3390/agriculture13040769
Sharif MZ, Di N, Yu B. Honeybee (Apis spp.) (Hymenoptera: Apidae) Colony Monitoring Using Acoustic Signals from the Beehive: An Assessment by Global Experts and Our Feedback. Agriculture. 2023; 13(4):769. https://doi.org/10.3390/agriculture13040769
Chicago/Turabian StyleSharif, Muhammad Zahid, Nayan Di, and Baizhong Yu. 2023. "Honeybee (Apis spp.) (Hymenoptera: Apidae) Colony Monitoring Using Acoustic Signals from the Beehive: An Assessment by Global Experts and Our Feedback" Agriculture 13, no. 4: 769. https://doi.org/10.3390/agriculture13040769