Article

Investigation of Fludioxonil Reduction Using Non-Thermal Atmospheric Plasma through Experimental Simulation

Institute of Plasma Technology, Korea Institute of Fusion Energy, 37 Dongjangsan-ro, Gunsan 54004, Republic of Korea
*
Author to whom correspondence should be addressed.
Agriculture 2023, 13(3), 727; https://doi.org/10.3390/agriculture13030727
Submission received: 27 February 2023 / Revised: 17 March 2023 / Accepted: 21 March 2023 / Published: 22 March 2023
(This article belongs to the Section Crop Protection, Diseases, Pests and Weeds)

Abstract

:
In this study, the effect of non-thermal atmospheric plasma (NTAP) treatment on the reduction of residual fludioxonil (C12H6F2N2O2, 4-(2,2-difluoro-1,3-benzodioxol-4-yl)-1H-pyrrole-3-carbonitrile) was investigated through experimental simulation. Fludioxonil is known for its high residual concentration on fruits and vegetables. To simulate residual fludioxonil reduction in the storage location prior to consumption of fruits or vegetables by consumers, we designed an experimental setup utilizing a gas distribution system and a cylindrical dielectric barrier discharge (DBD) plasma source. A cylindrical DBD plasma source was adopted to produce the plasma activated chemical species (O3). To evaluate the effect of plasma treatment on the reduction of residual fludioxonil, experiments were performed under three different conditions: varying concentrations and treatment times of O3, as well as the surface roughness of microscope slide glass. Based on the results, 10 min plasma treatment with an O3 concentration of 11.89 μL/L, which showed a 58.5% reduction rate, is recommended. The O3 concentration has a higher priority than the treatment time for reduction rates of residual fludioxonil.

1. Introduction

In a recent study, it was reported that the potential crop yield loss due to pre-harvest pests and diseases ranges from 20% to 40% [1]. Pesticides have been used as one of the most effective methods for pest control in order to reduce such pre-harvest losses. Pesticides are chemical materials used to prevent the growth of undesirable organisms such as fungi, weeds, or pests in agricultural fields. However, due to their potential toxicity to other organisms, pesticides need to be used properly to ensure the safety of humans, the food supply, and the environment. Nevertheless, as weed and pest resistance to pesticides has increased, the amounts and frequencies of pesticide use have also increased, leading to issues such as residual pesticides in crops [2].
Fludioxonil (C12H6F2N2O2, 4-(2,2-Difluoro-1,3-benzodioxol-4-yl)-1H-pyrrole-3-carbonitrile) is one of the most widely used fungicides that inhibits spore germination and stops mycelial growth against Botrytis, Monilinia, Sclerotinia, Rhizoctonia and Alternaria species [3,4,5]. This fungicide is known to not only have high residual concentrations on fruits and vegetables [6], but also exhibits high persistence in soils with a half-life of 200–300 days [7]. Moreover, it has been reported to have endocrine disruption potential, which is associated with breast cancer [8,9,10,11]. As mentioned earlier, fludioxonil has a high residual concentration in crops, particularly in fruits and vegetables that are commonly consumed by the general public. Therefore, research is needed to find appropriate methods to reduce residual amounts during storage and distribution after harvesting.
Physical-chemical methods and food processing are two conventional methods that have been used to reduce residual pesticides [12,13]. Physical-chemical methods, such as Fenton oxidation, bio-treatment, or TiO2 catalytic treatment, have been studied for the removal of pesticides that are soluble in aqueous solutions. However, using an aqueous method to treat crops can induce undesired microcracking on the surface of crops such as apples [14]. Food processing, such as peeling or hot water blanching, is also used as removal method for residual pesticides reduction. However, peeling or hot water blanching may have a negative effect on the crops, such as quality deterioration or thermal damage. Therefore, research on dry and non-thermal processing is needed to overcome the drawbacks of these conventional methods.
Non-thermal atmospheric plasma (NTAP) has been studied as an alternative method for reducing residual pesticides on crops in order to overcome the disadvantages of conventional methods [2,15,16,17,18,19,20,21,22]. Bai, et al. studied the degradation of organophosphorus (OP) pesticide induced by a 2-min treatment of oxygen plasma and found that oxygen plasma is suitable for reducing OP pesticide [15]. Misra, et al. showed that in-package non-thermal plasma is a novel technology for reducing pesticides, such as azoxystrobin, cyprodinil, fludioxonil, and pyriproxyfen, on strawberries [16]. They found that the levels of pesticides were decreased by a maximum of 69%, 45%, 71%, and 46%, respectively, with the conditions of 5 min of treatment time with 80 kV. Zhou, et al. reported the removal of residual OP pesticide on Lycium barbarum using gas-phase surface discharge plasma [21]. They observed that 99.8% of dichlorvos was removed from the fruit surface without compromising the quality of the food. These various studies have demonstrated that NTAP has the advantage of being able to configure the apparatus to allow for dry and non-thermal treatment for reducing residual pesticides on crops. Moreover, by effectively utilizing the advantage, we can also apply it to reduce residual pesticides through dry and non-thermal treatments in places like food storage. For instance, if residual pesticides on post-harvest crops can be reduced while they are stored in a particular space, such as a refrigerator, it will be more convenient to consume the crops safely by the general public.
In this study, we investigated the possibility of using NTAP activated chemical species as a reduction method for residual fludioxonil on post-harvest crops through experimental simulation. To simulate residual fludioxonil reduction in the storage location prior to consumption of fruits or vegetables by consumers, we designed an experimental setup utilizing a gas distribution system and a cylindrical dielectric barrier discharge (DBD) plasma source. We evaluated the reduction of residual pesticides based on three different factors: the concentration and treatment time of plasma activated chemical species, and the surface roughness of microscope slide glass. According to previous research, it has been found that the OH radical or O3 are effective in reducing residual pesticides [16]. Misra et al. investigated the reduction mechanism of residual fludioxonil using a total ion scan, which resulted in the detection of an unidentified peak at 6.51 min with a high abundance of 201 m/z ion fragment. Based on the results, they proposed a reaction pathway for the formation of the final product (2,2-difluorobenzo[d][1,3]dioxole-4-carboxylic acid) of fludioxonil, which is assigned to the peak at 6.51 min, and suggested that O3 plays a key role in the fludioxonil reduction mechanism, as the reaction is initiated by the conversion of the ‘1H-pyrrole-3-carbonitrile’ to a ‘5-dioxoprolidine-3-carbonitrile’ by O3. Therefore, O3 was chosen as the main plasma activated chemical species in this study. Based on the report that the antimicrobial effect of NTAP varies depending on the roughness of the fruit surface [23], we selected microscope glass slides with various degrees of roughness as a factor to investigate its correlation between NTAP and pesticide reduction. The results of the investigation aim to suggest the most efficient treatment conditions for reducing residual pesticides on post-harvest crops in a specific storage space, as mentioned earlier.

2. Experimental Preparation

The cylindrical DBD plasma source with a gas distribution system was used to produce plasma activated chemical species in this study. Ozone (O3) was selected as the plasma activated chemical species because it is a representative long-lived reactive oxygen species (ROS). Fludioxonil was coated on microscope slide glass samples with varying surface roughness, which were used as models for different types of agri-foods. Liquid chromatography–mass spectrometry (LC–MS/MS) analysis was conducted to evaluate the reduction of pesticide residue after plasma treatment.

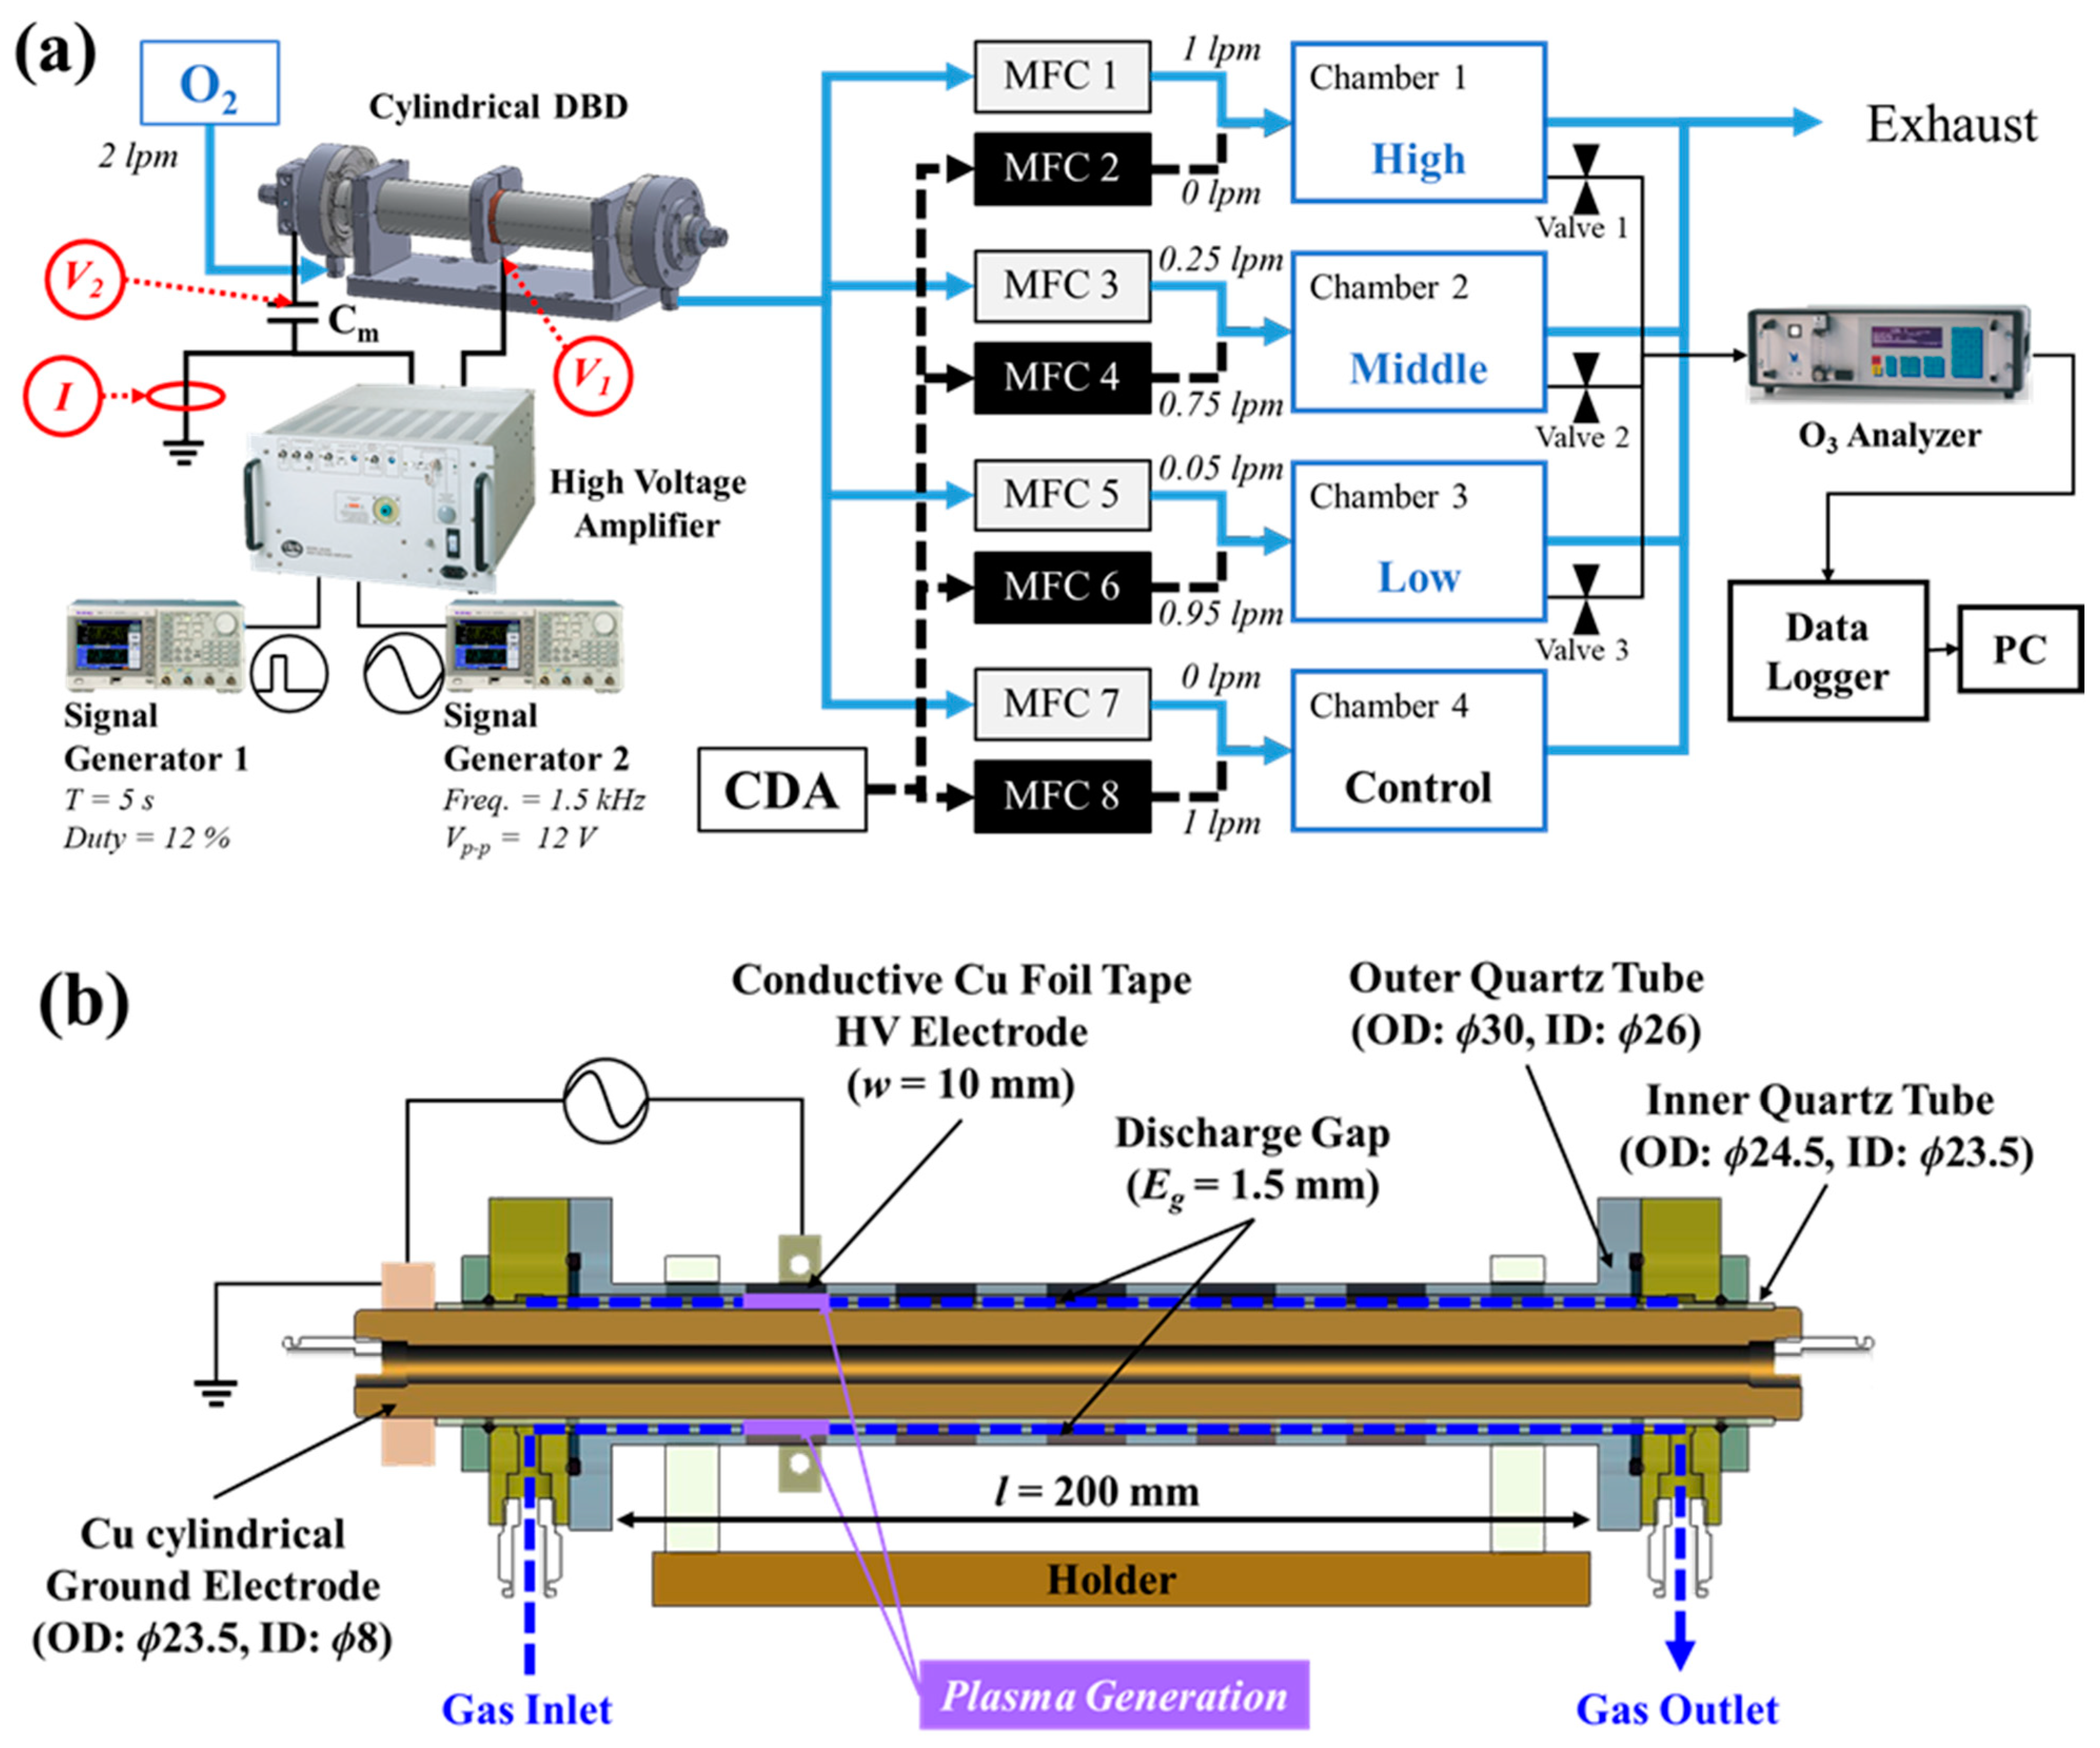
2.1. Cylindrical DBD Plasma Source Installed Gas Distribution System

The cylindrical atmospheric pressure DBD plasma source installed gas distribution system for residual pesticide reduction is depicted in Figure 1a. The system was used to set four different O3 concentration conditions simultaneously, which were non-treated, low, middle, and high value. The system consisted of a cylindrical DBD plasma source, a flow control part with eight mass flow controllers (MFCs), four different treatment chambers, an O3 analyzer, a data logger, and a PC.

2.1.1. Cylindrical DBD Plasma Source

The vertical cross-section diagram of the cylindrical DBD plasma source used in this study is shown in Figure 1b. The plasma source consists of an outer quartz tube (outer diameter (OD): ϕ30, inner diameter (ID): ϕ26) and an inner quartz tube (OD: ϕ24.5, ID: ϕ23.5), as well as a grounded cylindrical copper (Cu) electrode (OD: ϕ23.5, ID: ϕ8). A conductive Cu foil tape (width = 10 mm) was attached to the outside of the outer quartz tube, and high voltage was applied to the tape to generate the plasma in the discharge gap (Eg = 1.5 mm) between the outer and inner quartz tubes. Gas was injected into the discharge gap and ionized by the plasma. The total length of the cylindrical DBD plasma source, excluding the assembly parts at both ends, was 200 mm.
In order to maintain the desired O3 concentration conditions and ensure the durability of the DBD source, a sinusoidal waveform with a tripping signal of a certain period T was applied. The sinusoidal high voltage was applied to the cylindrical DBD plasma source using a high voltage amplifier (Trek-20/20C-HS, Trek Inc., Lockport, NY, USA) and two signal generators (AFG3021C, Tektronix, Beaverton, OR, USA). One generator was used to generate the sinusoidal signal with a frequency of 1.5 kHz and a voltage of 12 Vp-p, while the other was used as a tripping signal with a period of 5 s and a duty cycle of 12%. The generated signal was amplified up to 2000 times by the high voltage amplifier.
The applied voltage and the discharge current were measured using two different 1000:1 high voltage probes (P6015A, Tektronix, Beaverton, OR, USA) and a current probe (110A, Pearson Electronics, Palo Alto, CA, USA). One of the high voltage probes (V1) was connected to the conductive Cu foil electrode, and the other (V2) was connected to the dummy capacitor Cm, which has a capacitance of 2.16 nF for the calculation of dissipated power. The current probe was placed on the ground wire. The traces of the applied voltage and discharge current were recorded on an oscilloscope (DPO4104B-L, Tektronix, Beaverton, OR, USA).

2.1.2. Gas Distribution System Set-Up

In order to generate a high concentration of O3 dominant gas, high-purity oxygen (O2) gas with a purity of 99.995% was injected into the cylindrical DBD plasma source at a flow rate of 2 L/min. The O2 gas was then discharged as it passed through the discharge gap of the cylindrical DBD plasma source. The ejected gas was split into four treatment chambers, each with a volume of 20 L, at flow rates set by each of the eight mass flow controllers (MFCs). MFC 1, 3, 5, and 7 were set up to flow at rates of 1, 0.25, 0.05, and 0 L/min, respectively. To achieve the desired O3 concentrations in the treatment chambers, compressed dry air (CDA) with a purity of 99.99% was used as a dilution gas. CDA was injected into MFC 2, 4, 6, and 8 at flow rates of 0, 0.75, 0.95, and 1 L/min, respectively. The gas concentrations in the treatment chambers were evaluated using an O3 analyzer (GM-6000PRO, Anseros, Tübingen, Germany) and the measured concentrations were recorded by a data logger (GL-840, Graphtec, Yokohama, Japan) and saved on a PC.

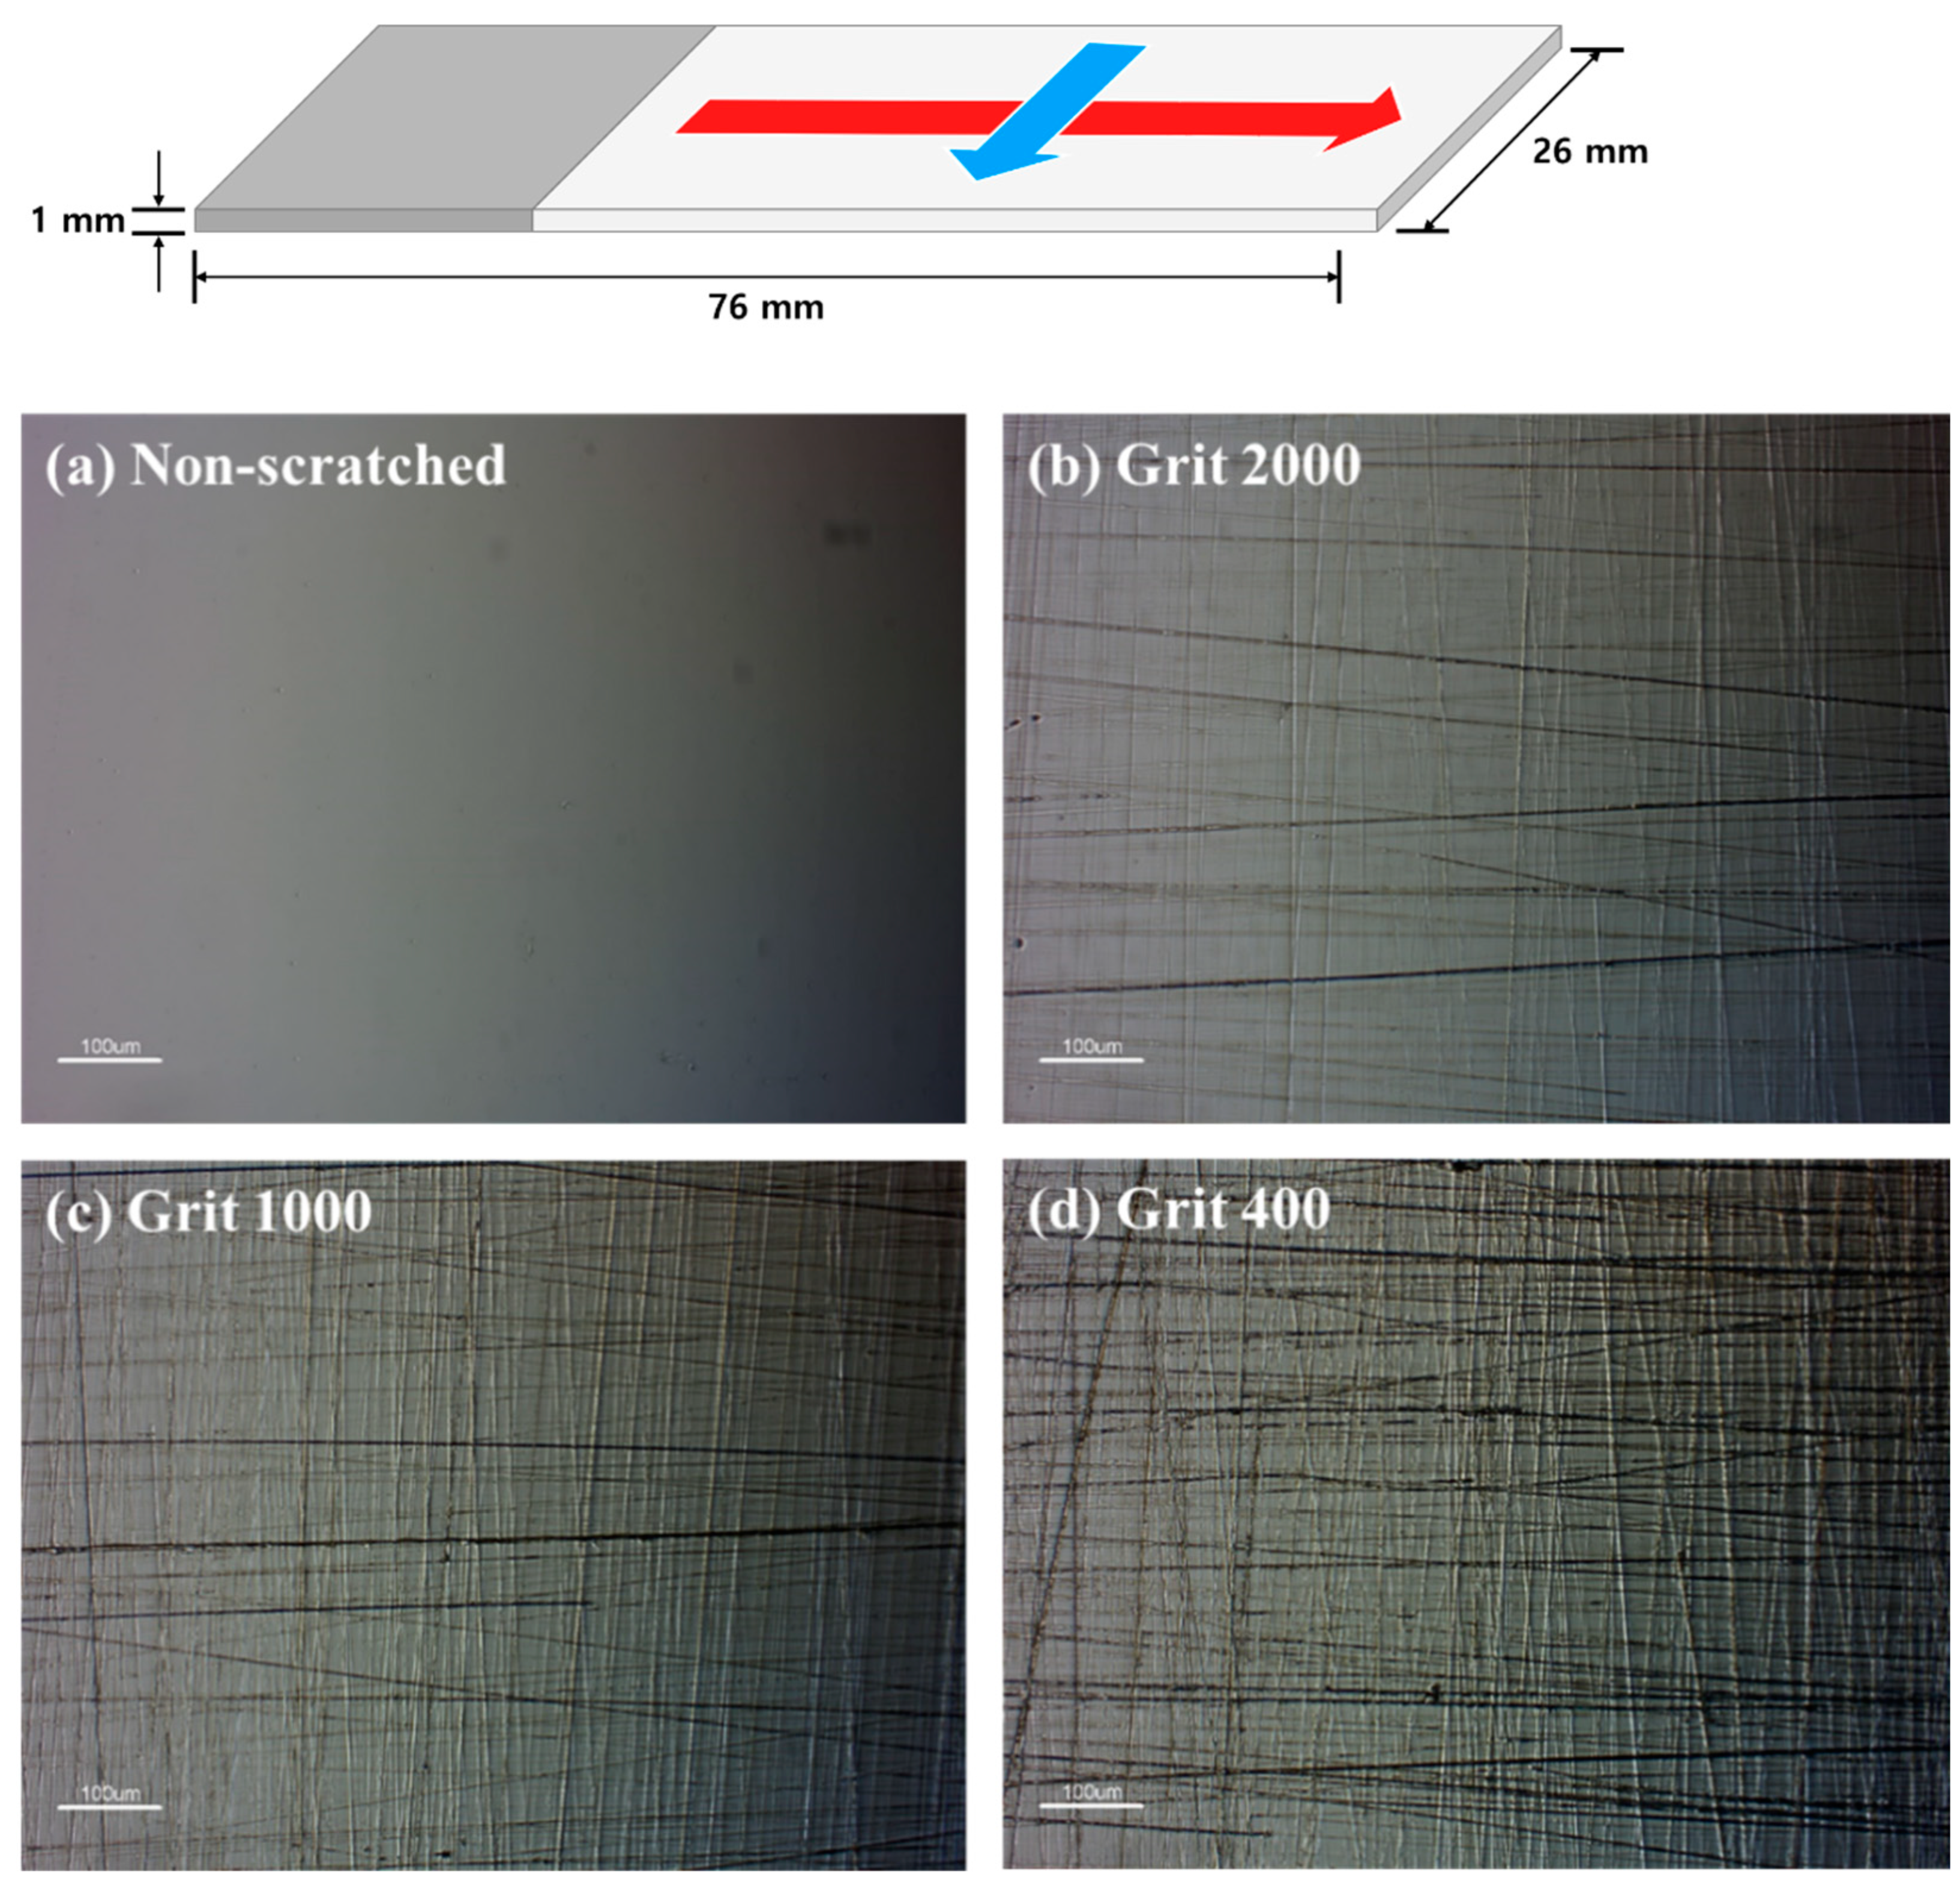
2.2. Microscope Slide Glass Samples with Different Surface Roughnesses

Microscope slide glass (Marienfeld, Lauda-Königshofen, Germany) samples were prepared as a model for different agri-foods that have different surface roughnesses. The samples had four different roughnesses and had a dimension of 76 × 26 × 1 mm3. Three different grits of silicon carbide sandpaper (Daesung, Sejong, Republic of Korea) were used to scratch the microscope slide glass samples, with grit values of 2000, 1000, and 400. The upper diagram in Figure 2 shows that the samples were scratched on their top side only with a constant force vertically and horizontally in both directions. A non-treated sample was also used as microscope slide glass itself for the experiment. Stereo microscope (Leica S8 APO, Leica Microsystems, Wetzlar, Germany) images of microscope slide glass samples were taken at the middle of the samples with the same magnification condition. The number of scratch lines per unit area increased as the grit value of the sandpaper decreased, indicating an increase in the surface roughness of the microscope slide glass. The lower images in Figure 2 show the different surface roughnesses of the microscope slide glass samples.
The surface roughness of the microscope slide glass samples was evaluated using the non-contact 3D surface profiler (NV-2300, Nanosystem, Daejeon, Republic of Korea) and the surface roughness Ra was calculated [24]. The averaged Ra values of the grit 2000, 1000, and 400 were 58.07 ± 6.84, 70.68 ± 14.21, and 107.37 ± 21.78 nm, respectively, as shown in Table 1 and Figure 2. A total of 40 microscope slide glass samples were scratched per surface roughness condition, and among them, 24 samples per surface roughness condition were selected for the experiment based on the average Ra value.

2.3. Pesticide Preparation and Analysis

The pesticide used in this study was fludioxonil (C12H6F2N2O2) and its standard (99.9% purity) was obtained from Kemidas Co., Ltd. (Gunpo, Republic of Korea). Fludioxonil was prepared in acetonitrile (ACN, CH3CN, Daejung Chemicals & Metals Co., Ltd., Siheung, Republic of Korea) at a concentration of 20 μg/mL. In order to obtain a homogeneous distribution of fludioxonil on the scratched microscope slides, the immersion method was adopted. The samples were dipped into the fludioxonil solution for 5 min and dried at room temperature for 3 min.
Each of the 20 L chambers contains a small 0.5 L chamber where samples coated with fludioxonil were positioned. The system was designed to permit the LID of the internal 0.5 L chamber to be opened from outside the 20 L chamber. Once the O3 concentration inside the 20 L chamber reached a desired level, the LID of the internal 0.5 L small chamber was opened to start the treatment. After plasma treatment, each treated sample was dissolved in 5 mL acetonitrile and collected in a 50 mL tube. The dissolving process was performed on the top-side of the scratched microscope slide glass sample using a micro pipet.
The treated fludioxonil samples were subjected to the QuEChERS method for LC–MS/MS (Agilent 1200 HPLC with Agilent 6410 triple-quadrupole MS, Santa Clara, CA, USA) analysis. The aim was to quantitatively analyze the reduction rate of plasma treated fludioxonil, using the conditions specified in Table 2. The analytical column used was a YMC-Pack pro C18 RS (150 × 3.0 mm I.D. S-3 μm, 8 nm, YMC, Kyoto, Japan). A 5 μL volume of the collected sample solvent was injected at a flow rate of 0.4 mL/min. The mobile phase contained 0.1% formic acid and 5 nM ammonium formate in water and ACN, with a ratio of 15:85. The analysis was performed in multiple reaction monitoring (MRM) mode.

2.4. Statistical Analysis

All experiments were repeated three times. The experimental results were subjected to a one-way analysis of variance (ANOVA) followed by Duncan’s multiple range test using SPSS statistics 24 software (SPSS Inc., Chicago, IL, USA) with a significance level of p < 0.05 to compare the effect of the O3 concentration and surface roughness on the reduction of fludioxonil. The results, depending on treatment times were analyzed using the student t-test. All data were presented in the form of mean ± standard deviation.

3. Experimental Results and Discussion

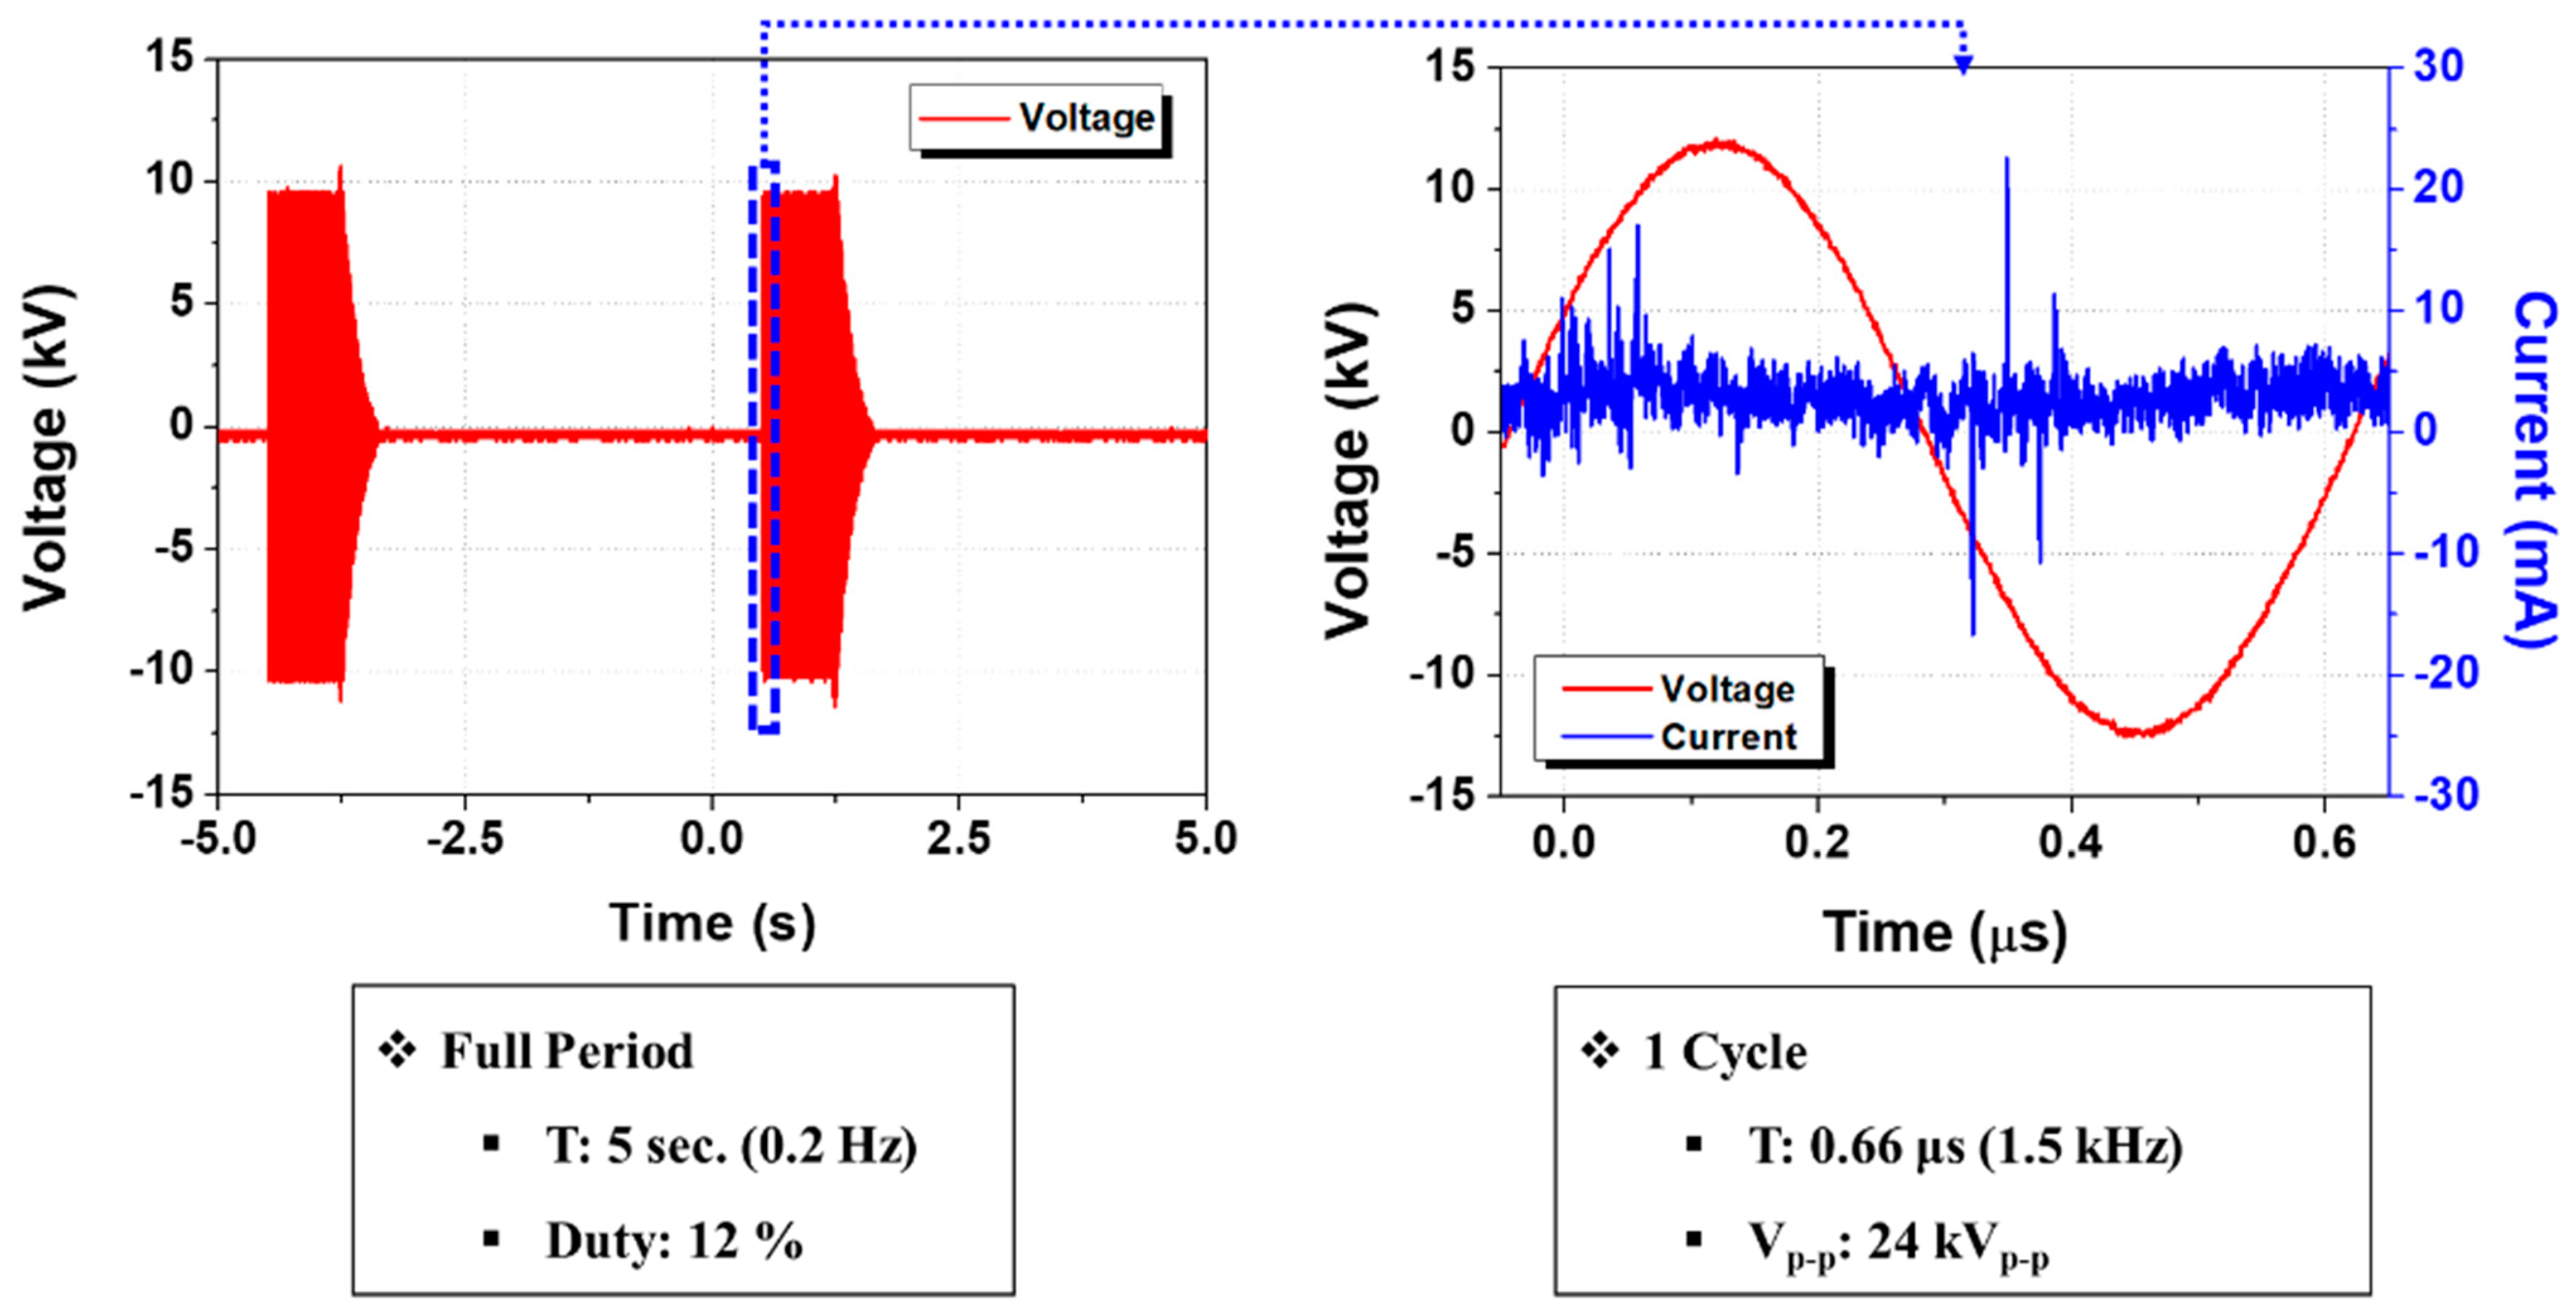
3.1. Characteristics of the Cylindrical DBD Plasma Source Installed Gas Distribution System

The electrical characteristics of the cylindrical DBD plasma source were measured, and the results are shown in Figure 3. The applied voltage (right side of Figure 3) had a frequency of 1.5 kHz and a voltage of 24 kVp-p and was applied to the high voltage conductive Cu foil tape electrode triggered by the trip signal (left side of Figure 3), which had a period of 5 sec (0.2 Hz) and a 12% duty cycle. The power dissipated by the cylindrical DBD plasma source was calculated using the Q-V curve method [25] based on the measured voltage of the dummy capacitor Cm. The calculated dissipated power was 2.36 W, but this value is not shown in the figure.
The measured three different O3 concentration conditions of three different treatment chambers (chamber 1, 2, and 3) are shown in Figure 4. The chamber 4, which was set for the control concentration condition, was excluded due to O3 concentration in chamber 4 not being detected. At the 40-min mark after plasma ignition, the High, Middle, and Low concentration conditions increased up to 44.5, 11.5, and 1.81 μL/L, respectively, and then remained stable without significant variation until the end of measurement. The values in the legend of the graph represent the averaged concentration value of each condition from 40 to 60 min. That values for the High, Middle, and Low conditions were 46.46, 11.89, and 1.85 μL/L, respectively. The treatment of the fludioxonil-coated microscope slide glass samples began after the treatment chambers were saturated with the desired three different O3 concentrations.

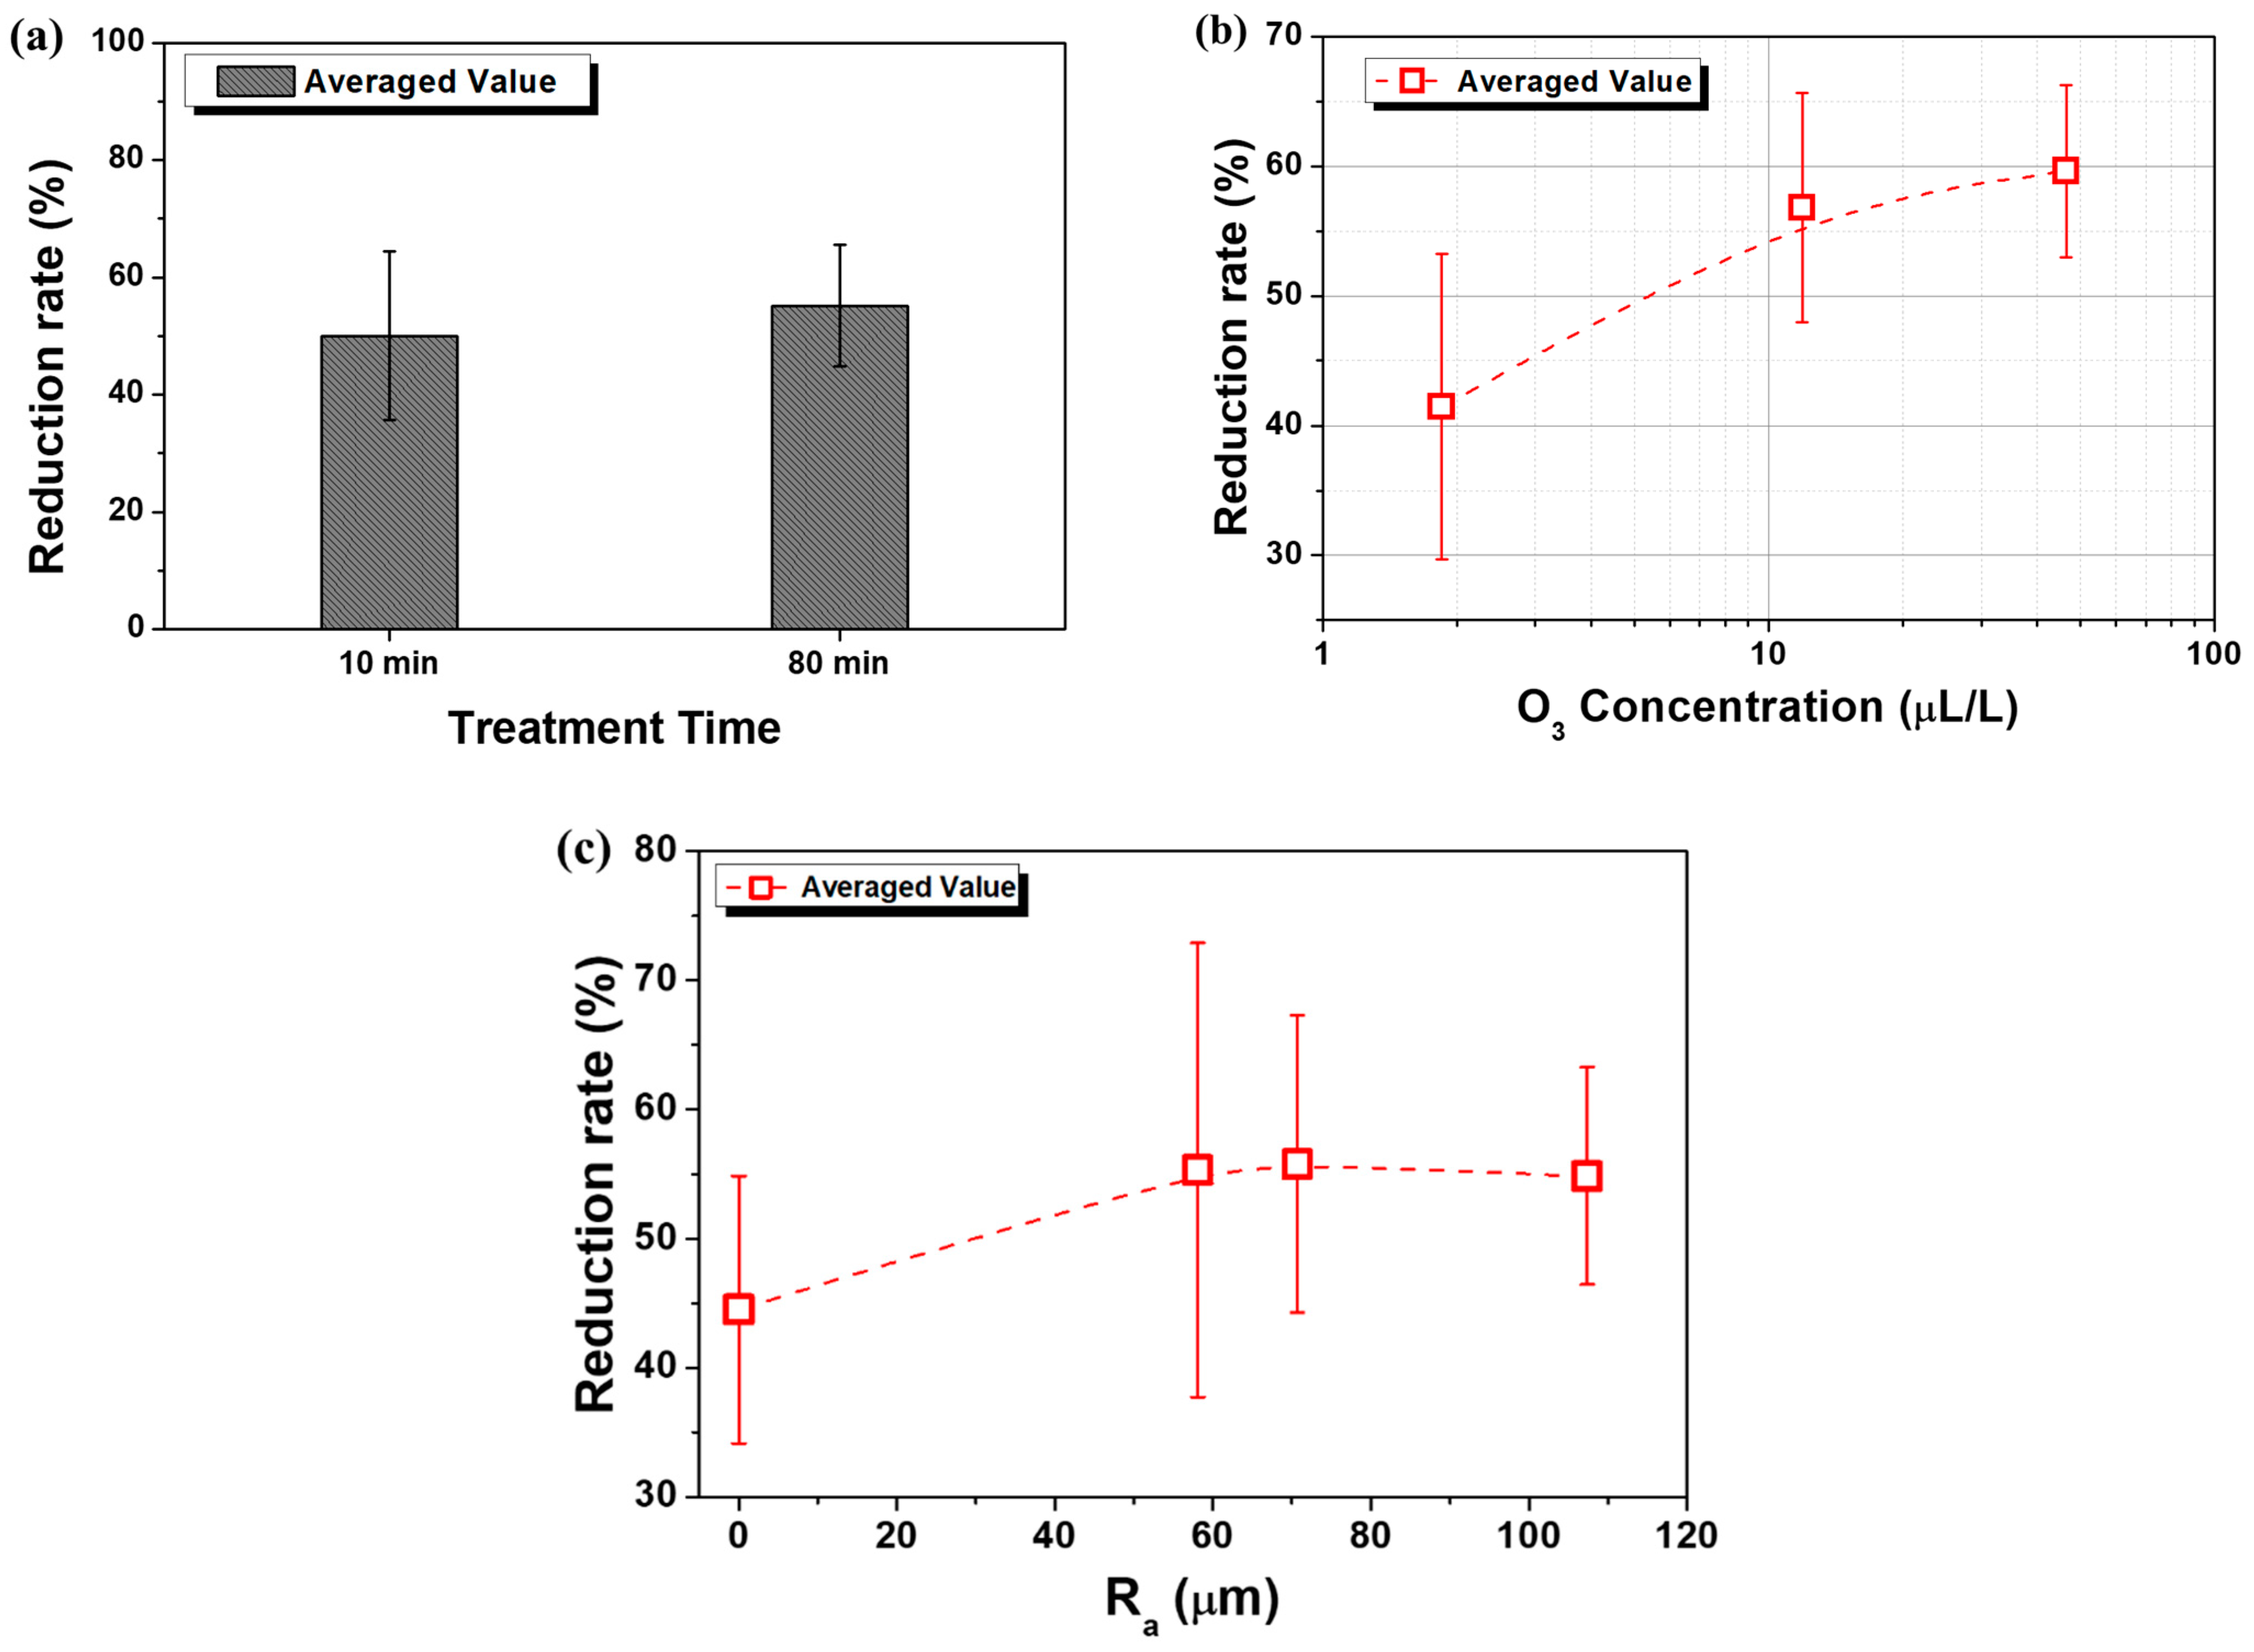
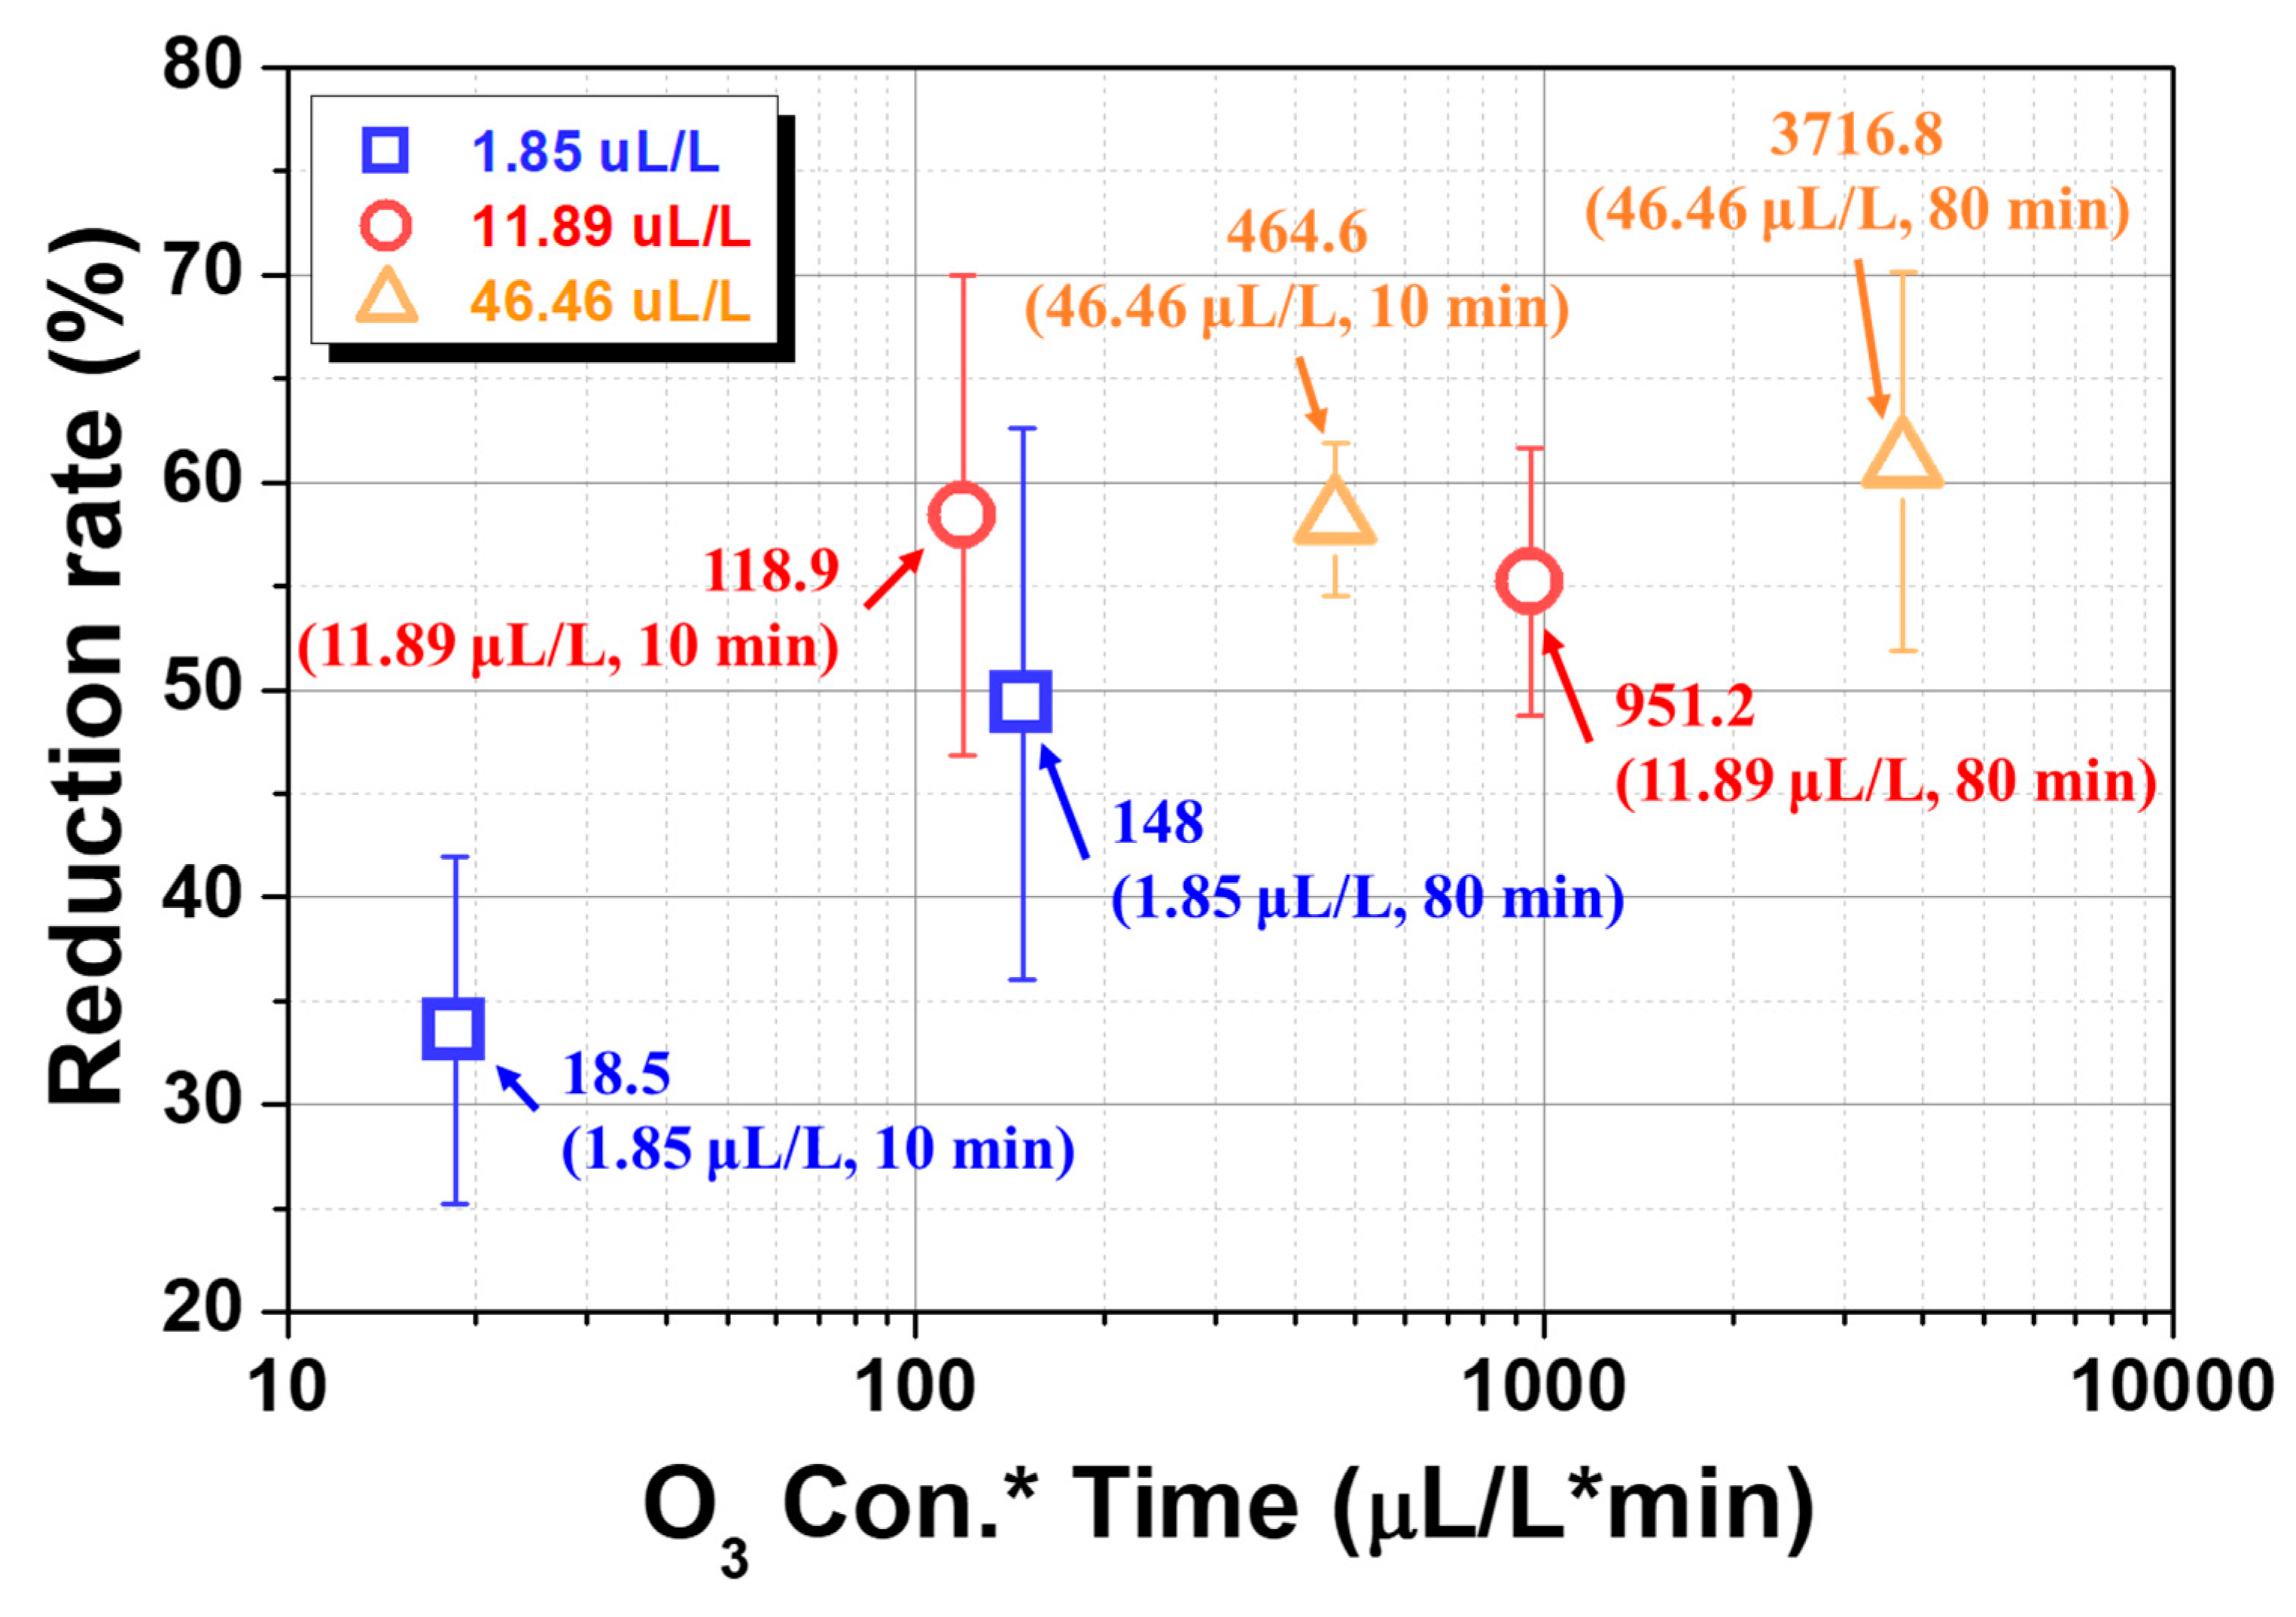
3.2. Reduction of Residual Pesticides on Microscope Slide Glass

Concentrations of plasma treated fludioxonil depending on different conditions were analyzed by LC–MS/MS and are depicted in Figure 5. The results showed that concentrations of fludioxonil were varied differently according to different conditions of O3 concentrations and surface roughness Ra, and treatment time. However, it was difficult to find significant differences in reduction rates depending on the treatment time. For example, at the conditions of 10 min treatment with an O3 concentration of 46.46 μL/L, the concentration of fludioxonil, which was coated on the sample that had a Ra value of 58.07 μm, decreased from 66 ± 1.98 to 27.8 ± 3.08 μg/L. At the condition of 80 min treatment, it decreased to 29.3 ± 5.86 μg/L, which showed a similar variation.
These results can be seen more clearly when classified by the averaged reduction rate depending on the different conditions as follows. In Figure 6a, averaged reduction rates according to treatment time are depicted. As shown in the results, the averaged reduction rates at the conditions of 10 and 80 min were 50.06 ± 14.4 and 55.18 ± 10.3%, respectively. The difference of reduction rates between the 10 and 80 min treatment conditions was only about 5%, and its significance probability was 0.254. Although treatment time was increased from 10 to 80 min, an increase of a factor of eight, no significant differences in reduction rates were observed between the two treatment time values.
Similarly, no significant differences in reduction rates were found between the conditions of Middle and High O3 concentrations. As O3 concentration was increased from 1.85 (Low) to 11.89 (Middle) μL/L, averaged reduction rates were increased from 41.45 ± 11.8 to 56.8 ± 8.8% and then reached up to 59.62 ± 6.6% at 46.46 (High) μL/L as shown in Figure 6b. A notable result was the difference in increase between Low-Middle and Middle-High O3 concentration conditions. The significance probability between the conditions of Low and Middle O3 concentrations was 0.001, however, between the conditions of Middle and High O3 concentrations was 0.519. Thus, the O3 concentration higher than about 11.89 μL/L is an overuse of plasma treatment reduction of fludioxonil under the conditions of room temperature and atmospheric pressure.
Figure 6c shows the averaged reduction rates depending on different Ra values. Fludioxonil was reduced as much as 44.5 ± 10.35, 55.32 ± 17.56, 55.79 ± 11.5, and 54.86 ± 8.4% at the Ra values of 0, 58.7, 70.68, and 107.37 μm, respectively. The significance probabilities of the averaged reduction rates between the 0 and 58.7 μm conditions was 0.031, however, between 58.7 and 70.68 μm was 0.007, and between 70.68 and 107.37 μm was 0.022. It was difficult to find significant differences depending on the surface roughness at the range from 58.7 to 107.37 μm. Contrary to previous research results [24] that showed the antimicrobial effect of NTAP varies depending on the surface roughness, we had difficulty observing significant changes in residual pesticide reduction rates according to surface roughness. The difference between the two studies is that the previous study used pre-made sandpaper as a modeled sample, while in this study, scratched microscope slide glasses were used. Further research is necessary to gain a more precise understanding of the underlying causes of these results.
In order to understand which factor has higher priority for reduction rates between treatment time and O3 concentration, the CT value (O3 concentration × Treatment time) was calculated and evaluated by statistical analysis.
As shown in Figure 7, as the CT value was increased, the trend of reduction rates increased. However, according to the statistical analysis of results, it was hard to find significant differences among CT values except the condition of 18.5 μL/L·min. The reduction rate at the CT value of 118.9 μL/L·min was 58.5%, which was a 6.4 times higher O3 concentration than that of the 18.5 μL/L·min condition. It was also about 9% higher than that of the CT value of 148 μL/L·min, which had a treatment time eight times longer than that of the 18.5 μL/L·min condition. Therefore, at the same CT value, O3 concentration has a higher priority than treatment time in reducing residual fludioxonil.

4. Conclusions

The effects of non-thermal atmospheric pressure (NTAP) dielectric barrier discharge (DBD) plasma on the reduction of residual fludioxonil was investigated through experimental simulation. Fludioxonil is known for its high residual concentration on fruits and vegetables. To simulate residual fludioxonil reduction in the storage location prior to consumption of fruits or vegetables by consumers, an experimental setup which consisted of a gas distribution system and a cylindrical DBD plasma source was used. In order to evaluate the effects of plasma treatment on the reduction of fludioxonil, three different factors were analyzed: treatment time; concentration of O3; and surface roughness of microscope slide glass.
  • The surface roughness does not have a significant impact on the reduction efficiency of fludioxonil.
  • A 10 min treatment is sufficient to reduce residual fludioxonil.
  • An amount of 11.89 μL/L of ozone is sufficient to reduce residual fludioxonil.
  • At the same CT value (O3 concentration × treatment time), O3 concentration has higher priority than treatment time to reduction rates of residual fludioxonil.
Based on the results, plasma treatment with a treatment time of 10 min and an O3 concentration of 11.89 μL/L is recommended, and O3 concentration is a higher priority than treatment time in reducing residual fludioxonil. Further research based on these results is necessary to develop plasma technology that enables continuous reduction of residual pesticides during the storage stage before consumers consume crops.

Author Contributions

Conceptualization, S.E., S.H.J. and S.R.; methodology, S.E. and S.R.; software, J.L.; validation, S.E.; formal analysis, S.E.; investigation, S.E., J.L., J.-S.S., J.W.Y., H.J. and S.R.; resources, S.E. and J.-S.S.; data curation, S.E.; writing—original draft preparation, S.E.; writing—review and editing, S.E., J.L., S.H.J. and S.R.; visualization, S.E.; supervision, S.R.; project administration, S.R.; funding acquisition, S.R. All authors have read and agreed to the published version of the manuscript.

Funding

This research was supported by the R&D Program of “Plasma Advanced Technology for Agriculture and Food (EN2325)” through the Korea Institute of Fusion Energy (KFE) funded by the Government funds, Republic of Korea.

Institutional Review Board Statement

Not applicable.

Data Availability Statement

Not applicable.

Conflicts of Interest

The authors declare no conflict of interest.

References

  1. Popp, J.; Pető, K.; Nagy, J. Pesticide Productivity and Food Security. A Review. Agron. Sustain. Dev. 2013, 33, 243–255. [Google Scholar] [CrossRef]
  2. Wang, S.; Wang, J.; Wang, T.; Li, C.; Wu, Z. Effects of Ozone Treatment on Pesticide Residues in Food: A Review. Int. J. Food Sci. Technol. 2019, 54, 301–312. [Google Scholar] [CrossRef]
  3. Cabras, P.; Angioni, A.; Garau, V.L.; Melis, M.; Pirisi, F.M.; Minelli, E.V.; Cabitza, F.; Cubeddu, M. Fate of Some New Fungicides (Cyprodinil, Fludioxonil, Pyrimethanil, and Tebuconazole) from Vine to Wine. J. Agric. Food Chem. 1997, 45, 2708–2710. [Google Scholar] [CrossRef]
  4. Lassalle, Y.; Nicol, É.; Genty, C.; Bourcier, S.; Bouchonnet, S. Structural Elucidation and Estimation of the Acute Toxicity of the Major UV-Visible Photoproduct of Fludioxonil—Detection in Both Skin and Flesh Samples of Grape. J. Mass Spectrom. 2015, 50, 864–869. [Google Scholar] [CrossRef] [PubMed]
  5. Kilani, J.; Fillinger, S. Phenylpyrroles: 30 Years, Two Molecules and (Nearly) No Resistance. Front. Microbiol. 2016, 7, 2014. [Google Scholar] [CrossRef] [PubMed] [Green Version]
  6. Orton, F.; Rosivatz, E.; Scholze, M.; Kortenkamp, A. Widely Used Pesticides with Previously Unknown Endocrine Activity Revealed as in Vitro Antiandrogens. Environ. Health Perspect. 2011, 119, 794–800. [Google Scholar] [CrossRef] [Green Version]
  7. Alexandrino, D.A.M.; Mucha, A.P.; Almeida, C.M.R.; Carvalho, M.F. Microbial Degradation of Two Highly Persistent Fluorinated Fungicides—Epoxiconazole and Fludioxonil. J. Hazard. Mater. 2020, 394, 122545. [Google Scholar] [CrossRef]
  8. Teng, Y.; Manavalan, T.T.; Hu, C.; Medjakovic, S.; Jungbauer, A.; Klinge, C.M. Endocrine Disruptors Fludioxonil and Fenhexamid Stimulate MiR-21 Expression in Breast Cancer Cells. Toxicol. Sci. 2013, 131, 71–83. [Google Scholar] [CrossRef]
  9. Durjava, M.K.; Kolar, B.; Arnus, L.; Papa, E.; Kovarich, S.; Sahlin, U.; Peijnenburg, W. Experimental Assessment of the Environmental Fate and Effects of Triazoles and Benzotriazole. ATLA Altern. Lab. Anim. 2013, 41, 65–75. [Google Scholar] [CrossRef]
  10. Jia, M.; Wang, Y.; Wang, D.; Teng, M.; Yan, J.; Yan, S.; Meng, Z.; Li, R.; Zhou, Z.; Zhu, W. The Effects of Hexaconazole and Epoxiconazole Enantiomers on Metabolic Profile Following Exposure to Zebrafish (Danio Rerio) as Well as the Histopathological Changes. Chemosphere 2019, 226, 520–533. [Google Scholar] [CrossRef]
  11. Wang, Y.; Xu, C.; Wang, D.; Weng, H.; Yang, G.; Guo, D.; Yu, R.; Wang, X.; Wang, Q. Combined Toxic Effects of Fludioxonil and Triadimefon on Embryonic Development of Zebrafish (Danio Rerio). Environ. Pollut. 2020, 260, 114105. [Google Scholar] [CrossRef] [PubMed]
  12. Wu, J.; Luan, T.; Lan, C.; Hung Lo, T.W.; Chan, G.Y.S. Removal of Residual Pesticides on Vegetable Using Ozonated Water. Food Control 2007, 18, 466–472. [Google Scholar] [CrossRef]
  13. Kaushik, G.; Satya, S.; Naik, S.N. Food Processing a Tool to Pesticide Residue Dissipation—A Review. Food Res. Int. 2009, 42, 26–40. [Google Scholar] [CrossRef]
  14. Khanal, B.P.; Chen, H.; Straube, J.; Knoche, M. Surface Moisture Increases Microcracking and Water Vapour Permeance of Apple Fruit Skin. Plant Biol. 2021, 23, 74–82. [Google Scholar] [CrossRef] [PubMed]
  15. Bai, Y.; Chen, J.; Yang, Y.; Guo, L.; Zhang, C. Degradation of Organophosphorus Pesticide Induced by Oxygen Plasma: Effects of Operating Parameters and Reaction Mechanisms. Chemosphere 2010, 81, 408–414. [Google Scholar] [CrossRef] [Green Version]
  16. Pankaj, S.K.; Misra, N.N.; Walsh, T.; Bourke, P.; Cullen, P.J.; O’Regan, F. In-Package Nonthermal Plasma Degradation of Pesticides on Fresh Produce. J. Hazard. Mater. 2014, 271, 33–40. [Google Scholar] [CrossRef] [Green Version]
  17. Heo, N.S.; Park, T.J.; Park, J.Y.; Lee, M.-K.; Lee, S.J.; Kim, G.W. Microbial Inactivation and Pesticide Removal by Remote Exposure of Atmospheric Air Plasma in Confined Environments. J. Biosci. Bioeng. 2014, 117, 81–85. [Google Scholar] [CrossRef]
  18. Misra, N.N. The Contribution of Non-Thermal and Advanced Oxidation Technologies towards Dissipation of Pesticide Residues. Trends Food Sci. Technol. 2015, 45, 229–244. [Google Scholar] [CrossRef] [Green Version]
  19. Dorraki, N.; Mahdavi, V.; Ghomi, H.; Ghasempour, A. Elimination of Diazinon Insecticide from Cucumber Surface by Atmospheric Pressure Air-Dielectric Barrier Discharge Plasma. Biointerphases 2016, 11, 041007. [Google Scholar] [CrossRef]
  20. de Souza, L.P.; Faroni, L.R.D.A.; Heleno, F.F.; Pinto, F.G.; de Queiroz, M.E.L.R.; Prates, L.H.F. Ozone Treatment for Pesticide Removal from Carrots: Optimization by Response Surface Methodology. Food Chem. 2018, 243, 435–441. [Google Scholar] [CrossRef]
  21. Zhou, R.; Zhou, R.; Yu, F.; Xi, D.; Wang, P.; Li, J.; Wang, X.; Zhang, X.; Bazaka, K.; Ostrikov, K. Removal of Organophosphorus Pesticide Residues from Lycium Barbarum by Gas Phase Surface Discharge Plasma. Chem. Eng. J. 2018, 342, 401–409. [Google Scholar] [CrossRef] [Green Version]
  22. López, M.; Calvo, T.; Prieto, M.; Múgica-Vidal, R.; Muro-Fraguas, I.; Alba-Elías, F.; Alvarez-Ordóñez, A. A Review on Non-Thermal Atmospheric Plasma for Food Preservation: Mode of Action, Determinants of Effectiveness, and Applications. Front. Microbiol. 2019, 10, 622. [Google Scholar] [CrossRef] [PubMed]
  23. Bhide, S.; Salvi, D.; Schaffner, D.W.; Karwe, M.V. Effect of Surface Roughness in Model and Fresh Fruit Systems on Microbial Inactivation Efficacy of Cold Atmospheric Pressure Plasma. J. Food Prot. 2017, 80, 1337–1346. [Google Scholar] [CrossRef] [PubMed]
  24. Bhushan, B. Modern Tribology Handbook: Volume One: Principles of Tribology; CRC Press LLC: Boca Raton, FL, USA, 2001; ISBN 9780849377877. [Google Scholar]
  25. Manley, T.C. The Electric Characteristics of the Ozonator Discharge. Trans. Electrochem. Soc. 1943, 84, 83–96. [Google Scholar] [CrossRef]
Figure 1. (a) Cylindrical atmospheric pressure DBD plasma source installed gas distribution system for residual fludioxonil reduction and (b) Vertical cross-section diagram of cylindrical DBD plasma source used in this study.
Agriculture 13 00727 g001
Figure 2. Schematic diagram of scratching the microscope slide glass sample by sandpaper (upper) and their Stereo Microscope images (lower) (a) Non-scratched (b) Grit 2000 (c) Grit 1000 (d) Grit 400.
Agriculture 13 00727 g002
Figure 3. Applied sinusoidal waveform which has 24 kVp-p and 1.5 kHz was tripped by trip signal which has 0.2 Hz and 12% duty.
Agriculture 13 00727 g003
Figure 4. O3 concentration variations depending on different plasma treatment conditions that were measured. The values in the legend of the graph represent the averaged concentration value of each condition from 40 to 60 min.
Agriculture 13 00727 g004
Figure 5. Measured concentrations of plasma treated fludioxonil depending on different Ra values, O3 concentrations and (a) 10 min and (b) 80 min treatment time conditions are depicted. All values represent the mean and error bars represent the standard deviation of three repeated measurements.
Agriculture 13 00727 g005
Figure 6. Averaged reduction rates of plasma treated fludioxonil depending on different (a) treatment times, (b) O3 concentrations, and (c) Ra values. All values represent the mean and error bars represent the standard deviation of three repeated measurements.
Agriculture 13 00727 g006
Figure 7. Averaged reduction rates of plasma treated fludioxonil according to the calculated CT value. All values represent the mean, and error bars represent the standard deviation of three repeated measurements.
Agriculture 13 00727 g007
Table 1. Measured surface roughness Ra of microscope slide glass samples depending on different grit values of sandpaper were listed. a–c Different letters indicate a significant difference (p < 0.05).
Grit ValueRa (μm)
AverageStd. Dev.
Non-scratchedN/AN/A
200058.07 a±6.84
100070.68 b±14.21
400107.37 c±21.78
Table 2. LC–MS/MS conditions for quantitative analysis of the reduction rate of plasma treated fludioxonil.
InstrumentAgilent 1200 HPLC with Agilent 6410 triple-quadrupole MS
ColumnYMC-Pack Pro C18 RS 150 × 3 mm i.d S-3 µm, 8 nm, YMC, Japan
Mobile PhaseA: Water with 0.1% Formic Acid and 5 mM Ammonium Formate
B: ACN with 0.1% Formic Acid and 5 mM Ammonium Formate
Gradient TimeTime (min)A (%)B (%)
01585
101585
Flow Rate0.4 mL/minIonspray Voltage4 kV
Column Temperature40 °CNebulizer Gas Pressure40 psi
Injection Volume5 μLGas Flow10 L/min
Ionization ModeESI PositiveGas Temperature300 °C
Scan TypeMRMRun Time10 min
Disclaimer/Publisher’s Note: The statements, opinions and data contained in all publications are solely those of the individual author(s) and contributor(s) and not of MDPI and/or the editor(s). MDPI and/or the editor(s) disclaim responsibility for any injury to people or property resulting from any ideas, methods, instructions or products referred to in the content.

