Article

Evaluation of Agricultural Green Development Based on Gini Coefficient and Hesitation Fuzzy Multi-Attribute Decision-Making: The Case of China

1
College of Shipping Economics and Management, Dalian Maritime University, Dalian 116026, China
2
Collaborative Innovation Center for Transport Studies, Dalian Maritime University, Dalian 116026, China
3
School of Economics and Management, Yantai University, Yantai 264005, China
*
Author to whom correspondence should be addressed.
Agriculture 2023, 13(3), 699; https://doi.org/10.3390/agriculture13030699
Submission received: 13 February 2023 / Revised: 11 March 2023 / Accepted: 13 March 2023 / Published: 17 March 2023
(This article belongs to the Special Issue Green and Sustainable Agricultural Ecosystem)

Abstract

:
In order to systematically solve the problem of formulating agricultural green development strategies based on the four dimensions of policy green, industry green, science and technology green, and awareness green, this paper uses the method of combining the Gini coefficient with hesitation fuzzy multi-attribute decision-making to carry out research. The research shows that: (1) The three most critical factors affecting the green development of agriculture are “consumers’ awareness of purchasing green agricultural products”, “investment in the construction of rural ecological civilization” and “the number of farmers’ scientific and technological training”, and the corresponding index weights are 0.12, 0.1 and 0.1, respectively. (2) There are differences in policy, industry, science and technology, and consciousness in the green development of agriculture. The green development of policy shows an obvious upward trend. The industrial green development shows a relatively gentle upward trend. The green development of science and technology showed rapid growth from 2011 to 2017, and the growth slowed down in the following two years and showed a downward trend in 2020. The awareness of green development shows a relatively stable upward trend. (3) The green development of agriculture is jointly driven by the relevant interests of the supply side, the demand side, and the regulator, and the demand side’s requirements for high-quality agricultural products become a stronger driving force for the green development of agriculture. The change in the consciousness and thinking of agricultural product producers on the supply side has become the basis for the green development of agriculture, and the implementation of government policies has become an important guarantee for the green development of agriculture. The innovation of this paper is to build an evaluation index system including government, consumers, farmers’ awareness of multiple subjects, government policies at all levels, industrial production status, and agricultural production technology. At the same time, we build an evaluation model that can comprehensively analyze quantitative and qualitative indicators. In view of the need for a holistic analysis of the agricultural system in the study of agricultural green development, future studies will include air pollution emissions and agricultural transport services in the evaluation model to improve the scientific and universal model.

1. Introduction

China is the most populous country in the world, with a population of 1412 million in 2020, and is also a major agricultural country in the world. The sustainable development of agriculture provides a basic guarantee for the high-quality development of China’s economy and society [1]. The road of agricultural green development is an inevitable requirement for realizing agricultural modernization, high-quality quantification, and sustainability in China [2]. Therefore, it is urgent and important to evaluate the level of agricultural green development in China under the new environmental background.
As soon as the concept of green agricultural development was put forward, it was widely studied by all sectors of society, including the concept, connotation, principles, evaluation measures, influencing factors, paths, and measures of green agricultural development [3,4,5]. Among them, the research on the evaluation of agricultural green development level mainly focuses on the following aspects: analysis of key influencing factors of agricultural green development, main problems faced by agricultural green development, construction of evaluation model of agricultural green development, and feasible path of agricultural green development. First, the existing research has carried out research on the key influencing factors of agricultural green development in different regions such as farms, counties, cities, provinces, and regions. The farm is a new type of agricultural operation subject in China. The green production degree of the national farm shows regional differences. The green development of the ecological farm is affected by both endogenous and exogenous factors. Among the endogenous factors, the personal characteristics of the person in charge of the farm and the production and operation characteristics of the farm have a significant impact. Among the exogenous factors, the green production subsidies of the government and the quality control characteristics of regulators have a significant impact. The study points out that it is of great significance for the green development of ecological farms to pay attention to the improvement of environmental protection and health awareness of agricultural practitioners, the improvement of human capital level, the promotion of innovative green production technologies, and the sustainability of green production incentives [6,7,8]. The research on the influencing factors of green agricultural development in counties mainly focuses on production, ecology, life, resources, environment, technology, policy, and other dimensions. The research points out that the main driving factors of green agricultural development are different in counties with different industrial characteristics, and natural factors have a significant driving role in green agricultural development in environmental resource-based counties, policy factors play a significant role in driving counties with farmers with green production autonomy as the core, and technology factors play a significant role in driving counties with a good resource base, high-quality employees, and government support [9,10,11]. The research on agricultural green development at the municipal level is more targeted, including the analysis of influencing factors on farmers’ enthusiasm for green production, the analysis of influencing factors on farmers’ adoption of green production technologies, the analysis of the impact of risk uncertainty on agricultural green development, and the analysis of influencing factors on agricultural green development based on the perspective of the tripartite game between government, farmers, and consumers [12,13,14,15,16]. The research on influencing factors of agricultural green development at the provincial level is more inclined to analyze from the overall perspective of provincial agricultural development, including the impact of the overall coordination of resources, environment, and economy within the province on agricultural green development, the impact of different agricultural development models on agricultural green development, and the impact of market, social services, production technology, business entity capacity, green production efficiency and other factors on agricultural green development [17,18,19]. The analysis of influencing factors of agricultural green development at the regional level includes research on Northeast China, the Yangtze River Economic Belt, the Yellow River Basin, Bohai Rim Region, Beijing Tianjin Hebei Region, and other regions. The influencing factors can be divided into three types: economic factors, social factors, and natural factors. The research points out that international trade, information communication, economic development, resource conservation, balanced development, and other factors play an important role in promoting the coordinated development of agricultural green among regions [20,21,22,23,24]. Secondly, combing the existing studies, it is found that the main problems faced by China’s agricultural green development are concentrated on resource utilization, environmental impact, economic effect, production efficiency, human resources, and other aspects, and the main obstacles faced by agricultural green development in different regions are heterogeneous, so targeted policy measures should be taken according to the actual development situation in different regions [18,25,26,27]. Third, existing studies on the evaluation of agricultural green development can be divided into four types: quantitative modeling, qualitative modeling, quantitative-qualitative modeling, and regression modeling. Quantitative modeling methods include the entropy method, entropy-TOPSIS method, structural equation, and principal component analysis [2,12,28,29]. Qualitative modeling methods include hierarchical analysis, DEMATE, and Q-methodology [10,19,30,31]. Quantitative-qualitative modeling includes the AHP-entropy method and comprehensive evaluation method [32], and regression modeling methods include the SFA model, variable fuzzy pattern recognition model, and gray relational model [20,33,34]. Fourth, the feasible paths of agricultural green development proposed by existing studies mainly revolve around innovating the concept of agricultural green development, building the foundation of agricultural green development, creating the integration, and development of the whole agricultural industry chain, strengthening rural vocational education, improving the agricultural ecological environment, enhancing agricultural production capacity, promoting the popularization and application of agricultural technologies, and improving the agricultural production guarantee system [35,36,37,38].
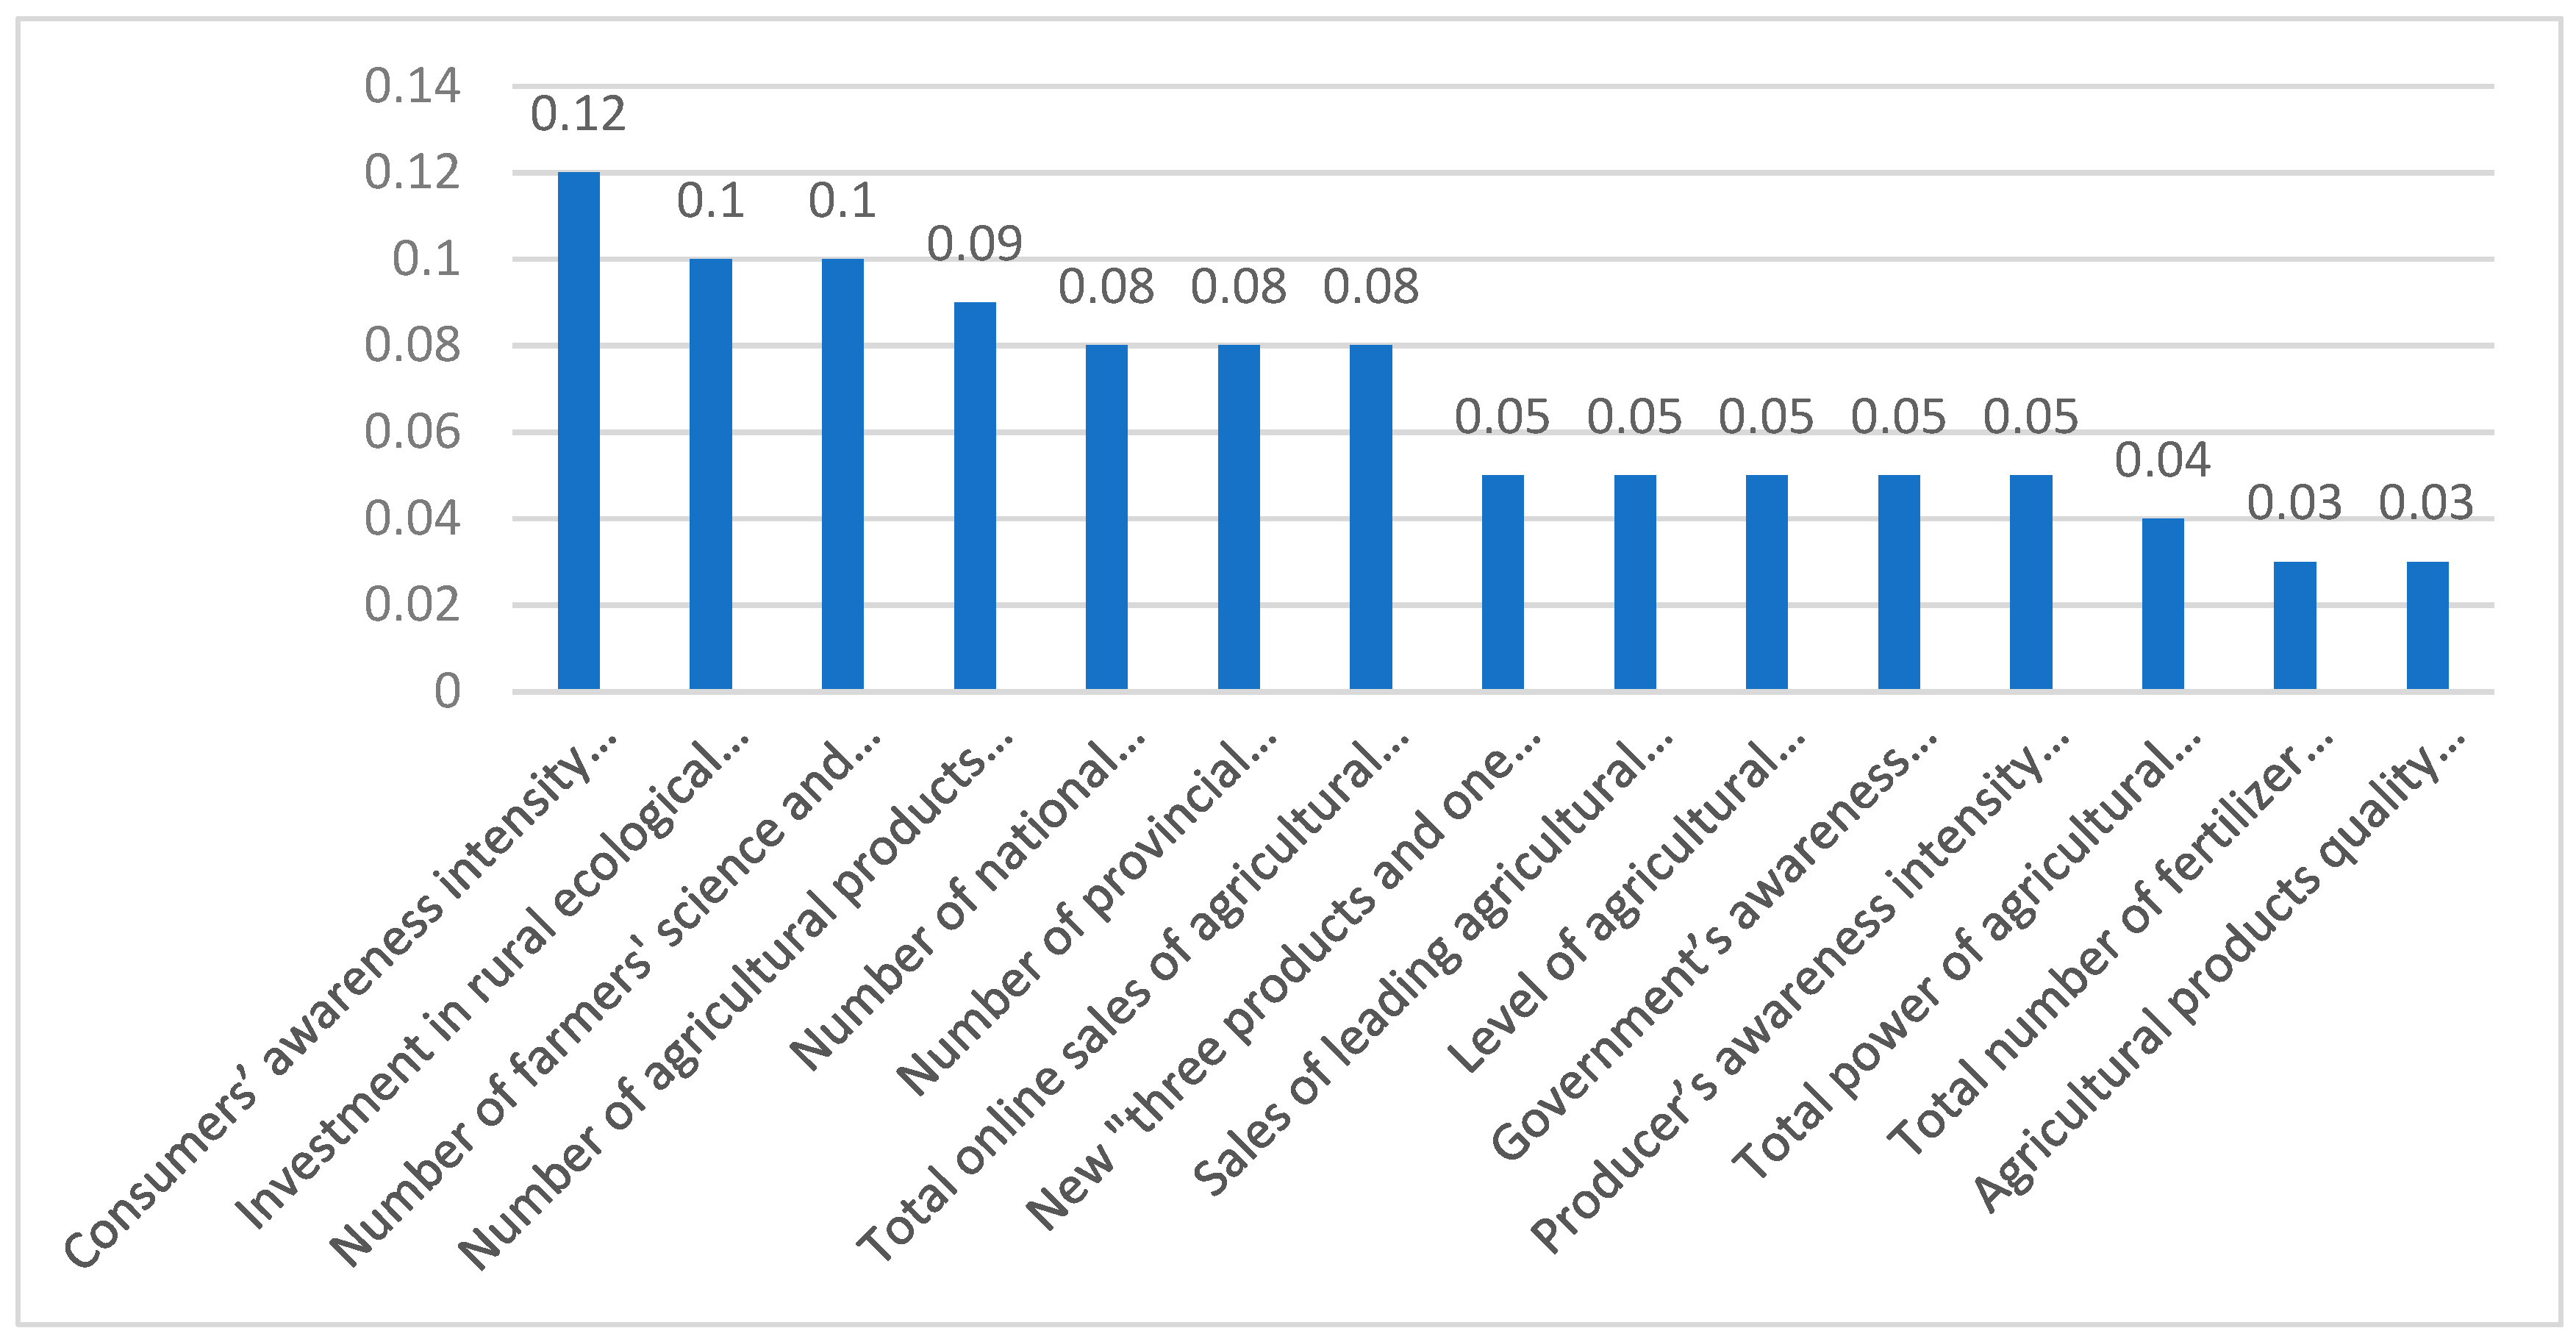
The analysis of the existing literature shows that there are two main problems in the evaluation studies of agricultural green development: first, the existing studies on the influencing factors of agricultural green development lack systematic analysis of the service consciousness of government departments, the health consciousness of consumers, and the green consciousness of producers, which is crucial to the comprehensive analysis of China’s agricultural green development in the context of the new era. Secondly, the existing research on agricultural green development evaluation focuses on a single quantitative evaluation model or qualitative evaluation model in terms of methodology, and fewer methods integrate quantitative and qualitative indicators, and the existing integrated evaluation methods assign separate weights to quantitative and qualitative indicators and then use mathematical methods for averaging, which does not place quantitative and qualitative indicators in the same system and cannot assign weights from the overall perspective of the indicator system, which has a certain influence on the comprehensive analysis of the level of agricultural green development. In view of this, there are two innovative key technical points in this study, one is to construct an evaluation index system that includes the awareness of multiple subjects of government, consumers, farmers, government policies at all levels, industrial production status, and agricultural production technology. The second is to construct an evaluation model that can synthesize and analyze quantitative and qualitative indicators.
Through sorting out relevant documents, it is found that there are 26 methods to deal with multi-attribute and multi-standard decision-making problems, including AHP, TOPSIS, VIKOR, and ANP, which are widely used in engineering, environmental sciences technology, water resources, and energy fuels and other fields [39]. The hesitant fuzzy multiple attribute decision-making method is based on the theory of interval number divergence and interval number comparative likelihood, and can effectively deal with the multi-value problem of single-element affiliation, which shows obvious advantages in the comprehensive treatment of the problem of fusion of quantitative-type data and interval-type data by constructing hesitant fuzzy sets [40]. The Gini coefficient method is a classical quantitative-type index screening method that can effectively distinguish the evaluation ability of the index [
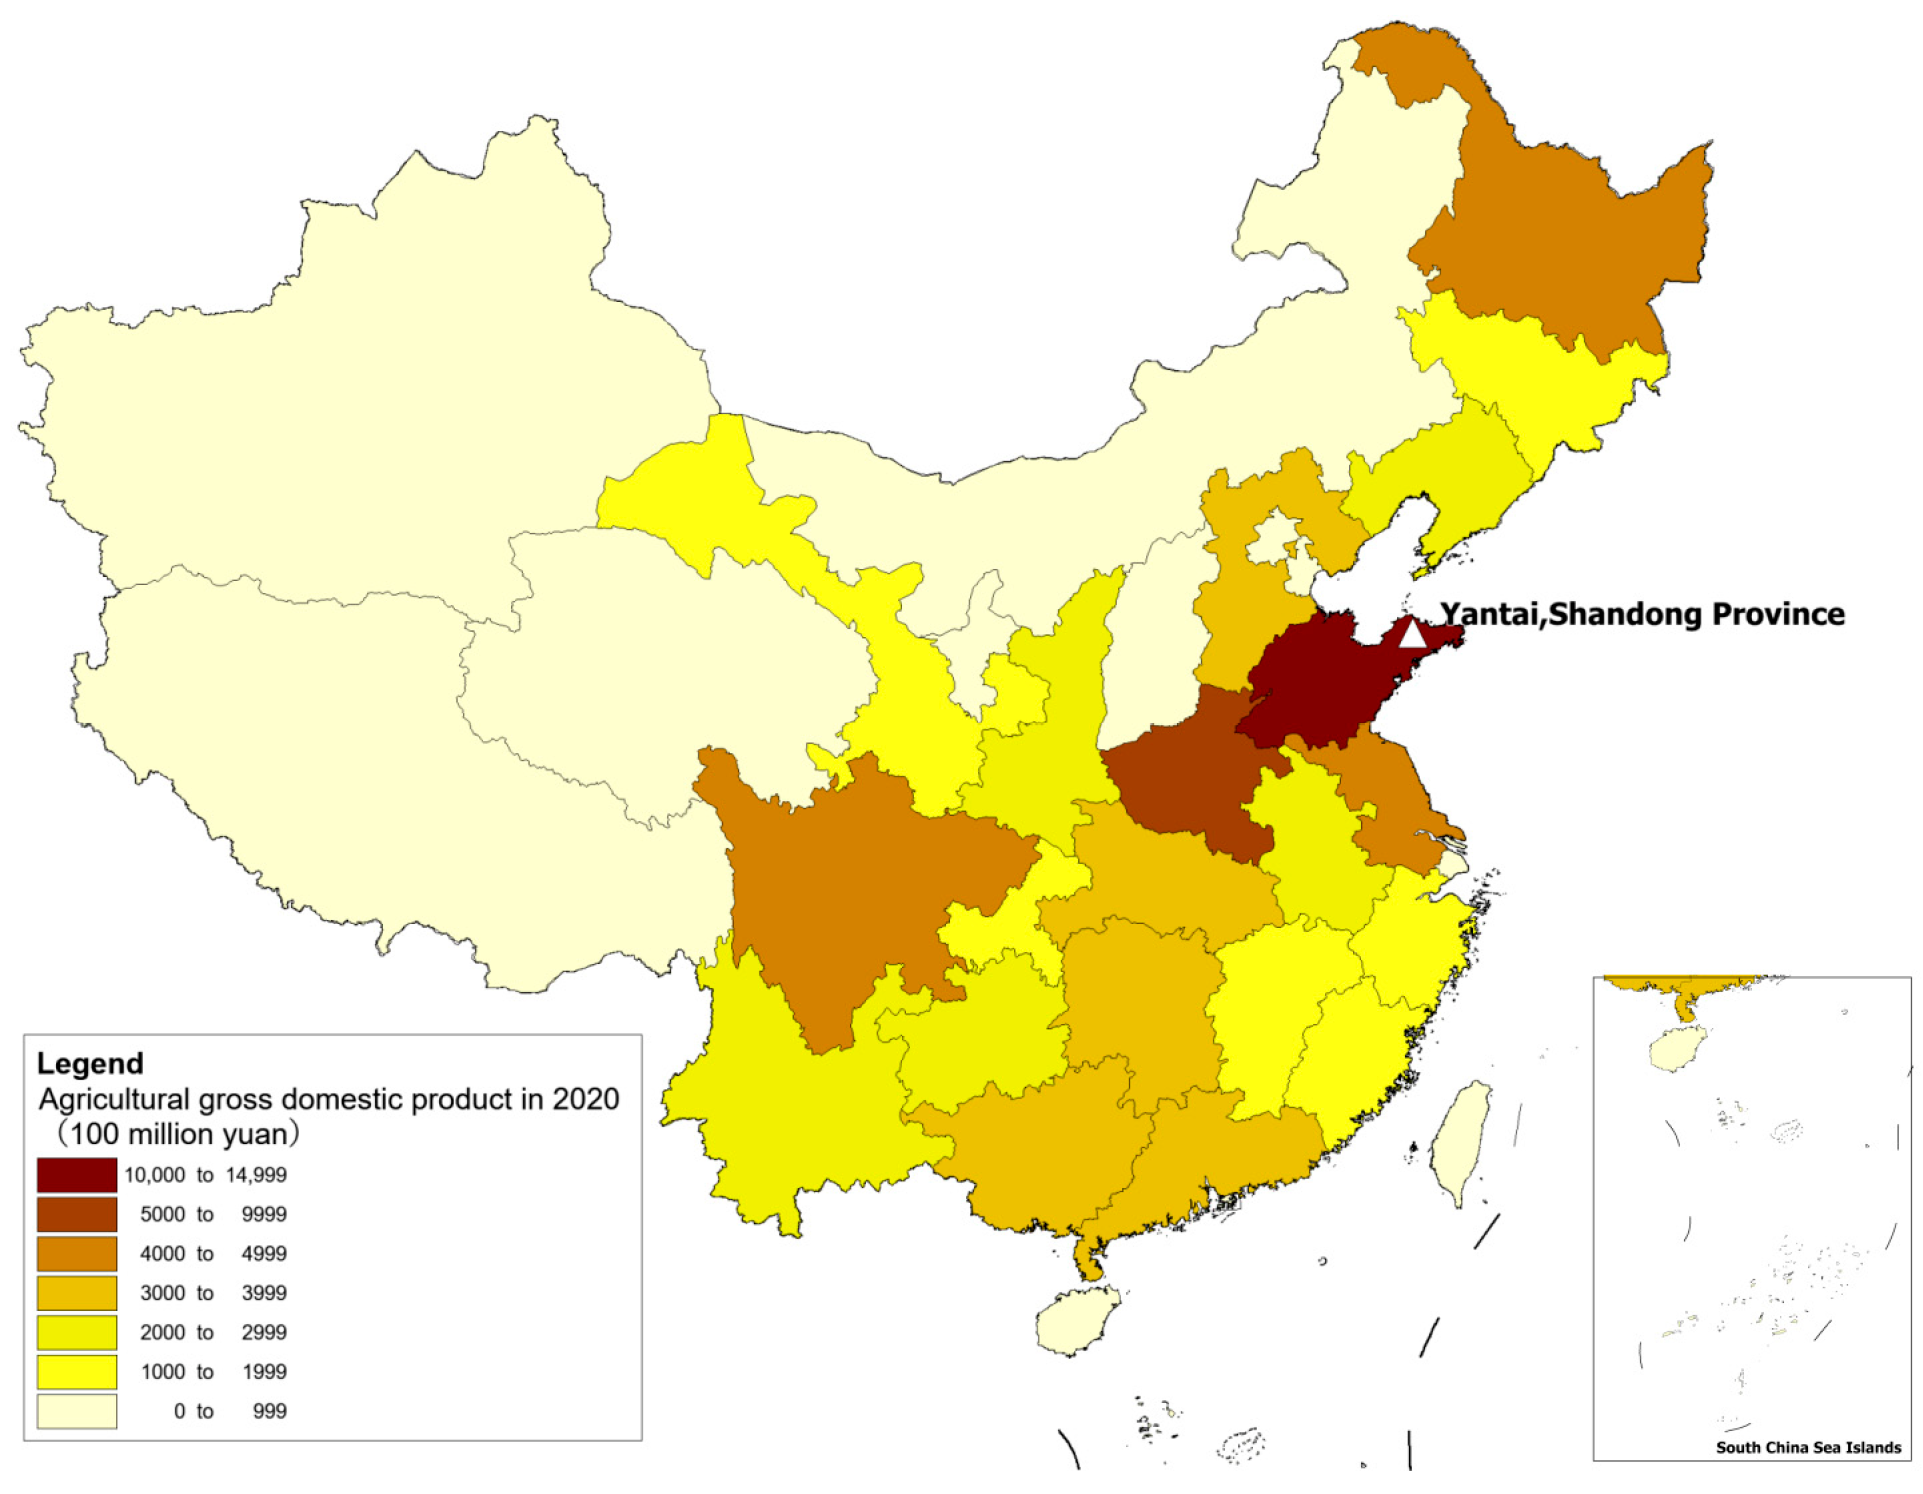
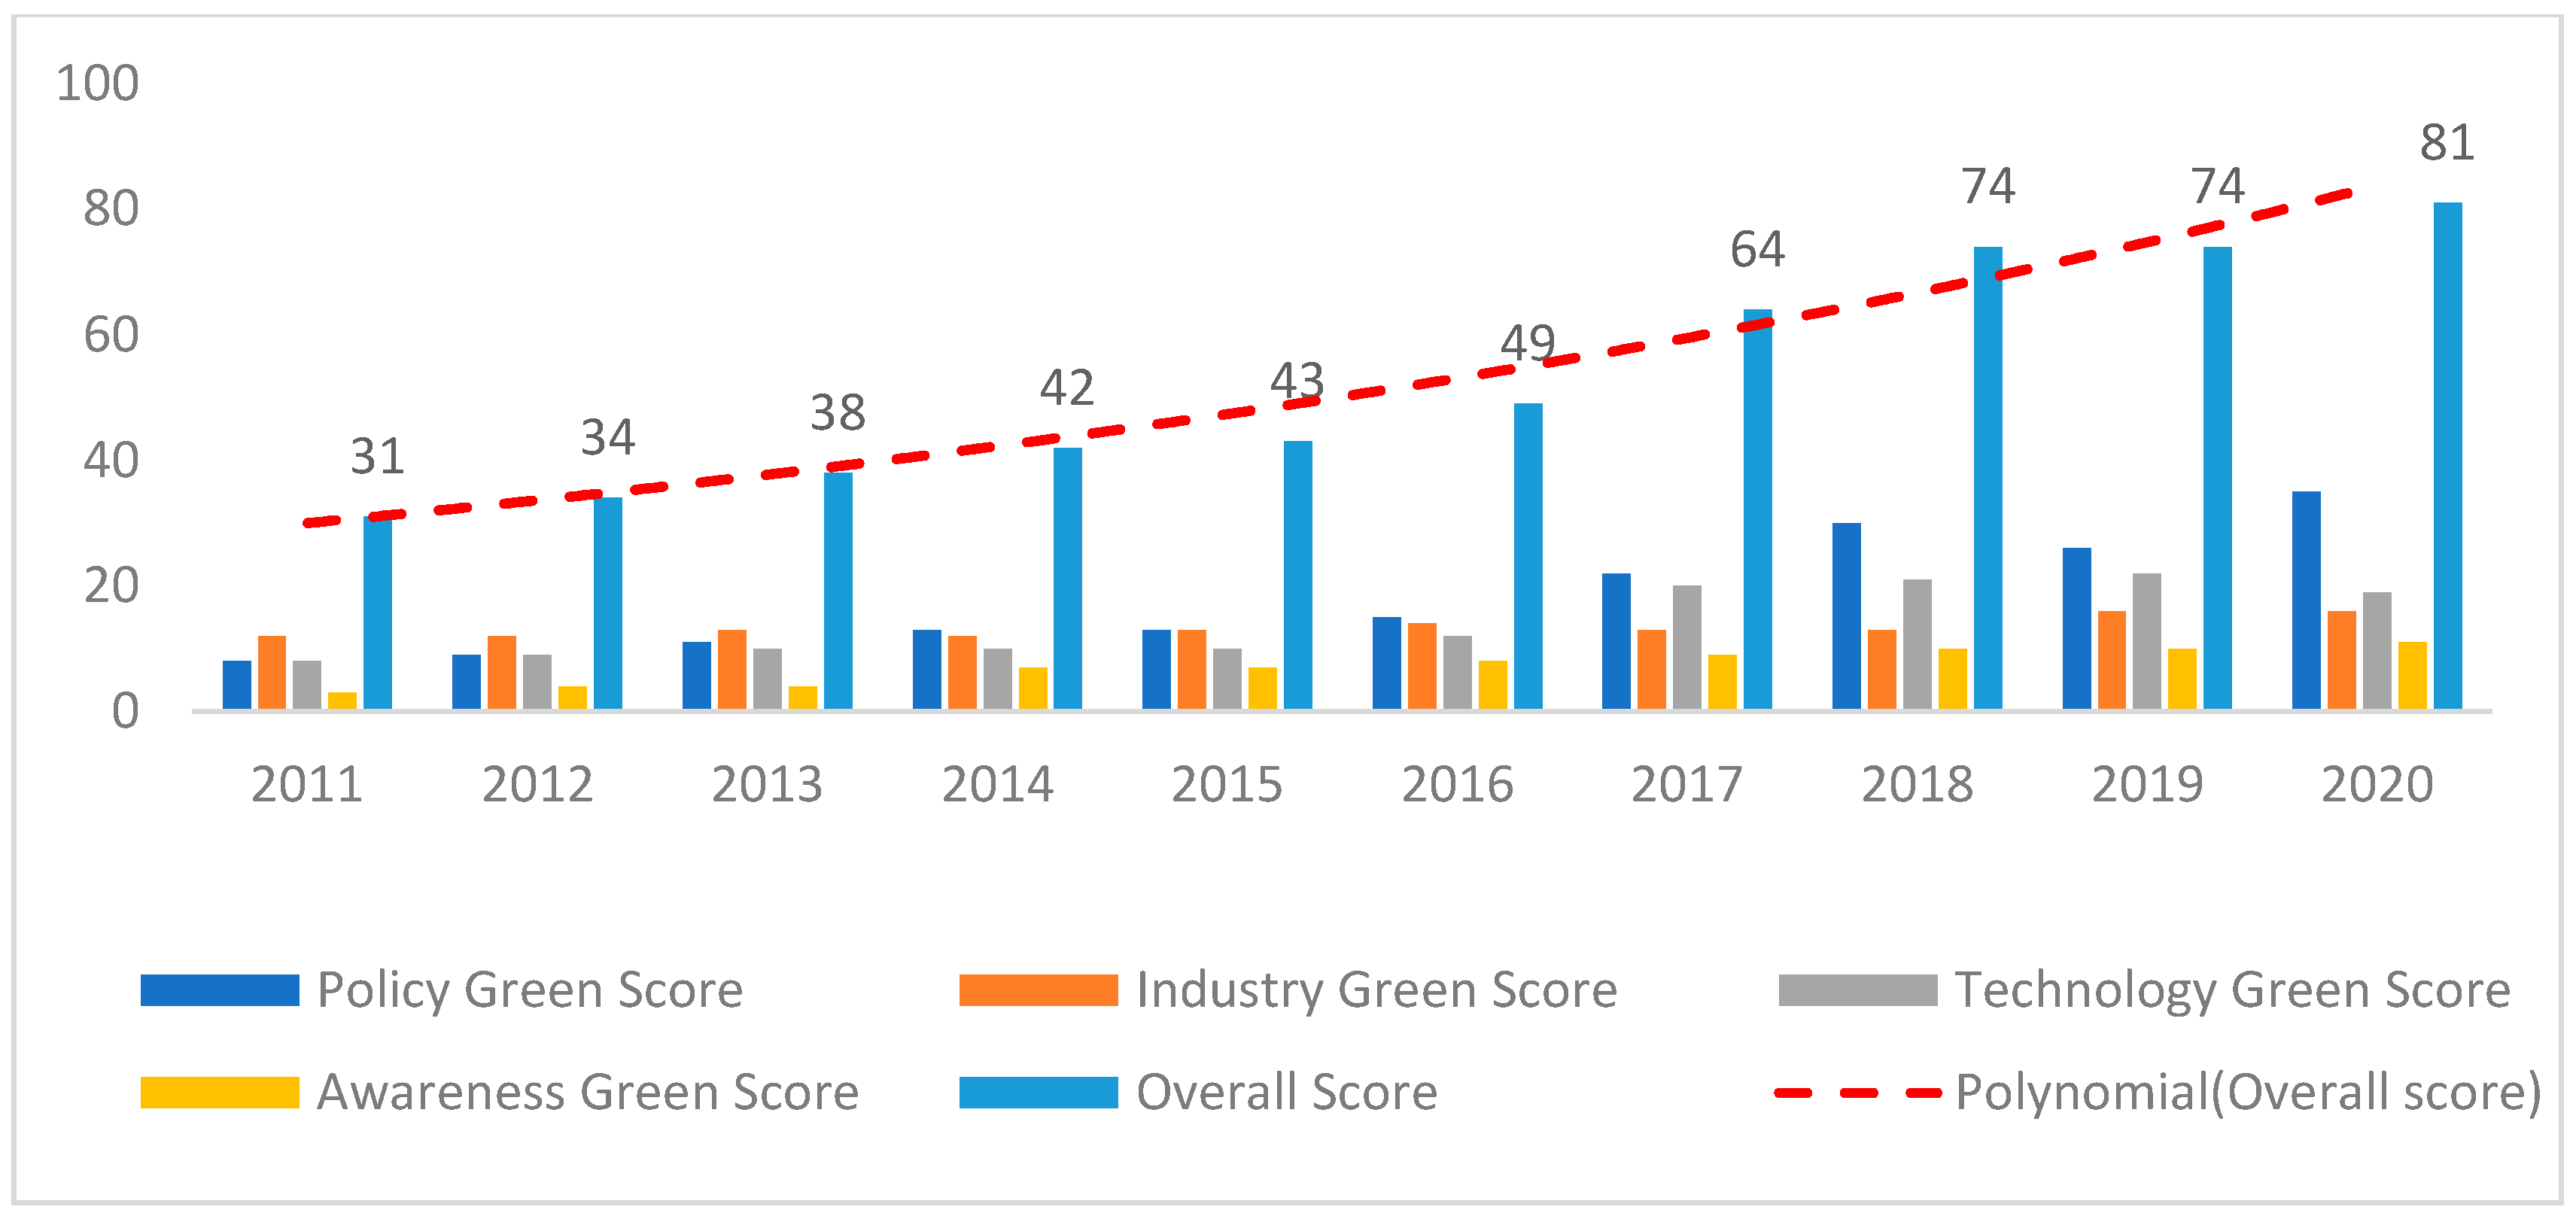
41]. Therefore, this paper focuses on the evaluation of agricultural green development, which integrates both quantitative and qualitative attributes, and combines the Gini coefficient and hesitant fuzzy multi-attribute decision making method to build an evaluation model to reflect the level of agricultural green development in four aspects: policy, industry, science and technology, and awareness. The city of Yantai in Shandong Province, a major agricultural province in China, was chosen to conduct an empirical analysis of its agricultural green development level.
This paper will follow the following steps to carry out the research. First, construct the evaluation model of agricultural green development; second, design the method of solving the evaluation model of agricultural green development; third, carry out the empirical analysis with the example of agricultural green development in Yantai, Shandong Province, China; fourth, analyze the empirical results and get the research conclusions.

2. Materials and Methods

2.1. Index Selection and Assignment

This paper follows the principles of scientificity, orientation, ease of operation, and a combination of quantitative and qualitative to construct the evaluation index system. Based on the relevant research literature on agricultural green development evaluation [2,14,29,32,42], an indicator selection system containing 18 three-level indicators is constructed from four aspects: policy, industry, science and technology, and awareness. Policy green focuses on the national, provincial, and municipal support for the green development of agriculture from the policy introduction and investment efforts. Industry green focuses on green production from the perspective of green agricultural product production. Science and technology green focuses on the extent of the role played by science and technology in agricultural production. Awareness green focuses on the level of green production awareness intensity of multiple subjects, including government, farmers, and consumers. Meanwhile, according to the data types of precise and interval indicators, the indicators are divided into quantitative indicators and qualitative indicators; according to the interaction between the changing trend of indicator data values and the changing trend of performance of evaluation objects, the indicators are divided into benefit indicators and cost indicators, and the evaluation system of sea selection indicators of agricultural green development is obtained as shown in Table 1.
For quantitative-type indicators, the original data required for the study of this paper were obtained by consulting literature such as Yantai Yearbook, Shandong Statistical Yearbook and China Brand Agriculture Yearbook from 2012 to 2021. For interval-type indicators, the original data were obtained by issuing questionnaires to agricultural management departments, agricultural producers, and consumers of agricultural products. Specifically, a scoring method from 1 to 10 was used to measure the indicators. With reference to the Likert scale scoring method, the following nine intervals were used to divide the scores from 1 to 10, and the descriptions corresponding to the criteria of different intervals are shown in Table 2.

2.2. Model Construction and Empirical Analysis

2.2.1. Gini Coefficient Quantitative Indicator Screening

Suppose that Gi denotes the Gini coefficient of the i-th indicator, xij denotes the standardized score using the i-th indicator for the j-th evaluation sample, xik denotes the standardized score using the i-th indicator for the k-th evaluation object, m denotes the total number of samples and μi denotes the mean value of the i-th indicator. The original formula for calculating the Gini coefficient is:
G i = k = 1 m j = 1 m x i j x i k / 2 m 2 μ i
x i j = v i j min 1 j n ( v i j ) max 1 j n ( v i j ) min 1 j n ( v i j )
x i j = max 1 j n ( v i j ) v i j max 1 j n ( v i j ) min 1 j n ( v i j )
As can be seen from Equation (1), after the dimensionless processing of the numerator denominator, the magnitude of the formula value is mainly determined by the numerator. The larger the numerator, the more significant the difference between any two evaluation objects under the i-th indicator. This indicates that this evaluation indicator can distinguish significantly between different evaluation objects, which means that the indicator is highly discriminative, contains a large amount of information, and should be retained.

2.2.2. HFMAD Making Method Weight Calculation

  • Construct the decision matrix
Suppose X = x 1 , x 2 , x n is the set of evaluation objects, U = u 1 , u 2 , u m is the set of evaluation indicators, and the evaluation index weight vector is W = w 1 , w 2 , w m T , w i 0 , w i [ w i l , w i u ] , i = 1 m w i = 1 . Evaluate the i-th evaluation object x i X with the evaluation indicator u j U , obtain m 1 exact type evaluation value and m 2 interval type evaluation value ( m 1 + m 2 = m ). Evaluate all evaluation subjects with all evaluation indicators. In the end, the decision matrix A = ( a i j ) n × m = [ ( a i j ) n × m 1 , ( a i j l , a i j u ) n × m 2 ] is obtained.
2.
Decision matrix normalization
As mentioned above, indicators can be classified into precise and interval based on the type of indicator data values. Indicators can also be classified into cost and benefit indicators based on the change in the size of the indicator and the trend in the outcome of the evaluation under the indicator. The types of indicators can therefore be divided into four types: quantitative cost indicators, quantitative benefit indicators, qualitative cost indicators, and qualitative benefit indicators. The data of different types can be normalized as follows.
Data normalization formula for quantitative cost indicators.
r i j = min j   a i j a i j   j N
Data normalization formula for quantitative benefit indicators.
r i j = a i j max j   a i j j N
Data normalization formula for qualitative cost indicators.
r i j l = ( 1 / a i j u ) / j = 1 n ( 1 / a i j l ) 2 r i j u = ( 1 / a i j l ) / j = 1 n ( 1 / a i j u ) 2 j N
Data normalization formula for qualitative benefit indicators.
r i j l = a i j l / j = 1 n ( a i j u ) 2 r i j u = a i j u / j = 1 n ( a i j l ) 2       j N
Whereby, N = 1 , 2 , , n . The decision matrix A = ( a i j ) n × m = [ ( a i j ) n × m 1 , ( a i j l , a i j u ) n × m 2 ] can be transformed into a normalization matrix R = ( r i j ) n × m = [ ( r i j ) n × m 1 , ( r i j l , r i j u ) n × m 2 ] by using Equations (4)–(7).
3.
Determine the weight of the evaluation indicator system
The solution of the weight vector W follows the idea of maximizing the overall deviation value of the evaluation object under the set of evaluation indicators. According to the definition of interval deviation in literature [40], it is supposed that the interval number a = [ a l ,   a u ] , b = [ b l , b u ] , the deviation of the interval numbers a, b is represented by D ( a , b ) = a b = b l a l + b u a u . Then, under a certain indicator u j U , the deviation value of the evaluation object x i from the other evaluation objects is represented by L i j ( w ) . L i ( w ) represents the sum of the deviation values between all evaluation objects under the j-th indicator.
L i j ( w ) = k = 1 n ( r i j l r k j l + r i j u r k j u ) w j ,   i N ,   j M
L i ( w ) = i = 1 n L i j ( w ) = i = 1 n k = 1 n ( r i j l r k j l + r i j u r k j u ) w j ,   i N
Further, construct the overall deviation value function of the evaluation object under all indicators.
L ( w ) = j = 1 m L i ( w ) = j = 1 m i = 1 n k = 1 n ( r i j l r k j l + r i j u r k j u ) w j
Solving for the weight vector W is the problem of solving for the value of the maximum L ( w ) subject to certain constraints, and the solution equation is as follows.
max L ( w ) = j = 1 m i = 1 n k = 1 n ( r i j l r k j l + r i j u r k j u ) w i s . t .   w = ( w 1 , w 2 , , w m ) T w j [ w j l , w j u ] , w j 0 , j = 1 m w j = 1
The evaluation of green agricultural development should consider both quantitative indicators such as the number of national demonstration societies, the number of provincial demonstration societies, and the number of agricultural products quality and safety supervision platforms, as well as qualitative indicators reflecting green agricultural development such as the government’s awareness intensity of services for green agricultural development and the producer’s awareness intensity of producing green agricultural products. It is also necessary to analyze mixed data consisting of precision-type data and interval-type data. Therefore, by combining the Gini coefficient and hesitant fuzzy multi-attribute decision-making method, the Gini coefficient method is used to screen the quantitative sea selection indicators, and the hesitant fuzzy multi-attribute decision-making method is used to find out the optimal weight vector and finally construct the evaluation model of agricultural green development.

2.2.3. Empirical Analysis

As shown in Figure 1, the distribution of agricultural output value in China’s provincial-level regions in 2020, in which Shandong Province’s agricultural GDP in 2020 reached 1019.058 billion yuan, ranking first, Henan Province ranked second with 624.48 billion yuan, and Sichuan Province ranked third with 470.19 billion yuan. Therefore, this paper takes the agricultural green development in Yantai City, Shandong Province, China as an example for empirical analysis and obtains the raw data of quantitative indicators by data mining the literature, such as the Yantai Development Yearbook, and obtains the raw data of qualitative indicators by issuing questionnaires. Among them, 100 questionnaires were distributed to the management department, farmers, and consumers, 300 questionnaires were distributed in total, and 276 valid questionnaires were collected.
  • Evaluation indicator system construction
As shown in Table 3, the quantitative sea selection indicator system of agricultural green development evaluation includes three criterion layers of policy green, industry green, and technology green, and 15 three-level indicators such as the number of international-level model societies. The Gini coefficient method is applied to standardize the original data of quantitative indicators according to Formulae (1)–(3), and calculate the Gini value of indicators. According to the principle that the size of the Gini value represents the differentiation ability of indicators, this paper removes three indicators with Gini value less than 0.2, including “the amount of investment in fixed assets in primary industry”, “the area of new water and fertilizer construction”, “and the number of large and medium-sized tractors”.
Based on the screening of the quantitative sea selection indexes, the three qualitative indexes proposed in this paper, the government’s awareness intensity of services for green agricultural development, the producer’s awareness intensity of producing green agricultural products, and the consumers’ awareness intensity of buying green agricultural products were incorporated into the screened quantitative index system to obtain the agricultural green development evaluation index system as shown in Table 4, which contains 15 three-level indicators, and the indicators are indicated by X1 to X15.
2.
Calculation of evaluation indicator weights
According to the evaluation indicator system of agricultural green development obtained in the previous paper, for quantitative-type indicators and qualitative-type indicators, the original data of the evaluation indicator system are obtained by using literature data mining and questionnaire survey, respectively, and the decision matrix shown in Table 5 is constructed according to the hesitant fuzzy multi-attribute decision theory.
Based on the decision matrix, the decision matrix can be transformed into a normalized decision matrix according to Equations (4)–(7) for quantitative cost indicators, quantitative benefit indicators, qualitative cost indicators, and qualitative benefit indicators according to the hesitant fuzzy multi-attribute decision-making theory, as shown in Table 6.
The solution of the weight vector W follows the idea of maximizing the overall deviation value of the evaluation object under the evaluation index set, and the following single-objective optimization model is established according to Equations (8)–(11) using the interval deviation method and the idea of maximizing the deviation of program indicators.
MaxD(w) = 17.71w1 + 13.81w2 + 17.53w3 + 15.22w4 + 2.07w5 + 10.38w6 + 1.1w7 + 5.11w8 + 2.31w9 + 5.36w10 + 16.97w11 + 16.83w12 + 12.6w13 + 15.5w14 + 13.02w15
s.t.0.06 ≤ w1 ≤ 0.10, 0.04 ≤ w2 ≤ 0.08, 0.05 ≤ w3 ≤ 0.09, 0.06 ≤ w4 ≤ 0.10, 0.03 ≤ w5 ≤ 0.07, 0.05 ≤ w6 ≤ 0.11, 0.03 ≤ w7 ≤ 0.08, 0.05 ≤ w8 ≤ 0.08, 0.05 ≤ w9 ≤ 0.07, 0.04 ≤ w10 ≤ 0.08, 0.04 ≤ w11 ≤ 0.08, 0.05 ≤ w12 ≤ 0.10, 0.05 ≤ w13 ≤ 0.12, 0.05 ≤ w14 ≤ 0.12, 0.05 ≤ w15 ≤ 0.12.
i = 1 15 w i = 1 ,   w i 0 ,   i ( 1 , 2 , 3 , ...15 )
For the single objective maximization optimization model of agricultural green development, the model is solved by using Python 2.7 software, and the optimal weight vector is obtained as follows:
W = (0.08, 0.08, 0.09, 0.1, 0.03, 0.05, 0.03, 0.05, 0.05, 0.04, 0.08, 0.1, 0.05, 0.05, 0.12)
On the basis of obtaining the evaluation indicator weights, the standardized data under each evaluation indicator and the corresponding indicator weights are multiplied and summed up using Formulae (12) and (13) to obtain the evaluation score Sj of agricultural green development in Yantai.
Z j = w 1 w 2 w n x 1   x 2     x n
Here, xi is the standardized data under each evaluation index, and wi is the index weight.
S j = Z j × 100

3. Results

As shown in Figure 2, the overall agricultural green development in Yantai shows an upward trend, while there are obvious differences in the development of four aspects: policy, industry, science and technology, and awareness. Among them, policy green development shows a more obvious upward trend; industry green development shows a more moderate upward trend; science and technology green development shows a high growth rate from 2011 to 2017, followed by a slowdown in the next two years and a downward trend in 2020; and consciousness green development shows a more stable upward trend.
As shown in Figure 3, the three most critical factors affecting the green development of agriculture are “consumers’ awareness intensity of buying green agricultural products”, “investment in rural ecological civilization construction” and “the number of farmers’ science and technology training”, with the corresponding index weights of 0.12, 0.1, and 0.1. Meanwhile, “number of agricultural products quality and safety supervision platforms”, “number of national demonstration societies”, “number of provincial demonstration societies”, and “total online sales of agricultural products”, these four indicators also have a greater impact on the green development of agriculture. In recent years, China has increased the quality management of agricultural products, and the overall quality of agricultural products has been significantly improved and guaranteed, so the two indicators of “agricultural products quality inspection pass rate” and “Total number of fertilizer applications” have the lowest influence. Due to the popularity of agricultural machinery in China, the impact of “total power of agricultural machinery” on the green development of agriculture is relatively small.

4. Discussions

This paper constructs an evaluation model of agricultural green development based on Gini coefficient-hesitant fuzzy multi-attribute decision making, which effectively solves the problem of evaluating agricultural green development considering multiple stakeholders in the agricultural industry and provides a scientific evaluation method for evaluating agricultural development from the perspective of green development. Based on the constructed agricultural green development evaluation model, this paper empirically analyzes the agricultural green development in Yantai, Shandong Province, China, and the empirical results have important guiding significance for the transformation and development of China’s agricultural industry.
The research results show that the role of industry, awareness, science and technology, and policy in influencing the green development of agriculture increases in turn, with the influence weights of 0.16, 0.22, 0.27, and 0.35, respectively, which indicates that China’s agricultural development has been in a stable stage, the development and use of agricultural production factors such as land and water resources tend to be rationalized, and the autonomous awareness of farmers, consumers, and other agricultural subjects has been continuously enhanced, and science and technology has a transformative impact on agricultural development. The government’s agricultural development plan has a key impact on the trend of agricultural development. Therefore, under the correct guidance of government policies, China’s agricultural green development needs to explore the systematic agricultural green development mode and path including industry, awareness, science and technology, and policy, relying on the development of agricultural green science and technology, driven by the promotion of agricultural green awareness, based on industrial green development, and guided by systematic agricultural green development thinking. At the same time, green agriculture development is jointly driven by the interests related to multiple subjects on the supply side, the demand side, and the regulatory side. The demand side’s requirements for high-quality agricultural products have become a stronger driving force for agricultural green development, the supply side’s change in awareness of agricultural producers has become the basis for agricultural green development, and the implementation of government policies has become an important guarantee for agricultural green development.

5. Recommendations and Prospections

This paper constructs a measurement model of agricultural green development from the four dimensions of industry, awareness, science and technology, and policy, and takes Yantai City, Shandong Province, China as an example for empirical analysis. Based on the research results, the following recommendations are proposed. First, the driving role of the demand side for green agricultural production should be further strengthened. This can be achieved by enhancing consumers’ recognition of the value of green agricultural products and creating high premiums for agricultural products, promoting the optimization, and upgrading of the green production structure of agricultural products. Secondly, it is recommended to further play the guiding and supporting role of the government in the green development of agriculture and promote the green development path of agriculture through the formulation of agricultural green development policies and innovative agricultural green production models. Third, it is recommended to further enhance the awareness of green production among agricultural industry practitioners and strengthen the concept of value-added and sustainable development. With the way to enhance producers’ benefit acquisition, promote the development of supply-side reform of agricultural green production.
The shortcomings and future research directions of this paper are that when constructing the evaluation model of agricultural green development, the paper focuses on the pollution of land and water resources by agricultural production activities, and the impact on the air environment is weakly considered. Future research will include carbon dioxide emissions and white waste pollutant emissions into the evaluation model to enhance the evaluation dimension of the model.

Author Contributions

Conceptualization, M.W., H.K. and S.Z.; Data curation, Y.W. and J.H.; Formal analysis, M.W. and B.H.; Funding acquisition, H.K.; Investigation, M.W. and H.K.; Methodology, M.W. and Y.Y.; Project administration, H.K.; Resources, H.K.; Software, M.W. and Y.Y.; Supervision, H.K.; Validation, M.W. and Y.Y.; Visualization, M.W. and Y.Y.; Writing-original draft, M.W., Y.Y., B.H., S.Z., Y.W. and J.H.; Writing-review & editing, M.W., Y.Y., B.H., S.Z., Y.W. and J.H. All authors have read and agreed to the published version of the manuscript.

Funding

This work was supported by the National Key Research and Development Project (Grant No.2019YFB1600400), Liaoning Revitalization Talents Program: NO.XLYC2008030, National Natural Science Foundation of China (Grant No.71831002), National Natural Science Foundation of China (Grant No.72173013) and National Natural Science Foundation of China (Grant No.72174035).

Institutional Review Board Statement

Not applicable.

Data Availability Statement

The datasets used and/or analyzed during the current study available from the corresponding author on reasonable request.

Conflicts of Interest

Declaration of competing interest. The authors declare no conflict of interest.

Abbreviations

The following abbreviations are used in this manuscript.
AHPAnalytic Hierarchy Process
ANPAnalytic Network Process
DEMATELDecision Making Trial and Evaluation Laboratory
GDPGross Domestic Product
HFMADHesitant Fuzzy Multi-Attribute Decision
SFAStochastic Frontier Approach
TOPSISTechnique for Order of Preference by Similarity to Ideal Solution
VIKORVlse Kriterijumska Optimizacija I Kompromisno Resenje (Serbian)

References

  1. Miao, J.Q.; Zhao, M.; Huang, G.Q. Comprehensive evaluation and empirical analysis of agricultural sustainable development in southern hilly and mountainous area. Chin. J. Agric. Resour. Reg. Plan. 2021, 42, 163–172. [Google Scholar]
  2. Jia, J.N.; Guo, X.L.; Wang, J.L. Evaluation study on green and high quality development of chinese agriculture. Agric. Econ. 2022, 8, 6–8. [Google Scholar]
  3. Yin, C.B.; Li, F.D.; Wang, S. The concept, connotation and principle of agricultural green development in china. Chin. J. Agric. Resour. Reg. Plan. 2021, 42, 1–6. [Google Scholar]
  4. Du, M.S.; Liu, T. High-quality development of agriculture based on new development concept: Connotation, problems and measures. J. Agric. Sci. Technol. 2021, 23, 18–24. [Google Scholar]
  5. Yang, W.J.; Gong, Q.W. The scientific connotation and the basic path of rural green development from the perspective of urban-rural integration. Res. Agric. Mod. 2021, 42, 18–29. [Google Scholar]
  6. Jiao, X.; Wang, S.B.; Qiao, Y.H. A study on influencing factors of green development of ecological farm. Econ. Rev. J. 2021, 10, 104–113. [Google Scholar]
  7. Xia, W.W.; Du, Z.X.; Gao, L.L. Research on the factors affecting the application of green production technology by family farm operators—Based on survey data of 452 family farms in three province. Econ. Rev. J. 2019, 6, 101–108. [Google Scholar]
  8. Zhang, J.J.; Zhang, K.Y.; Zhang, G.Q.; Guo, L.X. Family farm green production behavior choice and regional comparative study. Agric. Econ. Manag. 2021, 1, 46–57. [Google Scholar]
  9. Yang, J. Construction and empirical analysis of county agricultural green development index—Based on county cross-sectional data in Hubei Province in 2017. Jiangsu Agric. Sci. 2021, 49, 24–30. [Google Scholar]
  10. Duan, C.; Yu, C.Q.; Li, S.W.; Zhong, Z.M.; He, Y. A comprehensive assessment of agricultural green development at the county level on the tibetan plateau-a case study in bainang county. Chin. J. Agric. Resour. Reg. Plan. 2022, 1–11. Available online: http://kns.cnki.net/kcms/detail/11.3513.S.20220720.1928.014.html (accessed on 13 February 2023).
  11. Zeng, D.P.; Su, X.H.; Ma, Y.; Li, T.; Zhao, H.P.; Yang, H.W. The research on farmers’ behavior responses to agricultural green development policy: A case study of x county, xinjiang. Chin. J. Agric. Resour. Reg. Plan. 2022, 43, 55–63. [Google Scholar]
  12. Yin, L.; Zhao, Z.Y.; Zhang, Y.W. Dose the risk uncertainty perception affect agricultural green production behavior?—Evidence from the agricultural green development going first area. J. Arid Land Resour. Environ. 2022, 36, 26–32. [Google Scholar]
  13. Xu, X.C.; Wu, P.Y. Evolution of green agriculture development mechanism: From the perspective of tripartite game between government, farmers and consumers. J. China Agric. Univ. 2022, 27, 259–273. [Google Scholar]
  14. Song, X.W.; Wang, X.L.; Fang, Z. Influencing Factors of Farmers’ Response to Agricultural Green Production Technology: A Case Study of Qingdao City. Areal Res. Dev. 2021, 40, 129–134. [Google Scholar]
  15. Zhang, C.M.; Guo, L.F. Analysis of factors influencing the enthusiasm of green agricultural production—A case of green rice cultivation in Daan City, Jilin Province. Soc. Sci. Front 2014, 9, 247–249. [Google Scholar]
  16. Jiang, B.; Teng, L. Revenue sharing of green agricultural structural coalition based on Selectope. J. Discret. Math. Sci. Cryptogr. 2017, 20, 1041–1051. [Google Scholar] [CrossRef]
  17. Wang, H.G.; Hu, S. Coupling coordination degree of resource environment-economy under the background of green agricultural development—A case study of jiangxi province. Chin. J. Agric. Resour. Reg. Plan. 2022, 1–13. Available online: http://kns.cnki.net/kcms/detail/11.3513.S.20220818.1410.021.html (accessed on 13 February 2023).
  18. Li, F.F.; Zhou, Y.X.; Zhou, X. Spatial and temporal differences and obstacles of agricultural green development in Shandong province. Chin. J. Agric. Resour. Reg. Plan. 2022, 1–12. Available online: http://kns.cnki.net/kcms/detail/11.3513.s.20220721.1936.017.html (accessed on 13 February 2023).
  19. Zhang, W.Y.; Duan, L.L. Identification of driving factors and performance evaluation of Zhejiang agricultural green development. Chin. J. Agric. Resour. Reg. Plan. 2022, 43, 24–33. [Google Scholar]
  20. Gai, M.; Yang, Q.F.; He, Y.N. Spatiotemporal changes and influencing factors of agricultural green development level in main grain producing areas in Northeast China. Resour. Sci. 2022, 44, 927–942. [Google Scholar] [CrossRef]
  21. Li, Z.; Liu, Z.Y.; Jin, T.L. Reflections and suggestions on promoting green development of agriculture in the yangtze river economic belt. Agric. Econ. 2022, 4, 9–11. [Google Scholar]
  22. Li, K.M.; Wang, X.Y.; Yao, R.L. Regional differences and driving factors of agricultural green development level in the Yellow River Basin. J. Desert Res. 2022, 42, 85–94. [Google Scholar]
  23. Li, F.F.; Zhou, X.; Zhou, Y.X. Evaluation and regional difference analysis of articultural green development level in bohai rim region. Chin. J. Agric. Resour. Reg. Plan. 2022, 1–13. Available online: http://kns.cnki.net/kcms/detail/11.3513.S.20220318.1604.028.html (accessed on 13 February 2023).
  24. Wu, H.; Chen, J.H.; Zhao, J. Achievements, Problems and Countermeasures of Agricultural Green Development in Beijing, Tianjin and Hebei. North. Hortic. 2020, 17, 166–171. [Google Scholar]
  25. Yu, Y.Q.; Wang, C.S.; Peng, L.L.; Yu, Y.F. Evaluation of agricultural green development level and ananlysis of its obstacle factors based on entropy weight TOPSIS model—A case study of jiangxi province. Chin. J. Agric. Resour. Reg. Plan. 2022, 43, 187–196. [Google Scholar]
  26. Jiao, L.H.; Lu, J.P. Research on the Measurement and Restrictive Factors of Agricultural High-quality Development Level in Gansu Province. Resour. Dev. Mark. 2021, 37, 333–339. [Google Scholar]
  27. Xiao-Qiang, J.; Chong, W.; Fu-Suo, Z. Science and Technology Backyard: A novel model for technology innovation and agriculture transformation towards sustainable intensification. J. Integr. Agric. 2019, 18, 1655–1656. [Google Scholar]
  28. Xiang, Y.; Yang, Y.J.; Lu, Q. Measurement and Spatial-Temporal Evolution Analysis of Provincial High-quality Development of Agricultural Economy in China. Resour. Dev. Mark. 2022, 38, 257–264. [Google Scholar]
  29. Ming, C.Q. Establishing and Empirical Analysis of Green Growth Evaluation Indicator System for China’s Agriculture. J. Tech. Econ. Manag. 2021, 9, 108–113. [Google Scholar]
  30. Amaruzaman, S.; Leimona, B.; Van-Noordwijk, M.; Lusiana, B. Discourses on the performance gap of agriculture in a green economy: A Q-methodology study in Indonesia. Int. J. Biodivers. Sci. Ecosyst. Serv. Manag. 2017, 13, 233–247. [Google Scholar] [CrossRef] [Green Version]
  31. Liu, Y.; Sun, D.; Wang, H.; Wang, X.; Yu, G.; Zhao, X. An evaluation of China’s agricultural green production: 1978–2017. J. Clean. Prod. 2020, 243, 118483. [Google Scholar] [CrossRef]
  32. Zhang, H.; Wang, H.R.; Li, Z. Research on High Quality Development Evaluation of Digital Agriculture Under the Background of Rural Revitalization—Based on the Data Analysis of 31 Provinces and Cities in China From 2015 to 2019. J. Shaanxi Norm. Univ. (Philos. Soc. Sci. Ed.) 2021, 50, 141–154. [Google Scholar]
  33. Cui, N.B.; Sheng, S.Y. Influencing factors, quality measurement and dynamic analysis of agricultural green development in major grain producing areas from the perspective of green total factor productivity. J. Agric. Resour. Environ. 2022, 39, 621–630. [Google Scholar]
  34. Sun, K.; Tang, M.L.; He, Z.J.; Zhang, C.H. An empirical analysis on the influencing factors of agricultural high-quality development in Hebei, Shandong and Henan. J. Henan Agric. Univ. 2022, 56, 323–330. [Google Scholar]
  35. Yu, F.W.; Wang, G.L.; Lin, S. Key Issues and Path Selections of Agricultural Green Development in Main Grain Producing Areas. Chongqing Soc. Sci. 2022, 7, 6–18. [Google Scholar]
  36. Zhu, J.F.; Deng, Y.Y. Green Transformation of Agricultural Production: Logic of Formation, Dilemma and Practical Strategy. Reform Econ. Syst. 2022, 3, 84–89. [Google Scholar]
  37. Chen, F.F. Exploring new paths to promote green agricultural development. Agric. Econ. 2022, 5, 17–19. [Google Scholar]
  38. Zhu, Q.; Li, Y.; Shen, J.; Xu, J.; Hou, Y.; Tong, B.; Xu, W.; Zhang, F. Green Development of Agricultural Whole Industry Chain: Pathway and Countermeasures. Strateg. Study CAE 2022, 24, 73–82. [Google Scholar] [CrossRef]
  39. Basílio, M.P.; Pereira, V.; Costa, H.G.; Santos, M.; Ghosh, A. A Systematic Review of the Applications of Multi-Criteria Decision Aid Methods (1977–2022). Electronics 2022, 11, 1720. [Google Scholar] [CrossRef]
  40. Xu, Z.S. Maximum Deviation Method Based on Deviation Degree and Possibility Degree for Uncertain Multi-attribute Decision Making. Control Decis. 2001, 16 (Suppl. S1), 818–821. [Google Scholar]
  41. Meng, B.; Kuang, H.B.; Luo, J.Q. Socio-economic development evaluation indicators screening model and its application based on significant difference. Sci. Res. Manag. 2018, 39, 17–26. [Google Scholar]
  42. Sun, W.L.; Wang, R.B.; Jiang, X.; Huang, S.N. Study on connotation and evaluation of the agricultural green development. Chin. J. Agric. Resour. Reg. Plan. 2019, 40, 14–21. [Google Scholar]
Figure 1. China’s agricultural development in 2020.
Agriculture 13 00699 g001
Figure 2. Overall agricultural green development in Yantai in Yantai from 2011 to 2020.
Agriculture 13 00699 g002
Figure 3. Dynamic Evaluation indicators weights of agricultural green development level in Yantai from 2011 to 2020.
Agriculture 13 00699 g003
Table 1. Agricultural green development evaluation indicator system.
The Goal Criteria LayerIndicator LayerIndicator Types
The level of agricultural green developmentPolicy GreenNumber of national demonstration societies (each)Precision-benefit indicators
Number of provincial demonstration societies (each)Precision-benefit indicators
Number of agricultural products quality and safety supervision platforms (each)Precision-benefit indicators
Investment in fixed assets of primary industry (one hundred million yuan)Precision-benefit indicators
Investment in rural ecological civilization construction (one hundred million yuan)Precision-benefit indicators
Industry GreenTotal number of fertilizer applications (ten thousand tons)Precision-cost indicators
New water and fertilizer construction area (ten thousand hectares)Precision-benefit indicators
New “Three Pin, One Standardization “ number of agricultural products (each)Precision-benefit indicators
Agricultural products quality inspection pass rate (%)Precision-benefit indicators
Sales of leading agricultural industrialization enterprises above the provincial level (one hundred million yuan)Precision-benefit indicators
Science and Technology GreenLevel of agricultural mechanization (%)Precision-benefit indicators
Total power of agricultural machinery (ten thousand KW)Precision-benefit indicators
Number of medium and large tractors (ten thousand units)Precision-benefit indicators
Total online sales of agricultural products (one hundred million yuan)Precision-benefit indicators
Number of farmers’ science and technology training (ten thousand farmers)Precision-benefit indicators
Awareness GreenGovernment’s awareness intensity of services for green agricultural developmentInterval-benefit indicators
Producer’s awareness intensity of producing green agricultural productsInterval-benefit indicators
Consumers’ awareness intensity of buying green agricultural productsInterval-benefit indicators
Table 2. Interval division standard and description.
Interval StandardsQualitative Indicator Interval Standards Description
Government Green AwarenessProducer Green AwarenessConsumer Green Awareness
1,2terribleterribleterrible
2,3very weakvery weakvery weak
3,4quite weakquite weakquite weak
4,5weakweakweak
5,6generalgeneralgeneral
6,7strongstrongstrong
7,8quite strongquite strongquite strong
8,9very strongvery strongvery strong
9,10greatgreatgreat
Table 3. Quantitative sea selection indicator system and Gini value.
The GoalCriteria LayerIndicator LayerGini Value
The level of agricultural green developmentPolicy GreenNumber of national demonstration societies (each)0.29
Number of provincial demonstration societies (each)0.21
Number of agricultural products quality and safety supervision platforms (each)0.25
Investment in fixed assets of primary industry (one hundred million yuan)0.17
Investment in rural ecological civilization construction (one hundred million yuan)0.23
Industry GreenTotal number of fertilizer applications (ten thousand tons)0.22
New water and fertilizer construction area (ten thousand hectares)0.16
New “Three Pin, One Standardization” number of agricultural products (each)0.23
Agricultural products quality inspection pass rate (%)0.20
Sales of leading agricultural industrialization enterprises above the provincial level (one hundred million yuan)0.21
Science and Technology GreenLevel of agricultural mechanization (%)0.22
Total power of agricultural machinery (ten thousand KW)0.22
Number of medium and large tractors (ten thousand units)0.19
Total online sales of agricultural products (one hundred million yuan)0.34
Number of farmers’ science and technology training (ten thousand farmers)0.27
Table 4. Agricultural green development evaluation indicator system.
The GoalCriteria LayerIndicator LayerSymbol
The level of agricultural green developmentPolicy GreenNumber of national demonstration societies (each)X1
Number of provincial demonstration societies (each)X2
Number of agricultural products quality and safety supervision platforms (each)X3
Investment in rural ecological civilization construction (one hundred million yuan)X4
Industry GreenTotal number of fertilizer applications (ten thousand tons)X5
New “Three Pin, One Standardization “ number of agricultural products (each)X6
Agricultural products quality inspection pass rate (%)X7
Sales of leading agricultural industrialization enterprises above the provincial level (one hundred million yuan)X8
Science and Technology GreenLevel of agricultural mechanization (%)X9
Total power of agricultural machinery (ten thousand KW)X10
Total online sales of agricultural products (one hundred million yuan)X11
Number of farmers’ science and technology training (ten thousand farmers)X12
Awareness GreenGovernment’s awareness intensity of services for green agricultural developmentX13
Producer’s awareness intensity of producing green agricultural productsX14
Consumers’ awareness intensity of buying green agricultural productsX15
Table 5. Decision Matrix.
X1X2X3X4X5X6X7X8X9X10X11X12X13X14X15
201114811.6845.95894.30%52679.50%7780.652.562,31,22,3
201235511.7944.66594.40%51680.60%8581.153.152,32,33,4
201346032.0343.97894.80%53881.50%867.71.325.193,42,33,4
201436842.543.66295.90%52582%887.61.665.54,53,45,6
201579861.0541.37596.10%56882.50%8931.9865,64,55,6
2016811871.139.18098.70%66083%1064.52.2106,74,56,7
20171312792.7338.465098.90%66285.20%990.387.21306,75,66,7
201820135114.537.347099.00%66286%109819267,85,67,8
201923147151.736.2212999.10%65591%834.3636.7217,86,77,8
202028163173.836.0613199.20%65591.23%767.3243.710.58,97,88,9
Table 6. Normalized decision matrix.
X1X2X3X4X5X6X7X8X9X10X11X12X13X14X15
20110.0360.2940.0590.4420.8640.4430.9510.7950.8710.7090.0150.085[0.10,0.18][0.07,0.16][0.11,0.20]
20120.1070.3370.0590.4710.9360.4960.9520.7790.8830.7810.0260.105[0.10,0.18][0.14,0.24][0.17,0.26]
20130.1430.3680.1760.5340.9060.5950.9560.8130.8930.790.030.173[0.15,0.23][0.14,0.24][0.17,0.26]
20140.1070.4170.2350.6580.8910.4730.9670.7930.8990.8080.0380.183[0.20,0.29][0.21,0.33][0.29,0.39]
20150.250.6010.3530.2760.9130.5730.9690.8580.9040.8130.0450.2[0.25,0.35][0.28,0.41][0.29,0.39]
20160.2860.7240.4120.2890.9480.6110.9950.9970.910.9690.050.333[0.30,0.41][0.28,0.41][0.34,0.46]
20170.4640.7790.5290.7180.9560.3820.99710.9340.9020.1651[0.30,0.41][0.35,0.49][0.34,0.46]
20180.7140.8280.6471.1840.9420.5340.99810.94310.4350.867[0.35,0.47][0.35,0.49][0.40,0.52]
20190.8210.9020.8820.4470.960.9850.9990.9890.9970.760.840.7[0.35,0.47][0.41,0.57][0.40,0.52]
202011111110.98910.69910.35[0.40,0.53][0.48,0.65][0.46,0.59]
Disclaimer/Publisher’s Note: The statements, opinions and data contained in all publications are solely those of the individual author(s) and contributor(s) and not of MDPI and/or the editor(s). MDPI and/or the editor(s) disclaim responsibility for any injury to people or property resulting from any ideas, methods, instructions or products referred to in the content.

