Article

Ridge Cultivation for the Adaption of Fodder Maize (Zea mays L.) to Suboptimal Conditions of Low Mountain Ranges in Organic Farming in Central Europe

by
Tsvetelina Krachunova
1,2,*,
Martin Scholz
1,
Sonoko D. Bellingrath-Kimura
2 and
Knut Schmidtke
1,3
1
Faculty of Agriculture/Environment/Chemistry, Dresden University of Applied Science, 01326 Dresden, Germany
2
Leibniz Centre for Agricultural Landscape Research (ZALF e.V.), 15374 Müncheberg, Germany
3
Research Institute of Organic Agriculture (FiBL), 5070 Frick, Switzerland
*
Author to whom correspondence should be addressed.
Agriculture 2023, 13(3), 650; https://doi.org/10.3390/agriculture13030650
Submission received: 7 February 2023 / Revised: 2 March 2023 / Accepted: 6 March 2023 / Published: 9 March 2023
(This article belongs to the Section Crop Production)

Abstract

:
Fodder maize cultivation under low mountain conditions in Central Europe presents obstacles for organic dairy farmers; low temperatures and high precipitation values in spring delay the juvenile development of maize, which leads to lower and fluctuating yields. Increasing the soil temperature during the critical growth phase of maize in spring is beneficial for maize cultivation. For this reason, 0.15 m high ridge-row cultivation (RCM) of maize was compared to a typical flat surface cultivation method (FCM) with 0.75 m row spacing in three environments (En) in 2017, 2018 and 2020 on-farm at low mountain sites in Germany. In the experiment, with randomised block design and one-factorial arrangement, soil temperature (ST) at 0.05 m soil depth at midday, field emergence (FE) 4, 8, 16 and 20 days after sowing (DAS), dry matter yields (DM) in every En and plant development and N, P, K content in En 2020 were investigated. RCM led to a significantly higher ST 4 DAS in every En, 12 and 20 days in 2018 and 8 and 16 DAS in 2020. RCM did not accelerate maize FE but positively impacted plant development and starch content. RCM generated a higher dry matter (DM) yield of whole maize plants and corn cobs, and a higher protein yield than FCM. RCM slightly increased the plant-available P and Mg content from 0 to 0.3 m and influenced significantly the mineral N content from 0 to 0.3 m at the beginning of grain development. RCM, a simple cultivation technique, demonstrated benefits for maize cultivation, particularly for climatically marginal locations in Germany.

1. Introduction

Organic dairy farms in Germany predominate in areas from the low mountain landscape type [1] and are characterised by an average altitude between 500 and 700 m above sea level [2,3]. The climate conditions in low mountain areas, with a 6.9 °C mean annual temperature (MAT), are cooler compared to the 8.2 °C MAT in German lowland areas [4]. Maize (Zea mays L.), one of the most important cereals for human and animal consumption worldwide, is native to the Andean region of Central America and is grown in climates where the mean daily temperatures are above 15.0 °C and frost-free [5]. At low mountain sites with marginal weather conditions in Central Europe, the cultivation of maize can be problematic [6]. Germany is the leading European Union (EU) member for the area under maize cultivation, with a total of 2.2 million ha and collectively 105 million t dry matter annual yield [7,8]. With increasing latitude in the northern hemisphere, maize is grown principally for silage or green fodder for cattle feed [9]. Furthermore, Germany has the highest number of dairy cows in the EU, with a growing tendency towards organic dairy products [10,11]. In this regard, the economic constraints for growth and effective management apply to organic dairy farmers in the same way as to conventional farms [12]. Therefore, organic farmers need a sufficient cattle feed supply to ensure the increasing organic dairy product consumption in Germany. Large dairy cow farms in Germany typically have higher milk yields due to feeding higher amounts of maize silage, while medium-scale farms, including significantly less maize in the cattle feed ration, show low production intensity [13]. The yearly milk yield on dairy German farms rises with an increasing proportion of maize silage in roughage cattle feed [14,15]. Although the cultivation of maize is not currently typical for organic agriculture and especially for dairy farms in Germany, it is of interest to improve the current cultivation methods when considering that the lower amount of maize silage that organic dairy cows receive is closely linked to lower milk yield [6,16].
To our knowledge, there is currently insufficient information about successful maize cropping methods under the climate and soil conditions of European low-mountain ranges, especially in the context of organic farming. On sites with a risk of late frost, ridge cropping can protect maize seedlings from frost damage. A maize seed, sown in a 7 cm high ridge, is protected from low temperatures, as the soil ridge warms up quicker under direct sunlight [17]. Higher temperatures in the topsoil result in enhanced root growth and phosphorus plant uptake during the early growth stages [18,19,20]. Data about the effects of ridge cultivation of maize in Central Europe have been provided only by a few authors who report yield improvement and accelerated plant development in the early stages [21,22]. Looking at the tremendous importance of maize cropping, it is astounding how the state of knowledge of maize cultivation in Central European low-mountain ranges is not carried out more precisely. The following research aims, therefore, to generate possible strategies for yield improvement using an organic-friendly cultivation method.
The objective of this study was to examine an agricultural strategy for ridge maize cultivation for accelerating early growth and increasing maize yield under suboptimal weather and soil conditions in low mountain areas in Central Europe. For this purpose, silage maize has been cultivated in ridge-shaped rows, where the plants’ development and yield were examined and compared with a traditional flat surface cultivation method over a period of 3 years.
Considering this research paper, two hypotheses were tested:
  • We hypothesise that a ridge cultivation method in silage maize will generate (a) a higher topsoil temperature at midday, (b) higher dry matter corn cob, whole plant and protein yields and (c) an increased phosphorus content in the plant biomass.
  • We hypothesise that a ridge cultivation method in silage maize results in (a) accelerated field emergence, (b) accelerated development of young plants and (c) a higher nutrient content for cattle feed.

2. Materials and Methods

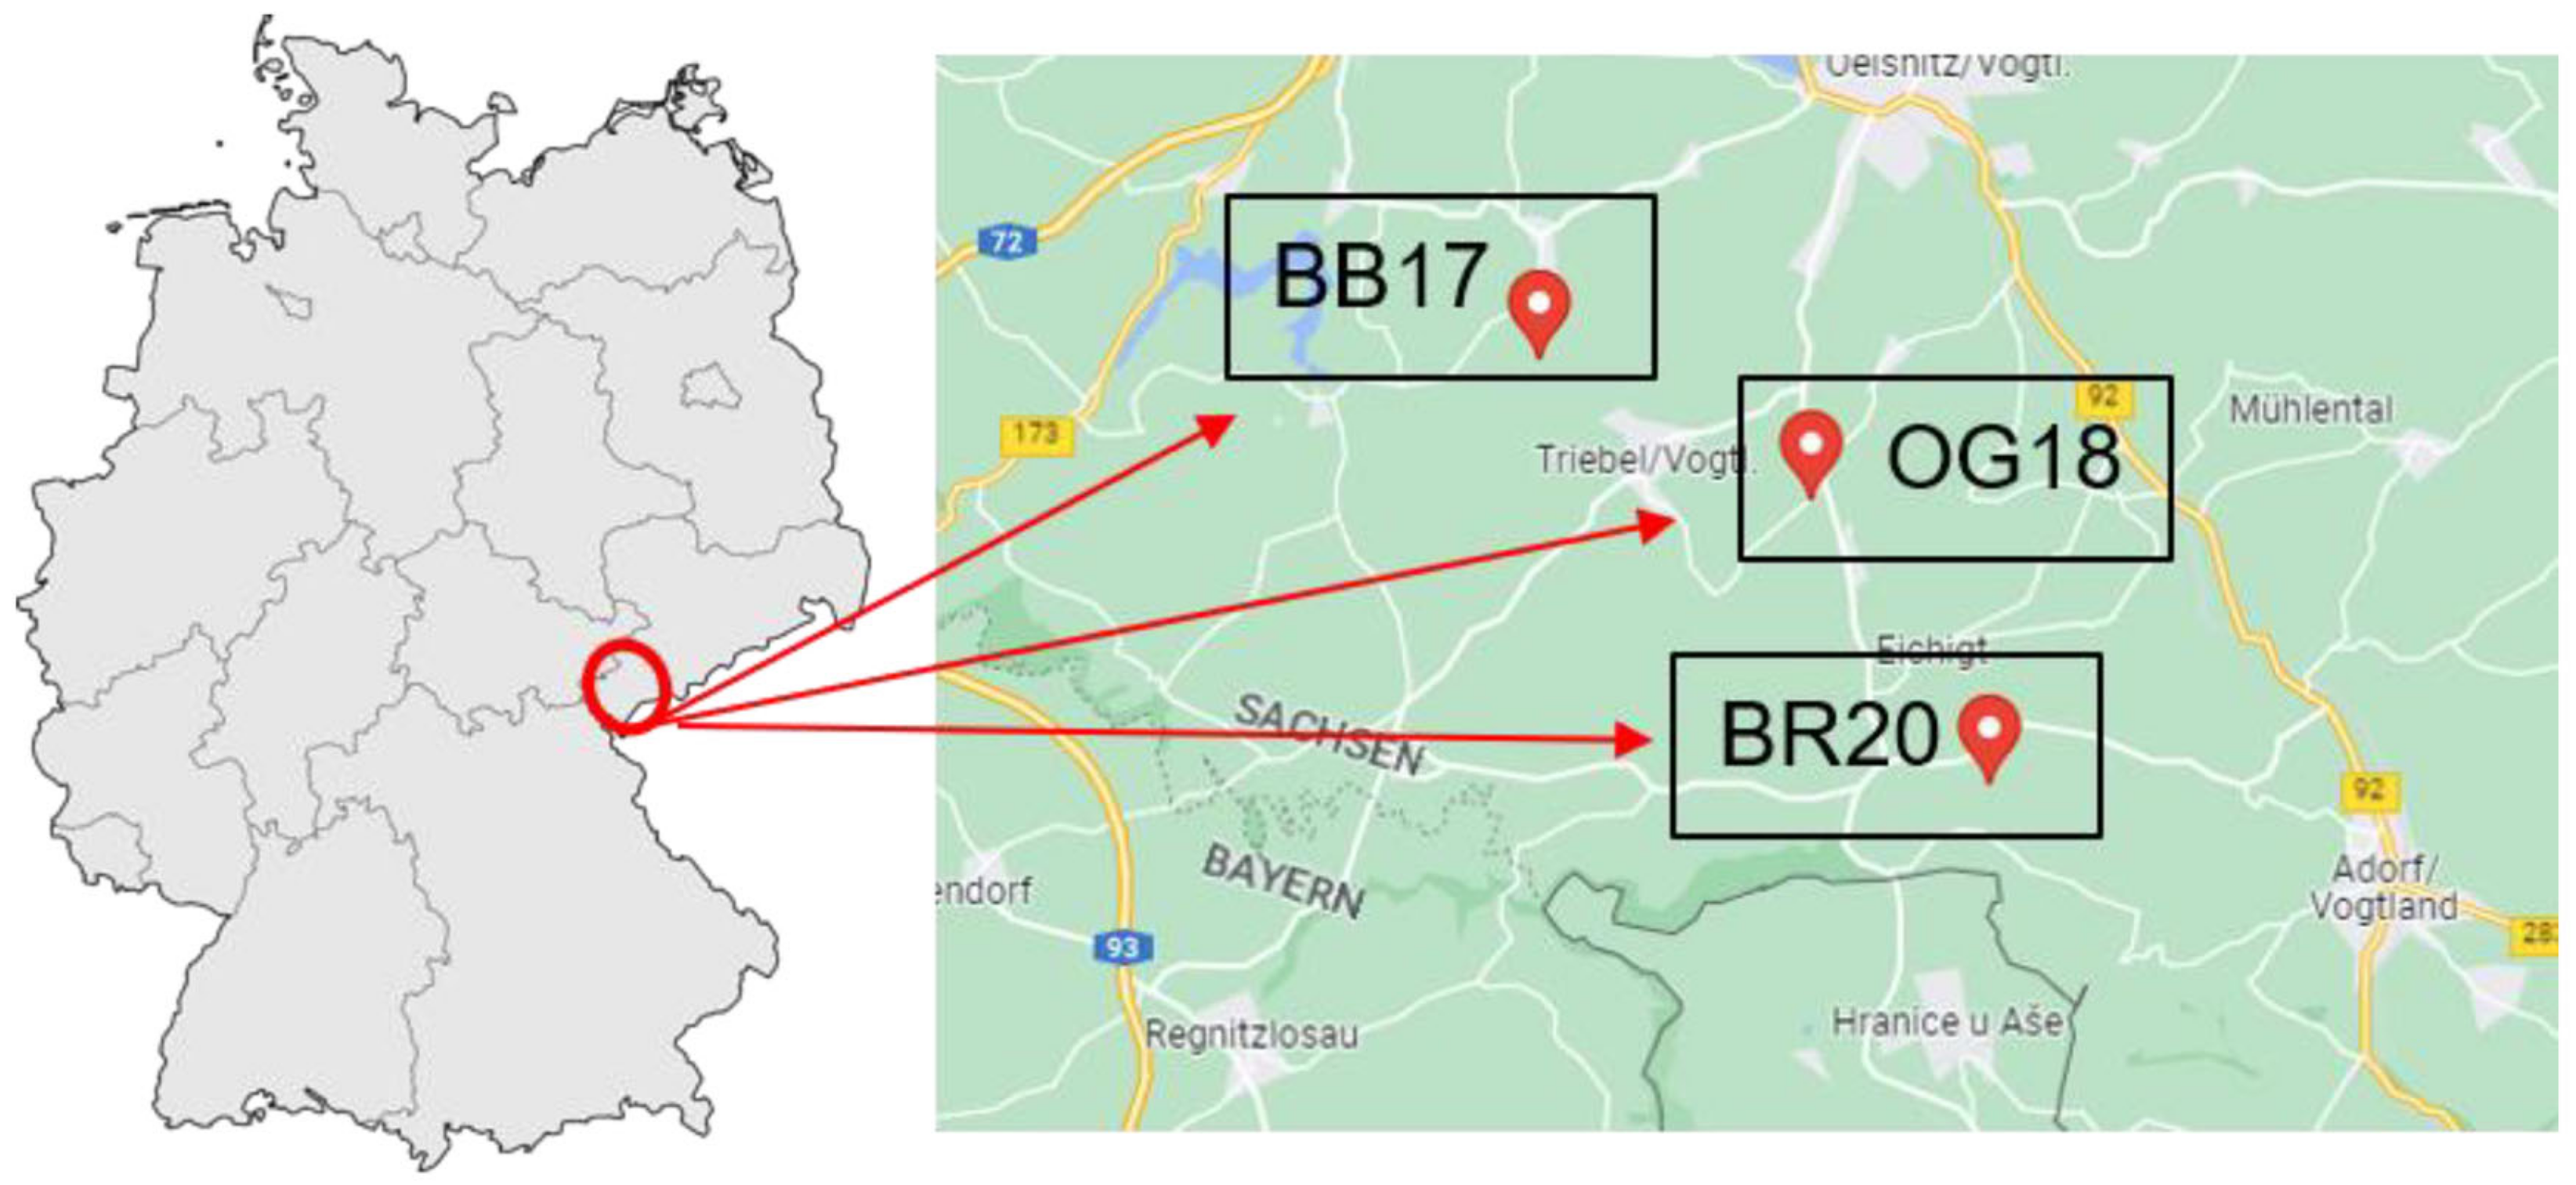
2.1. Experimental Design and Soil Sampling

In 2017, 2018 and 2020, three field trials were carried out in Central Europe, in a mountainous area in Eastern Germany, to test an innovative adaptation method for accelerating the young plant growth of maize on organically managed agricultural land under low mountain climate conditions (Figure 1).
The field trials, which are referred to as environments (Ens) in the study, were located on the site of Eichigt in the low mountains of Saxonian Vogtland, Germany (Figure 1). The spatial distance between the field trials did not exceed 10.0 km. The trials were conducted as on-farm experiments, where it was not possible to repeat the trials on the same field strike due to strict rotation crop. Therefore, Ens with extremely suboptimal growth conditions for maize but with the same soil type were purposely chosen for the experiment. The site is characterised by residual soil (sandy loam) with a high rock content. The site’s shape is a steep slope. The topsoil depth is estimated to be between 0.10 and 0.25 m, on average. The experimental design consisted of randomised blocks with eight replications in 2017 and 2018 and with four replications in 2020 in single factorial arrangement. The single factor consisted of two cultivation methods (CMs): maize seeds sown on a flat surface (flat cropping method: FCM) and in 0.15 m high ridge-shaped rows (ridge cropping method: RCM). The total experimental field’s dimension in Bösenbrunn 2017 (BB17) was 42.0 × 14.0 m, with a single plot area of 10.0 × 3.0 m. In the following years, on the sites Oberhermsgrün 2018 (OG18) and Bergen 2020 (BR20), the experiments covered a 62.0 × 17.0 m area, where the single-plot area was 15.0 × 3.75 m. The farm began converting to organic production methods in April 2016 and completed the process by April 2019.
The preceding crops on BB17 and OG18 were winter oilseed rape (Brassica napus L., 2015, conventional agricultural conditions and 2016, in conversion to organic conditions) and winter wheat (Triticum aestivum L., 2016 and 2017, in conversion to organic conditions). At BR20, a red clover–grass mix (Trifolium pratense L. and Lolium perenne L.) was used in 2018 (conversion to organic farming conditions), and winter wheat was used in 2019 (organic farming conditions). Characterisation parameters of experimental sites are shown in Table 1. Relevant annual temperature and precipitation values for the trials’ period and long-term values were summarised from the database of [23] and are listed in Table 2.
Prior to the sowing date, a reversible plough (0.15–0.20 m) and a cultivator (0.05–0.08 cm) were used for the soil preparation. A slurry was applied from the farm 2 weeks prior to sowing (2017: 129.6 kg N ha–1; 2018: 77.7 kg N ha–1; and 2020: 40.5 kg N ha–1) and milled with a rotary harrow. As the existing agricultural machinery on the farm proved to be too wide for the size of the plots, stable ridge rows were manually heaped up with a hoe in the north–south direction. In practice, on the farm, ridge rows were heaped up to 0.15 m with the help of a disc harrow. The row spacing was 0.75 m, measured from one ridge row top to the next. The total plant density amounted to 11 plants m−2, with 0.13 m seed spacing and 0.06 m sowing depth. The accuracy of the mechanical seed spacing was ±0.02 m. The maize cultivar ‘Pioneer P 7500’, a hybrid for silage with early maturity (FAO 210), was sown. Manual weed control, with a hoe, was conducted every two weeks at three dates after the sowing date. It was performed during BBCH (BBCH-scale of Biologische Bundesanstalt für Land- und Forstwirtschaft, Bundessortenamt und Chemische Industrie) Principal growth stage 1 during the development of the first leaf through coleoptile, between four and five leaves unfolded and, at last, between seven and eight leaves unfolded [24]. Soil temperature was measured at 0.05 m depth (GTH 1160 Digital Quick-Response Thermometer, Greisinger electronic, Germany) at midday, on five dates, in four-day intervals, after sowing. Afterwards, ST measurements were carried out twice a month until harvest day. The measurements were conducted on 10 randomly selected spots in each plot. Soil sampling in each plot was carried out during the experimental year 2020 using a Pürckhauer soil auger (diameter: 0.03 m, sampling length: 0.9 m). Samples were taken from five randomly selected spots in each plot, from 0 to 0.3 m, 0.30 to 0.6 m and 0.6 to 0.9 m at BBCH stages 17 (7 leaves unfolded), 55 (middle of tassel emergence: tassel begins to separate), 71 (beginning of grain development, about 16% dry matter) and 89 (fully ripe). Samples from the RCM were taken directly from the ridge. The samples, sorted by depth, were mixed to one sample per depth and plot and directly cooled to <5.0 °C, for a short transportation period. Afterwards, the samples were stored at −18.0 °C for further analysis.
For the determination of ammonium nitrogen (NH4+-N) and nitrate nitrogen (NO3-N) contents, a 0.01 M CaCl2 solution was prepared (1.47 g CaCl2 per 1.0 L deionised water). Two hundred fifty millilitres of the solution were applied to 100 g of a moist soil sample in polyethylene bottles (500 mL volume). The bottles were placed in a shaker (Heidolph, Reax 20) with overhead spinning agitation on a 15 revolutions per minute setting for 60 min. Thereafter, the soil solution was filtered (folded filter paper MN 615 1/4, basis weight 70 g m−2; diameter 150 mm; filtration time 22 s; thickness 0.16 mm; retention range > 4.0 μm), placed in polyethylene tubes (10.0 mL volume) and stored at −18.0 °C. Twenty millilitres of the filtrate was used for pH measurement (pH Meter pH 538 WTW Multical®, filtrate temperature 23.9 °C), analogous to the method described in [25]. The dry matter (DM) content was determined after drying at 105 °C for 48 h. The measurement of NH4+-N and NO3-N (mg L−1) was performed using continuous flow analysis (SKALAR SAN++; 4 measuring channels). The NH4+-N content was detected by the indophenol method (photometric determination at 660.0 nm; chemical reactors sodium dichloro isocyanorate and sodium salicylate; complexing agent sodium citrate), analogous to [26]. For the photometric determination of NO3-N, hydrazine sulphate/copper sulphate with a diazo coupling method (sulphanilamide/alpha-naphtylethylendiamine) was implemented. To determine the mineral N content (Nmin) content in the soil, the DM content of the soil material was determined for 48 h at 105 °C in a drying cabinet.
Plant-available phosphorus (P), plant-available potassium (K) and plant available Magnesium (Mg) were determined in the soil samples. Plant-available describes the fraction of total P, K and Mg content in the soil material that is available for absorption by the plants’ root system. The samples were obtained from 0 to 0.3 m, following the recommendations of [27]. For the estimation of plant-available P and plant-available K in the soil, the calcium-acetate-lactate method CAL was used. Air-dried and finely sieved soil material is shaken mechanically for 90 min in a solution of calcium lactat, calcium acetate, acetic and buffered water (pH 3.7 to 4.1). Afterwards, the solution is filtered off for the atomic absorption spectrophotometry (AAS) determination of plant-available P and Mg [28]. For the analysis of the plant-available Mg of the soil, the Skalar method (range 0.5–25.0 ppm Mg, measured at 470 nm) described by [29] was applied. Soil material was grinded and mixed with a 0.01 M CaCl2 solution, which is introduced into a flame. The solution is converted into free ground atoms, which enables the determination of Mg (flame AAS).

2.2. Evaluation of Plant Growth, Yield and Nutrient Analysis

Field emergence (FE) was determined on five dates in four-day intervals after the sowing date on randomly selected spots with a total size of 3.37 m (1.5 m × 2.25 m) in each plot during all field trials. The development stages were determined using the BBCH scale [24]. At BBCH stages 17 (7 leaves unfolded) and 55 (middle of tassel emergence: tassel begins to separate), plant height (m), number of leaves per plant and root neck diameter (mm) of 40 randomly selected maize plants per plot were measured. Readings of the chlorophyll content index (CCI) of maize leaves were conducted in 15-day periods, starting 30 days after sowing (DAS), using SPAD-502Plus, Konica Minolta. The readings were carried out on the top leaves of 30 randomly selected plants per plot, following [30].
Whole maize plants were manually harvested with a spade from an area of 3.37 m−2 per replication. Fresh matter (FM) and DM content were determined (105 °C in a drying cabinet until constant weight) for whole plants and separately for leaf, stem and root samples. The leaf blades and stem fractions were separated, as explained by [31]. Whole maize plants were harvested using pruning shears during every trial, at BBCH stage 89 (fully ripe), from an area with a size of 3.37 m−2. Whole maize plants without roots were chopped with a disk wheel shredder (cutting size 0.01–0.04 m) during all field trials. FM and DM (105 °C until constant weight) were determined in a drying cabinet for whole plants without roots and separately for leaf (including rachis and husk), stem and corncob biomass. For the analysis of %C and %N, all samples were prepared as described by [32]. The analysis of %C and %N proceeded identically to that of the soil samples (2.1).

2.3. Nutritional Quality of Fodder Maize

Nutrient analysis was conducted on mixed chopped (0.01–0.04 m) plant samples (stem, leaf, corncob, rachis and husk) dried for 24 h at 30 °C in a drying cabinet. The chemical components crude ash (CA), crude protein (CP), crude fibre (CS), crude fat (CF), sugar, starch, acid detergent fibre (ADF), usable crude protein (uCP), rumen nitrogen balance (rNB) [g kg−1 original substance—OS], enzyme soluble organic matter (ELOS [%]), mega-calories per kg DM (NEL) and metabolizable energy (ME) [MJ kg−1 OS] were analysed using the NIRS method [33]. There are no available values for sugar and ADF in BB17 due to limitations of the laboratory.

2.4. Statistical Analysis

For the implementation of all analytics, the statistical software SAS (version 9.3, SAS Institute Inc.) was used. The test for normal distribution was carried out with the Shapiro–Wilk test [34], whereby non-normally distributed data were transformed according to [35,36] using the following functions: 1:x, √(x), x2, √(1:x),1:x2, log(x). Data were analysed using the PROC MIXED statement. Each statistical analysis was performed with the original data. All graphical representations of the results were created with the SigmaPlot programme (Version 12.5, Systate Software Inc., Cary, NC, USA).
The Tukey–Kramer test (p < 0.05) was used for the one-factorial and for the two-factorial analysis (multiple comparisons) of means [37]. The statistical evaluation of the data, as well as their presentation, was carried out with arithmetic mean values and an indication of the standard error of the mean (SEM). The one-factorial analysis compared both CMs within one En. For the multiple comparisons of all En, two factors were used (CMs and site environments) [38]. The CMs were used as a fixed variable, and the site environments represented a random variable. Significance refers at p < 0.05.
Because maize plants have a particularly low plant density, honestly significant differences (HSD) for plant parameters in the one-factorial and tendential significance in the two-factorial analysis are indicated. HSD visualises how large an observed difference must be in the one-factorial procedure to call it significant at p < 0.05. Tendential significance refers to p values ranging from 0.05 to 0.09.
The Pearson correlation was conducted in two steps. The linear correlation between the characteristics was first checked with scatter plots in SigmaPlot (Version 12.5, Systate Software Inc., Cary, NC, USA). Afterwards, data analysis was confirmed using the PROC CORR and PROC REG models of SAS [35].

3. Results

The three examined Ens had different weather conditions during the trial periods; the vegetation period in En BB17 was more typical for low mountain ranges, where higher amounts of precipitation were registered during the maize growing period. However, the mean monthly temperatures were higher than the long-term values. En OG18 was marked by prolonged periods of heat and half as much precipitation (Table 2). The last examined En, BR20, started typically with low temperatures and high precipitation in the spring, dry summer at first and suddenly a lot of precipitation with hailstorms, which led partially to leaf tip breaks.
The three examined Ens also showed variable plant-available P content with increasing altitude above sea level. En OG18, the altitude of which was in the middle, indicating the highest plant-available P content. The En with the highest altitude (BR20) showed a very low plant-available P content. The content of plant-available Mg did not vary much between the Ens. However, the content of plant-available K varied greatly between the Ens, with the lowest value seen at the highest altitude (Table 2).

3.1. Evaluation of Soil Nutrients, Temperature and Maize Field Emergence

To show how both CMs FCM and RCM affected soil nutrient content, as well as soil temperature, essential soil nutrients (N, P, K, Mg) and soil temperature at midday (2.1), under low mountain soil conditions, they were separately analysed.

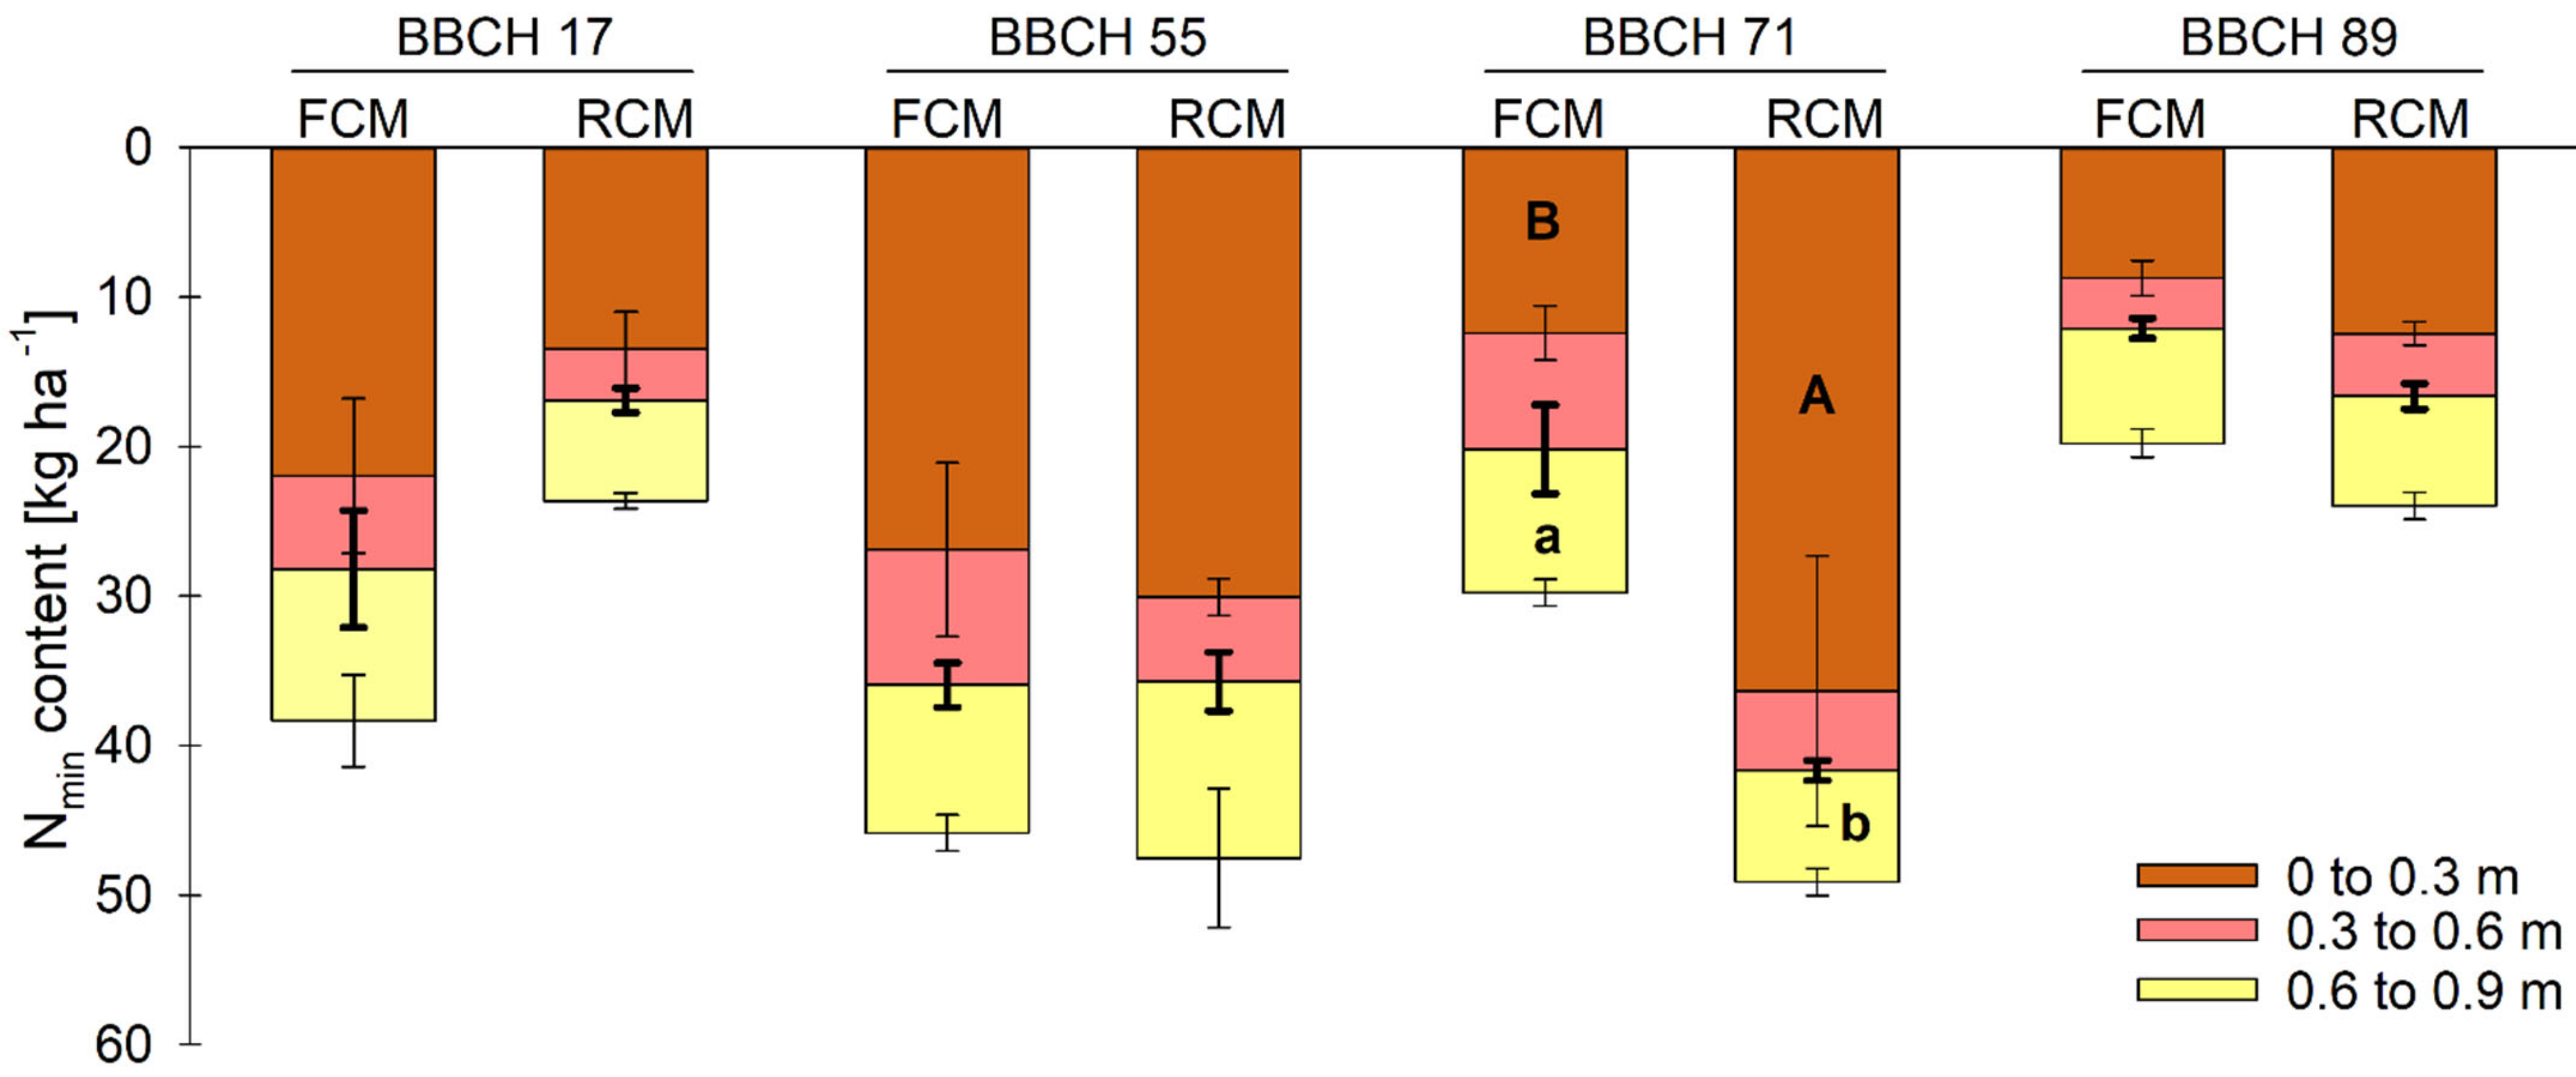
3.1.1. Soil N Content

The content of NH4+-N and NO3-N at BBCH 17 for FCM in all soil depths was higher, with the greatest difference seen at 0 to 0.3 m (Figure 2 and Supplementary Materials Table S1). At BBCH 55, the picture at 0 to 0.3 m was reversed; the higher levels of NH4+-N and NO3-N were registered in RCM. A decrease in NH4+-N was observed in both FCM and RCM, mainly at 0 to 0.3 m. The NH4+-N content at BBCH 17 differed by 2.25 kg ha−1, while at BBCH 55, the difference was only 0.05 kg ha−1 (Table S1). The means from 0.3 to 0.6 m and 0.6 to 0.9 m decreased slightly in both the FCM and RCM, but no significant differences were found. The NO3-N content increased in both CMs from 0 to 0.3 m in favour of RCM. None of the means of NO3-N and Nmin were significantly different (Figure 2 and Table S3).
At BBCH 71, the difference in NH4+ content continued to grow; it was almost twice as high at 0 to 0.3 m in RCM as that in FCM. In the 0.3 to 0.6 m soil layer, RCM also showed a significantly higher NH4+-N content. The same picture was seen for NO3-N in 0 to 0.3 m, where RCM showed a few outliers. The distribution of the NH4+-N and NO3-N values between the FCM and RCM in the other soil depths remained similar to the previous sampling date (BBCH 55). Except for 0 to 0.3 m (FCM: 12.40 kg ha−1 and RCM: 36.35 kg ha−1), there were no significant differences between Nmin in the other soil layers.
At BBCH 89, an increase in NH4+-N content was recorded in both CMs, with RCM showing approximately 0.25 kg ha−1 more NH4+. At 0.3 to 0.6 m, both CMs showed almost equal values, while at 0.6 to 0.9 m, FCM had a 0.03 kg ha−1 higher NH4+-N content than RCM. NO3 -N levels were significantly higher in favour of RCM only at 0 to 0.3 m (FCM: 7.91 kg ha−1, RCM: 11.38 kg ha−1). Additionally, NO3-N and Nmin values were almost the same at 0.3 to 0.6 m, while FCM showed slightly higher values at 0.6 to 0.9 m (FCM: 7.46 kg ha−1, RCM: 7.07 kg ha−1). No statistically significant difference was found at either soil depth for BBCH 89.

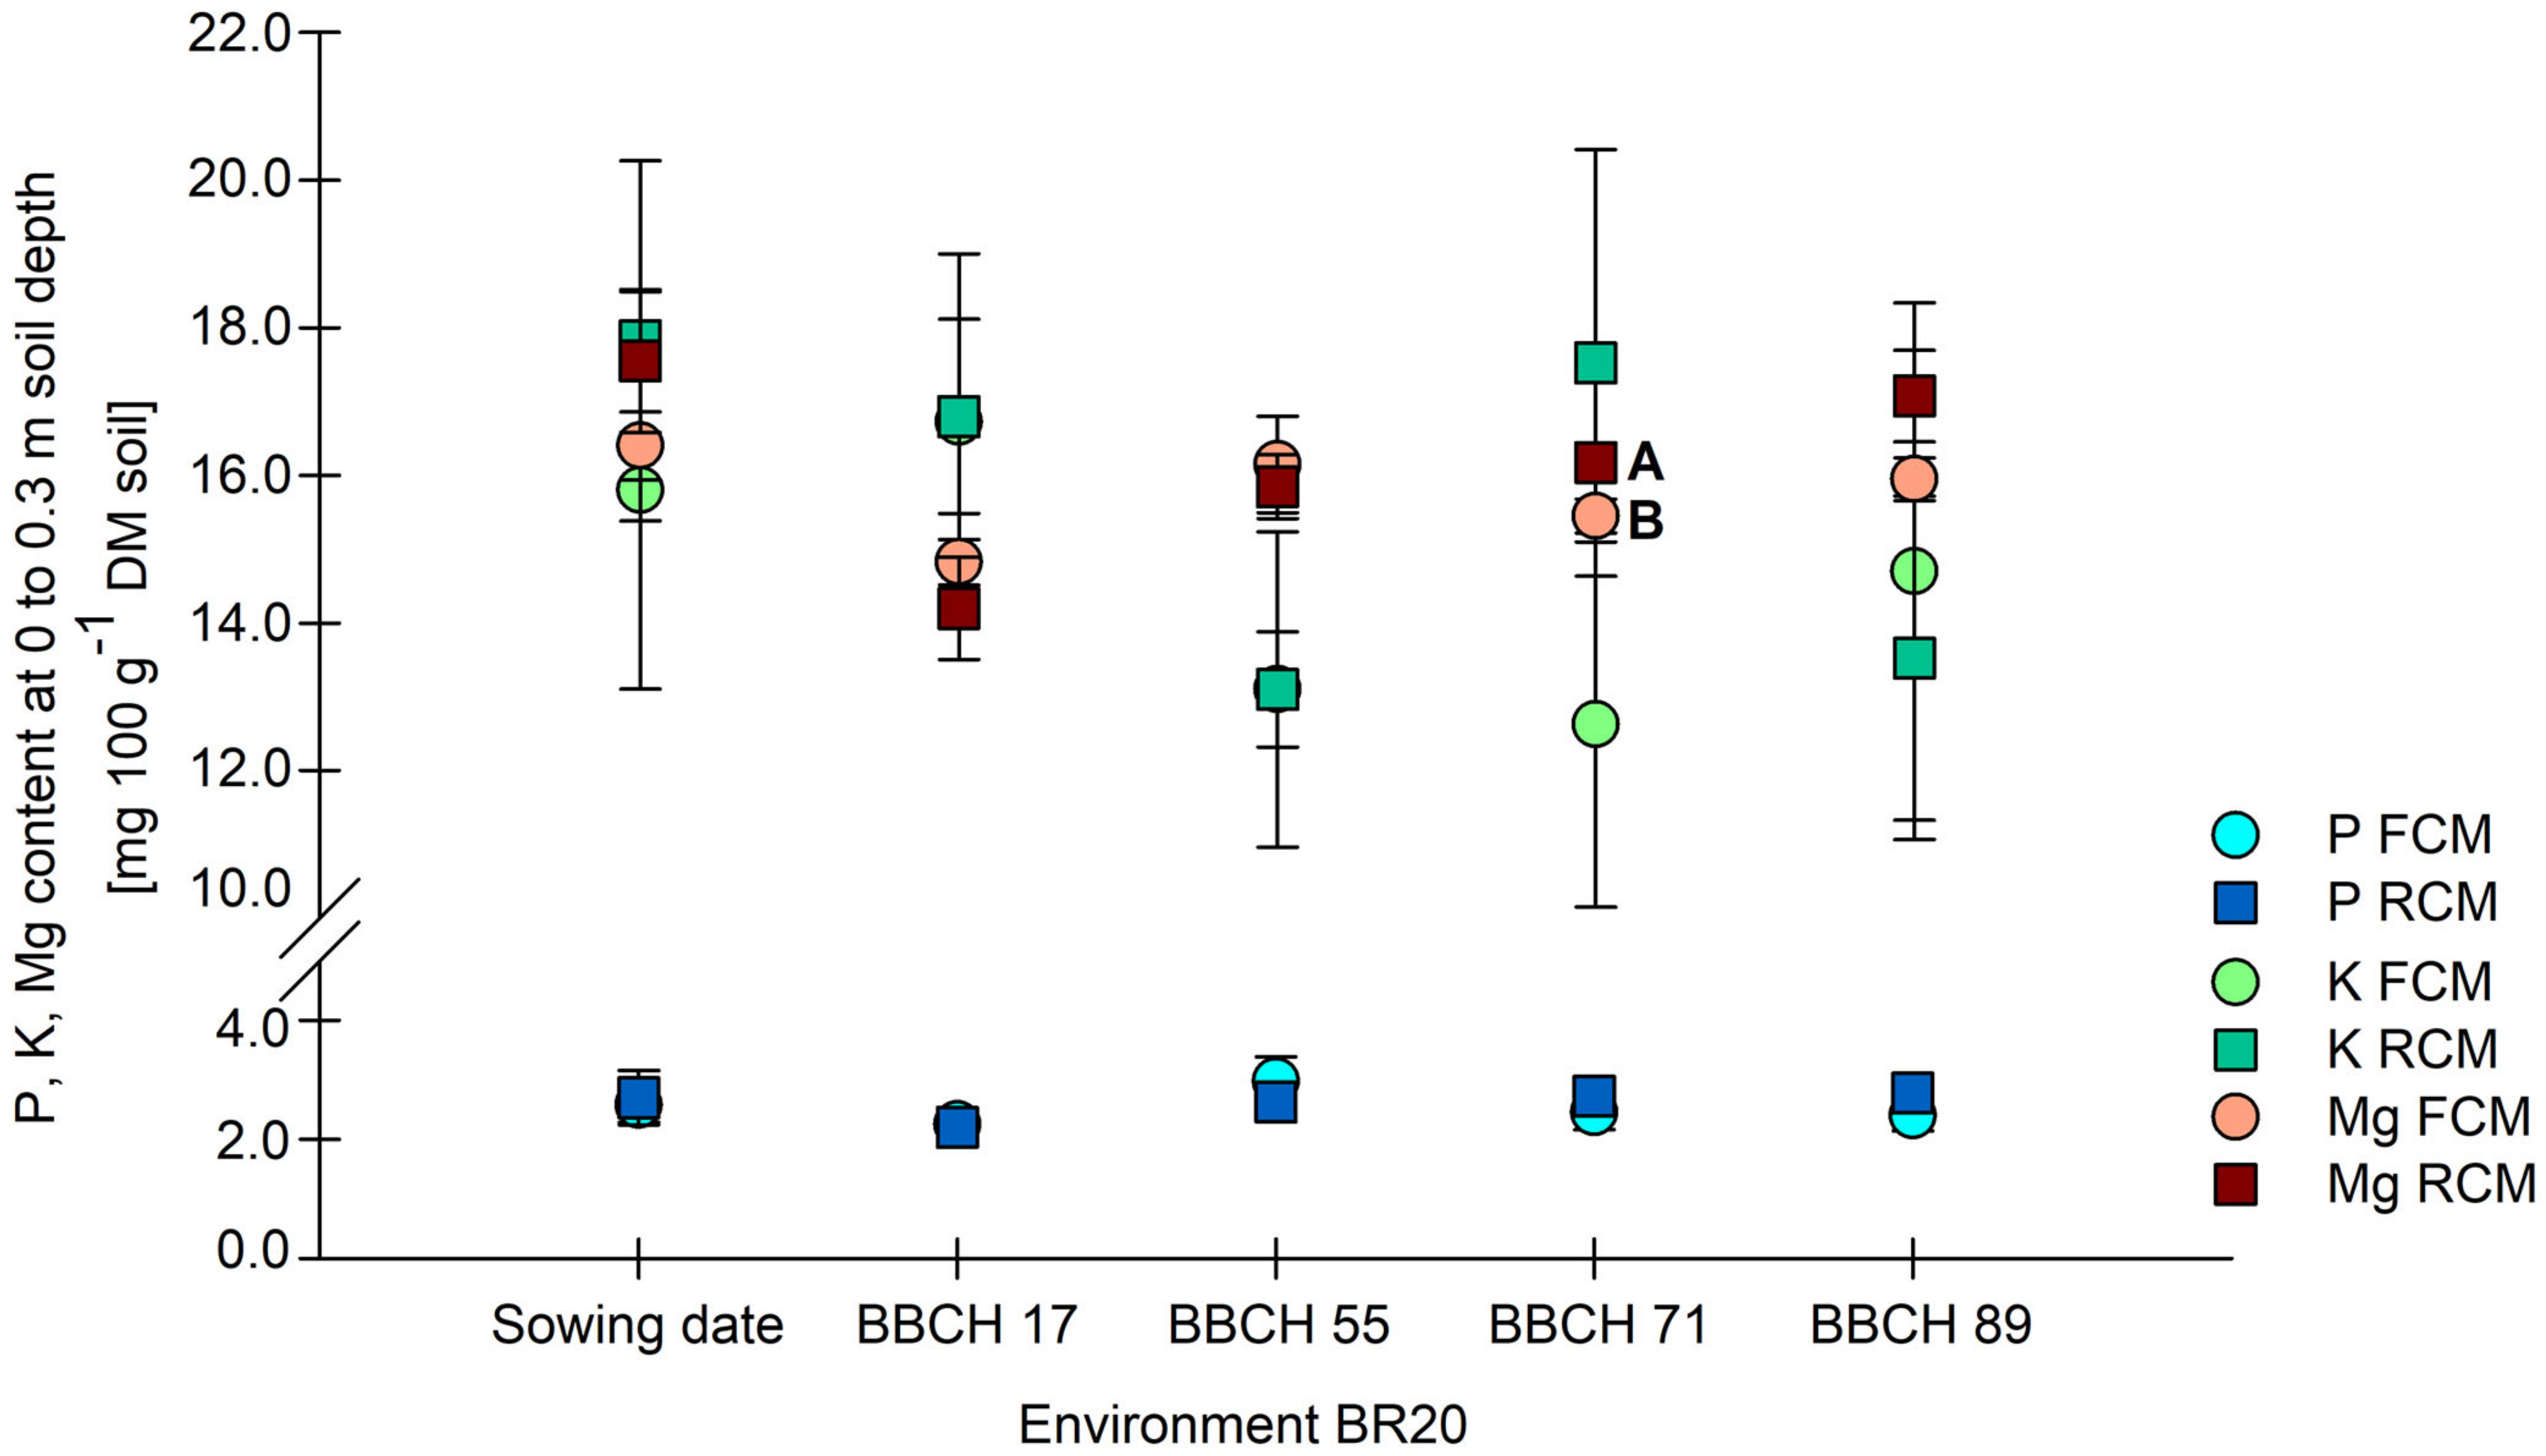
3.1.2. Plant-Available P, K and Mg in Soil

The higher content of plant-available P in the soil alternated between FCM and RCM. At sowing, RCM had a slightly higher P content (Figure 3). During BBCH 17, FCM and RCM showed the same values. FCM registered a higher P content during BBCH 55. However, from BBCH 71 onwards, the P content in RCM remained higher than in FCM.
The K content of the soil showed that the development in the first three months of plant development was similar to Mg. From BBCH 71 onwards, the K content in RCM increased compared to FCM and decreased again in BBCH 89. As shown in Figure 2, the standard error of both CMs at BCCH 71 was high. One outlier per CM was identified in the plant-available K values, where FCM had a very low (6.10 mg 100 g−1 DM soil), and RCM had a very high K value (24.60 mg 100 g−1 DM soil) within the same block.
The content of plant-available Mg in the soil changed in favour of RCM during maize cultivation (Figure 2). Although in BBCH 17, RCM and FCM had similar values and FCM had a slightly higher Mg content in BBCH 55, the Mg content in RCM remained higher until harvest time (BBCH 89). During BBCH 71, the value of plant-available Mg was significantly higher than that of FCM. Despite the Mg increase at harvest time, no significant differences were reached due to outliers.

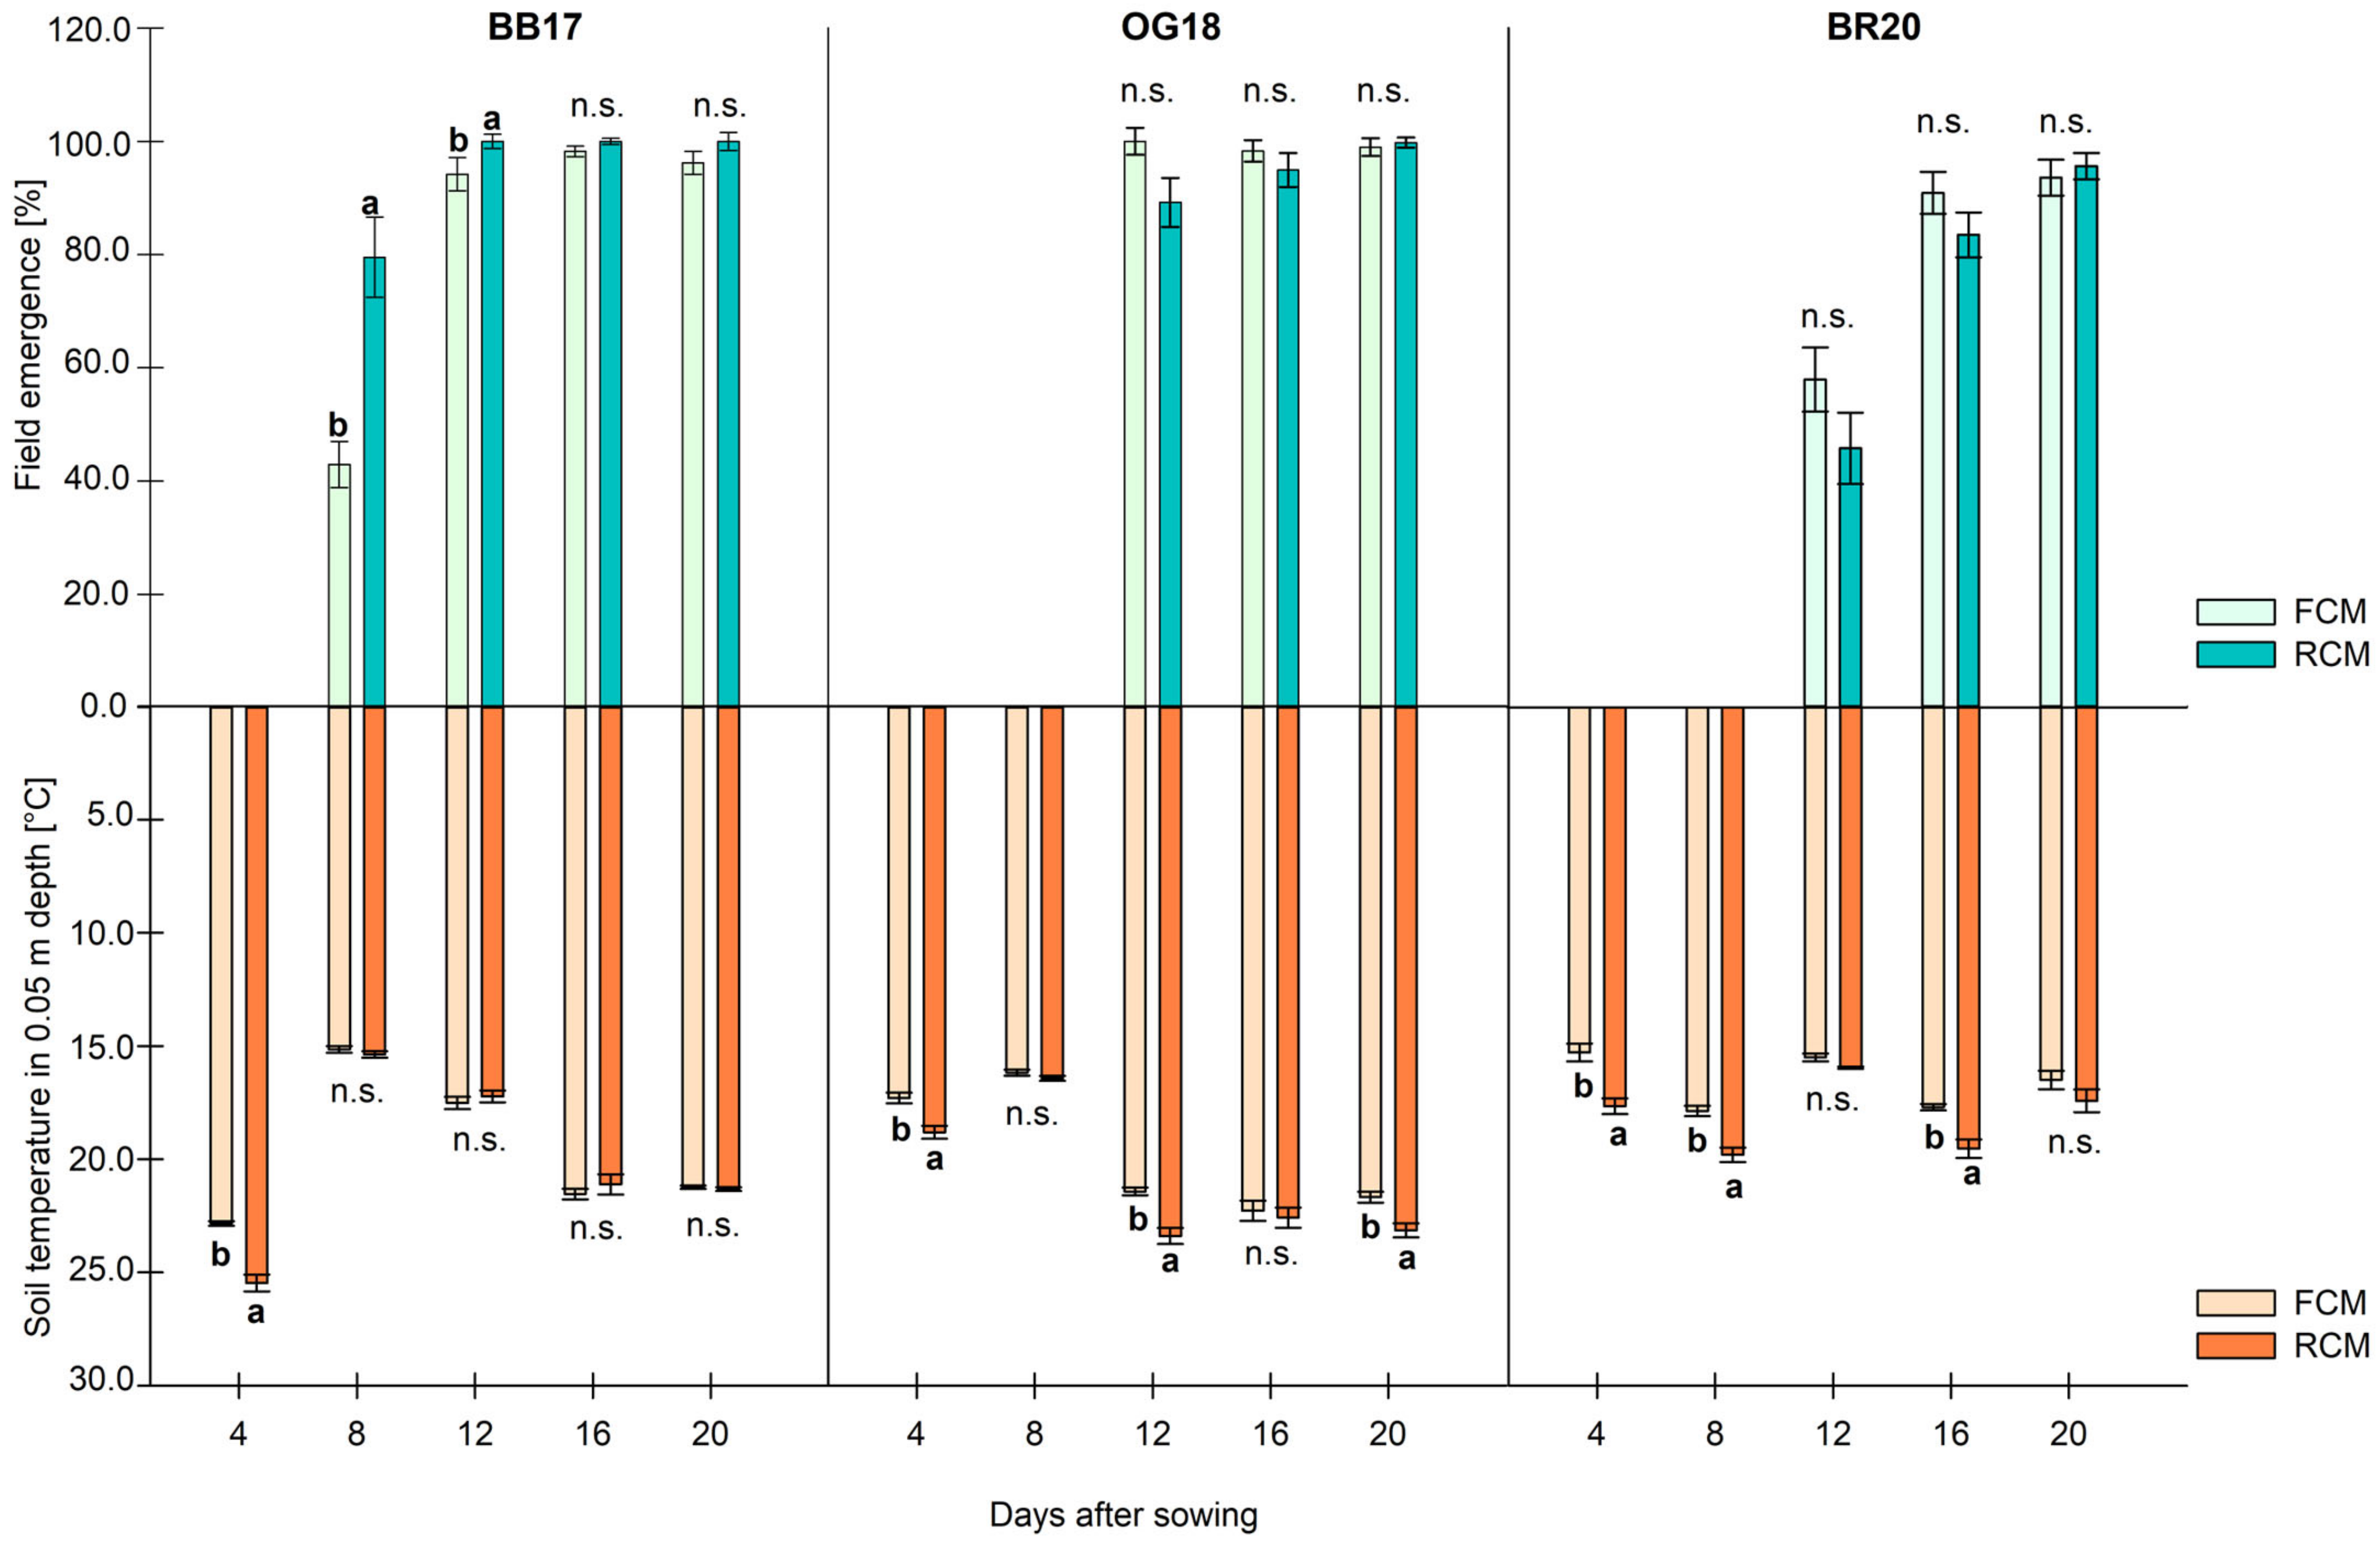
3.1.3. Soil Temperature and Field Emergence

Significant differences were observed in the FE measurements (Figure 4) 8 and 16 DAS in 2017. Eight DAS, FE was almost twice as high for RCM (79.5%) as for FCM (42.9%). From the 16th day after sowing, the difference between both cultivation methods was not as great as after 12 days, but more plants emerged in RCM. No significant differences in FE were observed between Ens OG18 and BR20, where the first seedlings did not germinate until the 12th day after sowing. In EN OG18, 89.2% FE was registered on day 12 in RCM, while FCM had already reached 100%. In 2020, the FE of RCM reached 45.7% and was behind FCM at 57.9%, which tended to be significant (p = 0.07). Both CMs showed outliers in one of the repetitions, which is the reason for the higher standard error. Sixteen DAS, RCM was at 94.9% (2018) and 83.5% (2020), which was not significantly behind FCM (98.3% in 2018 and 90.9% in 2020). However, both CMs reached equal values 20 DAS.
The soil temperature (ST) in RCM was significantly higher by 2.3 °C at 4 days after sowing (BB17), which was the highest difference in all Ens. This trend also remained at day 4 in OG18 and BR20, when RCM had an average of 18.8 °C, and FCM had a lower average temperature of 17.2 °C (Figure 1). The ST difference between the CMs on day 12 was not great (0.4 °C difference), while a significantly greater difference was recorded again on day 16 (1.8 °C).

3.1.4. Correlation between Soil Temperature and Field Emergence

The ST measurements and FE of maize also showed a positive correlation at certain measurement dates (Table 3). Pearson’s correlation did not show any significant difference between FCM and RCM at BB17, but ST and FE in FCM correlated positively at 12 and 16 DAS. ST and FE showed a high linear correlation (r = 0.80) in RCM at day 12 one year later (OG 18), where FCM resulted in a negative r value. During BR20, RCM showed a high positive correlation between FE and ST 12 DAS. Positive but insignificant results were found in RCM 16 and 20 DAS. FCM did not perform well compared to RCM in the last En (BR20).

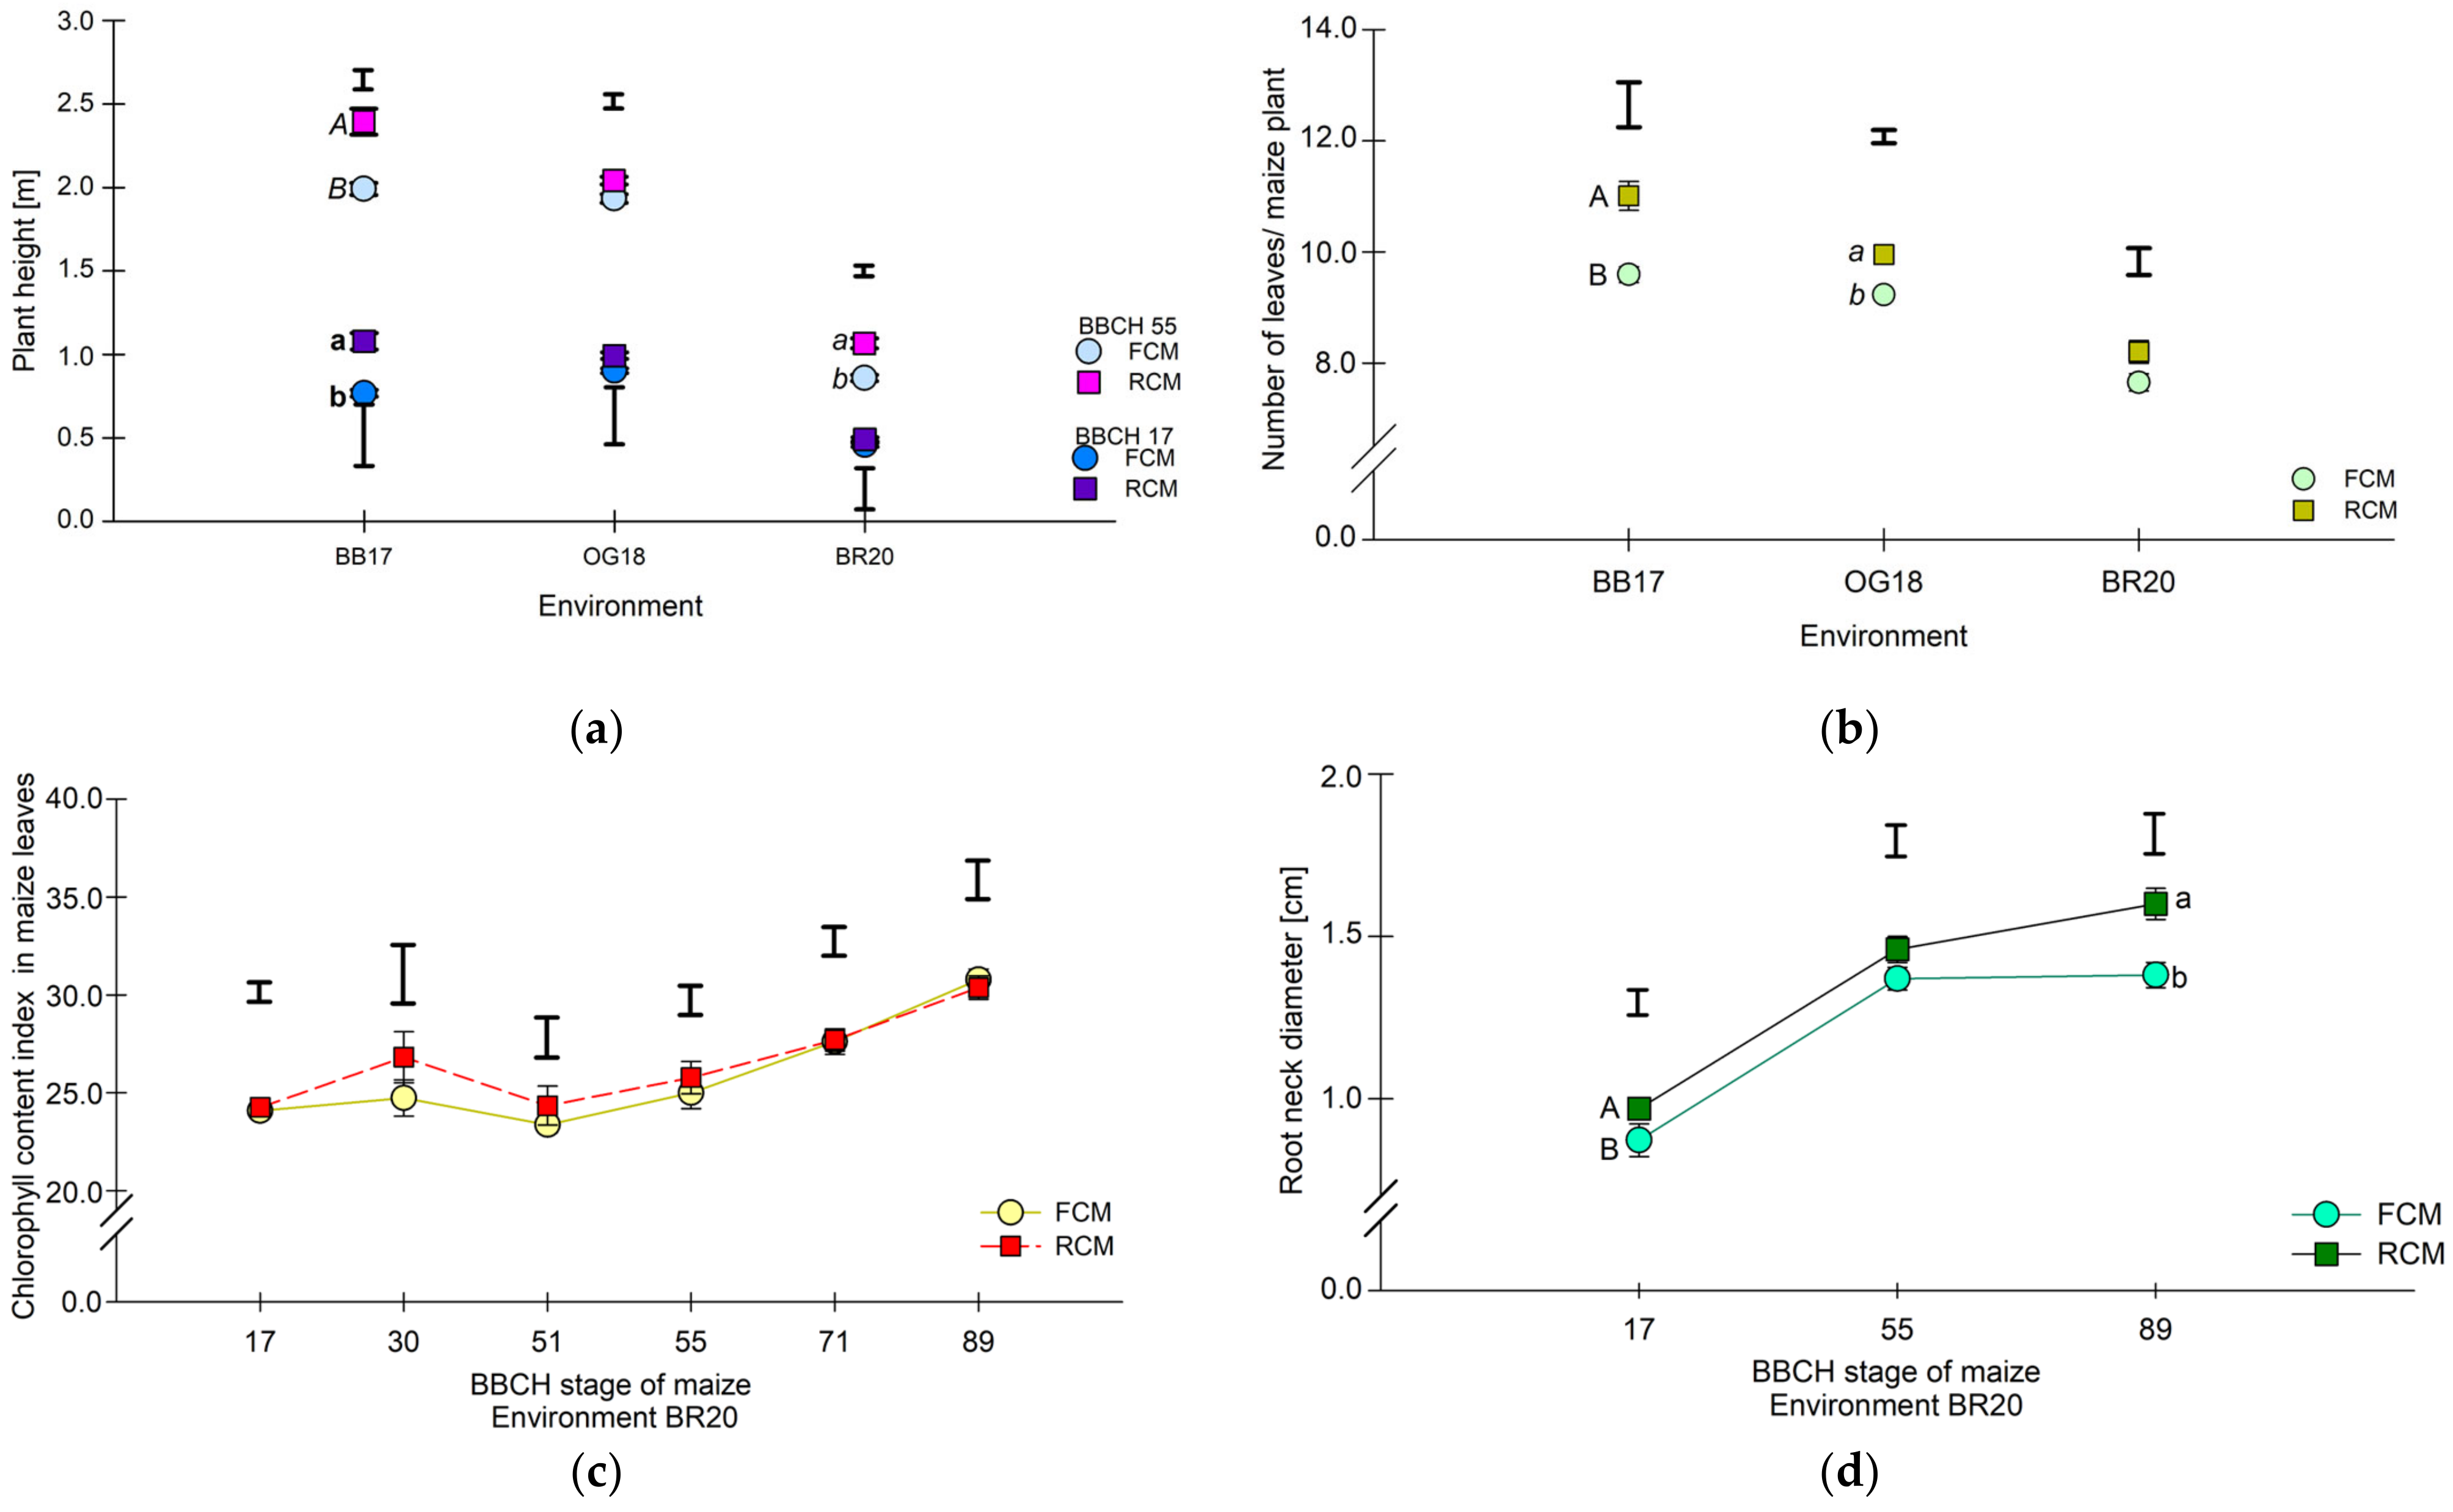
3.2. Evaluation of Plant Development

In order to study and compare FCM and RCM and how both CM affect the development of young maize plants, four parameters (2.2) were separately and combined analysed.

3.2.1. Plant Development

The plant height (PH) values were significantly higher in the RCM in BB17 and BR20 (Figure 5a). During BB17 BBCH 17–18, the plant height of RCM (1.08 m) was about 0.3 m higher than that of FCM with 0.8 m. More than a month later, during BBCH 55–59, the difference remained about the same: 2.4 m for RCM and 2.0 m for FCM. In 2018, the differences amounted to about 0.1 m at BBCH 17–18 and at BBCH 55 equally, with the advantage of RCM. In BR20, the PH of RCM plants was significantly higher than that of FCM plants during BBCH 55–59.
In terms of the average number of leaves per plant (NLP), RCM showed a lead over FCM which was significant in all three field trials (Figure 5b). In BB17, a maize plant from the FCM had an average of 9.5 leaves, while the plants from the RCM had an average of 11.0 leaves. During OG18, the difference was smaller (9.2 NLP in FCM and 9.9 in RCM), but the values of the plants examined were evenly distributed and showed the smallest LSD of all field trials. During the measurement, wilted plants were observed. In BR20, the difference between the variants was greater again (7.6 NLP in FCM and 8.2 NLP in RCM), but these values were the lowest for all Ens.
There was no significant difference regarding the chlorophyll content index (CCI) between FCM and RCM over the six different development stages that were analysed (Figure 5c). CCI started almost the same for FCM at 24.0 and for RCM at 24.2 and then increased to 26.8 for RCM, while FCM increased slightly (24.7) at BBCH 30. The largest difference occurred during BBCH 30, but the values showed a large scatter, which is the reason for the high LSD. Between BBCH 51 and 89, CCI increased slowly, with FCM and RCM showing the same CCI value at BBCH 71. At BBCH 89, the CCI of FCM increased slightly above the value of RCM.
The RCM significantly affected the root neck diameter (RND) of maize plants during BBCH 17 and 89 (Figure 5d). It should be noted that the average RND of the RCM variant at both BBCH 17 and 55 was 0.09 cm thicker than the mean FCM values. However, the measured values at BBCH 55 showed a greater scatter, whereby the LSD increased. During BBCH 17, the LSD was 0.07 cm, while at BBCH 55, it was 0.09 and thus tended to be significant (p = 0.07). The positive effect of RCM on RND was clearly visible at BBCH 89, when the average mean was 1.6 cm, in contrast to 1.3 cm in FCM.
Cultivation under RCM resulted in slightly higher FM and DM yields of maize plants and roots during BBCH 17 (Table S2). The average FM weight of a single whole maize plant was lower than that of RCM maize plants. N and P accumulation, %N and the C:N ratio did not differ substantially between the CMs at BBCH 17. At BBCH 55, there were major differences between the CMs; the maize plants under RCM generated 30.21 dt ha−1 more FM and about 5.0 dt ha−1 more DM yield. Another major difference was found in the average FM weight of a single whole maize plant, where RCM recorded a 30% FM weight. For N concentration, FCM showed moderately higher values in maize stems, as well as in the whole maize plant.

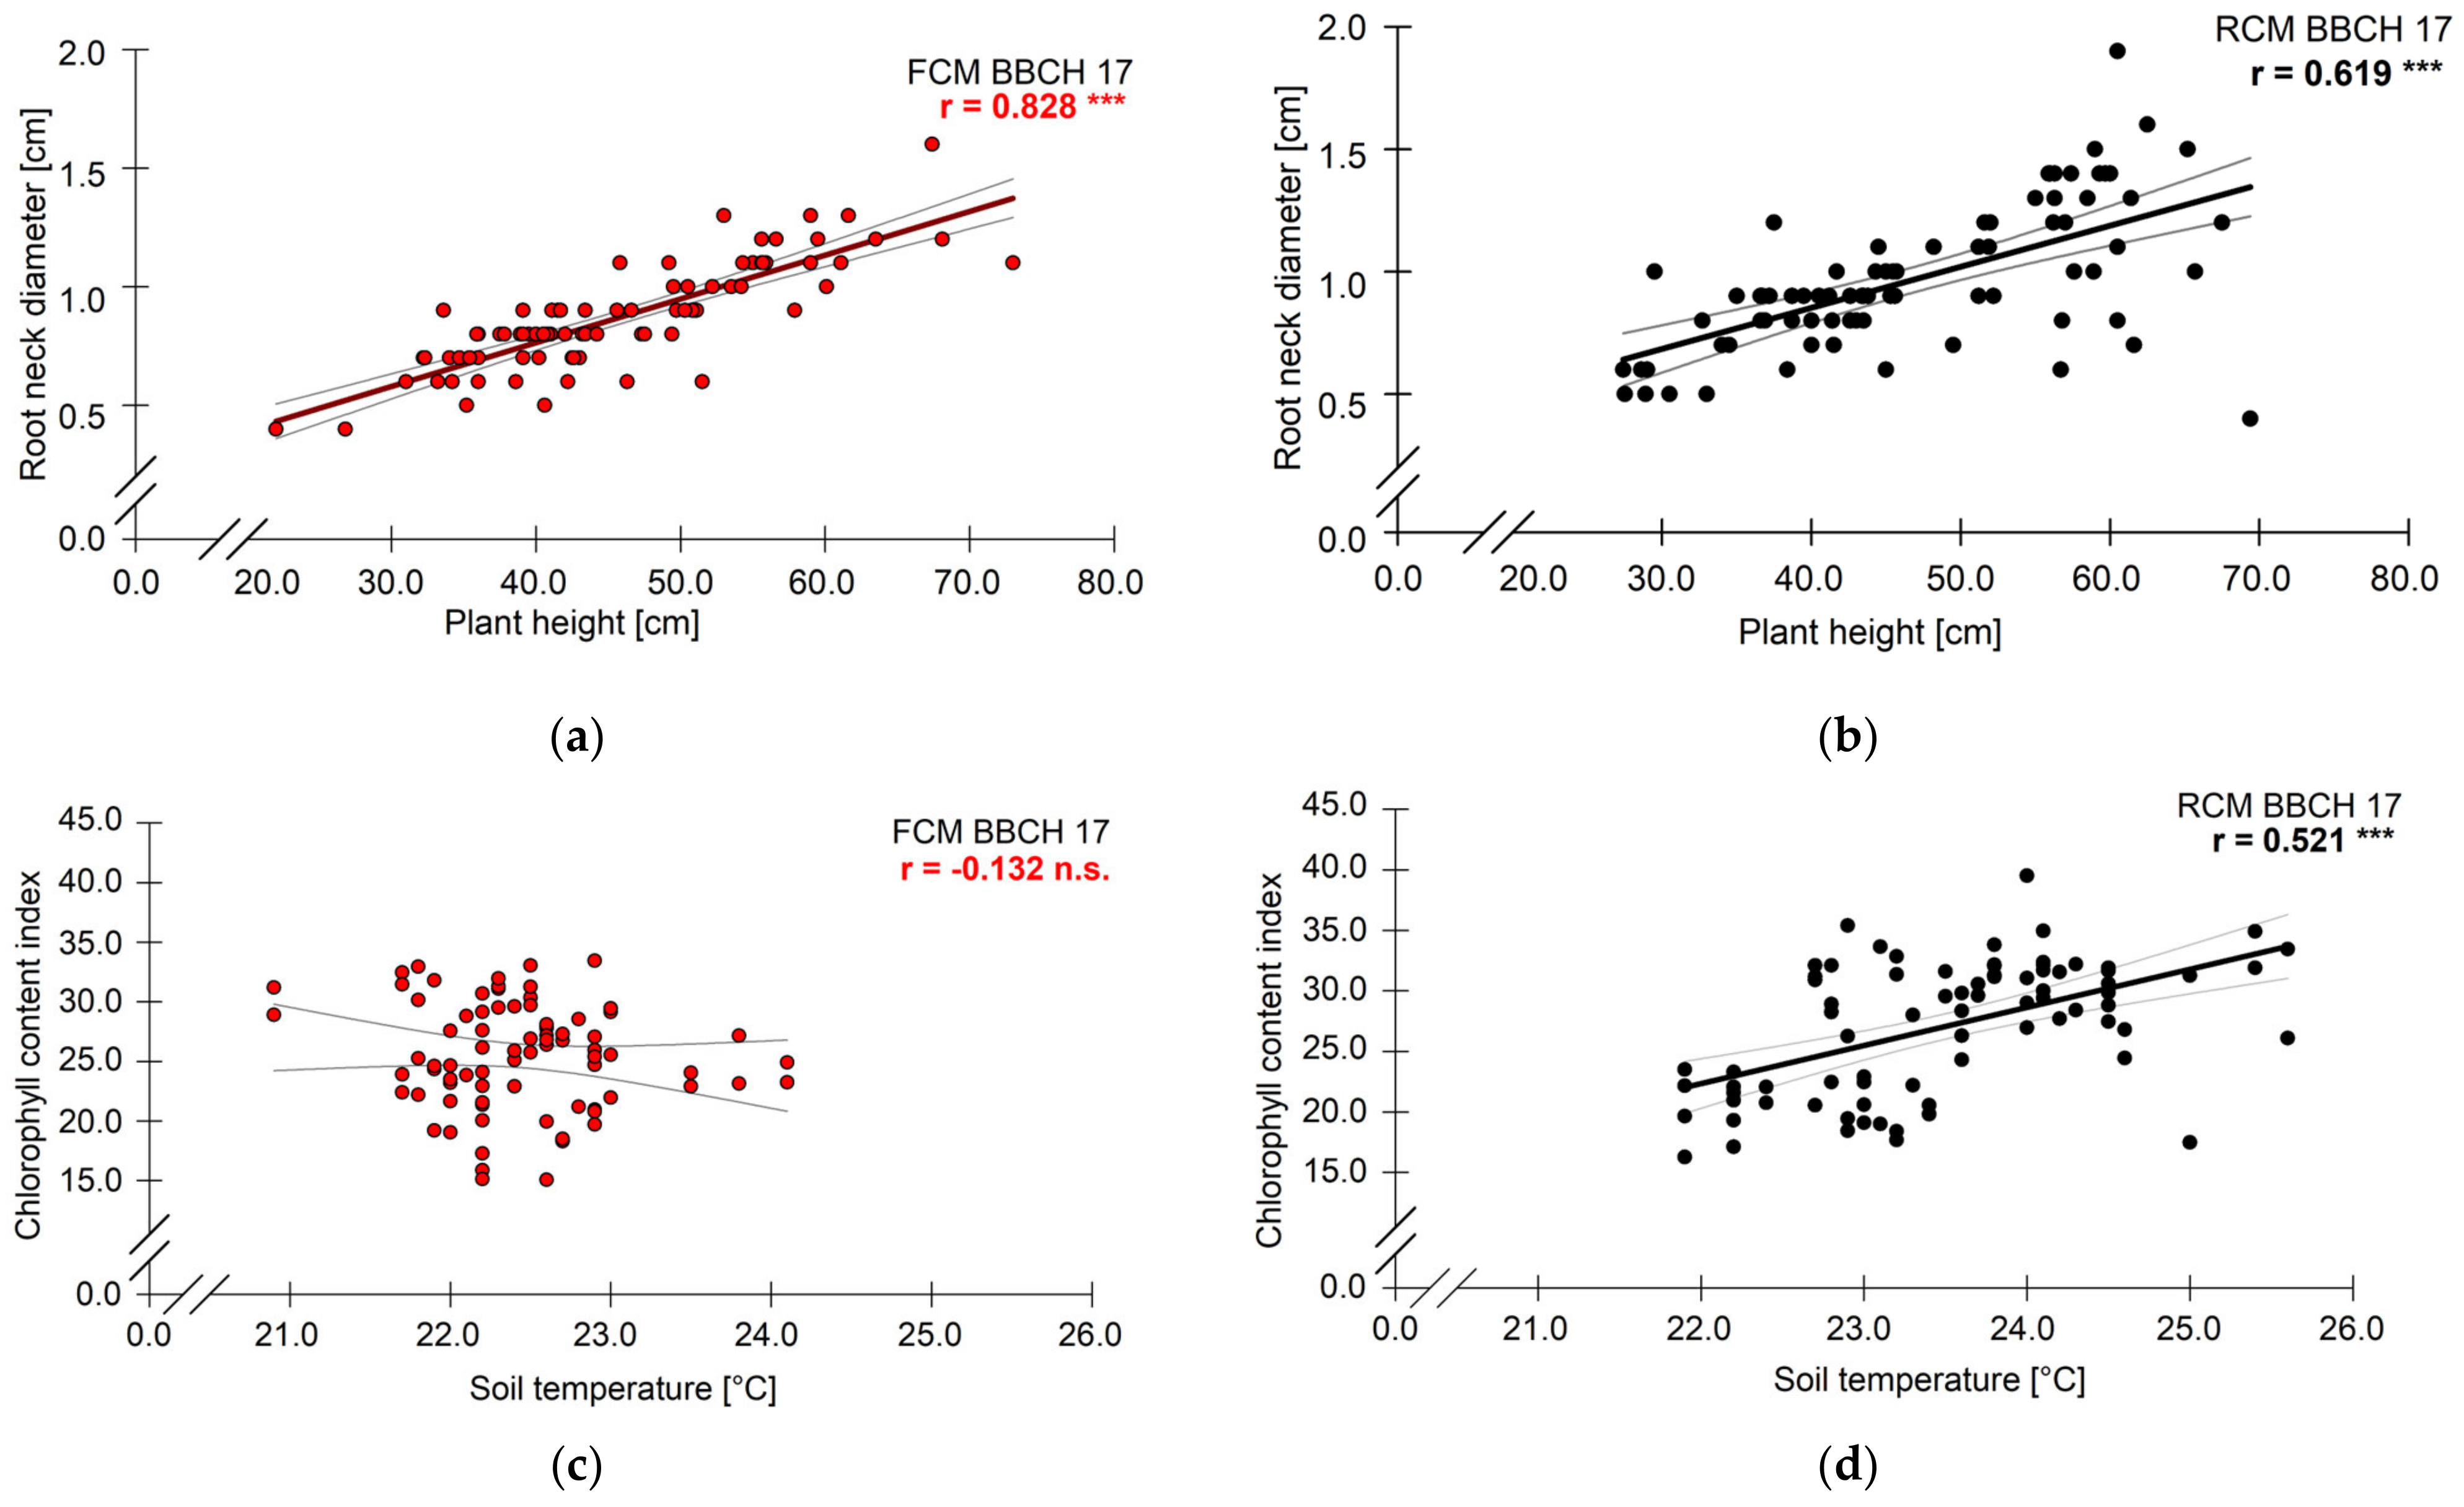
3.2.2. Correlation of Plant Development Parameters

A high linear correlation was found between plant height and root neck diameter for FCM during BBCH 17 (r = 0.83) (Figure 6a), while RCM showed a clear linear correlation at r = 0.62 (Figure 6b). Positive but low correlations, which were not significant, were found in FCM at stage 17 between ST and PH, ST and RND and CCI and ST (Figure 6c). Although r values were lower, the CCI showed a significantly positive correlation with ST in the RCM (Figure 6d). RCM had no significant effect on any of the other correlated parameters at BBCH 17. During the plant development stage (BBCH 55), all correlations in both CMs were lower than in the previous BBCH stage 17.
The other parameters were not significantly correlated with each other, but ST and PH, as well as CCI and RND, in FCM correlated positively. CCI showed a better correlation with PH and RND in RCM than in FCM.
Maize plant development was positively influenced by RCM in BR20. Since most of the parameters of plant development were made in En BR20, few differences were statistically confirmed. BR20 had the highest altitude and the lowest plant-available P content, which are conditions particularly unfavourable for maize.

3.3. Crop Yield, Nutrient Content and Fodder Value

The highest difference between FCM and RCM is illustrated by the FM yield (whole plant) and by the DM yields of the whole plant and corn cob (Table 4). RCM showed a higher FM and DM whole plant yield over all Ens, with CM tending to be significantly off. The one-factorial analysis showed a significantly higher DM yield of whole plants in contrast to FCM and to the other Ens for both parameters in BB17 (Table S3). The DM yield of leaves and husks reflected the results of FM and DM whole plant yield, with only mean values of CM tending to be significant (p = 0.07). DM stem yield showed no significant differences between En and En × CM, but CM was clearly significant, where the mean of RCM was also significantly higher than FCM. None of the factors influenced the DM corn cob yield over En. The DM corn cob varied greatly among the individual Ens. At BB17, the mean corn cob yield for FCM was 6.91 t ha−1, and for RCM, it was 8.98 t ha−1. It then decreased drastically to 1.56 t ha−1 (FCM) and 1.6.9 t ha−1 (RCM) in OG18. At BR20, the DM corn cob yield increased to 3.05 t ha−1 in FCM and to 3.5.7 t ha−1 in RCM, which was half of the means from BB17 (Table S3). The one-factorial analysis revealed that DM corn cob yields of FCM and RCM differed significantly from each other in BB17 and BR20 in favour of RCM (Table S3).
The proportion of leaves, husks and corn cobs of the total DM plant yield showed similar mean values and statistical results over all field trials; En, as a factor, influenced both parameters significantly (Table 4). RCM’s leaf and husk proportion resulted in a significantly lower percentage than FCM and vice versa; RCM showed a significantly higher proportion of corn cob than FCM over every En.
Regarding CP yield, RCM showed significantly higher mean values for whole plants, as well as for leaves and stems, while corn cob CP yield showed higher yields in RCM, but these differences were not significant (Table 4). Additionally, the values varied greatly between all three Ens, with OG18 showing the lowest CP yield in both CM for whole maize plants (Table S3).
Increased N accumulation was registered in the whole plant and in individual plant parts under RCM. In OG18 and BR20, about 20.0% more N accumulated under RCM than FCM (Table 5). However, the N accumulation varied between OG18 and BR20 for the whole plant and corn cob; therefore, the En factor was significant in both analyses.
No significant differences were found when P accumulation was examined (Table 5). However, FCM displayed a slightly increased P accumulation for the annual average (Table S3). The C:N ratio of the whole maize plant was narrower in RCM but not significantly narrower than that in FCM. In leaves and husks, the ratio was reversed; RCM showed a significantly broader ratio compared to FCM. In this case, the factor En was also significant because, in OG18, the C:N ratio values for both CMs were greater than in BR20. In the stems of maize plants, FCM clearly showed a broader C:N ratio than other Ens (Table S3). However, the mean value was not significant in comparison to RCM.
Table 6 provides an overview of all examined fodder value parameters of whole maize plants during BBCH 89 for all Ens. CA, CP and CS had a higher average mean value in FCM. The factor En was significant, as during OG18, particularly high CA values were registered for FCM. The multi-year statistical analysis of CF showed that only En was a significant factor. In this case, the CF values in BB17 exceeded the values in OG18 and BR20. FCM registered a significantly higher sugar content in whole maize plants.
In contrast to sugar, starch values varied greatly between years, with the mean values of CM in OG18 being much lower not only between FCM and RCM but also between BB18 and BR20 (Table 6). However, the mean values of starch from all Ens were ultimately higher in the RCM. ADF was higher in OG18 than in BR20; mean values for CM over all Ens were also higher in favour of FCM. uCP did not differ significantly between FCM and RCM or between individual Ens. The RNB varied greatly between Ens, which is why En was significant as a factor. The mean values of ELOS, ME and NEL did not vary significantly between FCM and RCM or between the single Ens.

4. Discussion

The aim of this study was to develop a successful strategy for growing maize for cattle fodder in unfavourable weather and soil conditions of low mountain ranges in Central Europe using the physical advantages of ridge-shaped rows. Due to the on-farm frame of the experiments, it was not possible to repeat the experiments on the exact same field. For this reason, more focus was laid on common aspects throughout BR20. Despite this limitation, the supplementary evidence, that was collected and analysed throughout the individual year 2020, in combination with the added literature, which explains the mechanisms of ridge cultivation, shows reliable results.
Although maize yields varied across the individual Ens, the results of the study showed that RCM had a positive effect on the development and yield of silage maize (Table 4 and Table 5). Moreover, RCM complies with the strict principles of organic farming and can be practiced on a large scale under low mountain conditions in Central Europe.
Maize goes through a critical growth phase of 5 to 6 weeks in spring. During this term, young maize plants absorb 70–75% of the mineral nutrients needed for the entire vegetation period [39]. Therefore, maize’s nutrient requirements are relatively high. In addition to N, a plant-available P, K and Mg supply is crucial during the juvenile development of maize [39,40]. The plant-available P supply of maize is an issue under cooler climate conditions; natural P delivery can be inhibited under cooler soil temperatures [39]. The same soil type (sandy loam) was chosen for all three experiments, where the same soil preparation and N fertilisation quantities have been applied. The soil N content and plant-available P, K and Mg were determined as an individual dataset in BR20 to show by whether or not RCM can have an impact on soil nutrient content. This study showed that RCM had a positive impact on the Nmin and plant-available P and Mg content in the soil. Although FCM showed a higher NH4+ -N and NO3-N content at the beginning of maize cultivation, RCM overtook the N content in the course of plant development. This effect was principally caused by the change in the ST. Soil N mineralisation increases with rising temperatures in soils due to increasing denitrification, as microbial activity intensifies under a higher ST [41]. An improvement in the N mineralisation conditions and thus the nutrient supply of maize was also achieved by [21,42,43] with ridge-shaped rows. In this study, ST was significantly affected by CM, where RCM showed that it can achieve a statistically higher ST than FCM at midday. RCM delivered higher or the same ST values as FCM on all measurement days, with two exceptions: lower values 12 and 16 DAS in BB17. These results agree with other studies’ outcomes in the literature. Soil thermal properties can be successfully influenced by soil cultivation measures to improve the soil heat capacity; soil preparation through tillage as an inclined ridge reaches a higher ST and can absorb approximately 10.0% more solar radiation than FCM [44].
Another reason for the increase in N content in FCM is the rock content in mountainous soils. In a study, the content of NH4+-N, NO3 -N and plant-available P content increased with the increasing size and abundance of rocks in soil [45]. Rocky soils heat up more quickly during the day [46]. As described in 2.1, the ridge rows were heaped up, which heaped up the larger rocks from the bottom on top of the ridge row, while under FCM, the rock distribution remained equal within and out of the row. The authors of [17] described that heaping up a ridge leads to a collection of larger soil aggregates on top of the ridge, which also serves as siltation and erosion protection. A high rock content in sloped mountain soils can also prevent NO3-N leaching [47], which can be considered another advantage of RCM under the weather conditions of low mountain sites. As this study has shown, maize plants growing within a ridge are provided with more NO3N than in FCM.
Under RCM in BR20, the plant-available K content drastically increased between BBCH 55 and 71 in BR20, where high precipitation values were registered. Precipitation increases plant-available K uptake by maize plants [39], which may have been higher under FCM compared to RCM, as ridge tops dry out more quickly [44,48]. Another explanation for the plant-available K values from BBCH 71 could be the K supply in soils. Plant-available K is supplied during the vegetation period by diffusion from clay minerals into the soil solution and released, especially at high root density. The K uptake by the roots of plants can lead to a significant K concentration decrease within a short time, establishing a concentration gradient for K from K-sorbed clay minerals into the soil solution and increasing the plant-available K concentration [49]. Therefore, if maize plants in RCM have taken up more plant-available K, more K is released into the soil solution. This hypothesis is supported by the higher starch values in the RCM, as K enhances starch formation in maize [39,40]. High starch content is beneficial for the digestibility of organic matter in fodder and leads to a better nutrient supply in cows [39]. A significantly higher sugar content was shown for FCM in OG18 compared to BR20. Starch is a photosynthetic product of sugars (fructose and glucose) [50]. The conversion from sugar to starch primarily depends on the maize genotype [51], but abiotic factors, such as ST, also have an impact [52]. A moderate temperature increase enhances starch biosynthesis in developing maize cobs [53]. Based on the fodder value results, in which FCM had a significantly higher sugar content in OG18 and BR20, it is presumed that the increase in ST during maize plant development favoured the build-up of starch in RCM as opposed to FCM.
The K concentration also increases the Mg concentration in the soil solution [54], which resulted in a significantly higher plant-available Mg content in RCM at BBCH 71. Although plant-available K blocks plant-available Mg uptake, plant-available K uptake was not affected by the plant-available Mg concentration [49,54]. Plant-available K decreased at BBCH 89 in RCM, which was followed by an increase in the plant-available Mg concentration.
The ST in this study was measured only in 0.05 m, because of the higher chance of topsoil to warm up very quickly under direct sunlight at midday, because air temperature and soil temperature in 0.03 to 0.05 m are very closely linked [55]. In the soil layer below 0.2 m, the values fluctuate greatly compared to the daily temperature amplitude [56]. On high-radiation days, ridges heat up faster and more strongly than the soil surface under FCM; the temperature difference can be up to 5 °C in RCM compared to FCM [17]. Other authors reported a 6 to 7 °C higher ST in a ridge [48]. The highest ST difference measured in this study was 2.6 °C below the expected temperature increase from the literature review; however, in BB17, 4 DAS was warm enough in the ridge row to accelerate the germination process of maize under low mountain conditions. Maize cultivars with a maturity rate of FAO 170–220, such as the cultivar Pioneer 7500 used in this study, need daily mean temperatures between 20.0 and 25.0 °C during germination, which should occur between the 4th and 5th day after sowing [57]. Only in BB17 were maize seedlings able to break through the soil crust 4 DAS; in OG18 and BR20, the first maize seedlings did not appear until the 12th DAS. Lower average air and soil temperatures reduce the number of seedlings emerging from the ground, which leads to disoriented shoot growth below the soil surface [57,58]. During the first 12 DAS in both OG18 and BR20, generally low temperatures were registered. The warming of the soil by the ridge in the first 4 DAS was therefore not sufficient to accelerate maize germination. Although the increase in soil temperature under RCM in low mountain areas did not convincingly accelerate FE, there were clear differences in further plant development (see Section 3.2.1 and Section 3.2.2).
The increased ST in RCM had a positive effect on maize plant development. This effect was seen particularly well in the PH, NLP, RND and average FM weight of a single maize plant. ST is as important a growth factor for the maize root system as is the environmental air temperature for aboveground maize development. As the ST increases, the water, oxygen and nutrient uptake of the roots increases, and as a result, the maize plants’ growth increases [49]. In this study, taller maize plants were detected in RCM on each measurement day (Figure 5a), as an effect of higher ST. Another study reported similar results; significantly taller maize plants were found under a permanently raised soil bed 30 and 60 days after sowing [59]. Under ridge cultivation [42,43,60], a higher growth rate was observed in maize in other studies due to the provision of a loose soil structure inside the ridge, which helped roots develop without resistance to root proliferation. Flat surfaces consist of a hard soil layer that disturbs the root growth of maize [42,43]. Root growth during the early stages of maize development (BBCH 17) showed only a small lead for RCM in BR20.
Although C4 plants, such as maize, are typical for hot and dry climatic conditions, drought stress strongly affects the plants’ development [61]. A disadvantage of RCM is that the soil dries out faster during hot periods, starting from the top downwards [44,48]. A higher ST damages the maize root system; in particular, the root hairs are disrupted. Because root hairs in maize are important for plant-available P uptake, their disruption negatively affects the P content in plants [62]. Maize growth is therefore highly affected not only by ST but also by the P content in the soil. Under high light conditions, the requirements for plant-available Mg increase in plants, and if not covered, other damage may occur [54]. However, a ridge-shaped row can protect the plant when the rock content is high; although a ridge usually dries out more quickly during heat and drought periods [21], a high rock content is beneficial for plants during dry years [46]. A rock-free surface absorbs a higher amount of water than a surface covered partially with rocks because rocks slow the daytime loss of soil water [46]. Additionally, the midday heat gain in ridges is offset by stronger cooling at night during high-temperature altitudes [17]. The absorption of water vapour in the topsoil layers is reduced within rocky soils [46]. Therefore, it can be presumed that RCM provides higher temperatures in spring and can protect the roots of maize plants during heat and drought periods in summer, which is beneficial for plant development. In OG18, maize plants suffered a period of heat and drought, which explains the low effect of RCM. Nevertheless, RCM achieved better results in PH and NLP. PH increases with increasing N supply and is closely linked to DM yield [63].
The DM yield for whole maize plants, as well as for leaves and husks, stems and corn cobs in RCM, was higher compared to FCM, from which it can be derived that the CM, although not statistically certain, had a positive influence and led to a higher DM yield (Table 5). In this study, the DM yield in whole plants was 25% higher in BB17 and 8% higher in G18 and BR20, with an average of 18% over all Ens. Maize cultivation on ridge-shaped rows achieved in the studies of [21,22] were by far the highest result, with 30% more DM yield in comparison to flat rows. Similar to this study, the authors of [42] reported 18% more DM yield in ridge-shaped row cultivation of maize in sandy loam soils. Under clay loam conditions, significantly higher corn cob yields were achieved [64]. Under RCM in BR20, maize plants’ N accumulation was higher, implying that N uptake was greater than in FCM. This hypothesis is also supported by the higher CP yields in all Ens, which are related to increased N mineralisation [65].
En OG18 did not show any significant difference in DM corn cob yield between FCM and RCM in comparison to BB17 and BR20. OG18 subjected maize plants to a period of heat and drought. Although the development parameters in RCM showed better results than in FCM, the positive effect of the ridge decreased with the harvest date. Multiple factors can be considered relevant to explaining the results. First, ridge-shaped rows can inhibit the water supply of roots during high temperatures [21]. Water stress causes the development of barren corn cobs and consequently lowers corn cob DM yield [40]. DM yield losses start occurring after 4 days of visibly wilted maize plants [40]. Therefore, the cultivation success of a ridge-shaped row also depends on the water content in the soil during heat and drought periods, as soil pores that are not filled with water contain air. At a low water content, only the coarse soil pores are not filled with water, which can lead to a lack of oxygen for plant roots [17]. Other studies have reported improved water uptake by plants growing in sandy loam ridge-shaped rows and, therefore, higher DM yields, whereby the amount of water available to plants in the soil was sufficient [42,66]. In this context, Baumer [17] suggested that if the water-holding capacity of the soil is low, water availability in the ridge becomes an issue. In addition, the root zone temperature has a significant influence on the DM yield of maize [67]. A shortage of plant-available Mg increases the susceptibility of maize plants to heat stress and can also have a negative impact on DM yield [54,68]. In the OG18 plant, available Mg was not examined during the drought period, but the wilted plants indicated that the ridge did not protect the plants sufficiently in OG18 to generate more than 8% higher DM yield than FCM.
En BR20 confronted maize with new challenges in late summer: hailstorms that partially damaged the leaves of maize plants. Unlike other crop species, maize is not capable of increasing the leaf area or branches at lower crop densities [69]. Therefore, it is presumed that the maize plants in this study showed lower yields and generally a lower difference between both CMs than expected after partial hailstorm damage. This is especially true regarding the significant differences registered in the months thereof. Due to climate change, it is not excluded that low mountain areas in Central Europe can experience heat and drought periods, as well as heavy hailstorms in the summer. Whether and to what extent a ridge-shaped row has a protective function during extreme weather events under soil conditions in low mountain ranges requires further research.
Finally, it is necessary to mention that, if all results obtained in this study are taken into account, despite evidence from individual environments being presented, silage maize cultivation can also be successfully adapted or improved under unfavourable climate conditions at mountainous sites in Central Europe.

5. Conclusions

Even though maize (Zea mays L.) is known as a warmth-loving crop, silage maize cultivation under low mountain conditions in Germany, Central Europe, is crucial for the cattle feed supply of organic dairy farms. This study investigated the cultivation of silage maize on ridge-shaped (0.15 m] and flat-shaped rows on-farm over three environments in 2017, 2018 and 2020. The study’s finding revealed that the ridge-shaped rows positively influenced the soil temperature in 0.05 m soil depth 4 days after sowing in 2017, 2018 and 2020, 12 and 20 days after sowing in 2018 as well as 8 and 16 days after sowing in 2020. However, no acceleration of the maize germination could be achieved by the soil temperature increase. In the course of growing season 2020, an accelerated development of maize plants was observed. Particularly plant height, number of leaves per plant and root neck diameter in ridge-shaped rows showed higher values. The ridge-shaped cultivation method did not result in a higher plant-available P-content but led to a slight increase in plant-available K and Mg content during the beginning of grain development. Significantly higher Nmin-contents were observed also in the beginning of grain development in 0 to 0.3 m soil depth. The yield investigation of both cultivation methods showed that the ridge cultivation accumulated higher dry matter yields of whole plant and corn cobs, which was significant only in a one-factorial analysis. High starch content was generated under a ridge, whereas other fodder value parameters remained the same. This study aimed to test, if a small and simple ridge row can help maize adapt to marginal climatic conditions in low mountains in Germany. Although the study examined individual values, the collected data over 3 years give an overview of the effects for the large-scale use of maize ridge-cropping in the organic farming practice. Additionally, future studies related to maize in organic farming in Central Europe may benefit from these results, particularly when low mountain areas are examined.

Supplementary Materials

The following supporting information can be downloaded at: https://www.mdpi.com/article/10.3390/agriculture13030650/s1, Table S1: Results of one-factorial statistical analysis of NO3-N and NH4+-N Tukey Kramer. Arithmetic means ± standard error of data from En BR20 (4 replicates). Significance p < 0.05. Different letters indicate significance; Table S2. Results of one-factorial statistical analysis (Tukey-Kramer) of maize plant development at BBCH stages 17 (7 leaves unfolded) and 55 (middle of tassel emergence). Arithmetic means ± standard error. Data from Environment Bergen 2020 (BR20). Four replications per parameter. Significance p < 0.05. Different letters indicate significance; Table S3: Results of one-factorial statistical analysis of maize plants development with Tukey–Kramer. Arithmetic means ± standard error of all En eight replicates, respectively, for BB17 and OG18, four replicates for BR20. Multiple comparison at p < 0.05. Different letters indicate significance.

Author Contributions

Conceptualisation—K.S.; methodology—K.S. and T.K.; Performance of the experiments: T.K., M.S. and K.S.; Formal analysis: T.K. and M.S.; original draft preparation: T.K.; visualization: T.K.; supervision: K.S. and S.D.B.-K.; Review and editing: T.K., K.S., S.D.B.-K. and M.S. All authors have read and agreed to the published version of the manuscript.

Funding

The following research was funded by the European Agricultural Fund for Rural Development (ELER, Rural development 2014–2020 for Operational Groups (in the sense of Art 56 of Reg.1305/2013)) in the Free State of Saxony, Germany, participating in EIP-AGRI (Agriculture and Innovation), funded by the European Commission—Identification number 332016000101LWC.

Institutional Review Board Statement

Not applicable.

Data Availability Statement

Not applicable.

Acknowledgments

Many thanks to Hofgut Eichigt GmbH for their support during the project period.

Conflicts of Interest

The authors declare no conflict of interest.

References

  1. Haller, L.; Moakes, S.; Niggli, U.; Riedel, J.; Stolze, M.; Thompson, M. Entwicklungsperspektiven der Ökologischen Landwirtschaft in Deutschland. Texte 32/2020, Dessau-Roßlau. 2020. Available online: https://www.umweltbundesamt.de/publikationen (accessed on 2 February 2023).
  2. BfN. Landschaften: Gebiete und Lebensräume. 2011. Available online: https://www.bfn.de/landschaften (accessed on 2 February 2023).
  3. Siegmund, A.; Frankenberg, P.; Lemke, S. Deutschland Klima. In Diercke—Weltatlas; Michael, T., Diercke, C., Eds.; Westermann: Braunschweig, Germany, 2015; ISBN 978-3-14-100800-5. [Google Scholar]
  4. DWD. Nationaler Klimareport. Klima—Gestern, Heute und in der Zukunft. Stand Errata 8. 2020. Available online: https://www.dwd.de/DE/leistungen/nationalerklimareport/download_report.pdf;jsessionid=FB973CD2CC2D432F8EB2377C037C5D76.live21073?__blob=publicationFile&v=15 (accessed on 2 February 2023).
  5. FAOSTAT. FAOSTAT Databases & Software. Maize; Crop Description & Climate. 2000. Available online: https://www.fao.org/land-water/databases-and-software/crop-information/maize/en/ (accessed on 2 February 2023).
  6. Hein, W. Silomaisanbau in Klimatischen Grenzlagen. In Bericht/Fachtagung “Silomais und Feldfutterbau im Alpenraum“; 19. September 2002 an der BAL Gumpenstein; BAL: Irdning, Austria, 2002; pp. 21–26. Available online: https://raumberg-gumpenstein.at/jdownloads/sonst_Tagung/2002_Silomaisfachtag/2sm_2002_hein.pdf (accessed on 1 March 2023).
  7. DESTATIS. Land- und Forstwirtschaft, Fischerei. Landwirtschaftliche Bodennutzung Anbau auf dem Ackerland. Reihe 3.1.2 2030312218004. 2021. Available online: https://www.destatis.de/DE/Themen/Branchen-Unternehmen/Landwirtschaft-Forstwirtschaft-Fischerei/Publikationen/Bodennutzung/anbau-ackerland-vorbericht-2030312218004.pdf?__blob=publicationFile (accessed on 2 February 2023).
  8. EUROSTAT. Data Browser. 2022. Available online: https://ec.europa.eu/eurostat/de/home (accessed on 2 February 2023).
  9. Diepenbrock, W.; Ellmer, F.; Léon, J. Ackerbau, Pflanzenbau und Pflanzenzüchtung. 101 Tabellen; UTB Grundwissen Bachelor 2629; Stuttgart-Hohenheim: Stuttgart, Germany, 2005; ISBN 9783825238438. [Google Scholar]
  10. European Union. The EU Dairy Sector. Main Features, Challenges and Prospects. Briefing. 2018. Available online: https://www.europarl.europa.eu/RegData/etudes/BRIE/2018/630345/EPRS_BRI(2018)630345_EN.pdf (accessed on 2 February 2023).
  11. BOELW. Branchenreport 2022. Ökologische Lebensmittelwirtschaft; BOELW: Berlin/Heidelberg, Germany, 2022; Available online: https://www.boelw.de/fileadmin/user_upload/Dokumente/Zahlen_und_Fakten/Broschuere_2022/BOELW_Branchenreport2022.pdf (accessed on 2 February 2023).
  12. BLE. Bericht zur Markt- und Versorgungslage mit Milch und Milcherzeugnissen, Bonn. 2002. Available online: https://www.ble.de/SharedDocs/Downloads/DE/BZL/DatenBerichte/MilchUndMilcherzeugnisse/JaehrlicheErgebnisse/Deutschland/2022BerichtMilch.pdf;jsessionid=83B1B11B95B3D0F4F822A187E2F8FF80.internet982?__blob=publicationFile&v=2 (accessed on 1 March 2023).
  13. Ivemeyer, S.; Brinkmann, J.; March, S.; Simantke, C.; Winckler, C.; Knierim, U. Major organic dairy farm types in Germany and their farm, herd, and management characteristics. Org. Agric. 2018, 8, 231–247. [Google Scholar] [CrossRef]
  14. Blank, B.; Schaub, D.; Paulsen, H.M.; Rahmann, G. Comparison of performance and feeding parameters in organic and conventional dairy farms in Germany. Appl. Agric. For. Res. 2013, 63, 21–28. [Google Scholar] [CrossRef]
  15. Steinwidder, A.; Knaus, W. Effizienter Eiweißeinsatz bei Bio-Milchkühen. 2015. Available online: https://orgprints.org/id/eprint/32652/1/01_12%20Eiwei%C3%9Feinsatz_Ansicht_%C3%96AGInfo_Auszug.pdf (accessed on 2 February 2023).
  16. Spann, B.; Diepolder, M.; Schmidtlein, E.M.; Tutsch, S.; Hermüheim, A.; Sprengel, D. Umstellung zur Ökologischen Milchviehhaltung—Vergleich Verschiedener Leistungsparameter. Schriftenreihe der Bayerischen Landesanstalt für Landwirtschaft, 3/2007; pp. 65–77. 2007. Available online: https://www.lfl.bayern.de/mam/cms07/schwerpunkte/dateien/umstellung_milchvieh-1.pdf (accessed on 2 February 2023).
  17. Baeumer, K. Allgemeiner Pflanzenbau. 87 Tabellen; UTB für Wissenschaft Uni-Taschenbücher Agrarwissenschaften 18; Ulmer: Stuttgart, Germany, 1992; ISBN 3825200183. [Google Scholar]
  18. Chassot, A.; Richner, W. Root Characteristics and Phosphorus Uptake of Maize Seedlings in a Bilayered Soil. Agron. J. 2002, 94, 118–127. [Google Scholar] [CrossRef]
  19. Mackay, A.D.; Barber, S.A. Soil Temperature Effects on Root Growth and Phosphorus Uptake by Corn. Soil Sci. Soc. Am. J. 1984, 48, 818–823. [Google Scholar] [CrossRef]
  20. Walker, J.M. One-Degree Increments in Soil Temperatures Affect Maize Seedling Behavior. Soil Sci. Soc. Am. J. 1969, 33, 729–736. [Google Scholar] [CrossRef]
  21. Meyercord, A.; Mücke, M. Ökologischer Maisanbau auf Suboptimalen Standorten. Einfluss Variierter Reihenweiten und Auswirkungen einer Dammkultur auf die Ertrags- und Qualitätsleistungen des Maises bei Gleichzeitig Variierter Beikrautregulierung, Hannover. 2006. Available online: https://orgprints.org/id/eprint/13088/1/13088-03OE037-lawikhan-muecke-2006-maisanbau.pdf (accessed on 2 February 2023).
  22. Zimmer, K.; Hanff, H. Silomais im Ökologischen Anbau—Ergebnisse und Erfahrungen aus Mehrjährigem Anbau in Dammkultur; Nr.: V-006; Landwirtschaft des Landes Brandenburg: Güterfelde, Germany, 2002; Available online: https://docplayer.org/76891677-Silomais-vor-vorfrucht-dt-stalldung-frischmasse-ha-im-fruehjahr-zu-silomais.html (accessed on 8 March 2023).
  23. DWD. Long-term Mean Annual Temperature and Precipitation from 1991 to 2020. 2020. Available online: https://www.dwd.de/DE/leistungen/klimadatendeutschland/vielj_mittelwerte.html (accessed on 2 February 2023).
  24. Bleiholder, H.; Meier, U. BBCH-Skala, Band 1. In Phänologische Entwicklungsstadien Wichtiger Landwirtschaftlicher Kulturen, Einschließlich Unkräuter; Erling Verlag: Clenze, Germany, 2016; ISBN 978-3-862631-10-0. [Google Scholar]
  25. Jones, J.B. Laboratory Guide for Conducting Soil Tests and Plant Analysis; CRC Press: Boca Raton, FL, USA, 2001; ISBN 978-0849302-06-0. [Google Scholar]
  26. Huy, D.H.; Hien, T.T.; Takenaka, N. A new continuous measurement method for gaseous ammonia by counter-current flow tube sampling and indophenol reaction. J. Atmos. Chem. 2016, 73, 223–240. [Google Scholar] [CrossRef]
  27. Lorenz, F.; Erdle, K. Die Düngeverordnung Umsetzen. DLG Merkblatt 426. 2018. Available online: https://www.dlg.org/fileadmin/downloads/landwirtschaft/themen/publikationen/merkblaetter/dlg-merkblatt_426.pdf (accessed on 1 March 2023).
  28. VDLUFA. A 6.2.1.1 Bestimmung von Phosphor und Kalium im Calcium-Acetat-Lactat-Auszug. 6. Teillieferung 2012 zu Band I. In Die Untersuchung von Böden; Bassler, R., Thun, R., Hoffmann, G., Eds.; Handbuch der Landwirtschaftlichen Versuchs- und Untersuchungsmethodik Bd. 1,1; VDLUFA-Verl.: Darmstadt, Germany, 2012; ISBN 978-3-941273-13-9. [Google Scholar]
  29. Walinga, I.; van der Lee, J.J.; Houba, V.J.G.; van Vark, W.; Novozamsky, I. Digestion in Tubes with H2SO4-Salicylic Acid- H2O2 and Selenium and Determination of Ca, K, Mg, N, Na, P, Zn. In Plant Analysis Manual; Walinga, I., Ed.; Springer: Dordrecht, The Netherlands, 1995; pp. 7–45. ISBN 978-94-011-0203-2. [Google Scholar]
  30. Süß, A.; Danner, M.; Obster, C.; Locherer, M.; Hank, T.; Richter, K.; EnMAP Consortium. Measuring Leaf Chlorophyll Content with the Konica Minolta SPAD-502Plus. 2015. Available online: https://gfzpublic.gfz-potsdam.de/rest/items/item_1388302/component/file_1388303/content (accessed on 8 March 2023).
  31. Saiyad, M.M.; Kumar, S. Evaluation of maize genotypes for fodder quality traits and SSR diversity. J. Plant Biochem. Biotechnol. 2018, 27, 78–89. [Google Scholar] [CrossRef]
  32. Rühlemann, L.; Schmidtke, K.; Bellingrath-Kimura, S.D. Short-Term Effects of Differentiated Tillage on Dry Matter Production and Grain Yield of Autumn and Spring Sown Grain Legumes Grown Monocropped and Intercropped with Cereal Grains in Organic Farming. Plant Prod. Sci. 2015, 18, 76–92. [Google Scholar] [CrossRef]
  33. VDLUFA. 31.2 Untersuchung von Silage (Gras-, Mais-) Mittels Nahinfrarotspektroskopie im VDLUFA-Netzwerk. 4. Ergänzungslieferung 1997 zu Band III. In Die chemische Untersuchung von Futtermitteln; Bassler, R., Ed.; Methodenbuch/Verband Deutscher Landwirtschaftlicher Untersuchungs- und Forschungsanstalten. Hrsg. von Rolf Bassler Bd. 3; VDLUFA-Verl.: Darmstadt, Germany, 1976; ISBN 978-3-941273-14-6. [Google Scholar]
  34. Shapiro, S.S.; Wilk, M.B. An analysis of variance test for normality (complete samples). Biometrika 1965, 52, 591–611. [Google Scholar] [CrossRef]
  35. Munzert, M. Landwirtschaftliche und Gartenbauliche Versuche mit SAS; Springer-Lehrbuch; Springer Spektrum: Berlin/Heidelberg, Germany, 2015; ISBN 978-3642545-05-4. [Google Scholar]
  36. Köhler, W.; Schachtel, G.; Voleske, P. Biostatistik: Eine Einführung für Biologen und Agrarwissenschaftler; Springer-Lehrbuch; Springer Spektrum: Berlin/Heidelberg, Germany, 2012; ISBN 978-3642292-70-5. [Google Scholar]
  37. Tukey, J.W. The Problem of Multiple Comparisons. In The Collected Works of John W. Tukey VIII; Multiple comparisons: 1948–1983 1–300; Tukey, J.W., Ed.; Chapman & Hall: New York, NY, USA, 1953; ISBN 978-0412051210. [Google Scholar]
  38. Bätz, G. Einführung in die Methodik des Feldversuchs; VEB Deutscher Landwirtschaftsverlag: Berlin/Heidelberg, Germany, 1987; ISBN 978-3331001250. [Google Scholar]
  39. Zscheischler, J.; Estler, M.; Staudacher, W.; Groß, F.; Burgstaller, G.; Streyl, H.; Rechmann, T. Handbuch Mais: Umweltgerechter Anbau, wirtschaftliche Verwertung; DLG-Verlag: Frankfurt, Germany; BLV-Verlagsgesellschaft: München, Germany; Landwirtschaftsverlag: Münster, Germany; Österreichischer Agrarverlag: Vienna, Austria; BUGRA SUISSE: Wabern-Bern, Switzerland, 1990; ISBN 9783769004731. [Google Scholar]
  40. O’Keeffe, K. Maize Growth & Development; PROCROP; NSW Department of Primary Industries: Orange, NSW, Australia, 2009; ISBN 9780734719553.
  41. Dawes, M.A.; Schleppi, P.; Hättenschwiler, S.; Rixen, C.; Hagedorn, F. Soil warming opens the nitrogen cycle at the alpine treeline. Glob. Chang. Biol. 2017, 23, 421–434. [Google Scholar] [CrossRef]
  42. Khan, M.; Rafiq, R.; Hussain, M.; Farooq, M.; Jabran, K. Ridge sowing improves root system, phosphorus uptake, growth and yield of maize (Zea mays L) hybrids. J. Anim. Plant Sci. 2012, 22, 309–317. Available online: http://thejaps.org.pk/docs/v-22-2/12.pdf (accessed on 2 February 2023).
  43. Khan, M.B.; Yousaf, F.; Hussain, M.; Haq, M.W.; Lee, D.-J.; Farooq, M. Influence of planting methods on root development, crop productivity and water use efficiency in maize hybrids. Chil. J. Agric. Res. 2012, 72, 556–563. [Google Scholar] [CrossRef] [Green Version]
  44. Radke, J.K. Managing Early Season Soil Temperatures in the Northern Corn Belt Using Configured Soil Surfaces and Mulches. Soil Sci. Soc. Am. J. 1982, 46, 1067–1071. [Google Scholar] [CrossRef]
  45. Zheng, Y.; Chen, N.; Zhang, C.; Dong, X.; Zhao, C. Effects of Rock Fragments on the Soil Physicochemical Properties and Vegetation on the Northeastern Tibetan Plateau. Front. Environ. Sci. 2021, 9, 693769. [Google Scholar] [CrossRef]
  46. Danalatos, N.G.; Kosmas, C.S.; Moustakas, N.C.; Yassoglou, N. Rock fragments IL Their impact on soil physical properties and biomass production under Mediterranean conditions. Soil Use Manag. 1995, 11, 121–126. [Google Scholar] [CrossRef]
  47. Liao, K.; Lai, X.; Zhou, Z.; Zeng, X.; Xie, W.; Castellano, M.J.; Zhu, Q. Whether the Rock Fragment Content Should Be Considered When Investigating Nitrogen Cycle in Stony Soils? J. Geophys. Res. Biogeosci. 2019, 124, 521–536. [Google Scholar] [CrossRef]
  48. Spoor, G.; Giles, D.F.H. Effect of cultivations on raising spring soil temperatures for germination with particular reference to maize. J. Soil Sci. 1973, 24, 392–398. [Google Scholar] [CrossRef]
  49. Blume, H.-P.; Kandeler, E.; Stahr, K. Lehrbuch der Bodenkunde; Spektrum Akademischer Verlag: Berlin/Heidelberg, Germany, 2010; ISBN 978-3827414-44-1. [Google Scholar]
  50. Mohr, H.; Schopfer, P. Lehrbuch der Pflanzenphysiologie; Springer: Berlin/Heidelberg, Germany, 1985; ISBN 3540087397. [Google Scholar]
  51. Khan, N.A.; Yu, P.; Ali, M.; Cone, J.W.; Hendriks, W.H. Nutritive value of maize silage in relation to dairy cow performance and milk quality. J. Sci. Food Agric. 2015, 95, 238–252. [Google Scholar] [CrossRef]
  52. Beckles, D.M.; Thitisaksakul, M. How environmental stress affects starch composition and functionality in cereal endosperm. Starch-Stärke 2014, 66, 58–71. [Google Scholar] [CrossRef] [Green Version]
  53. Keeling, P.L.; Banisadr, R.; Barone, L.; Wasserman, B.P.; Singletary, G.W. Effect of Temperature on Enzymes in the Pathway of Starch Biosynthesis in Developing Wheat and Maize Grain. Funct. Plant Biol. 1994, 21, 807. [Google Scholar] [CrossRef]
  54. Gransee, A.; Führs, H. Magnesium mobility in soils as a challenge for soil and plant analysis, magnesium fertilization and root uptake under adverse growth conditions. Plant Soil 2013, 368, 5–21. [Google Scholar] [CrossRef] [Green Version]
  55. Krause, U.; Koch, H.-J.; Maerlaender, B. Soil properties effecting yield formation in sugar beet under ridge and flat cultivation. Eur. J. Agron. 2009, 31, 20–28. [Google Scholar] [CrossRef]
  56. Kaune, A.; Turk, T.; Horn, R. Alteration in soil thermal properties by structure formation. J. Soil Sci. 1993, 44, 231–248. [Google Scholar] [CrossRef]
  57. dos Santos, H.O.; Vasconcellos, R.C.C.; de Pauli, B.; Pires, R.M.O.; Pereira, E.M.; Tirelli, G.V.; Pinho, É.V.R.V. Effect of Soil Temperature in the Emergence of Maize Seeds. JAS 2021, 11, 479. [Google Scholar] [CrossRef]
  58. Miedema, P.; Post, J.; Groot, P.J. The Effects of Low Temperature on Seedling Growth if Maize Genotypes; Agricultural Research Reports 926; PUDOC: Wageningen, The Netherlands, 1987; ISBN 9022009300. [Google Scholar]
  59. Harish, M.N.; Choudhary, A.K.; Dass, A.; Singh, V.K.; Pooniya, V.; Varatharajan, T. Tillage and phosphorus management in maize (Zea mays) under maize-wheat cropping system. Indian J. Agric. Sci. 2021, 91, 117–122. [Google Scholar] [CrossRef]
  60. Mloza-Banda, H.R.; Makwiza, C.N.; Mloza-Banda, M.L. Soil properties after conversion to conservation agriculture from ridge tillage in Southern Malawi. J. Arid Environ. 2016, 127, 7–16. [Google Scholar] [CrossRef]
  61. Ashraf, M.; Harris, P.J.C. Photosynthesis under stressful environments: An overview. Photosynthetica 2013, 51, 163–190. [Google Scholar] [CrossRef]
  62. Xia, Z.; Zhang, S.; Wang, Q.; Zhang, G.; Fu, Y.; Lu, H. Effects of Root Zone Warming on Maize Seedling Growth and Photosynthetic Characteristics Under Different Phosphorus Levels. Front. Plant Sci. 2021, 12, 746152. [Google Scholar] [CrossRef]
  63. Aslam, M.; Iqbal, A.; Zamir, M.S.I.; Mubeen, M.; Amin, M. Effect of different nitrogen levels and seed rates on yield and quality of maize fodder. Crop Environ. 2011, 2, 47–51. [Google Scholar]
  64. Pikul, J.L.; Carpenter-Boggs, L.; Vigil, M.; Schumacher, T.E.; Lindstrom, M.J.; Riedell, W.E. Crop yield and soil condition under ridge and chisel-plow tillage in the northern Corn Belt, USA. Soil Tillage Res. 2001, 60, 21–33. [Google Scholar] [CrossRef]
  65. Amin, M.E.-M.H. Effect of different nitrogen sources on growth, yield and quality of fodder maize (Zea mays L.). J. Saudi Soc. Agric. Sci. 2011, 10, 17–23. [Google Scholar] [CrossRef] [Green Version]
  66. Khan, M.B.; Hussain, M.; Raza, A.; Farooq, S.; Jabran, K. Seed priming with CaCl2 and ridge planting for improved drought resistance in maize. Turk J. Agric. 2015, 39, 193–203. [Google Scholar] [CrossRef]
  67. Xia, Z.; Zhang, G.; Zhang, S.; Wang, Q.; Fu, Y.; Lu, H. Efficacy of Root Zone Temperature Increase in Root and Shoot Development and Hormone Changes in Different Maize Genotypes. Agriculture 2021, 11, 477. [Google Scholar] [CrossRef]
  68. Mengutay, M.; Ceylan, Y.; Kutman, U.B.; Cakmak, I. Adequate magnesium nutrition mitigates adverse effects of heat stress on maize and wheat. Plant Soil 2013, 368, 57–72. [Google Scholar] [CrossRef]
  69. Sangoi, L.; Salvador, J.R. Influence of plant height and of leaf number on maize production at high plant densities. Pesqui. Agropecuária Bras. 1997, 33, 297–306. Available online: https://ainfo.cnptia.embrapa.br/digital/bitstream/item/44889/1/influence-of-plant-height-and-of-leaf-number.pdf (accessed on 2 February 2023).
Figure 1. Study site map in the low mountains of Saxonian Vogtland, Germany and experimental fields Bösenbrunn (BB17), Oberhermsgrün 2018 (OG18) and Bergen (BR20).
Agriculture 13 00650 g001
Figure 2. Soil Nmin content [kg ha −1] in FCM and RCM during En BR20 for BBCH stages 17 (7 leaves unfolded), 55 (middle of tassel emergence: tassel begins to separate), 71 (beginning of grain development, about 16% dry matter) and 89 (fully ripe). Arithmetic means ± standard error for the respective soil depth and BBCH stage. Tukey–Kramer, significance at p < 0.05. Different letters indicate significance among the respective soil depth and BBCH stage. BBCH 17: 0 to 0.3 m p = 0.15; 0.3 to 0.6 m p = 0.50; 0.6 to 0.9 m p = 0.34. BBCH stage 55: 0 to 0.3 m p = 0.61; 0.3 to 0.6 m p = 0.38; 0.6 to 0.9 m p = 0.74. BBCH 71: 0 to 0.3 m p = 0.04; 0.3 to 0.6 m p = 0.54; 0.6 to 0.9 m p = 0.01. BBCH stage 89: 0 to 0.3 m p = 0.11; 0.3 to 0.6 m p = 0.22; 0.6 to 0.9 m p = 0.42.
Agriculture 13 00650 g002
Figure 3. Plant-available phosphorus (P), potassium (K) und magnesium (Mg) content at 0 to 0.3 m soil depth [mg 100 g−1 dry soil] in FCM and RCM during Environment (En) Bergen 2020 (BR20) for Sowing date, BBCH stages 17 (7 leaves unfolded), 55 (middle of tassel emergence: tassel begins to separate), 71 (beginning of grain development, about 16% dry matter) and 89 (fully ripe). Arithmetic means ± standard error for the respective nutrient element. Tukey–Kramer, different letters (A, B) indicate significance at p < 0.05 for Mg content during BBCH 71 in BR20.
Agriculture 13 00650 g003
Figure 4. Field emergence and soil temperature at 0.05 m soil depth 4, 8, 12, 16 and 20 days after sowing in flat cultivation method (FCM) and in ridge cultivation method (RCM) over all Ennvironments (Bösenbrunn 2017—BB17, Oberhermsgrün 2018—OG18, Bergen 2020—BR20). Arithmetic means ± standard error. Tukey-Kramer, significance at p < 0.05. Different letters indicate significance and n.s.—not significant for the respective day after sowing, separately for field emergence and soil temperature.
Agriculture 13 00650 g004
Figure 5. Plant development parameters of maize in flat cultivation method (FCM) and ridge cultivation method (RCM). (a) Plant height in Environments (Ens) Bösenbrunn 2017 (BR17), Oberhermsgrün 2018 (OG18) and Bergen 2020 (BR20) during BBCH 17 (7 leaves unfolded) and 55 (middle of tassel emergence: tassel begins to separate). (b) Number of leaves per plant in Ens BR17, OG18 and BR20. (c) Chlorophyll content index in maize leaves over BBCH stages 17 (7 leaves unfolded), 30 (beginning of stem elongation), 51 (beginning of tassel emergence), 55 (middle of tassel emergence: tassel begins to separate), 71 (beginning of grain development, about 16% dry matter) and 89 (fully ripe) in En BR20. (d) Root neck diameter over BBH stages 17, 55 and 89 in En BR20. (ad)—arithmetic means ± standard error. Single-factor analysis of variance with subsequent Tukey–Kramer. Different letters (A, B and a, b) indicate significance at p < 0.05 between FCM and RCM at the respective BBCH stage or Environment. Bold error bars (ad) indicate how large an observed difference must be to call it significant: honestly significant difference (HSD) for the respective data set.
Agriculture 13 00650 g005
Figure 6. Pearson’s correlation during Environment Bergen 2020 (BR20) between plant height (PH) and root neck diameter (RND) during BBCH 17 (7 leaves unfolded): (a) in flat cultivation method (FCM), (b) in ridge cultivation method (RCM). Between chlorophyll content index (CCI) and soil temperature (ST) during BBCH 17 (7 leavs unfolded) (c) in FCM, (d) in RCM and between CCI and PH during BBCH 55 (middle of tassel emergence). n.s.- not significant. *** (ad) indicatesignificance at p < 0.05.
Agriculture 13 00650 g006
Table 1. Characterisation of experimental sites and soils.
AbbreviationBB17 1OG18 2BR20 3
Year201720182020
Coordinates50°23′ N, 12°06′ E50°22′ N, 12°09′ E50°20′ N, 12°11′ E
Soil texturesandy loamsandy loamsandy loam
M a.s.l. [m] 4495.0514.0602.0
APA [mm] 5568.9348.9483.6
MAT [°C] 610.211.111.1
MAH [%] 780.075.076.0
MAR [W m−2] 8110.5118.1115.8
Cropping period [DD/MM]14 May–19 September16 May–05 September14 May–23 September
Accumulated heat [°C] 9 1239.51277.51242.3
Soil pH 10,116.14.85.7
P [mg 100 g−1 dry soil −1] 10, 12 147.79.82.6
K [mg 100 g−1 dry soil −1] 10, 12 1444.333.416.8
Mg [mg 100 g−1 dry soil −1] 10, 13 1420.219.117.0
1 Bösenbrunn. 2 Oberhermsgrün. 3 Bergen. 4 Meter above sea level. 5 Annual precipitation amounts. 6 Mean annual temperature. 7 Mean annual humidity. 8 Mean annual radiation. 9 Accumulated heat during the cropping period. 10 Sampling depth 0 to 0.3 m at sowing. 11 0.01 M CaCl2 method for soil pH determination. 12 CAL method with AAS P and K determination. 13 0.01 M CaCl2 method with flame AAS for Mg determination. 14 Plant-available.
Table 2. Amount of precipitation [mm] and mean monthly temperature [°C] during Ens and long-term values for the region.
AbbreviationBB17 1OG18 2BR20 3Long-Term Values [mm] 4
Amount of Precipitation per Month [mm]
May24.328.752.557.0
June90.017.138.869.0
July133.634.829.081.0
August43.924.2107.670.0
September13.144.142.253.0
Total amount304.9148.9270.1330.0
Mean monthly temperature [°C]Long-term values [°C] 4,5
May15.016.811.812.5
June18.418.417.915.2
July19.020.619.117.5
August19.021.621.117.0
September13.616.316.013.0
Mean17.018.717.215.4
1 Bösenbrunn. 2 Oberhermsgrün 3 Bergen 4 Long-term values for the period 1991–2020 5 Annual mean temperature measured in 2.0 m height.
Table 3. Pearson’s correlation among field emergence and soil temperature at 8, 12, 16 and 20 days after sowing) in flat cultivation method (FCM) and ridge cultivation method (RCM) over Environments BB17, OG18 and BR20. *** indicates significance, and n.s.—not significant at p < 0.05.
VariablesST 1 [°C]BB17 2OG18 3 BR20 4
FCM 5RCM 6FCMRCMFCMRCM
FE 7 [%]
DAS 88−0.50 n.s.0.03 n.s.
120.45 n.s0.04 n.s.−0.40 n.s.0.80 ***0.07 n.s.0.92 ***
160.69 n.s−0.65 n.s.0.13 n.s.0.54 n.s.−0.41 n.s.0.61 n.s.
20−0.37 n.s.0.02 n.s.0.05 n.s.−0.18 n.s.−0.12 n.s.0.57 n.s.
1 Soil temperature. 2 Bösenbrunn 2017. 3 Oberhermsgrün 2018. 4 Bergen 2020. 5 Flat cultivation method. 6 Ridge cultivation method. 7 Field emergence. 8 Days after sowing.
Table 4. Results of a multiple comparison statistical analysis of maize crop yield. Environment, x Cultivation method, n.s.—not significant, n.s.*—not significant, but tends to be significant, ***—significance. Arithmetic means of all Environments. Eight replications in Environment BB17 and OG18. Four replications in BR20. Different letters indicate significance at p < 0.05.
ParameterUnitData AnalysisMean CM
En 1CM 2En x CMFCM 3RCM 4
Fresh matter yield (whole plant)[t ha−1]n.s.n.s.*n.s.27.463 30.933
Dry matter yield (whole plant)n.s n.s.*n.s.7.45 8.97
Dry matter yield (leaves and husk)n.s n.s.*n.s.2.132.59
Dry matter yield (stem)n.s.***n.s.1.84 b2.07 a
Dry matter yield (corn cob)n.s.n.s.n.s.3.844.75
Proportion of leaves and stem of
total dry matter yield
[%]******n.s.52.25 a51.27 b
Corn cob proportion of
total dry matter yield
***n.s.n.s.47.7548.73
Crude Protein yield (whole plant)[kg ha−1]***n.s.*n.s.468.05537.68
Crude Protein yield (leaves and stem)***n.s.*n.s.231.42 258.14
Crude Protein yield (corn cob)n.s.n.s n.s. 236.63279.55
1 Environment. 2 Cultivation method. 3 Flat cultivation method. 4 Ridge cultivation method.
Table 5. Results of a multiple comparison statistical analysis of maize crop yield. Environment, x Cultivation method, n.s.—not significant, n.s.*—not significant, but tends to be significant, ***—significance. Arithmetic means of all Environments. Eight replications in Environment Oberhermsgrün 2018 (OG18). Four replications in Environemnt Bergen 2020 (BR20). Different letters indicate significance at p < 0.05.
ParameterUnitData AnalysisMean CM
En 1CM 2En x CMFCM 3RCM 4
N accumulation (whole plant) [kg ha−1]***n.s.*n.s.69.26 81.58
N accumulation (leaves and husk) n.s.n.s.n.s.20.0620.96
N accumulation (stem) n.s.n.s.n.s.8.068.57
N accumulation (corn cob) ***n.s.n.s.32.5435.56
P accumulation (whole plant) [kg ha−1]n.s.n.s.n.s.450.0430.0
N concentration (whole plant) [%]n.s.n.s.n.s.1.271.35
N concentration (leaves and husk) n.s.n.s.n.s.1.281.20
N concentration (stem) n.s.n.s.n.s.0.540.57
N concentration (corn cob) n.s.n.s.n.s.1.441.46
C:N ratio (whole plant) [%]n.s.n.s.n.s.34.0033.59
C:N ratio (leaves and husk) ******n.s.34.40 b37.46 a
C:N ratio (stem) n.s.n.s.n.s.84.9081.19
C:N ratio (corn cob) n.s.n.s.n.s.30.6230.94
1 Environment. 2 Cultivation method. 3 Flat cultivation method. 4 Ridge cultivation method.
Table 6. Results of a multiple comparison statistical analysis of maize fodder nutrient content. -Environment x Cultivation method, n.s.—not significant, n.s.*—not significant, but tends to be significant, ***—significance. Arithmetic means of all Environments. Eight replications in Enrivonments Bösenbrunn 2017 (BB17) and Oberhermsgrün 2018 (OG18). Four replications in Environment Bergen 2020 (BR20). Different letters indicate significance at p < 0.05.
ParameterUnitData AnalysisMean CM
En 3CM 4En x CMFCM 5RCM 6
CA 1[g kg−1]***n.s.*n.s.*37.44 34.12
CP 1 ***n.s.*n.s.67.00 64.29
CS 1***n.s *n.s.222.37 214.24
CF 1***n.s.n.s.23.0123.78
Sugar 2n.s.***n.s.74.89 a64.43 b
Starch 1***n.s.n.s.199.16 231.07
ADF 2***n.s.n.s.266.79258.92
uCP 1n.s.n.s.n.s.120.70120.67
RNB 1***n.s.n.s.−8.79−9.02
ELOS 1[%]n.s.n.s.n.s.62.1562.43
ME 1[MJ kg−1 OS]n.s.n.s.n.s.10.1510.19
NEL 1 n.s.n.s.n.s.5.845.90
1 Values from BB17, OG18 and BR20. 2 Values from OG18 and BR20. 3 Environment. 4 Cultivation method. 5 Flat cultivation method. 6 Ridge cultivation method.
Disclaimer/Publisher’s Note: The statements, opinions and data contained in all publications are solely those of the individual author(s) and contributor(s) and not of MDPI and/or the editor(s). MDPI and/or the editor(s) disclaim responsibility for any injury to people or property resulting from any ideas, methods, instructions or products referred to in the content.

