

Expectations of the Participants of the Crop Insurance System and Their Implementation
Abstract
:1. Introduction
- 1.
- To analyze the theoretical expectations of the participants of the crop insurance system.
- 2.
- To reveal the reasons that encourage/do not encourage farms to insure crops.
2. Materials and Methods
3. Literature Review
4. Results and Discussion
4.1. Factors for Choosing Crop Insurance
Crop Insurance Conditions
4.2. Does the Age of the Farmer Play a Role in the Decision to Protect Crops?
4.3. Expectations of the Participants of the Crop Insurance System
5. Conclusions
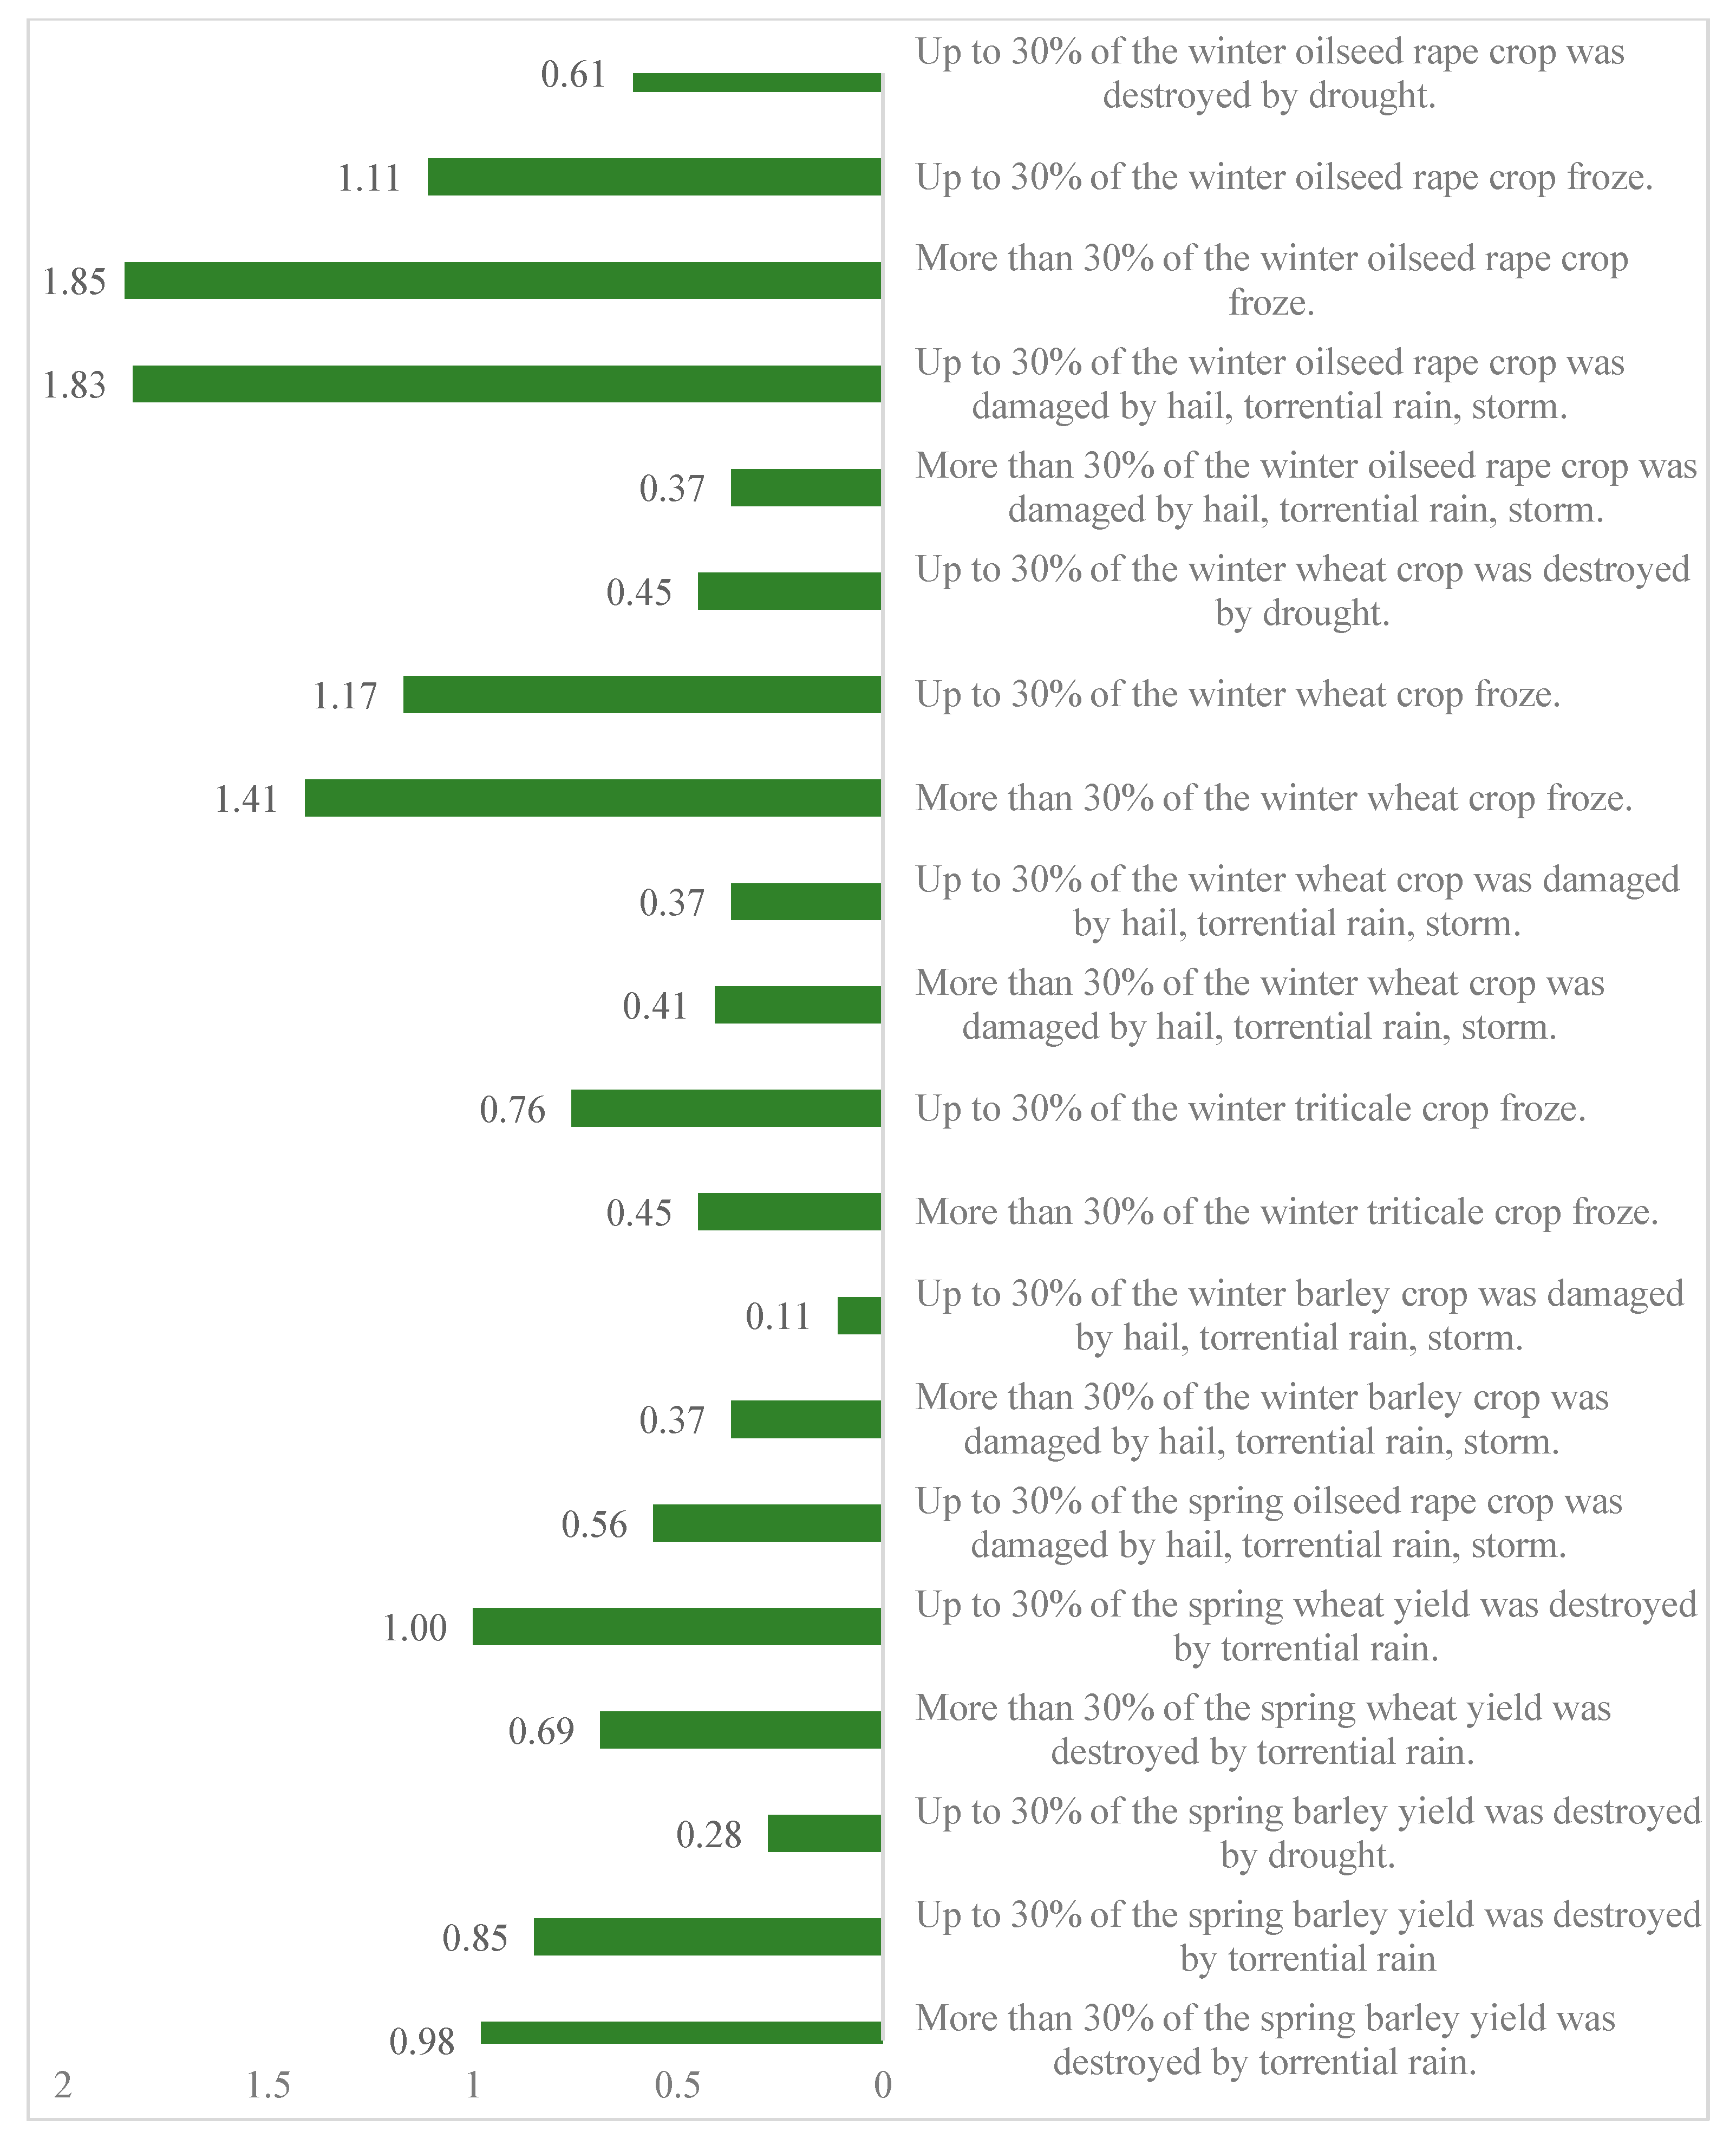
- Lithuanian farmers experience the most losses due to frost, which occurs on average every third year and causes harvest losses of various sizes. Meteorological events cause the greatest damage to winter rapeseed crops, followed by damage to winter wheat, triticale, and smaller losses are related to summer crops due to rain, hail, and storms. Farmers suffer the least losses due to drought. Farmers in Lithuania are offered crop insurance products against meteorological phenomena that best meet customer expectations.
- In order to avoid losses and help adapt to climate change, it is necessary to focus more on implementing preventive measures to prevent damage from meteorological phenomena. In order to meet the respondents’ expectations, it would be appropriate to apply technical and organizational measures that help to reduce the negative consequences of extreme climate change events for crop production. Adopt the experience of European Union countries and expand crop insurance activities.
- To strengthen the cooperation between the private and public sectors of Lithuania, cooperating in the field of agricultural insurance by applying the insurance premium compensation and reinsurance system. An efficient crop insurance system can only be created through the flexible cooperation of farmers, insurance companies, and the state.
- It is necessary to take into account the socio-demographic characteristics of consumers because they directly determine the reasons for banning or not banning crops. It can be said that knowing the socio-demographic characteristics of consumers can be used to adapt insurance services.
Author Contributions
Funding
Institutional Review Board Statement
Informed Consent Statement
Data Availability Statement
Acknowledgments
Conflicts of Interest
Appendix A
Appendix A.1
Questionnaire for Farmers
| Survey | The survey aims to collect information from farmers on the risks in crop production due to adverse climatic conditions and their management through crop insurance. Survey method: questionnaire. Survey period: 15 August 2016 to 15 September 2016 |
| Šiauliai county | Tauragė county | Telšiai county | Klaipėda county |
| | | | |
| Under 30 | 31 to 40 | 41 to 50 | 51 to 60 | 61 to 70 | over 71 |
| | | | | | |
| Under 20 ha | 21 to 50 ha | 51 to 100 ha | 101 to 300 ha | 301 to 500 ha | 501 to 1000 ha | over 1001 ha |
| Growing cereal and oilseed rape | Livestock farming | Mixed crop-livestock farming |
| Crops cultivated on the farm | Winter Crops | Spring Crops | ||||||||
| Type of risk | Oilseed rape | wheat | triticale | rye | barley | Oilseed rape | wheat | barley | Other cereal | |
| Up to 30% of the crop yield was destroyed by drought | ||||||||||
| More than 30% of the crop yield was destroyed by drought | ||||||||||
| Up to 30% of the crop froze | X | X | X | X | ||||||
| More than 30% of the crop froze | X | X | X | X | ||||||
| Up to 30% of the crop was damaged by hail | ||||||||||
| More than 30% of the crop was damaged by hail | ||||||||||
| Up to 30% of the crop was destroyed by torrential rain | ||||||||||
| More than 30% of the crop was destroyed by torrential rain | ||||||||||
| Insured or not insured | Every year (for less than 3 years) | Every year (for 3–8 years) | Every year (for more than 8 years) | Not every year, only after significant losses | Not every year, for other reasons | |
| Yes | ||||||
| No | X | X | X | X | X |
| 1 Not important | 2 | 3 | 4 | 5 Very important | |
| Adverse climatic conditions would result in significant losses to the farm | |||||
| It is a business, and it is therefore important to manage and mitigate risks in production | |||||
| Due to climate warming, risks to agricultural production from adverse climatic conditions are becoming more frequent | |||||
| The crop insurance packages available on the market are acceptable to the farm | |||||
| Insurers objectively assess the damage incurred | |||||
| Up to 50% of the crop insurance premium is reimbursed | |||||
| Compulsory crop insurance in case of investment support under the RDP | |||||
| Compulsory crop insurance in case of a short-term bank loan | |||||
| Compulsory crop insurance in the case of a long-term bank loan | |||||
| By insuring your crops, you become a member of the International Crop Insurance Self-Management Fund | |||||
| Additional priority points for participation in RDP programs |
| 1 Not important | 2 | 3 | 4 | 5 Very important | |
| The farm would not suffer significant losses due to adverse climatic conditions | |||||
| Adverse climatic conditions rarely result in significant losses to the farm | |||||
| The risk due to adverse climatic conditions is not relevant for the farm as it does not significantly affect the farm’s income | |||||
| The farm is too small to make crop insurance worthwhile | |||||
| It is more cost-effective to build up a reserve of own funds to cover losses than to pay annual insurance premiums | |||||
| Losses due to adverse climatic conditions are partly covered by direct payments received by the farm | |||||
| Only a comprehensive crop insurance package is offered on the market, all crops must be insured | |||||
| No possibility to insure individual crops | |||||
| Only one crop insurance company in Lithuania, which is a monopoly on the insurance market, has no choice | |||||
| The insurance company’s assessor underestimates the actual losses | |||||
| The insurance company does not cover the full value of the loss (does not pay the full amount of the loss) |
Appendix A.2
| Do you insure your crops? | Up to 30% of the crop yield was destroyed by drought | More than 30% of the crop yield was destroyed by drought | Up to 30% of the crop froze | More than 30% of the crop froze | Up to 30% of the crop was damaged by hail, torrential rain, storm | More than 30% of the crop was damaged by hail, torrential rain, storm | Up to 30% of the crop was destroyed by torrential rain | More than 30% of the crop was destroyed by torrential rain | |
| I insure | Average | 0.60 | 0.30 | 0.88 | 2.17 | 2.20 | 0.57 | 0.30 | 0.00 |
| Minimum | I haven’t encountered it in any year | I haven’t encountered it in any year | I haven’t encountered it in any year | 1 year | I haven’t encountered it in any year | I haven’t encountered it in any year | I haven’t encountered it in any year | I haven’t encountered it in any year | |
| Maximum | 2 years | 1 year | 2 years | 4 years | 6 years | 2 years | 1 year | I haven’t encountered it in any year | |
| Standard deviation | 0.92 | 0.46 | 0.84 | 1.46 | 1.26 | 0.90 | 0.46 | 0.00 | |
| I do not insure | Average | 0.63 | 0.00 | 1.53 | 1.25 | 1.13 | 0.00 | 0.00 | 0.00 |
| Minimum | I haven’t encountered it in any year | I haven’t encountered it in any year | I haven’t encountered it in any year | 1 year | I haven’t encountered it in any year | I haven’t encountered it in any year | I haven’t encountered it in any year | I haven’t encountered it in any year | |
| Maximum | 4 years | I haven’t encountered it in any year | 3 years | 3 years | 3 years | I haven’t encountered it in any year | I haven’t encountered it in any year | I haven’t encountered it in any year | |
| Standard deviation | 1.476 | 0.00 | 1.41 | 1.41 | 1.26 | 0.00 | 0.00 | 0.00 | |
| Total | Average | 0.61 | 0.20 | 1.11 | 1.85 | 1.83 | 0.37 | 0.20 | 0.00 |
| Minimum | I haven’t encountered it in any year | I haven’t encountered it in any year | I haven’t encountered it in any year | 1 year | I haven’t encountered it in any year | I haven’t encountered it in any year | I haven’t encountered it in any year | I haven’t encountered it in any year | |
| Maximum | 4 years | 1 year | 3 years | 4 years | 6 years | 2 years | 1 year | I haven’t encountered it in any year | |
| Standard deviation | 1.13 | .399 | 1.11 | 1.50 | 1.35 | 0.780 | 0.399 | 0.000 | |
Appendix A.3
| Do you insure your crops? | Up to 30% of the crop yield was destroyed by drought | More than 30% of the crop yield was destroyed by drought | Up to 30% of the crop froze | More than 30% of the crop froze | Up to 30% of the crop was damaged by hail, torrential rain, storm | More than 30% of the crop was damaged by hail, torrential rain, storm | Up to 30% of the crop was destroyed by torrential rain | More than 30% of the crop was destroyed by torrential rain | |
| I insure | Average | 0.60 | 0.00 | 1.08 | 1.42 | 0.57 | 0.40 | 0.17 | 0.00 |
| Minimum | I haven’t encountered it in any year | I haven’t encountered it in any year | I haven’t encountered it in any year | I haven’t encountered it in any year | I haven’t encountered it in any year | I haven’t encountered it in any year | I haven’t encountered it in any year | I haven’t encountered it in any year | |
| Maximum | 2 years | I haven’t encountered it in any year | 2 years | 3 years | 2 years | 2 years | 2 years | I haven’t encountered it in any year | |
| Standard deviation | 0.924 | 0.000 | 0.962 | 0.962 | 0.909 | 0.807 | 0.557 | 0.000 | |
| I do not insure | Average | 0.16 | 0.00 | 1.34 | 1.41 | 0.00 | .44 | 0.00 | 0.00 |
| Minimum | I haven’t encountered it in any year | I haven’t encountered it in any year | I haven’t encountered it in any year | I haven’t encountered it in any year | I haven’t encountered it in any year | I haven’t encountered it in any year | I haven’t encountered it in any year | I haven’t encountered it in any year | |
| Maximum | 1 year | I haven’t encountered it in any year | 3 years | 4 years | I haven’t encountered it in any year | 2 years | I haven’t encountered it in any year | I haven’t encountered it in any year | |
| Standard deviation | 0.369 | 0.000 | 1.208 | 1.563 | 0.000 | 0.840 | 0.000 | 0.000 | |
| Total | Average | 0.45 | 0.00 | 1.17 | 1.41 | 0.37 | 0.41 | 0.11 | 0.00 |
| Minimum | I haven’t encountered it in any year | I haven’t encountered it in any year | I haven’t encountered it in any year | I haven’t encountered it in any year | I haven’t encountered it in any year | I haven’t encountered it in any year | I haven’t encountered it in any year | I haven’t encountered it in any year | |
| Maximum | 2 years | I haven’t encountered it in any year | 3 years | 4 years | 2 years | 2 years | 2 years | I haven’t encountered it in any year | |
| Standard deviation | 0.803 | 0.000 | 1.055 | 1.197 | 0.780 | 0.814 | 0.456 | 0.000 | |
Appendix A.4
| Do you insure your crops? | Up to 30% of the crop yield was destroyed by drought | More than 30% of the crop yield was destroyed by drought | Up to 30% of the crop froze | More than 30% of the crop froze | Up to 30% of the crop was damaged by hail, torrential rain, storm | More than 30% of the crop was damaged by hail, torrential rain, storm | Up to 30% of the crop was destroyed by torrential rain | More than 30% of the crop was destroyed by torrential rain | |
| I insure | Average | 0.00 | 0.00 | 0.89 | 0.60 | 0.00 | 0.00 | 0.00 | 0.00 |
| Minimum | I haven’t encountered it in any year | I haven’t encountered it in any year | I haven’t encountered it in any year | I haven’t encountered it in any year | I haven’t encountered it in any year | I haven’t encountered it in any year | I haven’t encountered it in any year | I haven’t encountered it in any year | |
| Maximum | I haven’t encountered it in any year | I haven’t encountered it in any year | 3 years | 2 years | I haven’t encountered it in any year | I haven’t encountered it in any year | I haven’t encountered it in any year | I haven’t encountered it in any year | |
| Standard deviation | 0.000 | 0.000 | 1.385 | 0.923 | 0.000 | 0.000 | 0.000 | 0.000 | |
| I do not insure | Average | 0.00 | 0.00 | 0.37 | 0.00 | 0.00 | 0.00 | 0.26 | 0.26 |
| Minimum | I haven’t encountered it in any year | I haven’t encountered it in any year | I haven’t encountered it in any year | I haven’t encountered it in any year | I haven’t encountered it in any year | I haven’t encountered it in any year | I haven’t encountered it in any year | I haven’t encountered it in any year | |
| Maximum | I haven’t encountered it in any year | I haven’t encountered it in any year | I haven’t encountered it in any year | I haven’t encountered it in any year | I haven’t encountered it in any year | I haven’t encountered it in any year | 1 year | 1 year | |
| Standard deviation | 0.000 | 0.000 | 0.496 | 0.000 | 0.000 | 0.000 | 0.452 | 0.452 | |
| Total | Average | 0.00 | 0.00 | 0.76 | 0.45 | 0.00 | 0.00 | 0.07 | 0.07 |
| Minimum | I haven’t encountered it in any year | I haven’t encountered it in any year | I haven’t encountered it in any year | I haven’t encountered it in any year | I haven’t encountered it in any year | I haven’t encountered it in any year | I haven’t encountered it in any year | I haven’t encountered it in any year | |
| Maximum | I haven’t encountered it in any year | I haven’t encountered it in any year | 3 years | 2 years | I haven’t encountered it in any year | I haven’t encountered it in any year | 1 year | 1 year | |
| Standard deviation | 0.000 | 0.000 | 1.242 | 0.839 | 0.000 | 0.000 | 0.250 | 0.250 | |
Appendix A.5
| Do you insure your crops? | Up to 30% of the crop yield was destroyed by drought | More than 30% of the crop yield was destroyed by drought | Up to 30% of the crop froze | More than 30% of the crop froze | Up to 30% of the crop was damaged by hail, torrential rain, storm | More than 30% of the crop was damaged by hail, torrential rain, storm | Up to 30% of the crop was destroyed by torrential rain | More than 30% of the crop was destroyed by torrential rain | |
| I insure | Average | 0.00 | 0.00 | 0.00 | 0.00 | 0.00 | 0.00 | 0.00 | 0.54 |
| Minimum | I haven’t encountered it in any year | I haven’t encountered it in any year | I haven’t encountered it in any year | I haven’t encountered it in any year | I haven’t encountered it in any year | I haven’t encountered it in any year | I haven’t encountered it in any year | I haven’t encountered it in any year | |
| Maximum | I haven’t encountered it in any year | I haven’t encountered it in any year | I haven’t encountered it in any year | I haven’t encountered it in any year | I haven’t encountered it in any year | I haven’t encountered it in any year | I haven’t encountered it in any year | 1 year | |
| Standard deviation | 0.000 | 0.000 | 0.000 | 0.000 | 0.000 | 0.000 | 0.000 | 0.505 | |
| I do not insure | Average | ||||||||
| Minimum | |||||||||
| Maximum | |||||||||
| Standard deviation | |||||||||
| Total | Average | 0.00 | 0.00 | 0.00 | 0.00 | 0.00 | 0.00 | 0.00 | 0.54 |
| Minimum | I haven’t encountered it in any year | I haven’t encountered it in any year | I haven’t encountered it in any year | I haven’t encountered it in any year | I haven’t encountered it in any year | I haven’t encountered it in any year | I haven’t encountered it in any year | I haven’t encountered it in any year | |
| Maximum | I haven’t encountered it in any year | I haven’t encountered it in any year | I haven’t encountered it in any year | I haven’t encountered it in any year | I haven’t encountered it in any year | I haven’t encountered it in any year | I haven’t encountered it in any year | 1 year | |
| Standard deviation | 0.000 | 0.000 | 0.000 | 0.000 | 0.000 | 0.000 | 0.000 | 0.505 | |
Appendix A.6
| Do you insure your crops? | Up to 30% of the crop yield was destroyed by drought | More than 30% of the crop yield was destroyed by drought | Up to 30% of the crop froze | More than 30% of the crop froze | Up to 30% of the crop was damaged by hail, torrential rain, storm | More than 30% of the crop was damaged by hail, torrential rain, storm | Up to 30% of the crop was destroyed by torrential rain | More than 30% of the crop was destroyed by torrential rain | |
| I insure | Average | 0.00 | 0.00 | 0.00 | 0.00 | 0.14 | 0.00 | 0.00 | 0.09 |
| Minimum | I haven’t encountered it in any year | I haven’t encountered it in any year | I haven’t encountered it in any year | I haven’t encountered it in any year | I haven’t encountered it in any year | I haven’t encountered it in any year | I haven’t encountered it in any year | I haven’t encountered it in any year | |
| Maximum | I haven’t encountered it in any year | I haven’t encountered it in any year | I haven’t encountered it in any year | I haven’t encountered it in any year | 1 year | I haven’t encountered it in any year | I haven’t encountered it in any year | 2 years | |
| Standard deviation | 0.000 | 0.000 | 0.000 | 0.000 | 0.351 | 0.000 | 0.000 | 0.426 | |
| I do not insure | Average | 0.00 | 0.00 | 0.00 | 0.00 | 0.00 | 2.00 | 0.00 | 0.00 |
| Minimum | I haven’t encountered it in any year | I haven’t encountered it in any year | I haven’t encountered it in any year | I haven’t encountered it in any year | I haven’t encountered it in any year | 2 years | I haven’t encountered it in any year | I haven’t encountered it in any year | |
| Maximum | I haven’t encountered it in any year | I haven’t encountered it in any year | I haven’t encountered it in any year | I haven’t encountered it in any year | I haven’t encountered it in any year | 2 years | I haven’t encountered it in any year | I haven’t encountered it in any year | |
| Standard deviation | 0.000 | 0.000 | 0.000 | 0.000 | 0.000 | 0.000 | 0.000 | 0.000 | |
| Total | Average | 0.00 | 0.00 | 0.00 | 0.00 | 0.11 | 0.37 | 0.00 | 0.07 |
| Minimum | I haven’t encountered it in any year | I haven’t encountered it in any year | I haven’t encountered it in any year | I haven’t encountered it in any year | I haven’t encountered it in any year | I haven’t encountered it in any year | I haven’t encountered it in any year | I haven’t encountered it in any year | |
| Maximum | I haven’t encountered it in any year | I haven’t encountered it in any year | I haven’t encountered it in any year | I haven’t encountered it in any year | 1 year | 2 years | I haven’t encountered it in any year | 2 years | |
| Standard deviation | 0.000 | 0.000 | 0.000 | 0.000 | 0.320 | 0.792 | 0.000 | 0.385 | |
Appendix A.7
| Do you insure your crops? | Up to 30% of the crop yield was destroyed by drought | More than 30% of the crop yield was destroyed by drought | Up to 30% of the crop was damaged by hail, torrential rain, storm | More than 30% of the crop was damaged by hail, torrential rain, storm | Up to 30% of the crop was destroyed by torrential rain | More than 30% of the crop was destroyed by torrential rain | |
| I insure | Average | 0.00 | 0.00 | 0.65 | 0.00 | 0.00 | 0.00 |
| Minimum | I haven’t encountered it in any year | I haven’t encountered it in any year | I haven’t encountered it in any year | I haven’t encountered it in any year | I haven’t encountered it in any year | I haven’t encountered it in any year | |
| Maximum | I haven’t encountered it in any year | I haven’t encountered it in any year | 1 year | I haven’t encountered it in any year | I haven’t encountered it in any year | I haven’t encountered it in any year | |
| Standard deviation | 0.000 | 0.000 | 0.483 | 0.000 | 0.000 | 0.000 | |
| I do not insure | Average | 1.25 | 0.00 | 0.00 | 0.00 | 0.00 | 0.00 |
| Minimum | I haven’t encountered it in any year | I haven’t encountered it in any year | I haven’t encountered it in any year | I haven’t encountered it in any year | I haven’t encountered it in any year | I haven’t encountered it in any year | |
| Maximum | 2 years | I haven’t encountered it in any year | I haven’t encountered it in any year | I haven’t encountered it in any year | I haven’t encountered it in any year | I haven’t encountered it in any year | |
| Standard deviation | 1.035 | 0.000 | 0.000 | 0.000 | 0.000 | 0.000 | |
| Total | Average | 0.17 | 0.00 | 0.56 | 0.00 | 0.00 | 0.00 |
| Minimum | I haven’t encountered it in any year | I haven’t encountered it in any year | I haven’t encountered it in any year | I haven’t encountered it in any year | I haven’t encountered it in any year | I haven’t encountered it in any year | |
| Maximum | 2 years | I haven’t encountered it in any year | 1 year | I haven’t encountered it in any year | I haven’t encountered it in any year | I haven’t encountered it in any year | |
| Standard deviation | 0.562 | 0.000 | 0.501 | 0.000 | 0.000 | 0.000 | |
Appendix A.8
| Do you insure your crops? | Up to 30% of the crop yield was destroyed by drought | More than 30% of the crop yield was destroyed by drought | Up to 30% of the crop was damaged by hail, torrential rain, storm | More than 30% of the crop was damaged by hail, torrential rain, storm | Up to 30% of the crop was destroyed by torrential rain | More than 30% of the crop was destroyed by torrential rain | |
| I insure | Average | 0.00 | 0.00 | 0.09 | 0.00 | 1.14 | 0.79 |
| Minimum | I haven’t encountered it in any year | I haven’t encountered it in any year | I haven’t encountered it in any year | I haven’t encountered it in any year | I haven’t encountered it in any year | I haven’t encountered it in any year | |
| Maximum | I haven’t encountered it in any year | I haven’t encountered it in any year | 1 year | I haven’t encountered it in any year | 5 years | 1 year | |
| Standard deviation | 0.000 | 0.000 | 0.288 | 0.000 | 1.285 | 0.414 | |
| I do not insure | Average | 0.63 | 0.00 | 0.00 | 0.63 | 0.00 | 0.00 |
| Minimum | I haven’t encountered it in any year | I haven’t encountered it in any year | I haven’t encountered it in any year | I haven’t encountered it in any year | I haven’t encountered it in any year | I haven’t encountered it in any year | |
| Maximum | 1 year | I haven’t encountered it in any year | I haven’t encountered it in any year | 1 year | I haven’t encountered it in any year | I haven’t encountered it in any year | |
| Standard deviation | 0.518 | 0.000 | 0.000 | 0.518 | 0.000 | 0.000 | |
| Total | Average | 0.08 | 0.00 | 0.08 | 0.08 | 1.00 | 0.69 |
| Minimum | I haven’t encountered it in any year | I haven’t encountered it in any year | I haven’t encountered it in any year | I haven’t encountered it in any year | I haven’t encountered it in any year | I haven’t encountered it in any year | |
| Maximum | 1 year | I haven’t encountered it in any year | 1 year | 1 year | 5 years | 1 year | |
| Standard deviation | 0.270 | 0.000 | 0.270 | 0.270 | 1.260 | 0.467 | |
Appendix A.9
| Do you insure your crops? | Up to 30% of the crop yield was destroyed by drought | More than 30% of the crop yield was destroyed by drought | Up to 30% of the crop was damaged by hail, torrential rain, storm | More than 30% of the crop was damaged by hail, torrential rain, storm | Up to 30% of the crop was destroyed by torrential rain | More than 30% of the crop was destroyed by torrential rain | |
| I insure | Average | 0.25 | 0.00 | 0.32 | 0.00 | 1.14 | 1.14 |
| Minimum | I haven’t encountered it in any year | I haven’t encountered it in any year | I haven’t encountered it in any year | I haven’t encountered it in any year | I haven’t encountered it in any year | I haven’t encountered it in any year | |
| Maximum | 1 year | I haven’t encountered it in any year | 1 year | I haven’t encountered it in any year | 4 years | 4 years | |
| Standard deviation | 0.434 | 0.000 | 0.468 | 0.000 | 1.004 | 1.004 | |
| I do not insure | Average | 0.33 | 0.00 | 0.58 | 0.47 | 0.28 | 0.67 |
| Minimum | I haven’t encountered it in any year | I haven’t encountered it in any year | I haven’t encountered it in any year | I haven’t encountered it in any year | I haven’t encountered it in any year | I haven’t encountered it in any year | |
| Maximum | 1 year | I haven’t encountered it in any year | 1 year | 2 years | 1 year | 2 years | |
| Standard deviation | 0.478 | 0.000 | 0.500 | 0.736 | 0.454 | 0.717 | |
| Total | Average | 0.28 | 0.00 | 0.40 | 0.16 | 0.85 | 0.98 |
| Minimum | I haven’t encountered it in any year | I haven’t encountered it in any year | I haven’t encountered it in any year | I haven’t encountered it in any year | I haven’t encountered it in any year | I haven’t encountered it in any year | |
| Maximum | 1 year | I haven’t encountered it in any year | 1 year | 2 years | 4 years | 4 years | |
| Standard deviation | 0.449 | 0.000 | 0.493 | 0.475 | 0.951 | 0.943 | |
Appendix A.10
| Do you insure your crops? | Up to 30% of the crop yield was destroyed by drought | More than 30% of the crop yield was destroyed by drought | Up to 30% of the crop was damaged by hail, torrential rain, storm | More than 30% of the crop was damaged by hail, torrential rain, storm | Up to 30% of the crop was destroyed by torrential rain | More than 30% of the crop was destroyed by torrential rain | |
| I insure | Average | 0.00 | 0.00 | 0.25 | 0.00 | 0.07 | 0.16 |
| Minimum | I haven’t encountered it in any year | I haven’t encountered it in any year | I haven’t encountered it in any year | I haven’t encountered it in any year | I haven’t encountered it in any year | I haven’t encountered it in any year | |
| Maximum | I haven’t encountered it in any year | I haven’t encountered it in any year | 1 year | I haven’t encountered it in any year | 1 year | 1 year | |
| Standard deviation | 0.000 | 0.000 | 0.434 | 0.000 | 0.254 | 0.373 | |
| I do not insure | Average | 0.23 | 0.39 | 0.23 | 0.36 | 0.32 | 0.36 |
| Minimum | I haven’t encountered it in any year | I haven’t encountered it in any year | I haven’t encountered it in any year | I haven’t encountered it in any year | I haven’t encountered it in any year | I haven’t encountered it in any year | |
| Maximum | 1 year | 1 year | 1 year | 1 year | 1 year | 1 year | |
| Standard deviation | 0.429 | 0.494 | 0.429 | 0.492 | 0.477 | 0.492 | |
| Total | Average | 0.05 | 0.13 | 0.24 | 0.08 | 0.13 | 0.21 |
| Minimum | I haven’t encountered it in any year | I haven’t encountered it in any year | I haven’t encountered it in any year | I haven’t encountered it in any year | I haven’t encountered it in any year | I haven’t encountered it in any year | |
| Maximum | 1 year | 1 year | 1 year | 1 year | 1 year | 1 year | |
| Standard deviation | 0.224 | 0.336 | 0.431 | 0.279 | 0.334 | 0.410 | |
Appendix A.11
| Do you insure your crops? | Up to 30% of the crop yield was destroyed by drought | More than 30% of the crop yield was destroyed by drought | Up to 30% of the crop was damaged by hail, torrential rain, storm | More than 30% of the crop was damaged by hail, torrential rain, storm | Up to 30% of the crop was destroyed by torrential rain | More than 30% of the crop was destroyed by torrential rain | |
| I insure | Average | 0.10 | 0.00 | 0.13 | 0.00 | 0.58 | 0.58 |
| Minimum | I haven’t encountered it in any year | I haven’t encountered it in any year | I haven’t encountered it in any year | I haven’t encountered it in any year | I haven’t encountered it in any year | I haven’t encountered it in any year | |
| Maximum | 1 year | I haven’t encountered it in any year | 1 year | I haven’t encountered it in any year | 1 year | 1 year | |
| Standard deviation | 0.298 | 0.000 | 0.335 | 0.000 | 0.501 | 0.501 | |
| I do not insure | Average | 0.00 | 0.00 | 0.00 | 0.00 | 0.00 | 0.00 |
| Minimum | I haven’t encountered it in any year | I haven’t encountered it in any year | I haven’t encountered it in any year | I haven’t encountered it in any year | I haven’t encountered it in any year | I haven’t encountered it in any year | |
| Maximum | I haven’t encountered it in any year | I haven’t encountered it in any year | I haven’t encountered it in any year | I haven’t encountered it in any year | I haven’t encountered it in any year | I haven’t encountered it in any year | |
| Standard deviation | 0.000 | 0.000 | 0.000 | 0.000 | 0.000 | 0.000 | |
| Total | Average | 0.07 | 0.00 | 0.10 | 0.00 | 0.46 | 0.46 |
| Minimum | I haven’t encountered it in any year | I haven’t encountered it in any year | I haven’t encountered it in any year | I haven’t encountered it in any year | I haven’t encountered it in any year | I haven’t encountered it in any year | |
| Maximum | 1 year | I haven’t encountered it in any year | 1 year | I haven’t encountered it in any year | 1 year | 1 year | |
| Standard deviation | 0.261 | 0.000 | 0.303 | 0.000 | 0.503 | 0.503 | |
Appendix A.12

Appendix A.13
| Insurance Period | ||
| It is mandatory to insure crops after receiving investment support according to RDP programs | Pearson Correlation | −0.348 ** |
| Sig. (2-tailed) | 0.002 | |
| N | 77 | |
| It is mandatory to insure crops after receiving a short-term bank loan | Pearson Correlation | 0.804 ** |
| Sig. (2-tailed) | 0.000 | |
| N | 77 | |
| It is mandatory to insure crops after receiving a long-term bank loan | Pearson Correlation | 0.804 ** |
| Sig. (2-tailed) | 0.000 | |
| N | 77 | |
References
- Ullah, S.; Farooq, M.; Sarwar, T.; Tareen, M.J.; Wahid, M.A. Flood modeling and simulations using hydrodynamic model and ASTER DEM—A case study of Kalpani River. Arab. J. Geosci. 2016, 9, 439. [Google Scholar] [CrossRef]
- Knox, J.W.; Wade, S. Assessing climate risks to UK agriculture. Nat. Clim. Change 2012, 2, 378. [Google Scholar] [CrossRef]
- Arshad, M.; Kächele, H.; Krupnik, T.J.; Amjath-Babu, T.S.; Aravindakshan, S.; Abbas, A.; Mehmood, Y.; Müller, K. Climate variability, farmland value, and farmers’ perceptions of climate change: Implications for adaptation in rural Pakistan. Int. J. Sustain. Dev. World Ecol. 2017, 24, 532–544. [Google Scholar] [CrossRef]
- Falco, S.D.; Adinolfi, F.; Bozzola, M.; Capitanio, F. Crop insurance as a strategy for adapting to climate change. J. Agric. Econ. 2014, 65, 485–504. [Google Scholar] [CrossRef]
- Clapp, J. Food self-sufficiency: Making sense of it, and when it makes sense. Food Policy 2017, 66, 88–96. [Google Scholar] [CrossRef]
- Chavas, J.P.; Rivieccio, G.; Di Falco, S.; De Luca, G.; Capitanio, F. Agricultural diversification, productivity, and food security across time and space. Agric. Econ. 2022, 53, 41–58. [Google Scholar] [CrossRef]
- Panchasara, H.; Samrat, N.H.; Islam, N. Greenhouse Gas Emissions Trends and Mitigation Measures in Australian Agriculture Sector—A Review. Agriculture 2021, 11, 85. [Google Scholar] [CrossRef]
- Fisher, E.; Hellin, J.; Greatrex, H.; Jensen, N. Index insurance and climate risk management: Addressing social equity. Dev. Policy Rev. 2019, 37, 581–602. [Google Scholar] [CrossRef]
- Hossain, M.S.; Alam, G.M.; Fahad, S.; Sarker, T.; Moniruzzaman, M.; Rabbany, M.G. Smallholder farmers’ willingness to pay for flood insurance as climate change adaptation strategy in northern Bangladesh. J. Clean. Prod. 2022, 338, 130584. [Google Scholar] [CrossRef]
- Vitunskiene, V. Žemės ūkio gamybos rizika dėl nepalankių meteorologinių sąlygų ir jos valdymas draudimo bei politikos priemonėmis Lietuvoje. In Proceedings of the Mokslinė Praktinė Konferencija: Pasėlių Draudimo Reikšmė Valdant Riziką Žemdirbystėje: Mitai ir Perspektyvos, Įvykusios Akademijoje, Tempe, AZ, USA, 9 April 2015. [Google Scholar]
- Kardelis, K. Mokslinių Tyrimų Metodologija ir Metodai; Lucilijus: Šiauliai, Lithuania, 2005; ISBN 9955-655-35-6. [Google Scholar]
- Field, C.B.; Barros, V.R. (Eds.) Climate Change 2014–Impacts, Adaptation and Vulnerability: Regional Aspects; Cambridge University Press: Cambridge, UK, 2014. [Google Scholar]
- Babakholov, S.; Bobojonov, I.; Hasanov, S.; Glauben, T. An Empirical Assessment of the Interactive Impacts of Irrigation and Climate on Farm Productivity in Samarkand region, Uzbekistan. Environ. Chall. 2022, 7, 100502. [Google Scholar] [CrossRef]
- Jennings, S. Time’s Bitter Flood: Trends in the number of reported natural disasters. Oxfam Policy Pract. Clim. Change Resil. 2011, 7, 115–147. [Google Scholar]
- Eder, H.; Eiter, A.E. Land-und Forstwirtschaft im Klimawandel—Prognosen und Handlungsstrategien: Der Kritische Agrarbericht 2005 München, ABL-Verlag. 2005. Available online: http://www.kritischer-agrarbericht.de/fileadmin/Daten-KAB/KAB-2005/Eder_Eiter.pdf (accessed on 16 April 2022).
- Radzevičius, G. Pasėlių draudimo sistemos tobulinimo kryptys. Aleksandro Stulginskio universitetas. Vadyba 2007, 4, 125. [Google Scholar]
- Vidickienė, D.; Melnikienė, R.; Gedminaitė-Raudonė, Ž. Galimybės ir grėsmės, kylančios Lietuvos žemės ir miškų ūkiui dėl klimato kaitos. Manag. Theory Stud. Rural. Bus. Infrastruct. Dev. 2010, 22, 1–9, ISSN 1822-6760. [Google Scholar]
- Mestre-Sanchis, F.; Feijoo-Bello, M.L. Climate Change and Its Marginalinalizing Effect on Agriculture. Ecol. Econ. 2009, 68, 896–904. [Google Scholar] [CrossRef]
- Olesen, J.E.; Bindi, M. Consequences of Climate Change for European Agricultural Productivity, Land and Policy. Eur. J. Agron. 2002, 16, 239–262. [Google Scholar] [CrossRef]
- Žalakevičius, M. Wildlife Response to Climate Warming: Evidence, Future Research and Cooperation prospects. Acta Zool. Litu. 2005, 15, 199–203, ISSN 1392-1657. [Google Scholar] [CrossRef]
- Harrison, P.A. Modelling climate change impacts on species distributions at the European scale: Implications for conservation policy. Environ. Sci. Policy 2006, 9, 116–128. [Google Scholar] [CrossRef]
- Available online: http://agriskmanagementforum.org/sites/agriskmanagementforum.org/files/Documents/RapApRiskAssessment_Framework_Final_Web.pdf (accessed on 23 April 2022).
- Mačiulytė, V.; Stankūnavičius, G. Agrothermal changes in 1961–2018 in Lithuania. In Proceedings of the 3rd Baltic Earth Conference, Online, 27 May–4 June 2020; p. 72. [Google Scholar]
- Yanuarti, R.; Aji, J.M.M.; Rondhi, M. Risk aversion level influence on farmer’s decision to participate in crop insurance: A review. Agric. Econ. 2019, 65, 481–489. [Google Scholar] [CrossRef]
- Girdžiūtė, L.; Slavickienė, A. Decision making in agriculture and insurance as a risk management tool. Zemes Ukio Moksl. 2012, 19, 45–52. [Google Scholar]
- Kim, Y.; Yu, J.; Pendell, D.L. Effects of crop insurance on farm disinvestment and exit decisions. Eur. Rev. Agric. Econ. 2020, 47, 324–347. [Google Scholar] [CrossRef]
- Smith, V.H.; Watts, M. Index based agricultural insurance in developing countries: Feasibility, scalability and sustainability. Gates Open Res. 2019, 3, 65. [Google Scholar]
- Gommes, R.; Grieser, J. Crop insurance in developing countries. Dev. Coop. 2010, 37, 237–239. [Google Scholar]
- Melnikienė, R.; Vidickienė, D. Evaluation of the Lithuanian Agricultural Policy Based on the Analysis of Qualitative Structure. Public Policy Adm. 2019, 18, 52–67. [Google Scholar] [CrossRef]
- Peleckis, K.; Peleckienė, V.; Peleckis, K. Crop yield insurance–negotiating between government, farmers and insurance companies. Econ. Sci. Rural. Dev. 2015, 37, 15–25. [Google Scholar]
- Vitunskienė, V.; Lauraitienė, L. Crop insurance-based risk management of crop production risk related to adverse weather phenomena in lithuania. Sci. Stud. Account. Financ. Probl. Perspect. 2017, 11, 61–77. [Google Scholar]
- Melnikienė, R.; Namiotko, V.; Volkov, A.; Stalgienė, A.; Gapšys, A.; Baranauskaitė, L.; Mikelionytė, D. Agricultural and Food Sector in Lithuania; Lithuanian Institute of Agrarian Economics: Vilnius, Lithuania, 2017. [Google Scholar]


| Block of Reasons to Take Crop Insurance | Age | Duration of Farming | Farm Size | |
|---|---|---|---|---|
| Pearson Correlation | 0.224 * | 0.381 ** | 0.491 ** | |
| Participants | Expectations |
|---|---|
| States | the developed loss regulation system would offer the possibility to plan the need for budget assignations; effectiveness of the system; decrease the impact of unfavorable natural conditions on the income of farms; the state is interested in the creation of assumptions to reduce the insurance contribution level; development of the objective damage assessment system, assurance of justice and timeliness of damage compensation; purposeful formation of farmers’ trust in the developed system |
| Farmers | avoidance of the influence of severe unfavorable hydro-meteorological phenomena on the fertility of crops and income of the farm when using the services provided by the system; objectiveness of the assessment of losses and correct insurance amount for the suffered losses; involvement of the damage assessors that are selected by farmers and trained appropriately in the damage assessment process; |
| Insurers | offering attractive insurance products to farmers with the purpose to obtain their trust and support; assurance of operative and objective assessment of separate risk manifestation cases and payment in case of losses |
| Indexes | Number of the Insured Farms | Area, Ha | Part in the Crop Area, % | Part of Insured Plants in the Crop Area, % | Contribution, EUR | Benefit, EUR | Contribution—Benefit, EUR | |
|---|---|---|---|---|---|---|---|---|
| Year | ||||||||
| 2010 | 410 | 77,944 | 3.9 | 5.5 | 1,565,960 | 4,448,158 | −2,882,198 | |
| 2011 | 682 | 269,912 | 13.0 | 18.7 | 9,404,101 | 18,388,913 | −8,984,812 | |
| 2012 | 354 | 125,891 | 5.8 | 8.2 | 3,417,700 | 850,518 | 2,567,182 | |
| 2013 | 441 | 151,857 | 6.9 | 9.5 | 4,043,177 | 1,064,249 | 2,978,928 | |
| 2014 | 586 | 211,101 | 9.3 | 12.8 | 4,158,915 | 4,763,752 | −604,837 | |
| 2015 | 628 | 199,607 | 8.4 | 11.9 | 4,791,049 | 537,533 | 4,253,516 | |
| 2016 | 720 | 219,705 | 9.5 | 13.2 | 5,654,693 | 1,601,503 | 4,053,190 | |
| 2017 | 641 | 201,232 | 8.5 | 12.1 | 5,481,932 | 1,286,667 | 4,195,265 | |
| 2018 | 657 | 190,488 | 8.1 | 11.4 | 4,559,718 | 2,689,742 | 1,869,976 | |
| 2019 | 965 | 266,012 | 12.9 | 18.4 | 8,147,597 | 3,030,510 | 5,117,087 | |
| 2020 | 1377 | 321,415 | 16.1 | 21.4 | 8,932,979 | 8,464,623 | 468,356 | |
| 2021 | 1933 | 418,507 | 18.9 | 25.5 | 11,980,982 | 9,403,845 | 2,577,137 | |
| Size of farms | Arguments |
|---|---|
| Farms up to 50 ha | The farm would suffer big losses due to unfavorable climate conditions; The granted compensation of the crop insurance contribution is up to 50%; It is obligatory to insure crops after getting the investment support according to KPP; It is business, so it is important to control and reduce the risk in production; Insurers assess the suffered damage objectively |
| Farms from 50 to 300 ha | The granted compensation of the crop insurance contribution is up to 50%; The farm would suffer big losses due to unfavorable climate conditions; It is business, so it is important to control and reduce the risk in production; Insurers assess the suffered damage objectively |
| Farms from 300 ha and bigger ones | The granted compensation of the crop insurance contribution is up to 50%; The farm would suffer big losses due to unfavorable climate conditions; It is business, so it is important to control and reduce the risk in production; Insurers assess the suffered damage objectively; The crop insurance packages that are acceptable to the farm are offered in the market |
| Size of Farms | Arguments |
|---|---|
| Farms up to 50 ha | The farm is too small to insure crops; It is better to accumulate the own financial reserve to cover losses than pay insurance contributions every year; There is only one crop-insuring company in Lithuania; There is no possibility to insure individual kinds of crops |
| Farms from 50 to 300 | There is no possibility to insure individual types of crops; There is only one crop-insuring company in Lithuania; The market only offers complex crop insurance packages, and it is obligatory to insure all the crops; It is better to accumulate the own financial reserve to cover losses than pay insurance contributions every year; |
| Farms from 300 ha and bigger ones | There is no possibility to insure individual kinds of crops; There is only one crop-insuring company in Lithuania; The assessor of the insurance company sets lower losses than those suffered; The insurance company does not cover the total value of suffered losses (it does not pay the total amount for suffered losses) |
Disclaimer/Publisher’s Note: The statements, opinions and data contained in all publications are solely those of the individual author(s) and contributor(s) and not of MDPI and/or the editor(s). MDPI and/or the editor(s) disclaim responsibility for any injury to people or property resulting from any ideas, methods, instructions or products referred to in the content. |
© 2023 by the authors. Licensee MDPI, Basel, Switzerland. This article is an open access article distributed under the terms and conditions of the Creative Commons Attribution (CC BY) license (https://creativecommons.org/licenses/by/4.0/).
Share and Cite
Rusteika, M.; Skinulienė, L. Expectations of the Participants of the Crop Insurance System and Their Implementation. Agriculture 2023, 13, 649. https://doi.org/10.3390/agriculture13030649
Rusteika M, Skinulienė L. Expectations of the Participants of the Crop Insurance System and Their Implementation. Agriculture. 2023; 13(3):649. https://doi.org/10.3390/agriculture13030649
Chicago/Turabian StyleRusteika, Martynas, and Lina Skinulienė. 2023. "Expectations of the Participants of the Crop Insurance System and Their Implementation" Agriculture 13, no. 3: 649. https://doi.org/10.3390/agriculture13030649