1. Introduction
Food is one of the most fundamental requirements for human life and survival. Agriculture plays a vital role in fulfilling food requirements globally. The rate of growth in agricultural production has declined recently, according to the Food and Agricultural Organization (FAO) [
1]. Global food security is seriously threatened by this trend and other risks like climate change, population growth, rural-to-urban migration, and biofuel demand [
2]. As a result, to increase plant yield for food production, a higher yielding and more sustainable environment is required [
3,
4].
Given that there will hardly be an increase in the size of land available for agricultural use in the future, the best way to deal with the problem of food insecurity is by increasing the productivity of existing farmland. For this purpose, innovative methods to increase agricultural yield will be continuously required. Furthermore, since 30% of the global agricultural workforce is predicted to move to work in other sectors of the economy between 2017 and 2030 [
5], the adoption of agricultural technology becomes even more critical. Therefore, technology has been adopted, modified, and optimized increasingly over the past century to increase agricultural yields [
6]. Precision Agriculture (PA) is gaining popularity in this setting of sustainably increasing yields. PA is a broad term that encompasses all approaches used to improve the accuracy and control of farming management [
7]. These techniques include GPS navigation of tractors, robotics, remote sensing, data analytics, and unmanned aerial and terrestrial vehicles [
8]. PA relies heavily on early and precise plant disease detection.
Fruit production and cultivation comprise a sizeable portion of all agricultural activity and are essential to the human diet. On the other hand, fruit diseases (e.g., gray mold, apple scab, canker, black knot, brown rot) are among the key factors that can negatively influence the quality of fruits and reduce their production. Such diseases essentially affect the quality and quantity of fruits by interfering with several processes, such as plant growth, the development of flowers and fruits, and absorbent capacity [
9,
10]. As a result, early detection and precise classification of fruit diseases is an intriguing problem related to increasing the potential economic value of fruits [
11]. The manual inspection of plants and fruits to detect any signs of disease involves various issues. Firstly, it demands ongoing monitoring, disease identification expertise, and other related efforts and time [
12]. Furthermore, this method might not detect all infections.
As far as automated techniques for the detection and classification of fruit diseases are concerned, we can categorize them as laboratory methods (e.g., serological methods and molecular techniques [
13]) and image processing methods. As image processing methods are inexpensive and non-destructive while yielding superior performance, they have been widely used [
14,
15]. Fruit plants exhibit various symptoms from their early to late stages, which are, in most cases, distinctly observable to the naked eye on infected fruits and plants [
16]. Thus, image processing algorithms can be created to diagnose these conditions quickly, accurately, and affordably using typical digital photographs [
17,
18].
The use of image processing techniques and machine learning algorithms in disease detection and recognition is a growing research field with great potential to address the challenges involved in the early detection of diseases [
13,
18,
19]. These methods have been developed to achieve accuracies exceeding human-level perception.
As far as the workflow of disease identification and classification using image processing is concerned, it comprises almost identical phases in all approaches. Specifically, the captured image passes through four steps: image pre-processing, image segmentation, feature extraction, and classification. To this end, early works employed classical image processing procedures and ‘hand-crafted’ feature extraction from leaf and fruit images. The extracted features were then used to train shallow classifier algorithms such as support vector machines, principal component analysis, maximum likelihood classification, k-nearest neighbors, naïve Bayes, decision trees, random forest, and artificial neural networks (e.g., [
20,
21,
22,
23]). Another recent line of work has mainly focused on deep learning architectures comprising convolutional neural networks to automate feature extraction and image classification (e.g., [
24,
25,
26,
27]).
Despite the exciting results reported by the aforementioned methods, the reliance on a single classifier is deemed to affect the performance of disease detection and classification. In this way, the classification methods based on a single method underperform when applied to large heaps of fruit because of the diversity in texture, shape, color, size, disease, and maturity levels. Here, we propose a hybrid ensemble method for fruit disease identification and fruit classification that employs a multilevel fusion method, intensive fruit image pre-processing, customized image kernels for feature extraction using state-of-the-art deep methods, and Gini-index-based controlled feature selection. The major contributions of this study are as follows:
The hybrid ensemble classification method is inspired by multilevel fusion methodology that includes intensive fruit image pre-processing, adoption of customized image kernels for feature extraction with state-of-the-art (SOTA) deep methods, and Gini-index-based controlled feature selection.
Considering different use cases of convolutional neural networks (CNNs) simulated on multiple imagery data, we evaluated the performance of Squeeze Net with defined/customized image kernels.
Although the performance of state-of-the-art (SOTA) methods is architecture-dependent, the performance of Squeeze Net was noted to be better with relatively faster training time. It ultimately helped to improve classification accuracy by empowering the weaker classifiers.
The ensemble model outperforms individual classifiers with the help of the best feature extractor, Squeeze Net, among other convolution networks, including Inception-V3, VGG-16, VGG-19, and DeepLoc, simulated on larger sets of imagery data.
The proposed ensemble method lays the foundation for efficient solutions to similar problems on embedded devices by adopting Squeeze Net (in general) and MobileNetV2 (in particular) for remote imagery data.
The rest of the manuscript is organized as follows. A brief description and the limitations of related work are presented in
Section 2.
Section 3 presents the proposed method with a description of the essential components of the architecture.
Section 4 discusses the significant results, and
Section 5 concludes the research work.
2. Related Work
There are two approaches for fruit disease classification. The first approach, applicable at an early stage of plant and fruit development, attempts to identify diseases in plants and leaves [
24,
28,
29]. The second approach involves analyzing the skin and appearance of the fruit for disease identification and classification. The scope of this study is limited to the latter approach. In the following, we provide a brief overview of methods and techniques proposed by researchers for disease identification and classification in several fruits, such as citrus, apple, mango, papaya, and strawberry.
Citrus is one of the most popular fruit in the world. Citrus fruit may suffer from various diseases, such as canker, greening, anthracnose, scab, black spot, and melanose. Cubero et al. provide an excellent review of the application of machine learning techniques for various issues related to citrus fruit, including disease detection [
30]. Sharif et al. used the support vector machine (SVM) algorithm to identify and classify these diseases in citrus fruit [
31]. The proposed method identifies the lesion spots on the fruit’s skin using a segmentation method followed by the classification of diseases. The proposed method is tested on three datasets and achieved 97%, 90.4%, and 89% accuracy for these datasets. Abdulridha et al. used unmanned aerial vehicles to capture hyperspectral images of a citrus orchard for real-time identification of the citrus canker disease [
32]. The radial basis function achieved a classification accuracy of 94%, 96%, and 100% for asymptomatic, early, and late symptoms of citrus canker, respectively. The corresponding results for the k-nearest neighbors method were 94%, 95%, and 96%. Rauf et al. prepared a dataset comprising 759 images of healthy and unhealthy citrus leaves and fruit to help other researchers develop methods and techniques for citrus disease detection [
33].
Apple is another fruit consumed throughout the world for the whole year. The most common diseases in apple fruit include black rot canker, apple scab, powdery mildew, core rot, white/brown/root rot, collar rot, and seedling blight [
34]. Turkoglu et al. proposed an ensemble classification method for apple disease detection [
35]. The study applied deep feature extraction on pre-trained models and used the SVM and long short-term memory (LSTM)-based convolutional neural network for disease classification. The authors used a real-time dataset comprising leaves and fruit images. The proposed method achieved 96.4% accuracy with SVM and 99.2% using LSTM. Tian et al. proposed a deep learning model for detecting anthracnose lesions in apple fruit [
36]. The authors highlight the difficulty in collecting sufficient data for fruit diseases and use Cycle-Consistent Adversarial Network to augment the available data. The authors used the YOLO-V3 model for disease identification. Fan et al. also used a deep learning model for segregating defective apples from healthy fruit [
37]. The study also employed conventional machine learning algorithms, but reported better results using deep learning models. Al-Shawwa and Abu-Naser developed a traditional expert system for detecting all apple fruit diseases mentioned above [
34]. A limitation of the study is that the detailed design is not discussed. Moreover, the results are not reported in the study to compare with other solutions.
Strawberries provide great economic value to farmers. However, diseases and pests pose a significant threat to the strawberry fruit. Dong et al. used a deep learning model to identify nine diseases and pests in strawberry fruit, including root rot, slug, thrips, powdery mildew, sunburn, botrytis cinerea, vegetable green insect, virus disease, and aphid [
38]. The authors used an enhanced AlexNet by transfer learning that reduced the learning time for the proposed model. The classification accuracy was improved using the inner product and vector max norm. Further details of the proposed model are provided by [
39]. Siedliska et al. propose using hyperspectral imaging to detect fungal infections in strawberries [
40]. The authors used visible, near-infrared, and shortwave-infrared (VNIR/SWIR) spectroscopy to capture images of two groups of strawberries; a control group without any treatment and a group inoculated with fungi. The study used four classification methods: backpropagation neural network, random forest, naïve Bayes, and support vector machine. The backpropagation neural network achieved the best results.
Habib et al. developed a near real-time computer vision model to detect and identify five diseases in papaya fruit: brown spot, black spot, phytophthora blight, anthracnose, and powdery mildew [
41]. A user-captured image from the field is pre-processed by: (a) resizing the image to a fixed size, (b) enhancing contrast through histogram equalization, and (c) converting the image from color to L*a*b* color space. The k-means clustering algorithm is used for image segmentation into healthy and unhealthy fruit regions. The unhealthy regions are then subjected to a feature extraction phase comprising gray level co-occurrence matrix and statistical features. Finally, a support vector machine classifier is used to identify the disease. Andrushia and Patricia use ant colony optimization for feature identification and support vector machine to identify anthracnose and stem end rot diseases of the mango fruit [
42].
Several review articles have also addressed the problem of automatic fruit disease identification and classification. Naranjo-Torres et al. have reviewed the application of the convolutional neural network in the problem domain [
43]. Bhargava and Bansal have addressed the fruit disease identification problem while reviewing fruit and vegetable grading and quality inspection [
15]. Wani et al. provide an excellent review of conventional and deep learning techniques for plant and fruit disease detection [
44].
3. Methodology
We propose a multilevel fusion methodology for fruit disease identification and fruit classification that includes intensive fruit image pre-processing, customized image kernels for feature extraction with state-of-the-art (SOTA) deep methods, Gini-index-based controlled feature selection, and hybrid ensemble method for identification and classification.
Figure 1 presents the salient components of the proposed methodology in two segments. The first segment (represented with pink objects) shows a systemic flow of multi-fruit classification. The multi-fruit imagery data contains regular and augmented images of various fruits, including apple, apricot, avocado, banana, cherry, fig, grape, guava, kiwi, mango, orange, peach, pear, pineapple, and strawberry. We identified images of fruits with different shapes, sizes, quality, saturation, and labels that required intensive pre-processing to normalize the fruit for an enhanced classification. In addition, we designed an auto-labeling mechanism based on the existing image clusters to label inconsistent data to belong to appropriate classes. Lastly, we verified the auto-labeled data with a complete inspection to correctly assign it to the relevant classes. Our proposed methodology can be generalized to any larger set of diverse fruit types to meet the agricultural industry requirements for bulk fruit classification.
The state-of-the-art (SOTA) convolutional neural networks generate enormous feature sets of image data that are computationally expensive for conventional classification methods. We employed the custom image kernels to extract the relevant and most significant features. Further, we pruned the extracted features using the Gini index, information gain, and entropy of feature values. Eventually, the pruned features were used as inputs for the ensemble classifier. We used decision trees, AdaBoost, support vector machine, random forest, and gradient boosting methods. We employed individual classifiers on diverse imagery data, although classification outcomes fluctuated. The classification accuracy of an individual classifier on certain imagery data was very different on another data set and vice versa. The variations in the outcomes of single classification methods require devising a new ensemble classification method based on the majority voting policy of several distinct classifiers.
The second segment (represented by green objects) depicts a systemic flow of multi-fruit disease classification. The existing multi-fruit disease imagery data also contains regular and augmented images of different fruits including beans (two categories), strawberries (seven categories), and tomatoes (three categories). Here we also noticed that fruit disease data comes in different shapes, sizes, quality, saturation, and labels. Therefore, as with the fruit imagery data, we performed intensive pre-processing to bring the disease imagery data to a consistent format acceptable for an enhanced classification. In the second segment, we devised an auto-labeling method for correctly labeling unlabeled augmented data (ensuring complete inspection of annotations). At this stage, we also encountered challenges of achieving stable and consistent classification outcomes from single classification methods for various fruit diseases. Here, the proposed ensemble method equally bestowed the significant classification outcomes, tested on various disease data. We illustrate the process in the subsequent section.
Let us consider a set IINPUT = {I1, I2, I3, I4…IK, ∀ K ∈ N} of input fruit images. Let IOUT = {O1, O2, O3, O4…OM, ∀ M ∈ N} be a scaled set of IINPUT images. Let IK, ∀ K ∈ N carry a scale w × h, where w, h ∈ [N, N]. If W, H are new dimensions of IK, W × H is a new scale of OM, ∀ M ∈ N, mapped with OM (x, y) = OM (W, H) = IK (w/W, h/H), where x ∈ [0, N] and y ∈ [0, N]. Further, we consider any fruit image I (a, b) ∈ IINPUT, 0 ≤ a, b ≤ N − 1 of size N × N. Let I’ (a’, b’) ∈ IOUT, where 0 ≤ a’, b’ ≤ M − 1 of size M × M ∀ M ∈ N. We construct a mapping function F: IINPUT → IOUT defines a zoomed image Z (I’ (a’, b’)) = I (ka, kb), where k ∈ N.
Now, we consider a fruit image
J (
p, q) ∈
IINPUT, 0 ≤
p, q ≤ N − 1 of size N × N. Let
J’ (p’, q’) ∈
IOUT, where 0 ≤ p’, q’ ≤ M − 1 of size M × M ∀ M ∈ N. Here, we consider a new mapping function S:
IINPUT →
IOUT defines a sheared image Z in the x-direction by
J’ (p’, q’)) =
J (
p, kq), where k ∈ R. Similarly, we can also construct another mapping function S’:
IINPUT →
IOUT that defines a sheared image Z’ in the y-direction by
J’ (p’, q’)) =
J (kp, q), where k ∈ R. Let us consider a fruit image
F (r, s) ∈
IINPUT, 0 ≤ r, s ≤ N − 1 of size N × N. Let
F’ (r’, s’) ∈
IOUT, where 0 ≤ r’, s’ ≤ M − 1 of size M × M ∀ M ∈ N. Now, we construct a flip function T:
IINPUT →
IOUT that defines a flip image in the x-direction by
F’ (r’, s’)) =
F (r, s-k), where k ∈ R. Further, let function T’:
IINPUT →
IOUT for a flipped image in the y-direction by
F’ (r’, s’) =
F (r-k, s), where k ∈ R. Algorithms 1–4 describe the pre-processing steps.
| Algorithm 1: Preprocessing (Scaling) of Fruit Images |
| Inputs: IINPUT = {I1, I2, I3, I4…IK,∀ K∈ N} of input fruit images. |
| Outputs: IOUT = {O1, O2, O3, O4…OM,∀ M∈ N} |
| | Start PROC_SCALE |
| | Let w, h = IK ∈ IINPUT, K ≤ N, where w, h are width and height of current image |
| | Let w’, h’ = 100, 100 ∀ IK ∈ IINPUT, K ≤ N, where w’ and h’ are new dimensions of image |
| | Let s_x = w’/w, s_y = h’/h, where s_x and s_y are revised scales of image IK, K ≤ N |
| | | ForA in range (h’): |
| | | | ForB in range (w’): |
| | | | | scaled_IK→populate(x, y), where populate is a procedure that scales IK, K ≤ N |
| | | save_IK→ OM,∀ M∈ N, OM∈ IOUT |
| | | | End For |
| | | End For |
| | End PROC_SCALE |
| Algorithm 2: Preprocessing (Zooming) of Fruit Images |
| Inputs: IINPUT = {I1, I2, I3, I4…IK,∀ K∈ N} of input fruit images. |
| Outputs: IOUT = {O1, O2, O3, O4…OM,∀ M∈ N} |
| | Start PROC_ZOOM |
| | Let a, b = IK ∈ IINPUT, K ≤ N, where a, b are old dimensions of current image |
| | Let a’, b’ = IM ∈ IOUT, M ≤ N, where a’ and b’ are new zoomed dimensions of image |
| | | ForX in range (a’): |
| | | | ForY in range (b’): |
| | | | | Zoomed_IK→generate(a, b), where generate will map new dimensions to old dimensions ∀ IK, K ≤ N |
| | | | save_IK→ OM,∀ M∈ N, OM∈ IOUT |
| | | | End For |
| | | End For |
| | End PROC_ZOOM |
| Algorithm 3: Preprocessing (Shearing) of Fruit Images |
| Inputs: IINPUT = {I1, I2, I3, I4…IK,∀ K∈ N} of input fruit images. |
| Outputs: IOUT = {O1, O2, O3, O4…OM,∀ M∈ N} |
| | Start PROC_SHEAR |
| | Let p, q = J (p, q) ∈ IINPUT, p, q ≤ N, where p, q are old coordinates of any image |
| | Let p’, q’ = J’(p’, q’) ∈ IOUT, p’, q’ ≤ N, where p’ and q’ are new sheared dimensions |
| | | ForS in range (p’): |
| | | | ForT in range (q’): |
| | | | | Define S: IINPUT→ IOUT for sheared image Z in x-direction by J’ (p’, q’)) = J (p, kq), where k∈R |
| | | | | Define S’: IINPUT→ IOUT for sheared image Z’ in y-direction by J’ (p’, q’)) = J (kp, q), where k∈R |
| | | | Save Z, Z’→ OM,∀ M∈ N, OM∈ IOUT |
| | | | End For |
| | | End For |
| | End PROC_SHEAR |
| Algorithm 4: Preprocessing (Flipping) of Fruit Images |
| Inputs: IINPUT = {I1, I2, I3, I4…IK,∀ K∈ N} of input fruit images. |
| Outputs: IOUT = {O1, O2, O3, O4…OM,∀ M∈ N} |
| | Start PROC_FLIP |
| | Let r, s = F (r, s) ∈ IINPUT, r, s ≤ N, where r, s are old coordinates of any image |
| | Let r’, s’ = F’(r’, s’) ∈ IOUT, r’, s’ ≤ N, where r’ and s’ are new flipped dimensions |
| | | ForA in range (r’): |
| | | | ForB in range (s’): |
| | | | | Define T: IINPUT→ IOUT for Flipped image F in x-direction by F’ (r’, s’)) = F (r, s-k), where k∈R |
| | | | | Define T’: IINPUT→ IOUT for Flipped image F in y-direction by F’ (r’, s’)) = F (r-k, s), where k∈R |
| | | | Save F, F’→ OM,∀ M∈ N, OM∈ IOUT |
| | | | End For |
| | | End For |
| | End PROC_FLIP |
Let us now consider
IOUT = {O
1, O
2, O
3, O
4…O
M, ∀ M ∈ N} and
I’OUT = {O
1, O
2, O
3, O
4…O
M, ∀ M ∈ N} as pre-processed images of normal and rotten fruit, respectively. We extract feature vectors
F, and
F’ of said datasets, and analyze with classification methods described in Algorithms 5 and 6 below.
| Algorithm 5: Ensemble Classification of pre-processed Images |
| Start: PROC_Fruits-Classification |
| Inputs: Feature Vector F of IOUT = {O1, O2, O3, O4…OM,∀ M∈ N} images of different fruits |
| Outputs: Classification Outcomes vector of different fruits C achieved for P instances |
| | Let us consider a collection IOUT = {O1, O2, O3, O4…OM,∀ M∈ N} of processed images |
| | | Let us extract the features by applying image embedding to extract F = {F1, F2, F3, Fi} features of images∀ i ≤ N |
| | | | Analyze Pi instances with features F using AdaBoost classifier where each Pi in P |
| | | | Analyze Pi instances with features F using the Decision tree classifier, each Pi in P |
| | | | Analyze Pi instances having features F using Support Vector Machine (SVM) classifier, each Pi in P |
| | | | Analyze Pi instances having features F using Random Forest classifier, each Pi in P |
| | | | Analyze Pi instances with features F using GradientBoost where each Pi in P |
| | | | Analyze the individual performance of all classifiers on Pi attributes of P for i ≤ N |
| | | | Output the classification as a result C (Y ≤ 5) of Y classifiers |
| | | End |
| End: PROC_Fruits-Classification |
| Algorithm 6: Ensemble Fruit Disease Classification of pre-processed Images |
| Start: PROC_Fruits-Disease_Classification |
| | Inputs: Feature Vector F’ of I’OUT = {O1, O2, O3, O4…OM,∀ M∈ N} images of rotten fruits |
| | Outputs: Classification Outcomes of fruit disease vector C’ achieved for P instances |
| | Let us consider a collection I’OUT = {O1, O2, O3, O4…OM,∀ M∈ N} of processed fruit disease images |
| | | Let us extract the features by applying image embedding to extract F = {F’1, F’2, F’3, F’i} features of fruit diseases images∀ i ≤ N |
| | | | Analyze Pi instances with features F’ using AdaBoost classifier where each Pi in P |
| | | | Analyze Pi instances with features F using the Decision tree classifier, each Pi in P |
| | | | Analyze Pi instances having features F using k-Nearest Neighbor (kNN) classifier, each Pi in P |
| | | | Analyze Pi instances having features F using Random Forest classifier, each Pi in P |
| | | | Analyze the individual performance of all classifiers on Pi attributes of P for i ≤ N |
| | | | Output the classification as a result C’ (Y ≤ 4) of Y classifiers |
| | | End |
| | End: PROC_Fruits-Disease_Classification |
Further, we implemented the bagging strategy to seek a classification model with the lowest variance compared to single classification methods. The proposed ensemble model achieved the best approximation of bootstrap samples. Let us consider
M bootstrap samples of size L as described,
In the above expression given by (*),
represents L-th training examples of M-th bootstrap samples. Based on
M samples, we can fit about
M weak learners
Learner1 (.),
Learner2 (.),
Learner3 (.), …….…,
LearnerM(.) to seek lower variance by averaging their outcomes. The ensemble model thus becomes:
Using equation 1, we apply soft voting policy, aggregate, and average the probabilities of models presented in
Figure 1, and retain the class with the highest mean probability. In addition, the chosen models for voting policy adopted parallelism and provided the flexibility to include as many models as required.
4. Results and Discussion
In the following
Section 4.1 we present the numerical results as the performance analysis of different classification methods, while
Section 4.2 further illustrates the findings.
4.1. Results
We reviewed several publicly available fruit imagery datasets based on the reported literature on fruit classification and disease identification. We noticed certain limitations in adopting a single data source regarding limited data sizes, variability in fruit types, variability in quality, and variability in disease type. Eventually, we extensively aggregated and pre-processed multi-fruit data to simulate our proposed ensemble model on comprehensive datasets to cover fruit classification and disease identification. The multi-fruit imagery data contained regular and augmented images of fruit including apple, apricot, avocado, banana, cherry, fig, grape, guava, kiwi, mango, orange, peach, pear, pineapple, and strawberry. Similarly, the multi-fruit disease imagery data also contains regular and augmented images of different fruits including beans (two categories), strawberries (seven categories), and tomatoes (three categories). We also identified images of fruits with different shapes, sizes, quality, saturation, and labels that required intensive pre-processing to normalize the fruit for an enhanced classification. In addition, we designed an auto-labeling mechanism based on existing image clusters to label inconsistent data to the appropriate classes. Lastly, we verified the auto-labeled data with a complete inspection to assign the relevant classes correctly.
We employed the following evaluation measures to investigate the performance of the classification methods:
True Positive (TP): The outcome of the model when the model correctly predicts the positive class
False Positive (FP): The outcome of the model when the model incorrectly predicts the positive class
True Negative (TN): The outcome of the model when the model correctly predicts the negative class
False Negative (FN): The outcome of the model when the model incorrectly predicts the positive class
(a)
Accuracy: The proportion of true results to the total number of cases examined,
(b)
Precision: The proportion of predicted positives to be truly positive,
(c)
Recall: The proportion of actual positives correctly classified,
(d) AUC: How well the probabilities from the positive classes are separated from the negative classes.
(e)
F1-Score: The overall performance of the model is measured
Figure 2 shows the performance of different fruit classification methods. The decision tree classifiers performed the worst, with an average of 0.85 for recall, F1 score, and classification accuracy. The SVM and random forest classifiers depict similar outcomes on almost all evaluation metrics, with evaluation measures of 0.93 to 0.95. The proposed ensemble classifier outperforms all other classification methods, achieving 100% for AUC, CA, F1 score, precision, and recall.
Table 1 presents the misclassification (partial confusion matrix) of different classification methods (only cells colored red refer to misclassifications). The decision tree classifier depicts a more significant misclassification for some fruits, i.e., fig, guava, kiwi, mango, orange, and pear. Gradient boosting and random forest misclassified guava, mango, and pear. The ensemble classification had no misclassification except for guava (5%) and outperformed all single classification methods. Almost all classification methods carried a more considerable misclassification for the guava fruit. Similarly, mango was also misclassified to some extent by decision trees, AdaBoost, SVM, gradient boost, and random forest algorithms.
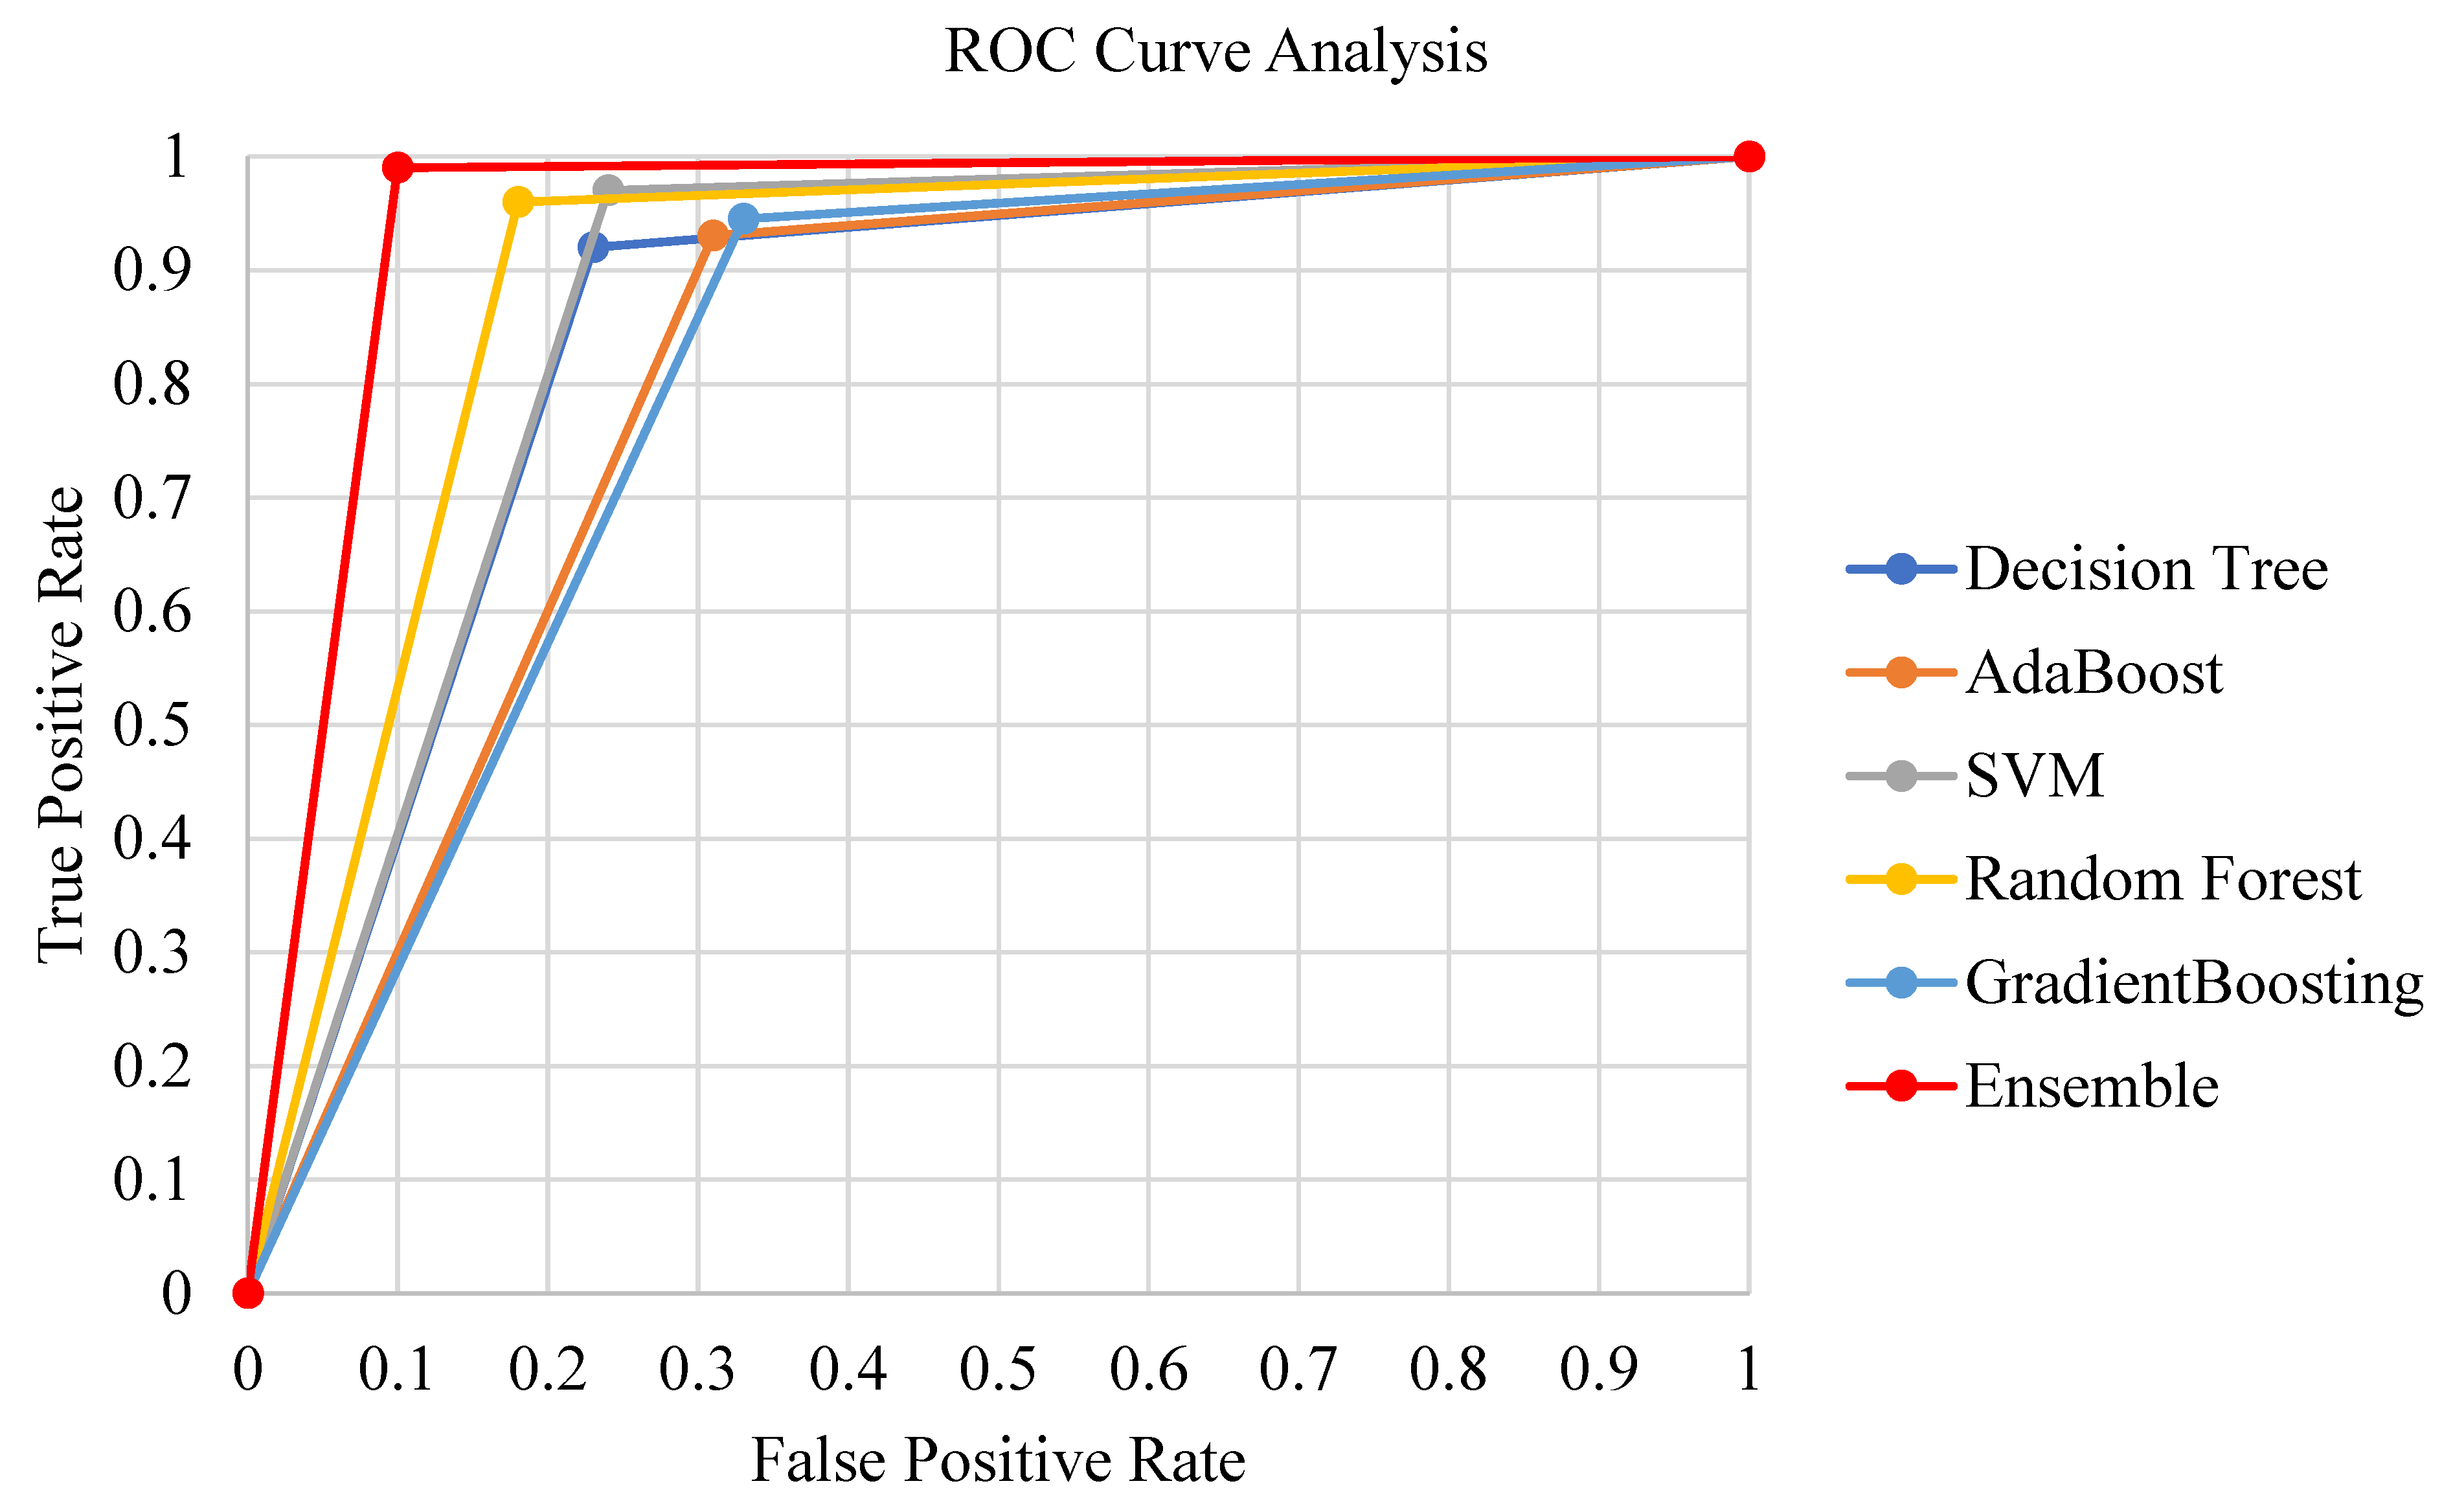
Figure 3 presents the ROC analysis of the classification methods. The AdaBoost and decision tree classifier methods performed the worst. Gradient boosting and random forest classification methods show similar true positive/false positive rates. In contrast, the ensemble classification method stands out with a significant curve leaning towards the upper left corner of the ROC graph.
Further, we calculated the performance metrics of different classification methods for fruit disease identification. We recorded the following observations.
Figure 4 demonstrates the performance analysis of different classification methods for fruit disease identification. Here, we can notice that the decision tree classifier underperformed with an average of 0.67 for recall, precision, F1 score, and CA, while it achieved 0.86 for the area under the curve. Random forest showed an intermediate performance compared to other classification methods, with an average score of 0.78 for recall, precision, F1, and CA, while it scored 0.96 for the AUC metric. Similarly, the kNN performed well for all evaluation metrics. We can notice the outperformance of the ensemble classification method that scored 0.99 for the AUC and 0.93 for other evaluation metrics.
Table 2 shows the misclassification of classification methods for fruit disease identification (only cells colored red refer to misclassifications). We can see that the decision tree classifier had a more significant misclassification of 51%, 26%, 9%, 3%, and 6%, for Beans-1, Beans-2, Strawberry-1, Strawberry-2, and Strawberry-4, respectively. Similarly, AdaBoost missed fruits Beans-1, Beans-2, and Strawberry-5 with a more significant 77%, 19%, and 82%, respectively. The kNN and random forest misclassified Beans-1 and Beans-2 by 82% and 76%, respectively. The ensemble classifier stood out with misclassifications of 3% and 7% for Beans-1 and Beans-2, respectively. Almost all classification methods misclassified Beans-1 and Beans-2 to varying extents.
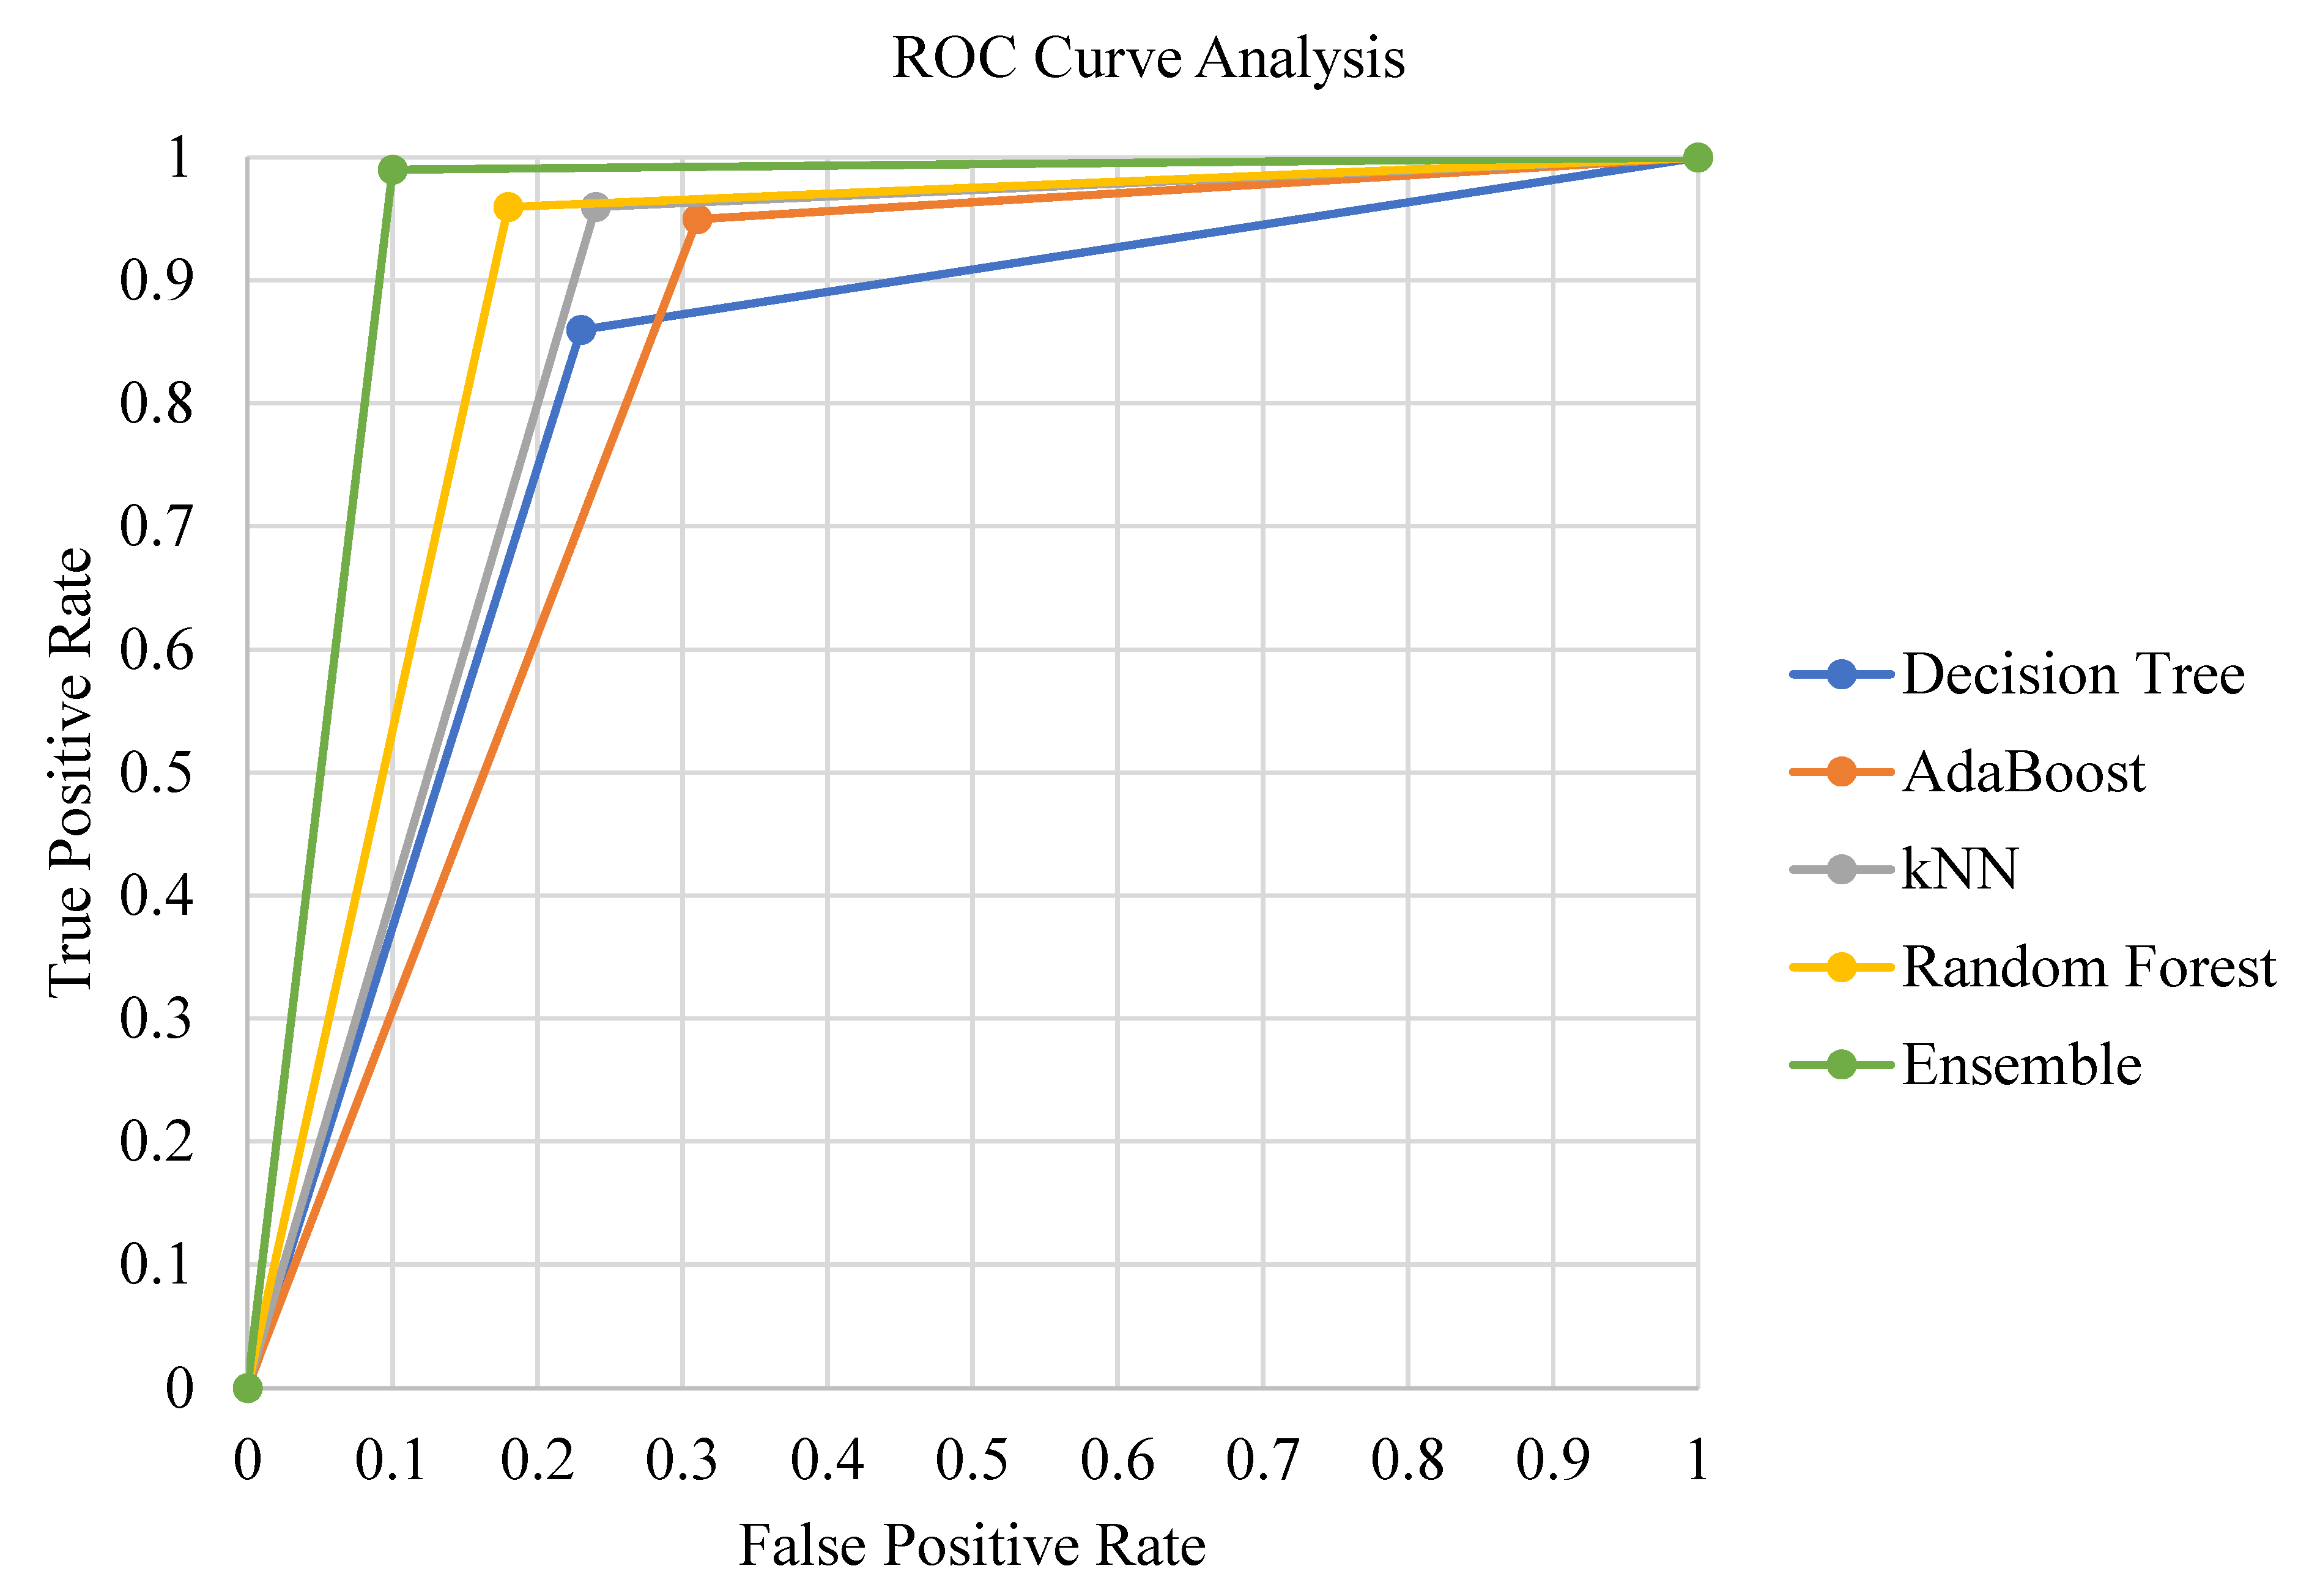
Figure 5 shows the receiver operating characteristic (ROC) curve analysis of the classification methods. The AdaBoost and Decision Tree classifiers performed the worst, and kNN and Random Forest classification methods show similar true positive/false positive rates. In contrast, the ensemble classification method stands out with a significant curve leaning towards the upper left corner of the ROC graph.
4.2. Discussion
To analyze the performance of our proposed ensemble classification method, we compiled a larger dataset of over 20,000 images. A careful review of the literature reported the employment of various datasets. The reported datasets varied to a larger extent regarding the size, shape, quality, and variety of fruits for classification and disease identification.
We segregated our datasets into four major segments. We applied bootstrapping on each segment to identify an optimal method for feature extraction. The study considered Inception V3, Squeeze Net, VGG-16, VGG-19, and DeepLoc as the best candidate networks for feature extraction.
Table 3 highlights the comparative analysis of different feature extraction methods. We employed the convolution layers of these models. Based on the images’ embedding, we noticed the following cumulative statistics:
Figure 6 describes the performance metrics of different feature extraction models. For our particular domain of fruit classification and disease identification, we recorded that Squeeze Net outperformed the other models with an extent of 0.99 for AUC, 0.95 for CA, F1 score, and recall. In addition, it showed a precision of 0.97 compared to the other models.
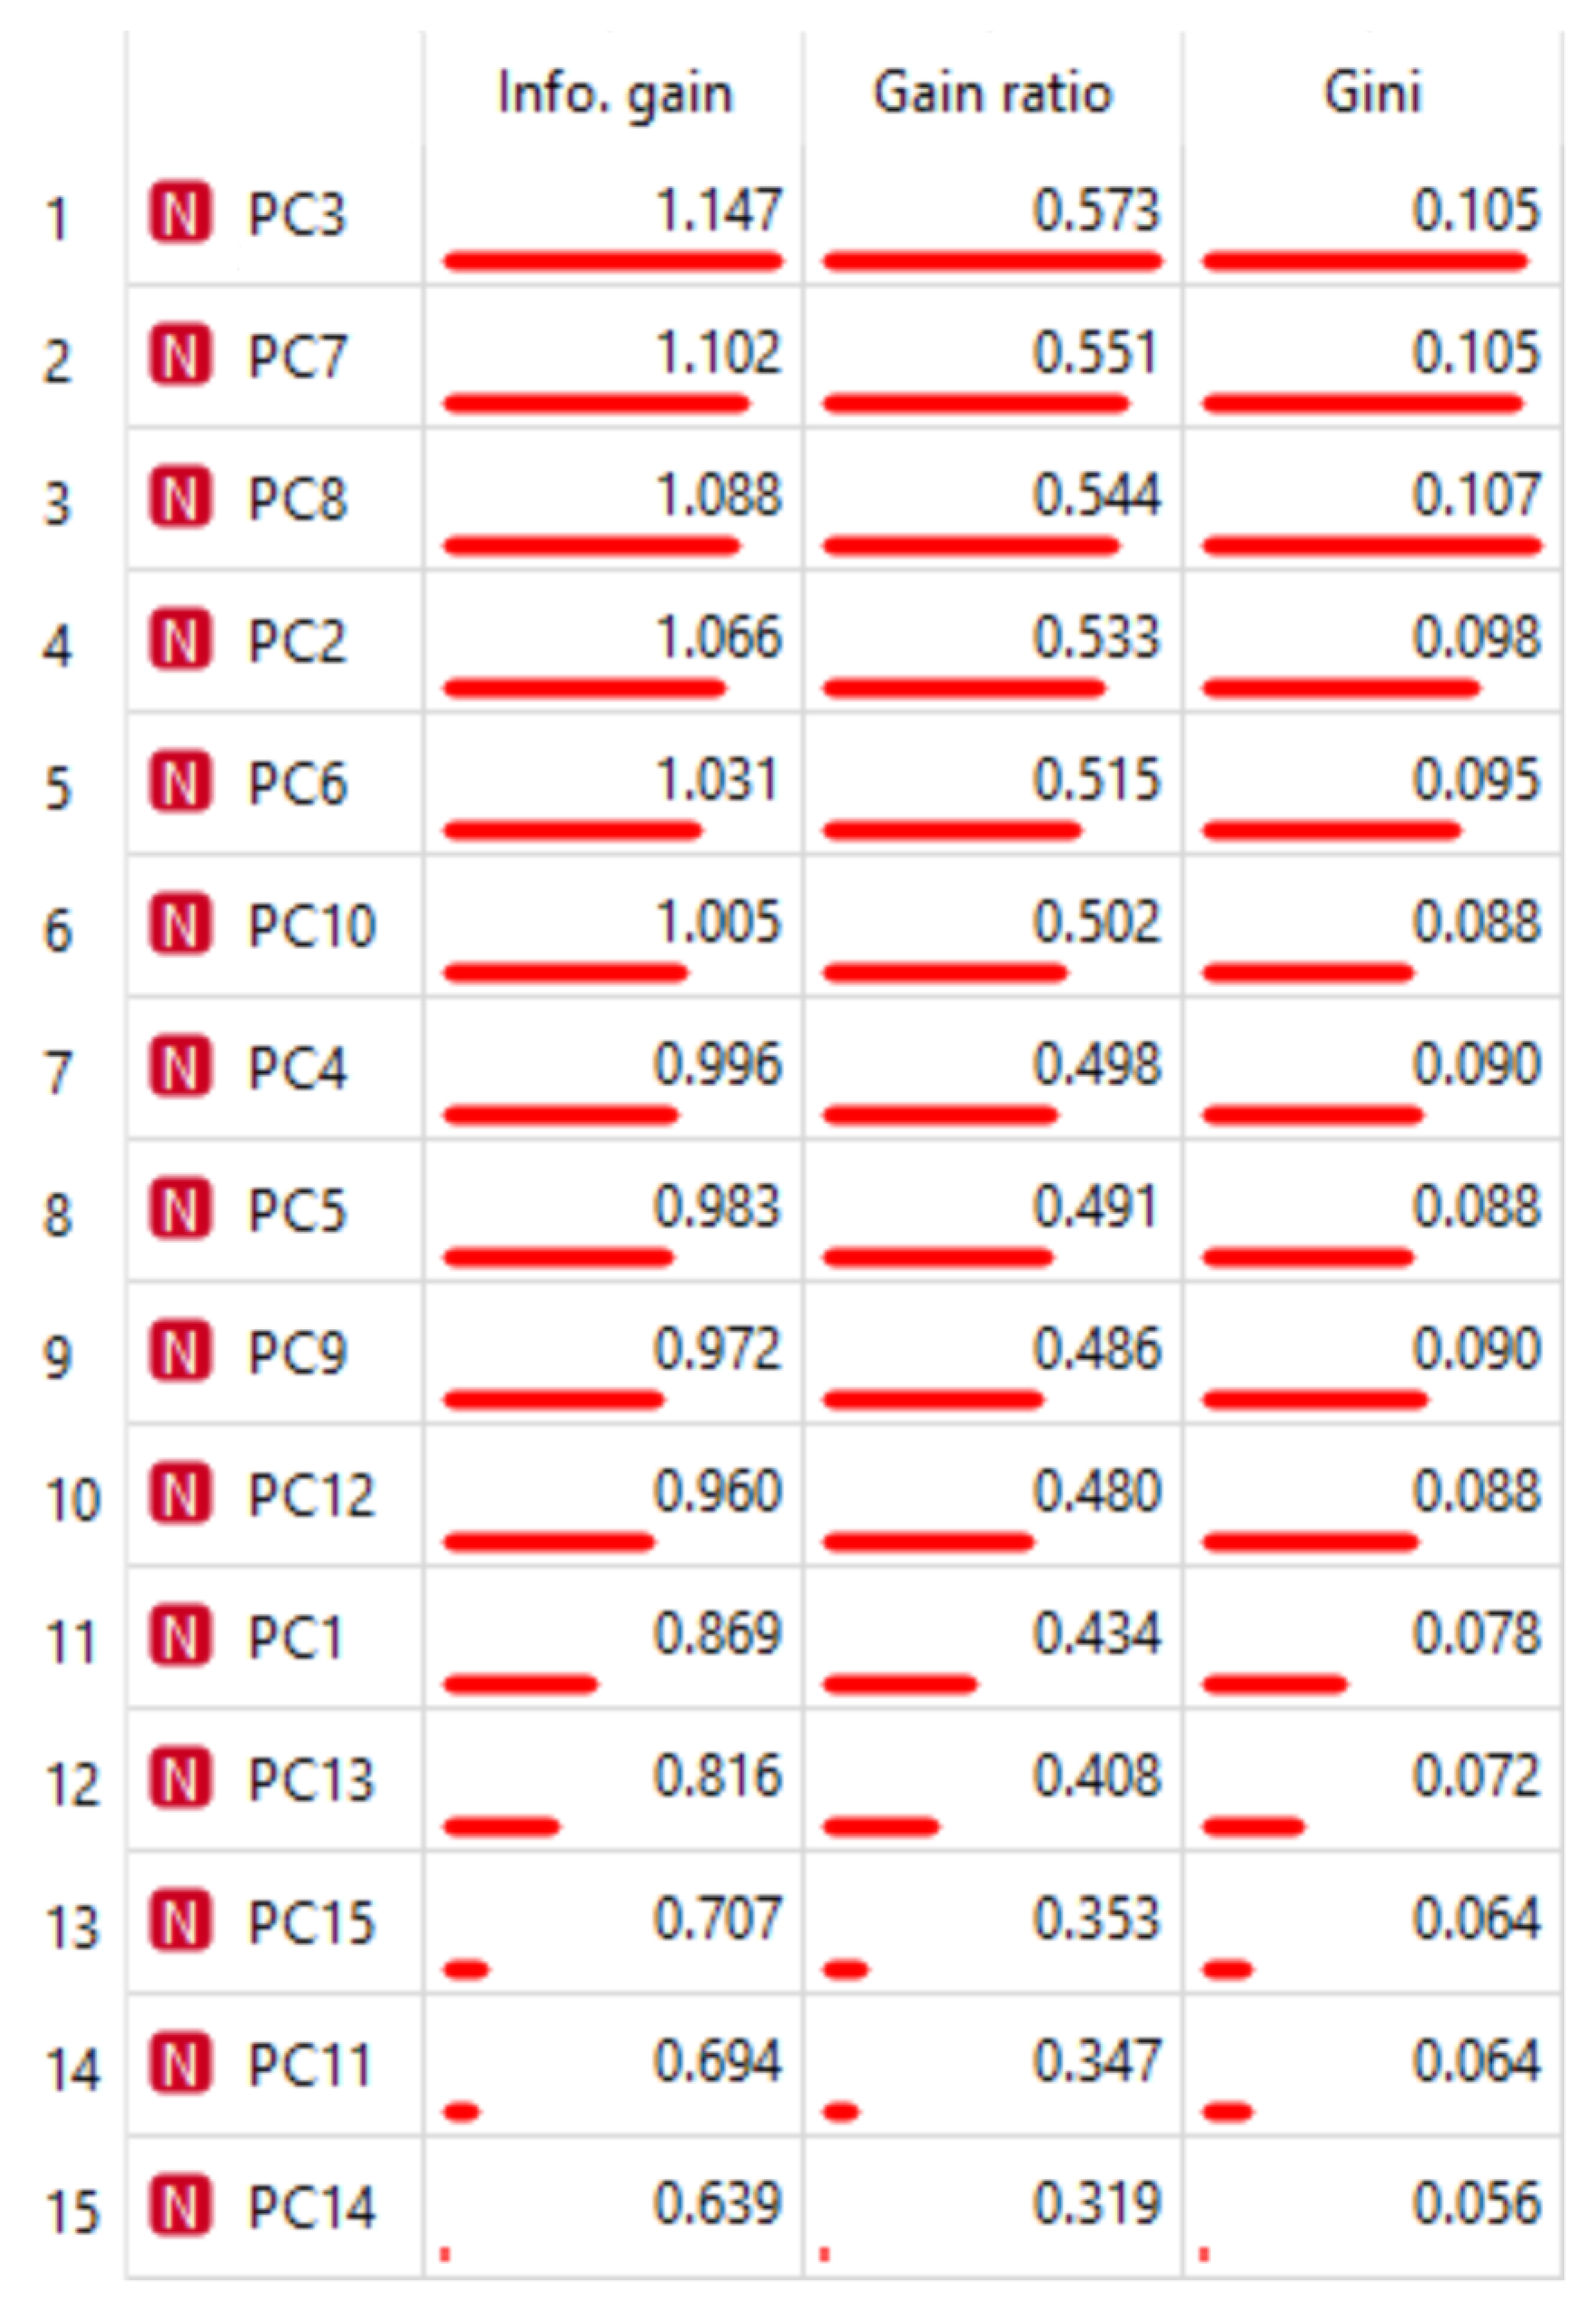
Figure 7 shows the selection of features based on information gain, gain ratio, and Gini index. The principal components are represented with letters "PC", for instance "PC3" represents the third principal component. The Gini index is considered an excellent split criterion for most machine learning algorithms. This is the reason that we restricted our findings to the Gini index. In addition, the other measures, i.e., information gain and gain ratio, depicted similar characteristics. We can see the features sorted in descending order with respect to the Gini index referring to the most robust features (candidates) for performance analysis of ensemble classification models and other classifiers.
Furthermore, we validated the feature selection using central data tendency measures as shown in
Figure 8.
Figure 8 is a high-resolution figure prepared at 600 pixels per inch. It may be zoomed in to view the contents.
Figure 8 presents an exponential number format which can be read as follows, the subsequent signed number (either plus or minus) succeeding “e” is raised to the power of 10, for instance number 8 × 10
−3 will be read as 8 × 10
−3. The central data tendency measure gives the data distribution with respect to mean, mode, and median. It also glimpses the data dispersion, minimum, maximum, and missing values (if any) in certain features. We can validate the chosen strongest candidates concerning variance in the data and their distance from the mean. This gives us a second opinion regarding the selection of better candidate features.
In addition, we also measured the relevance of features with each other as follows:
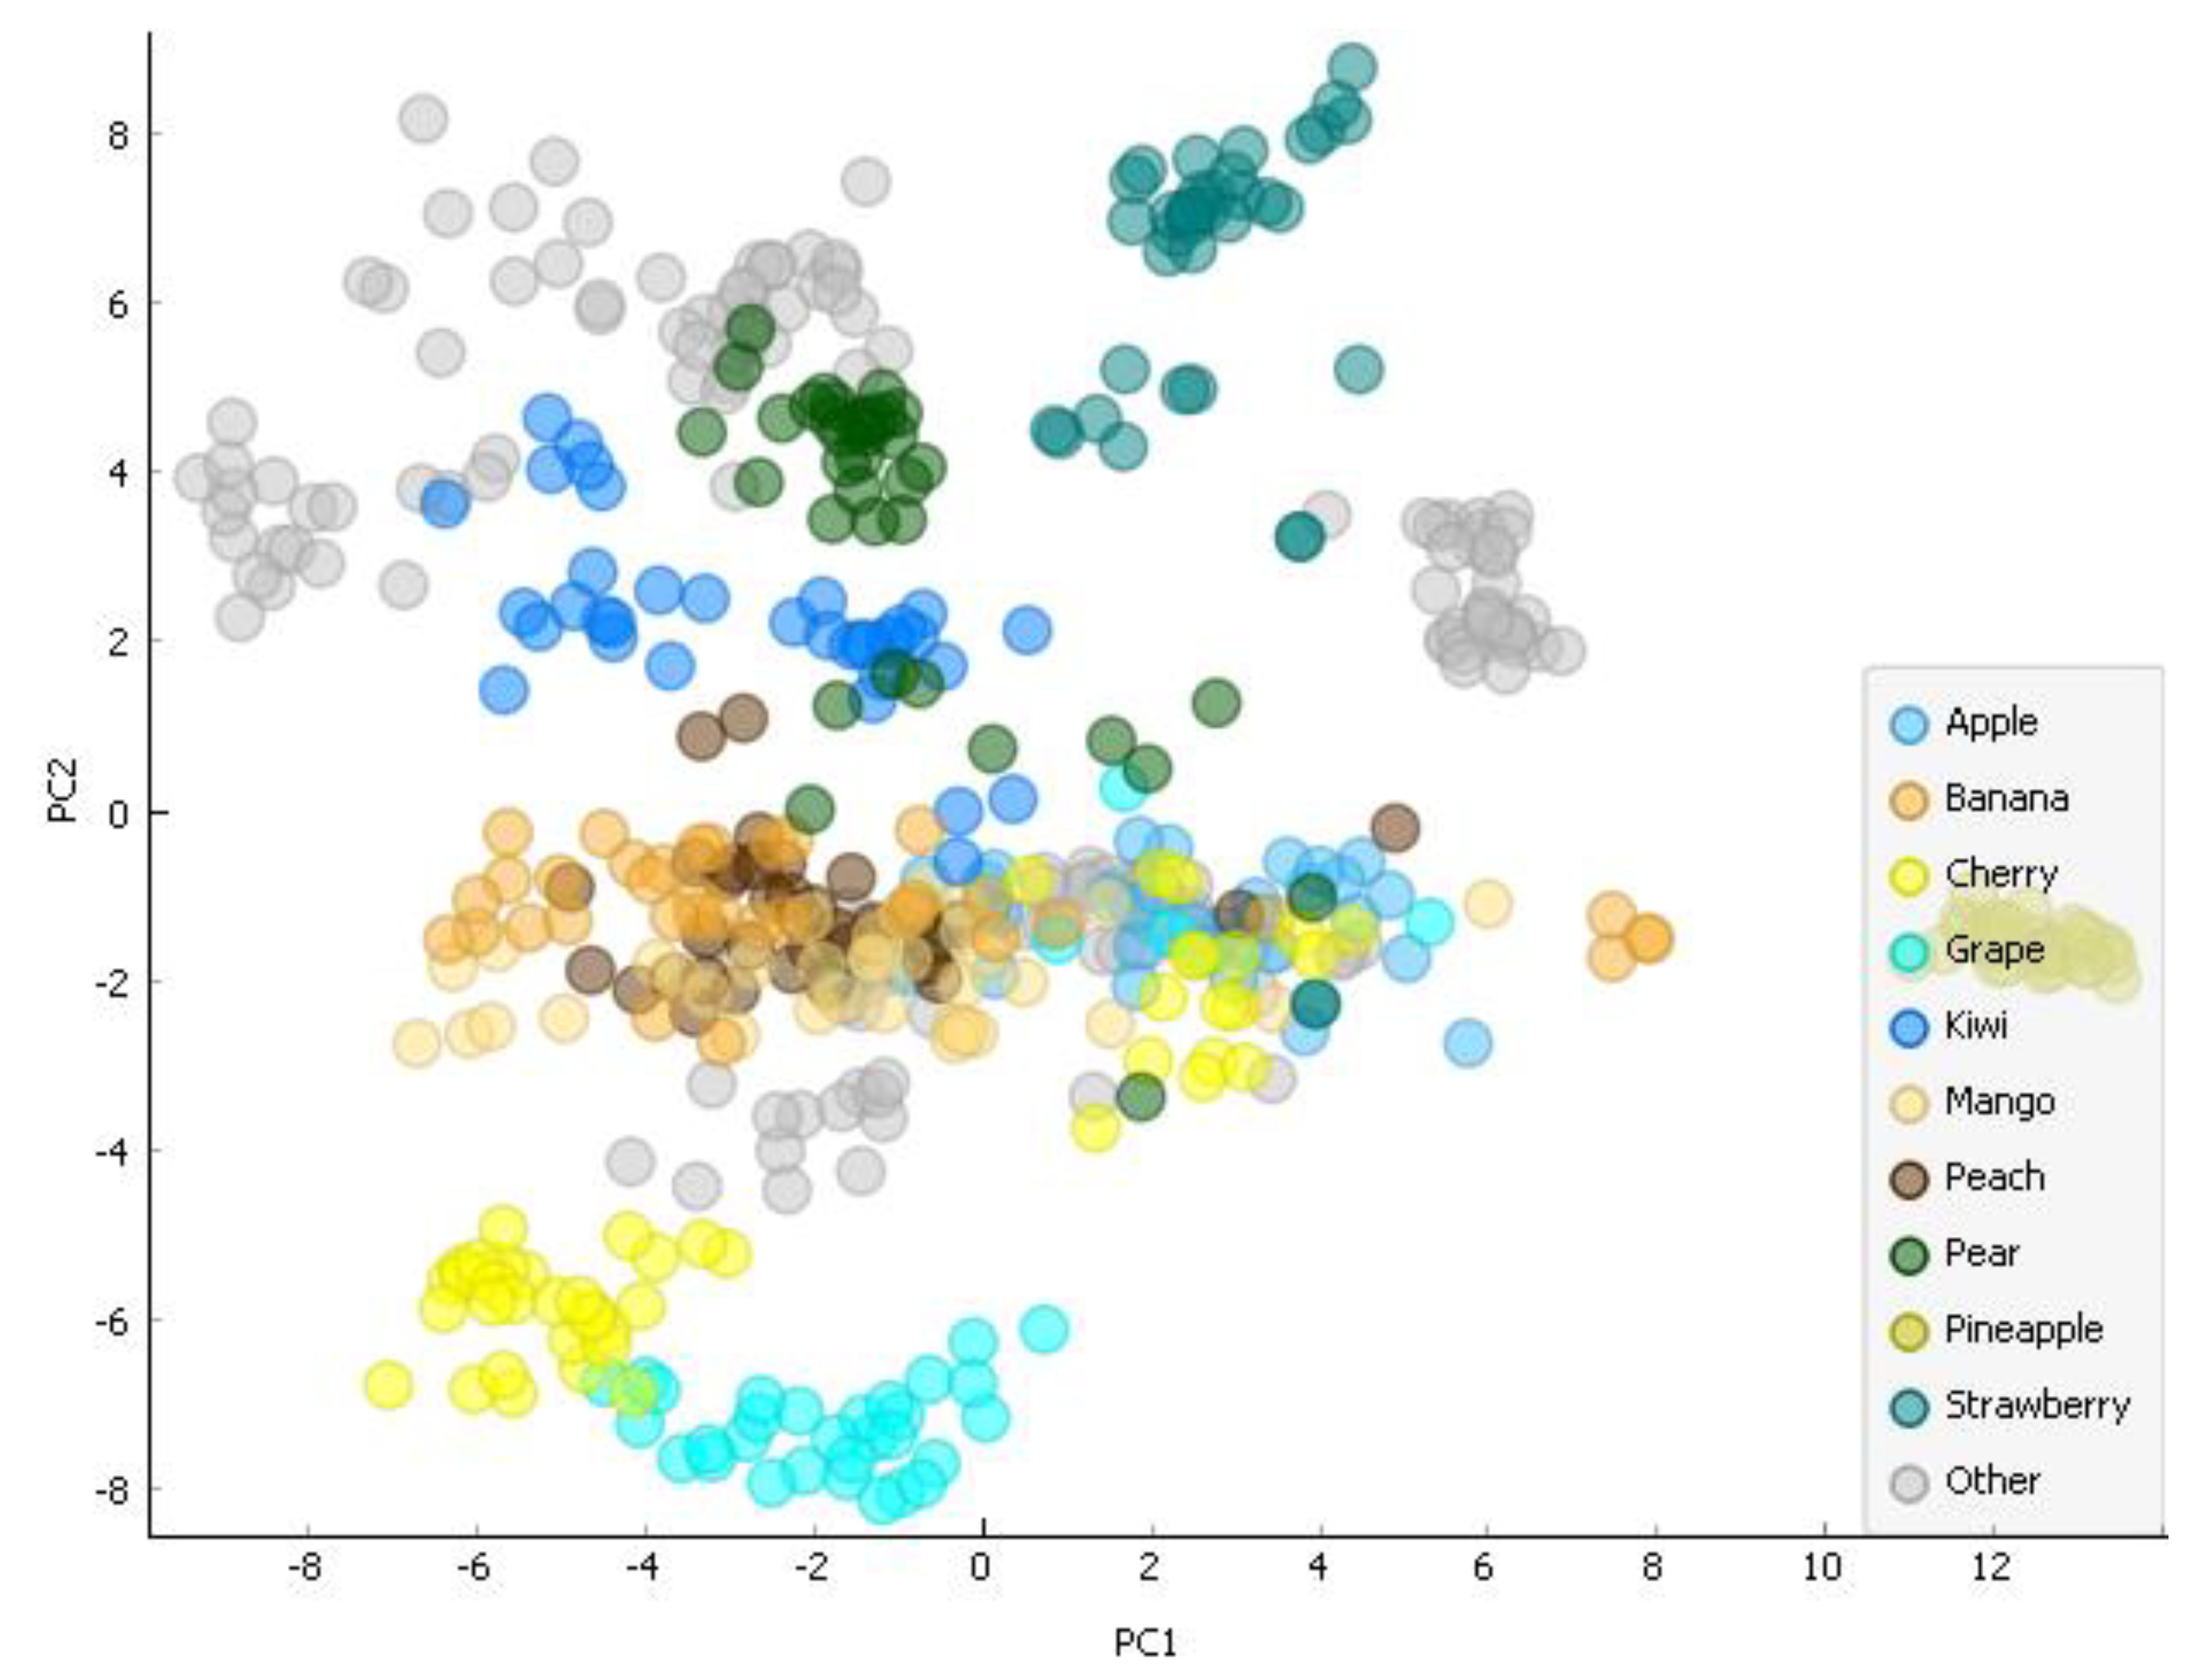
Figure 9 shows the impact between features. For instance, we can identify different fruit clusters among principal components (1) and (2). Apple and cherry fruits are well segregated, while mango, peach, pear, and strawberry overlap at certain data points of two features. This is another dimension that gives us the co-relevance among principal components to understand the dispersion of data into clusters shared by two or more principal components.
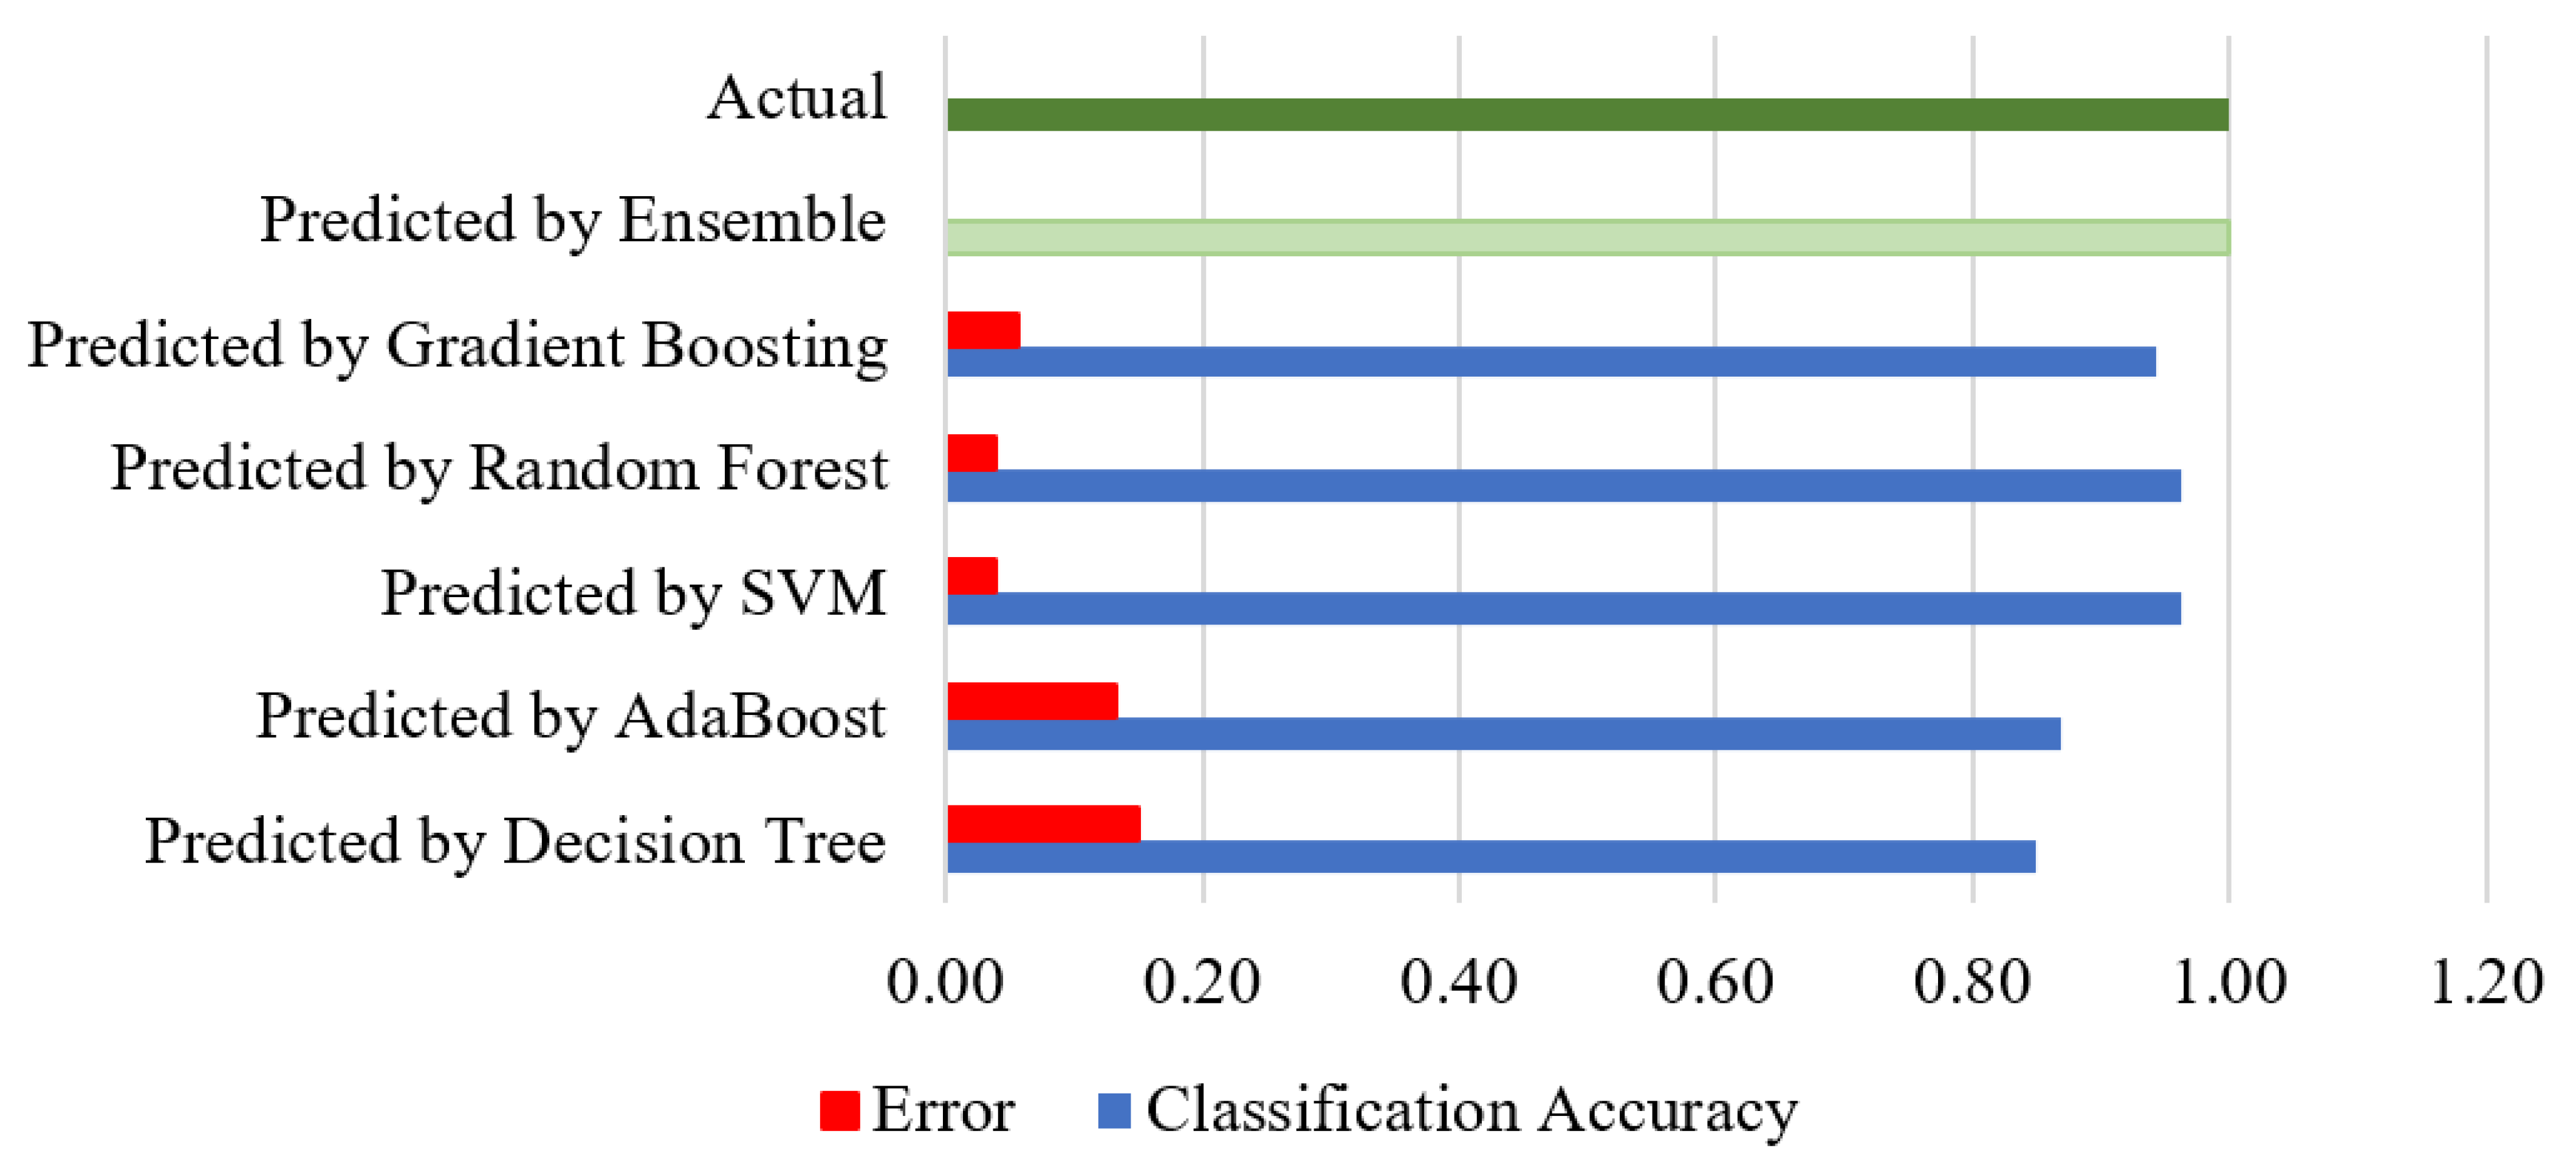
Figure 10 presents the classification accuracy and error of different classification methods. It should be noted that hyphen sign with vertical/horizontal scale represent minus sign, for instance -8 can be read as (−, 8) for clarity. The actual accuracy is represented with a green bar and the residual error with red bars. We can notice that the ensemble method has negligible (or no) errors in the correct classification of fruits. Further, the random forest and SVM classifiers show a similar residual error of 0.45. The decision tree classifier carries the highest residual error in the correct classification of fruits.
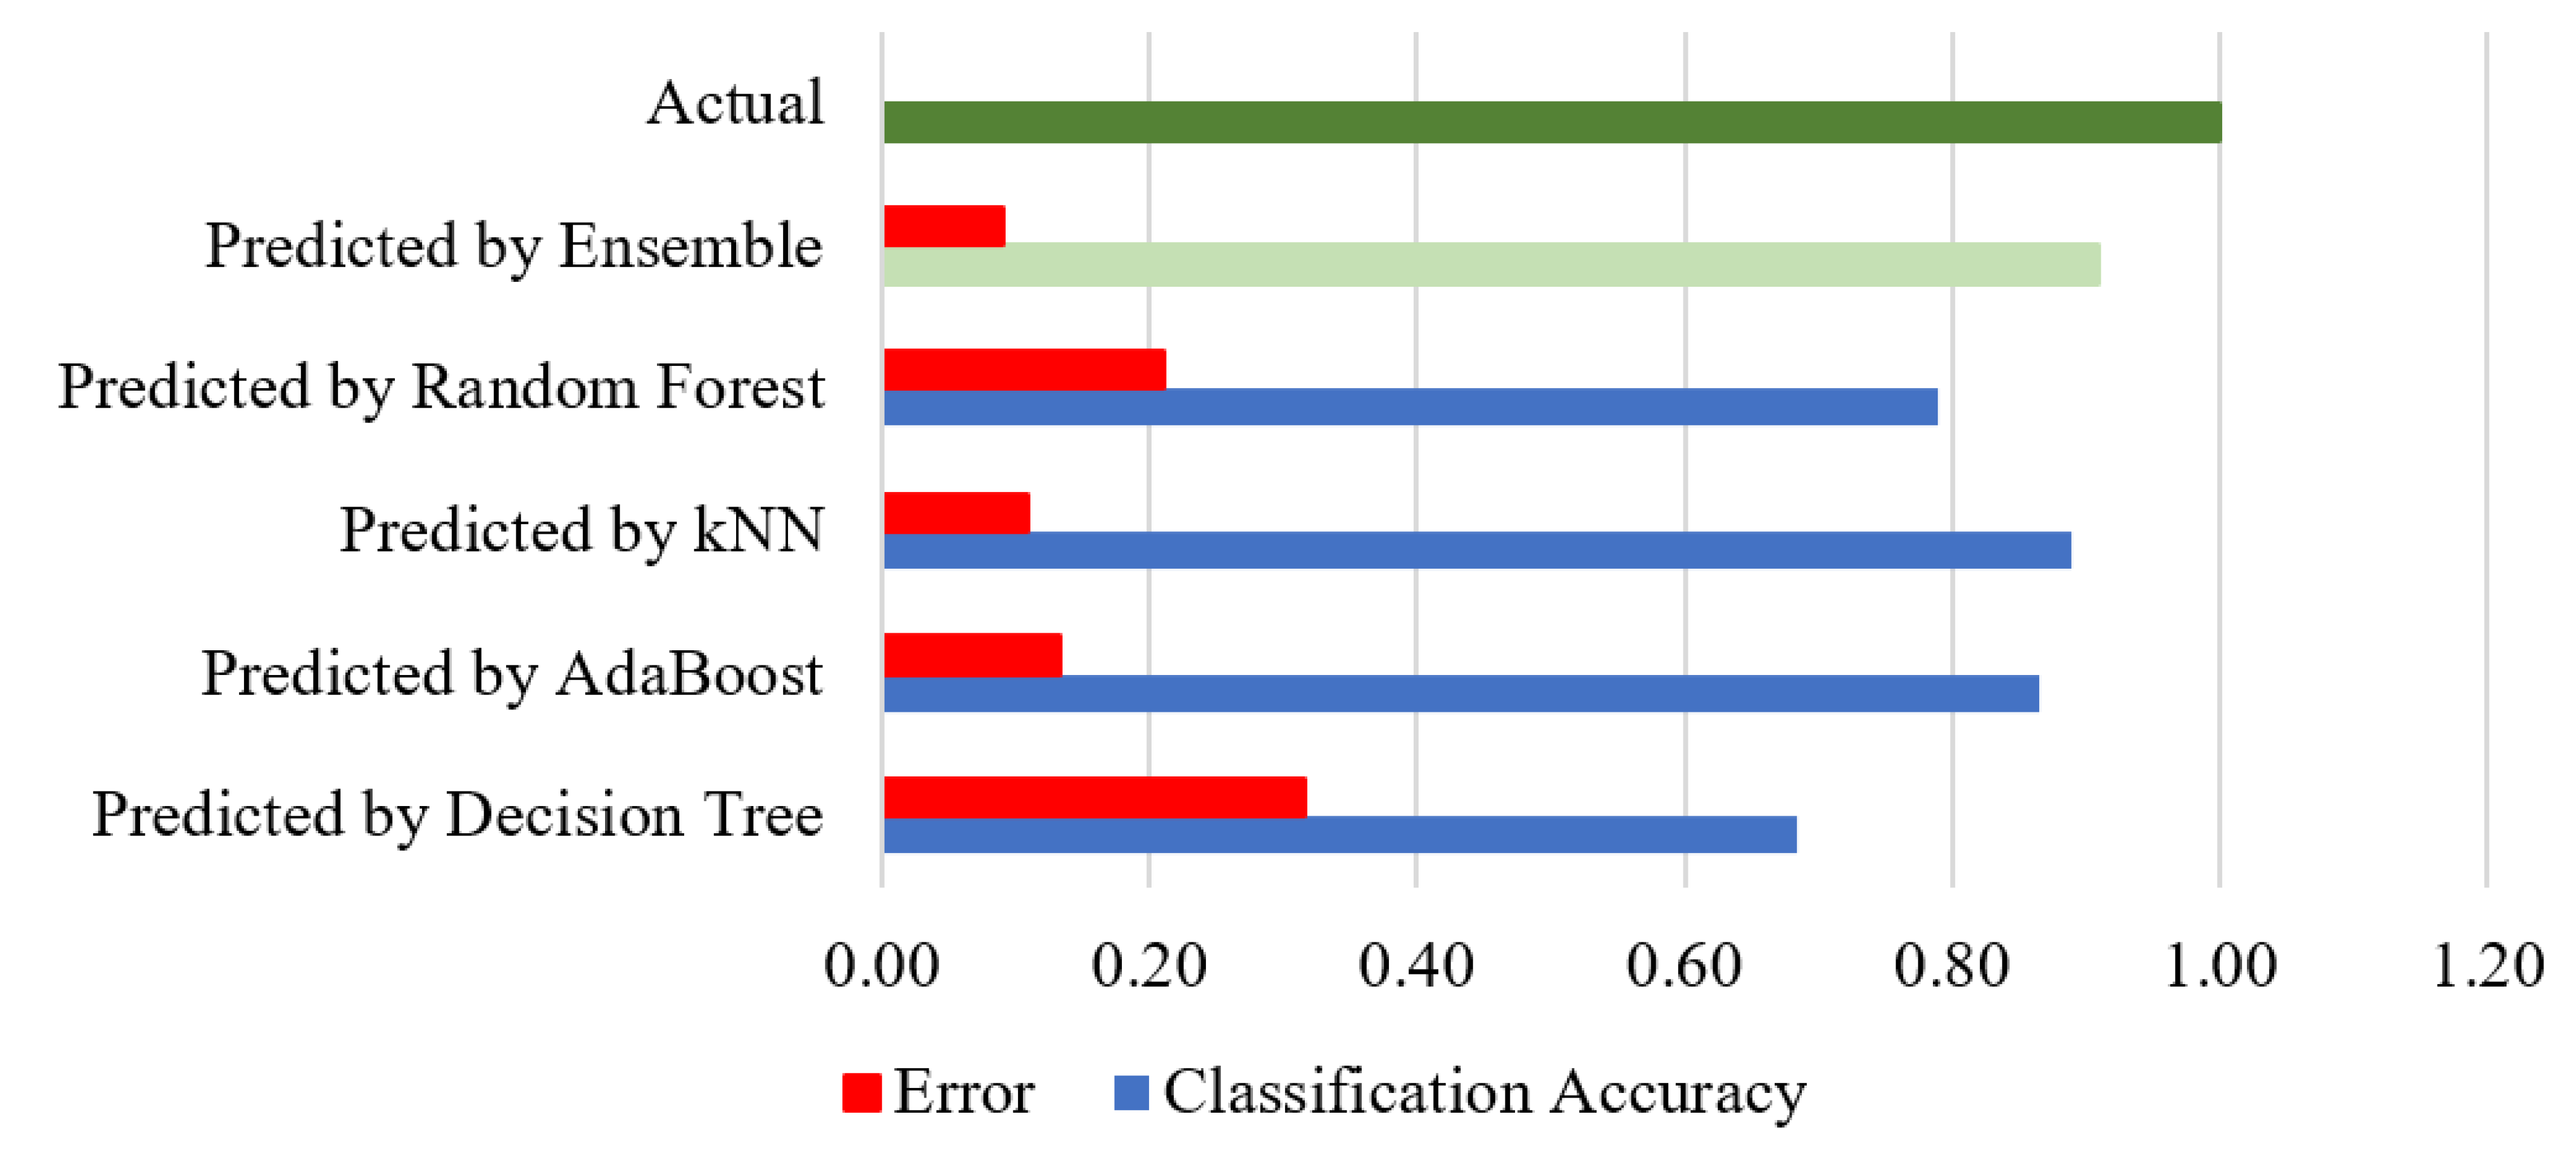
Figure 11 shows the classification accuracy and error of methods for fruit disease identification. The decision tree classifier carries the most significant residual error, while kNN and AdaBoost contain an error in an intermediate range of 0.10. The random forest algorithm shows a 0.21 error. The ensemble classifier produced the slightest error in fruit disease identification.
Further, we performed the analysis of variance (ANOVA) test on our simulated results (including both fruit classification and disease identification). ANOVA employs the F-test to investigate the variability between group means within and between the groups. We achieved the following outcomes:
In
Table 4, chosen on a 95% confidence interval (α = 0.05), the F value is 32.41, which is significantly larger than the F-critical value of 2.62, achieving a
p-value of 0.00, which is significantly smaller than 0.05.
Similarly, we performed the ANOVA test on the outcomes of SOTA methods used for feature extraction.
In
Table 5, chosen on a 95% confidence interval (α = 0.05), the F value is 11.42, which is significantly larger than the F-critical value of 2.866, achieving a
p-value of 0.00, significantly smaller than 0.05.
5. Conclusions
We proposed a hybrid ensemble classification method for fruit classification and disease identification, inspired by multilevel fusion methodology that includes intensive fruit image pre-processing, adoption of customized image kernels for feature extraction with state-of-the-art (SOTA) deep learning methods, and Gini-index-based controlled feature selection. Realizing the limitations of publicly available fruit imagery datasets regarding data sizes, variability in fruit types, quality, and diseases, we extensively aggregated and pre-processed multi-fruit data to achieve augmented images of various fruits, including apple, apricot, avocado, banana, cherry, fig, grape, guava, kiwi, mango, orange, peach, pear, pineapple, beans (two categories), strawberries (seven categories), and tomatoes (three categories). The ensemble classifier outperformed all classification methods, achieving 100% and 99% classification accuracies for fruit classification and disease identification. We validated the statistical significance of the classifiers’ outcomes at α = 0.05 and achieved F-values of 32. 41 and 11.42 against F-critical values of 2.62 and 2.86, resulting in p-values of 0.00 (<0.05) for fruit classification and disease identification. As a future work direction, we consider implementing the hybrid ensemble algorithm to embedded devices for remote classification of image sensory data. Another limitation of the study regards multiple simultaneous diseases in a fruit. New data sets need to be developed to test the performance of our approach for such instances.


