Article

Modelling Vineyard Spraying by Precisely Assessing the Duty Cycles of a Blast Sprayer Controlled by Pulse-Width-Modulated Nozzles

Departamento de Ingeniería Rural y Agroalimentaria, Universitat Politècnica de València, Camino de Vera s/n, 46022 Valencia, Spain
*
Author to whom correspondence should be addressed.
Agriculture 2023, 13(2), 499; https://doi.org/10.3390/agriculture13020499
Submission received: 20 January 2023 / Revised: 7 February 2023 / Accepted: 17 February 2023 / Published: 20 February 2023
(This article belongs to the Section Agricultural Technology)

Abstract

:
The flowrate control of spraying systems with pulse-width-modulated solenoid valves is currently being implemented for precision herbicide application in commodity crops, but solutions for fruit trees set in orchards that require higher pressures are mostly in the development stage. A reason for this has been the higher flowrate and pressure requirements of blast sprayers used for dense canopies typical of high value crops. In the present study, the duty cycles preset by an operator were compared to the actual ones estimated from measuring flowrates. A new developed air-assisted orchard sprayer with shelf hollow disc-cone nozzles was studied, such that flowrates and pressures were registered by a computer for different duty cycles commanded by an operator from 10% to 100% in intervals of 10%. In addition to sensor data, visual assessment was carried out via high-speed video images. The results showed that preset duty cycles were always more than 10% lower than the actual DC estimated from measured flowrates. The effective operational range of the duty cycles went from 20% to 80%. In general, the deviations in transitional periods were higher for lower duty cycles, being difficult to determine the real reduction in flowrate during the transition periods. A correction model has been proposed to adjust the preset duty cycles to make sure that the necessary spray flowrate is released as precisely commanded by prescription maps. Further research will be needed to verify the proper implementation of the developed correction model in field applications.

Graphical Abstract

1. Introduction

For many decades, pesticides have been widely used in agriculture to control crop natural hazards and provide an adequate food supply for people and high-quality food products [1,2]. However, pesticides can also contaminate the environment through soils, water, or air [3,4], and their exposure can negatively affect human health [5,6]. For these reasons, different mitigation strategies have been addressed to reduce pesticide spray drift and minimize its negative effects [7,8,9]. In this line, precision spraying based on variable spraying techniques has been proposed as a useful practice to improve the application of pesticides and reduce their negative effect on humans and the environment [10,11,12,13]. In fruit crops, precision spraying is based on variable rate spraying (VRS) according to information about the size, shape, structure, and density of the tree canopy obtained from sensors as cameras, ultrasound, and lasers [14,15,16,17]. Conventional air blast sprayers can waste more than 50% of pesticides with spray applications based on broadcast spraying when the application rate is calculated from the number of rows and the average tree spacing [18]. Precision spraying could reduce losses by adjusting the application of the spray to tree canopy data information in real-time. The variable response of sprayers must apply the precise dose required at each location at a given instant [19]. This combination of dose, time and location is determined by a spray volume model based on different parameters such as working area, leaf wall height related to the tree height or tree row volume. Nozzle flowrate control can be executed in practice with pulse-width-modulation solenoid valves (PWM) that facilitate electronic control via computers. In particular, PWM technology modifies the nozzle flowrate by varying the duty cycle of electronically actuated solenoid valves placed at the nozzle position [20]. PWM systems can vary the flowrate maintaining the pressure constant, and therefore keeping the droplet size uniform during spray applications within reasonable ranges. However, significant variations in flowrate and droplet size have been reported for these systems. Previous authors such as [21] have related the droplet size distribution and nozzle tip pressure to the PWM duty cycle (DC), nozzle type, and gauge pressure, in experiments conducted in a low-speed wind tunnel. Other authors [22] also found out droplet size differences without using water-sensitive cards in field tests, suggesting nozzles capable of providing the target droplet size in a wide range of pressures to improve uniformity. Ref. [23] measured the droplet size distribution of five different disc-core nozzles with a laser imaging system for DC from 10 percent to 100 percent at 10 percent intervals, and operating pressures of 276, 414, 552, 689, and 827 kPa, finding that smaller nozzles showed lower changes in pressure, flowrate, spray angle and volumetric diameters as DC decreased and nozzle tip pressure increased. Further studies [24] tested different hollow-cone nozzles in a PWM system, yielding different relations between volumetric fractions, DC, and pressure. In order to characterize PWM nozzles under laboratory conditions, ref. [25] modified a commercial blast sprayer. The actual flowrate measured for each DC was lower than the rate expected according to the actuation percentage of the solenoid valve. High speed video recordings confirmed a transitory behavior. Nozzle activation above 10 Hz was studied by [26]. Significant differences in flowrate were reported among different PWM valves due to their differences in design. In order to assess the spraying characteristics of PWM nozzles, ref. [27] carried laboratory tests to study the effect of DC on flowrates, upstream and downstream pressures, and the spray angles. In general, the expected flowrates were greater than the measured flowrates for all the duty cycles, with differences in flowrate depending on the type of PWM valve tested. Overall, the flowrates proportionally decreased with the DC, although the flowrates did not change from 100% to 90%. The objective of this study is the evaluation of the spraying performance of PMW nozzles according to their actuating duty cycle for a commercial air-assisted vineyard sprayer. The study focuses on the divergence between the commanded DC and expected flowrate as measured by a turbine-type flowmeter installed in the main pressure line, as well as on the effect of pulsing technology on system pressure, as necessary stages towards the practical implementation of PWM valves in blast sprayers demanding higher flowrates and pressures than conventional boom sprayers where PWM technology is already in use.

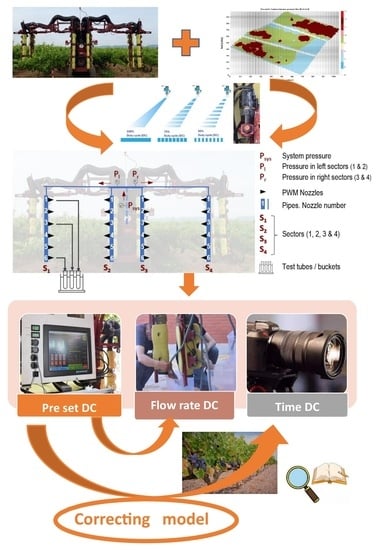
2. Materials and Methods

A newly developed air-assisted vineyard sprayer designed to host 24 solenoid shutoff valves (115880 e-ChemSaver, TeeJet Technologies, Glendale Heights, IL, USA), but keeping its default hollow disc-cone nozzles (ALBUZ® ATI 80°, Solcera, Évreux, France), with a nozzle manufacturer’s recommended pressure of 1000 kPa, was analyzed in static laboratory conditions as depicted in Figure 1. Over the characterization tests, actual flowrates and system pressures at various points of the hydraulic circuit were measured for a set of preset DC, ranging from 10% to 100% in intervals of 10%. As the DC is the percentage of time within one cycle (fraction of one period) that the valve remains open, for the period of 0.1 s used in the sprayer (10 Hz), a DC of 20 percent means that the nozzle is spraying 20% of the 0.1 s period, that is, for 0.02 s. Figure 2 shows the main sensors implemented in the sprayer for monitoring spraying actuation in real time.
Even though the tests were conducted in static conditions, the four sprayer arms were unfolded as shown in Figure 1. The labeling of the sectors and nozzles follows the schematic of Figure 3, being measurements taken from sector 1 and nozzles 1, 3, and 6, assuming symmetry for the rest of the sectors and nozzles. Nevertheless, all the sectors and nozzles were open for the machine to spray at the highest flowrate and thus mimic real conditions. The overall flowrate of the system was measured with a turbine-type digital flowmeter (FT-08NEXWULEE-5, FTI Flow Technology Inc., Tempe, AZ, USA). Due to its relevance, the flow pressure was monitored at three points in the sprayer’s hydraulic circuit for each DC setting: the overall pressure in the system (P s y s ) before the left-right flow division, the pressure at the entry of sectors S 1 and S 2 (P l ), and the pressure at the entry of sectors S 3 and S 4 (P r ). The system pressure (P s y s ), as well as the pressure for the left (P l ) and right arms (P r ), were measured with the digital manometers (1600B, Gems Sensors and Controls, Plainville, CT, USA) of Figure 2 connected to the sprayer computer (Figure 1), so that the pressure was permanently recorded and saved in a text file together with flowrates and DC settings. Either buckets or 2-Liter test tubes were used to collect water from nozzles 1, 3, and 6 as depicted in Figure 3. The actual flowrates sprayed by individual nozzles were estimated by weighting the water sprayed per given periods of time determined with a handheld chronometer and a digital balance (Platform Scale PCE-EP 150P1, PCE Instruments (PCE Ibérica S.L.), Albacete, Spain). The flowrate of each nozzle was calculated in L · min 1 considering a water density of 1 L · kg 1 , the weight of each bucket of 0.51 kg, and the weight of each test tube of 0.47 kg. A high-speed digital color video camera (CASIO EX-F1, Tokyo, Japan) recorded the spraying of nozzle 1 during the tests at a rate of 300 frames · s 1 , allowing the analysis of individual frames (Windows Movie Maker, Seattle, WA, USA).
Three flowrates were assessed: flowrate measured weighting the water per time (Q m ), flowrate registered with the flowrate sensor and theoretical flowrate (Q n o z z l e ) calculated with P l in sector S 1 . For this analysis, the concept of duty cycle was expanded to acknowledge four ways of defining or assessing it:
  • Preset DC: The duty cycle selected by the user and manually commanded through the computer for each experiment;
  • Theoretical R t h : The ratio between the measured (actual) flowrate and the theoretical flowrate calculated from the nozzle manufacture’s catalogue for the pressure registered in the experiments;
  • Flow-based R q : The ratio between the measured flowrate (actual) of a selected nozzle at a certain DC and the maximum average flowrate measured (actual) in the tests for 100% DC;
  • Time-based DC t : The DC calculated as the proportion of the signal cycle in which the solenoid remains activated as determined from the analysis of high-speed video frames.

3. Results

3.1. Measured Flowrate

In general, the measured nozzle flowrates for the different DC (ranging from 0.1136 to 0.5015 L · min 1 ) were higher than the theoretical flowrate calculated from the manufacturer tables for the registered pressure (Q n o z z l e ), with the registered pressures oscillating from 470 to 630 kPa. However, a strong linear relation was found (R 2 = 94.7, standard error of estimation (SEE) = 0.02975) between them, as shown in Equation (1) and Figure 4, where Q n o z z l e is the theoretical flowrate calculated from the manufacturer tables for the registered pressure and Q m is the flowrate measured weighting of the water per time.
Q m ( L · min 1 ) = 0.0715 + 1.7657 × Q n o z z l e ( L · min 1 )
The measured flowrate calculated directly from the nozzles with buckets was more than 1.75 times higher than the expected theoretical flowrate value calculated with the quadratic relationship between the flowrate and P l pressure for the type of nozzle used according to the nozzle manufacturer, see Figure 4. This result confirms the existence of a deviation between the pressure measured in various circuit points and the actual pressure drop at the exact position of the nozzle, which is the real pressure forming the droplets and yielding the flowrate as formulated by the theoretical orifice equation.
Using the proposed Equation (1) and the information from the nozzle manufacture’s catalog for flowrate based on the the pressure registered, an equation relating the measured flowrate (Q m ), the registered pressure (P l and the preset DC is proposed (Equation (2))).
Q m ( L · min 1 ) = ( 0.0094 × P L ( kPa ) 2 + 0.0634 × P L ( kPa ) + 0.3225 ) × D C 100
A significant effect of the factor DC set up from the sprayer computer (preset DC) on the measured flowrate (p value = 10 4 ) was found, see Table 1. The measured flowrate increased when the preset DC increased, following the curve of Figure 5. The relation between the measured flowrate and the theoretical flowrate did not follow a linear pattern; it followed a sigmoidal type pattern (root square of x (R 2 = 95.28%)), probably due to the delay in the opening and closing of the solenoid valve. According to the Duncan’s multiple range test, no significant differences were found among the DC of 80%, 90%, and 100%, confirming the visual result perceived during the tests, by which, for DC above 80%, the nozzles were fully opened, giving the maximum possible flowrate. As a result, DC settings above 80% are equivalent to the maximum flowrate for the solenoid valves, and no pulsing effect is noticeable, reproducing, therefore, the behavior of conventional sprayers. In the same line, duty cycles of 20% and 30% did not present significantly different values in the flowrate, although Figure 5 registered higher differences in the flowrate.
Considering that the real flowrate was significantly higher than the expected one determined by the preset DC commanded electronically through the sprayer computer, a duty cycle correcting equation should be proposed for the practical implementation of the system in the field, mainly for the automated application of prescription maps.

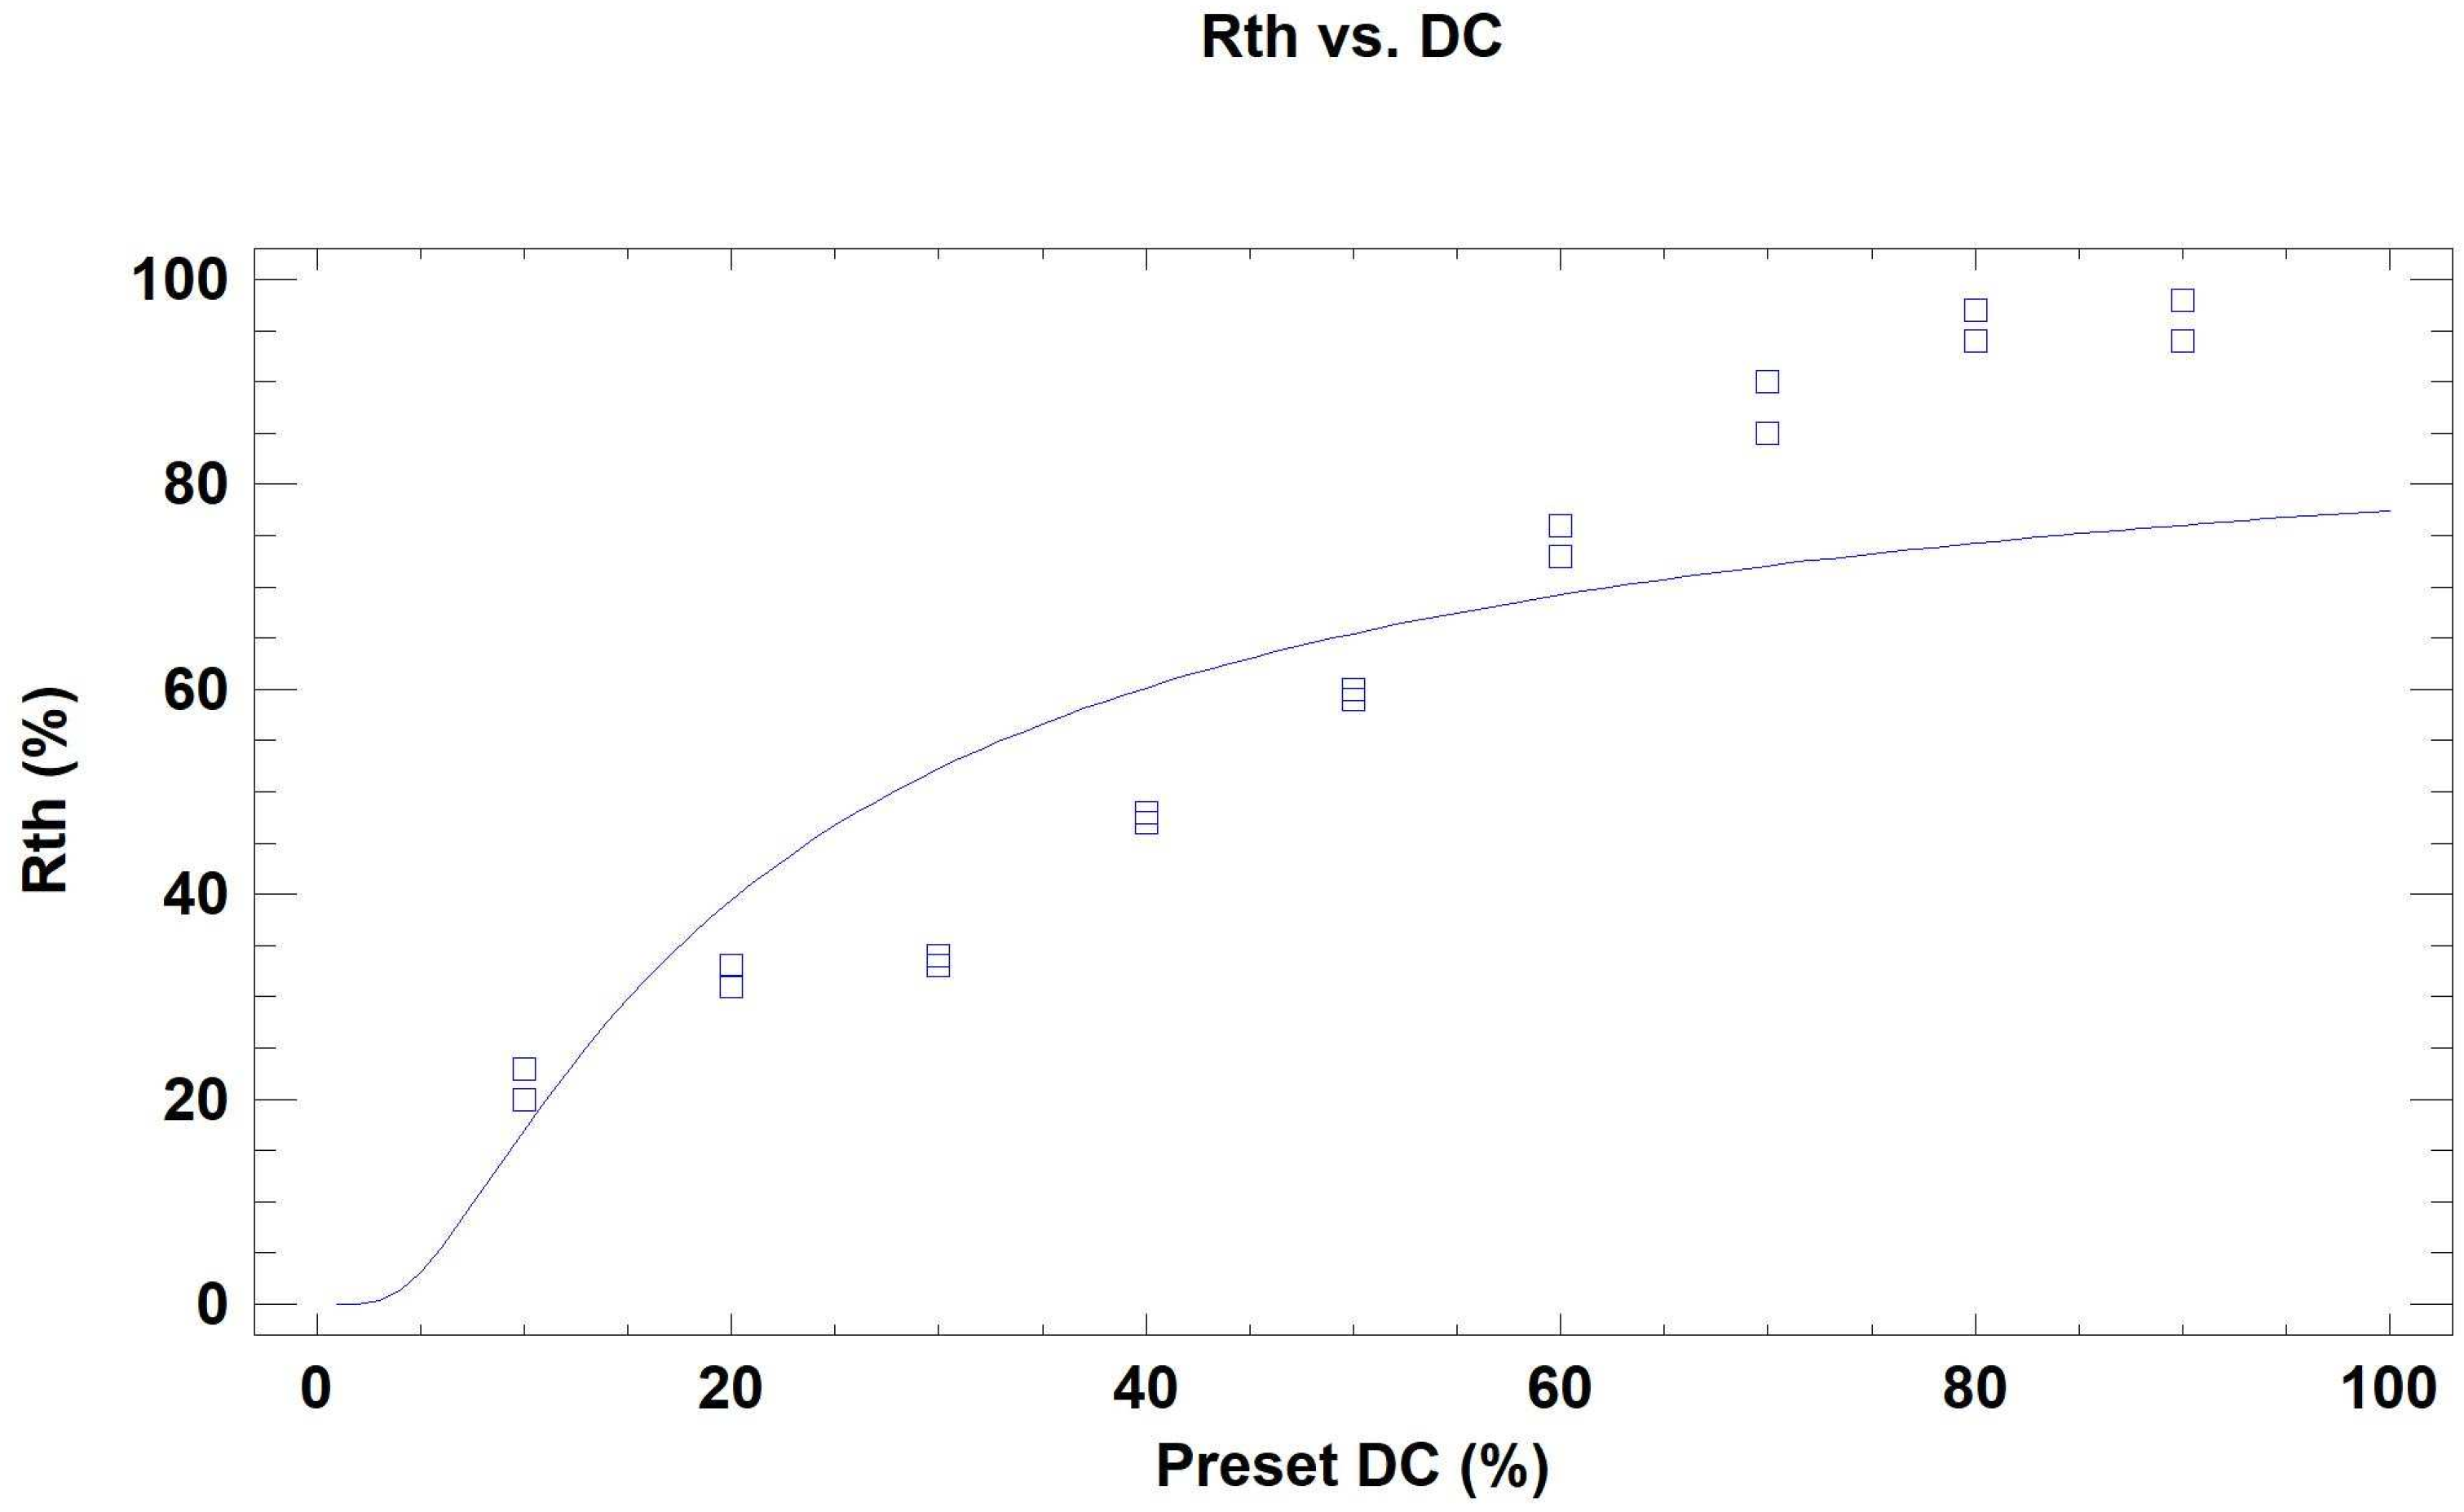
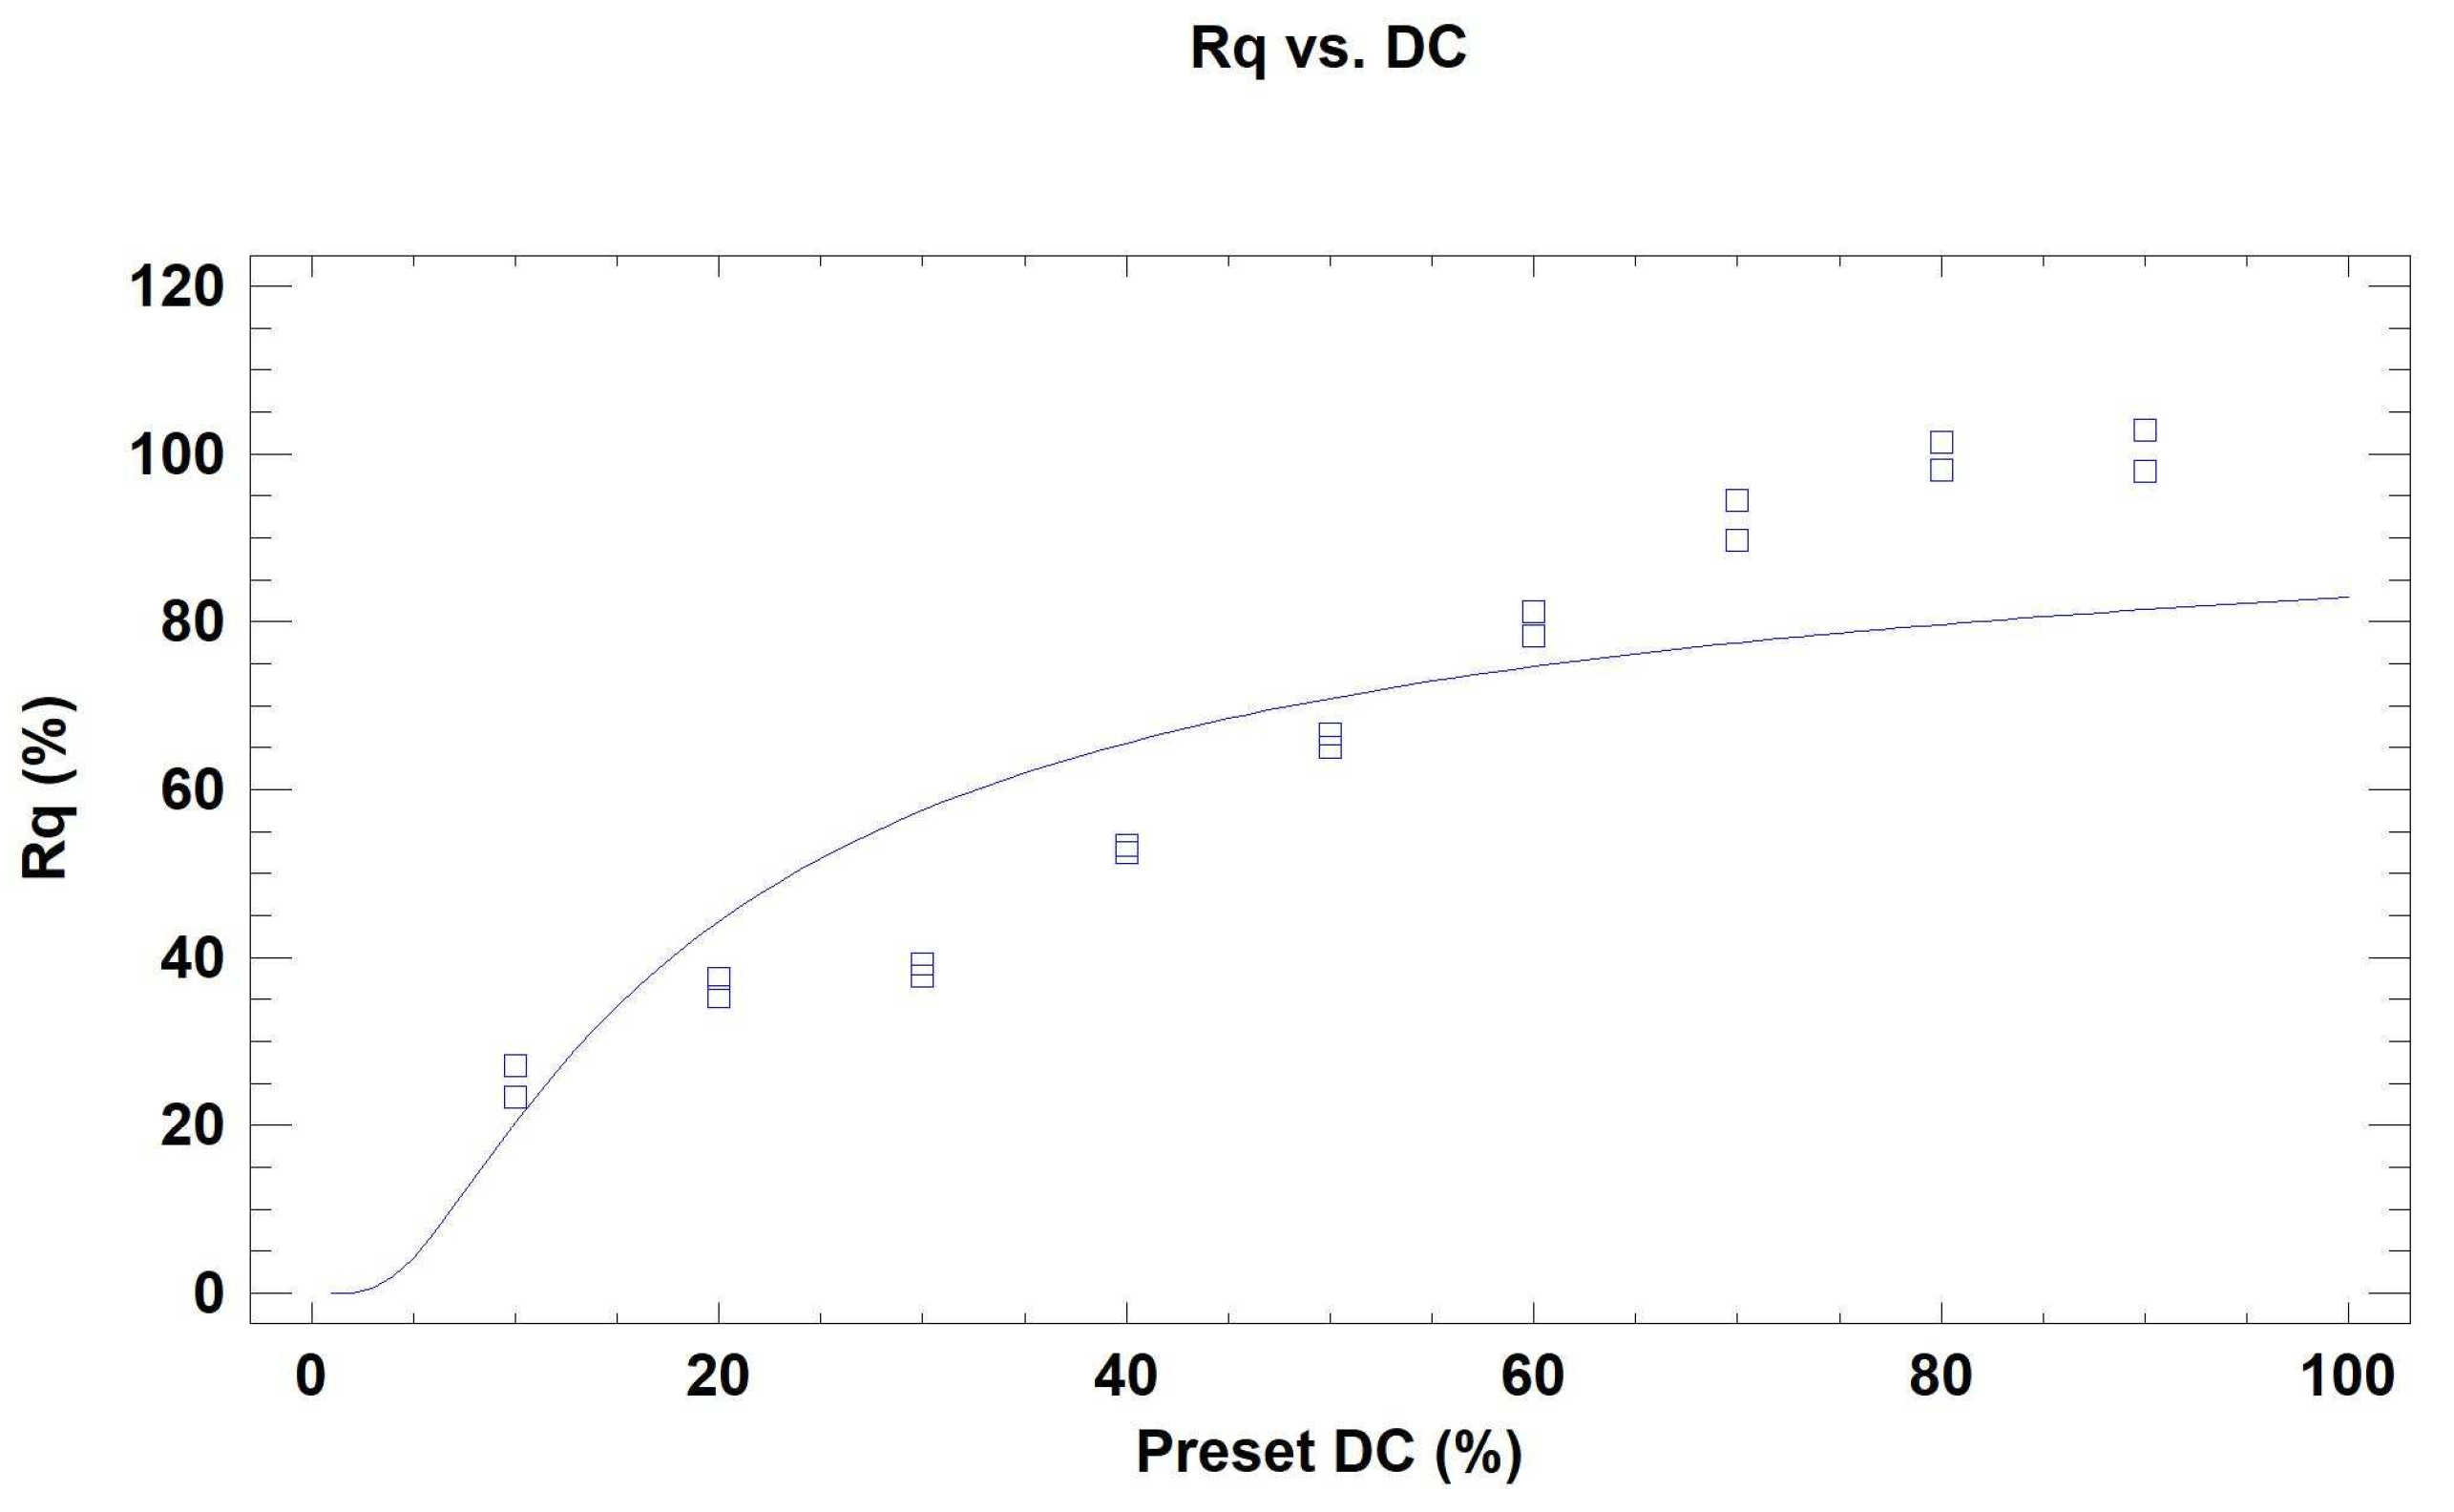
3.2. DC Corrected According to the Maximum Flowrate

Two different procedures were followed to adapt the interpretation of preset DC to the actual performance of the sprayer in the vineyard. In a first step, a corrected ratio was defined (theoretical ratio, R t h , %) as the proportion of the lab-measured flowrate to the theoretical flowrate taken from the manufacturer’s catalog for a given pressure. The sigmoidal relation between the preset DC and R t h is shown in Figure 6 (R 2 = 77.74%) and Equation (3), where DC is the preset duty cycle and R t h is the theoretical ratio between the measured (actual) flowrate and the theoretical flowrate calculated from the nozzle.
R t h = e 4.52 16.87 D C
(For DC between 0% and 100%)
The R t h differed from the preset DC from the sprayer computer. As Figure 6 indicates, a preset DC value of 10% corresponds to a R t h of 23%. That meant that the nozzles did not comply with the preset DC of 10%, but with operative ranges of 20% or above. In the upper limit of the DC range corresponding to fully opened nozzles, most nozzles were practically fully open for a preset DC of 80% and above.
In a second step, the measured flowrates at the different DC were compared to the measured flowrates for 100% DC. The flowrates measured for 80%, 90% and 100% preset DC, those with no significant differences according to the Duncan test, were considered. In this model, the average value was assumed to be the maximum theoretical DC (100%), being the rest of the ratios obtained as the proportion of the flowrate to the average maximum flowrate (R q , %). The sigmoidal relation between the preset DC and R q is shown in Figure 7 (R 2 = 78.52%) and specified in Equation (4), where DC is the preset duty cycle and R q is the flow-based ratio between the measured flowrate (actual) of a selected nozzle at a certain DC and the maximum average flowrate meassured (actual) in the tests for 100% DC.
R q = e 4.57 15.64 D C
(For DC between 0% and 100%)
Once again, the preset DC and R q differed. As Figure 7 indicates, R q showed higher values than the preset DC values and higher than theoretical ratio (R t h ). These results confirm that the nozzles did not open for the preset DC of 10%, but with operative ranges of 20% or above. In the upper limit of the DC range, the nozzles were almost fully open for a preset DC of 80% and above. In conclusion, the effective operational range for the preset DC goes from 20% to 80%. The solenoid valves follow a sigmoidal behavior, with low values for low DC (between 0% to 20%), linear response for intermediate values (between 20% and 80%) and constant values for higher DC (higher than 80%). Such a range was implemented in the sprayer control program for automatic operations of smart spraying according to a prescription map for vineyards.

3.3. Time-Based DC According to Video Frame Timestamps

To further understand how the opening and closing of the spraying valves was carried out during the nozzle activation cycles, high-speed video recording images were recorded for nozzle 1 (Figure 8) for various preset DC. Two complete periods of the wave signal were analyzed: the period between non-spraying (deactivation) and full spraying time (solenoid opening) and the time period between spraying and non-spraying time (solenoid valve closing). Two different transitional sub-periods were found for the opening operation, whereas one sub-period was found for the closing actuation. Figure 8 provides several high-speed images for the opening and closing operations of the solenoid valves.
The video photograms were classified in three categories: full-rate spraying (valve fully opened), non-spraying time (valve closed) and intermediate flowrate (regular spraying). Three parameters were defined as the spraying time (t s ), the non-spraying time (t n ) and the transitional time (t t ). In Figure 9, the square waves representing the activation of the valves for the different preset DC cycles deduced from high-speed video frames are detailed.
Figure 10 shows the valve actuation times (s) deduced from high-speed video frames according to the preset DC (%). The spraying time (t s ) increases as the preset DC increases, while the non-spraying time (t n ) decreases as the preset DC decreases. The transitional time (t t ) seems to be higher for the lower DC, but the variability is high. The total time (spraying time (t s ) + transitional time (t t ) + non-spraying time (t n )) is equal to the cycle time, 0.1 s. In order to better understand the solenoid valve dynamics, a multiple regression model was built to explain the measured flowrate (Q m ) according to the time lapses extracted from the high-speed video recording (R 2 = 91.3%, standard error of estimation (SEE) = 0.04189), the correlation found was high, as plotted in Figure 11 and mathematically expressed in Equation (5), where Q m is the flowrate measured weighting the water per time, t s is the spraying time, t n is the non-spraying time and t t is the transitional time.
Q m ( L · min 1 ) = 0.4049 + 0.0101 × t s 0.0611 × t n 0.0363 × t t ,
The relation of Equation (5) shows the non-trivial influence of the transitory time during activation and deactivation, determining the actual flowrates applied during the preset DC. Based on the previous results, in order to obtain the time-based DC (DC t , %), the following Equation (6) was established, which estimates that the spraying flowrate during the transitory period is 10% of the total spraying flowrate, where DC t is the time-based DC calculated as the proportion of the signal cycle in which the solenoid remains activated as determined from the analysis of high-speed video frames, t s is the spraying time, t n is the non-spraying time and t t is the transitional time.
D C t = t s + 0.1 × t t t s + t n + t t × 100 ,
The sigmoidal relation between the preset DC and the time-based DC (DC t (%)) is shown in Figure 12 (R 2 = 98.03%) and specified in Equation (7), where DC is the preset duty cycle and DC t is the time-based DC, calculated as the proportion of the signal cycle in which the solenoid remains activated as determined from the analysis of high-speed video frames.
D C t = e 4.61 17.60 D C
(For DC between 0% and 100%)
The analysis of high-speed video images showed that the preset DC set up from the sprayer computer was lower than the time-based DC (DC t ), coinciding with the results found with R t h and R q . The differences in DC t compared to R t h and R q could be due to the difficulty in determining the real flowrate reduction in the transitory periods depending on the preset DC. In general, the transitory periods were longer for lower duty cycles, except for the lowest DC. On average, the transitory periods during the opening of the nozzle (activation period) were longer than the transitory periods during closing (deactivation period), although it was difficult to determine the reduction in flowrate during these transitional periods.

4. Discussion

For the analyzed vineyard sprayer, the flowrates measured at various nozzles were higher than the theoretical flowrates expected for the pressures registered along the experiments. This result contradicts the results of [24], who found that the flowrates calculated with the manufacturer tables for two types of valves were greater than the measured flowrates at all duty cycles, even though the authors reported uncertainties in the measurement of pressure due to the position of the measuring device, the load losses, or other experimental problems. Apart from these problems, it is important to consider that the nozzles used by [23,24] were mainly used for other types of treatments as herbicides with a lower recommended pressure compared to the ones used in the present study. The measured flowrates proportionally decreased with the preset DC, confirming previous results [24], but significant differences were found for DC below 80%, as the duty cycles of 80%, 90% and 100% yielded the maximum flowrate. The preset DC were lower than the ratios obtained from the percentage of the theoretical flowrate and the measured flowrate (R t h and R q ). The sigmoidal relations between DC t and the preset DC, R t h and the preset DC, and R q and the preset DC have similar patterns. The differences between R t h and R q also confirmed a significant difference between the actual flowrate and the theoretical expected one. Considering that theoretical flowrates were calculated with the registered pressures, and having detected certain discrepancies in their registration, the differences in DC and the ratio percentages (R t h and R q ) could be partially caused by the imprecision in pressure readings. The average transitory period during the opening of the nozzles (activation period) was longer than the transitory periods during closing (deactivation period). It was difficult to determine the reduction in flowrate during the transitory periods. The duty cycles calculated from the video analysis were greater than the preset duty cycles, the preset DC were lower than the actual one DC t calculated based on the spraying and non-spraying times.

5. Conclusions

The modification of conventional sprayers integrating pulsing solenoid valves as a means to control the flowrate in real time is not as straightforward as expected. Variable-rate equipment strongly relies on feedback sensors, and both electronic pressure sensors and flowmeters present erratic behaviors at the demands of alternating pulses. A 50% DC commanded by the computer was never equivalent to the 50% of the flowrate indicated by the nozzle manufacturer for the circuit pressure, due to the difficulties in measuring the key parameters flowrate and pressure pulsating flows. To begin with, pressure measurements were still alternating, and a representative pressure had to be considered to determine the rated flow. Field experience taught that the dynamics of solenoid valves coupled with nozzles are complex, and a first necessity was to reduce the DC operating range from 0–100% to 20–80%. Still, electronic commands exerted on PWM valves resulted in an instantaneous flow modification with limited changes in pressure, which is the effect sought with this technology; however, a deeper understanding and a more elaborated handling of PWM control via DC will be necessary for efficient spraying. This paper addressed this necessity for a vineyard sprayer requiring spray rates between 6 L·min 1 and 12 L·min 1 . A divergence between the preset DC sent to the computer and the actual DC executed by the solenoids was detected as a result of valve inertia and flow shocks in the opening and closing at 10 Hz, the actual DC being higher than the preset ones. In general, the transitory periods were longer for lower duty cycles, and it was difficult to determine the reduction in flowrate during the transition stage. As a result, the real DC required in the field will need to be adjusted by the sprayer control system to make sure that the necessary flowrate is sprayed as commanded by the prescription map loaded in the sprayer.

6. Further Work

A previous correction model has been proposed in this paper to determine the actual duty cycle adjusted to measured flowrates. However, the established model has been developed for certain experimental conditions. Further research will be necessary to validate the proposed correction model in the real application of prescription maps to commercial vineyards.

Author Contributions

Conceptualization F.R.-M. and M.P.; methodology, V.S.-R., A.C. and M.P.; software, V.S.-R. and F.R.-M.; validation, C.O., M.P. and A.T.; formal analysis, C.O., A.T. and E.O.; investigation, V.S.-R., C.O., A.T., M.P. and A.C. and F.R.-M.; resources, C.O., A.T. and F.R.-M.; data curation, C.O. and A.T.; writing—original draft preparation, C.O.; writing—review and editing, C.O., A.T. and F.R.-M.; visualization, E.O., A.T. and V.S.-R.; supervision, V.S.-R., A.T., C.O. and F.R.-M.; project administration, F.R.-M.; funding acquisition, F.R.-M. All authors have read and agreed to the published version of the manuscript.

Funding

This research has been funded by the Government of Spain through the Project “Smart spraying for a sustainable vineyard and olive trees” PIVOS (PID2019-104289RB).

Institutional Review Board Statement

Not applicable.

Data Availability Statement

The datasets generated during and/or analysed during the current study are available from the corresponding author on reasonable request.

Conflicts of Interest

The authors declare no conflict of interest.

References

  1. Verycruysse, F.; Steurbaut, W. POCER—The pesticide occupational and environmental riskindicator. Crop Prot. 2002, 21, 307–315. [Google Scholar] [CrossRef]
  2. Tamaro, C.M.; Smith, M.N.; Workman, T.; Grieth, W.C. Characterization of organophosphate pesticides in urine and home environment dust in an agricultural community. Biomarkers 2018, 23, 174–187. [Google Scholar] [CrossRef] [PubMed]
  3. Rasool, S.; Rasool, T.; Gani, K.M. A review of interactions of pesticides within various interfaces of intrinsic and organic residue amended soil environment. Chem. Eng. J. Adv. 2022, 11, 100301. [Google Scholar] [CrossRef]
  4. Chen, Y.; Selvinsimpson, S. Fate and Assessment of Pesticide in Aquatic Ecosystem. In Pesticides in the Natural Environment; Elsevier: Amsterdam, The Netherlands, 2022; pp. 51–63. [Google Scholar]
  5. Lan, J.; Jia, J.; Liu, A.; Yu, Z.; Zhao, Z. Pollution levels of banned and non-banned pesticides in surface sediments from the East China Sea. Mar. Poll. Bull. 2019, 139, 332–338. [Google Scholar] [CrossRef] [PubMed]
  6. Teysseire, R.; Manangama, G.; Baldi, I.; Carles, C.; Brochard, P.; Bedos, C.; Delva, F. Assessment of residential exposures to agricultural pesticides. PLoS ONE 2020, 15, e0232258. [Google Scholar] [CrossRef]
  7. Reichenberger, S.; Bach, B.; Skitschak, A.; Frede, H.G. Mitigation strategies to reduce pesticide inputs into ground- and surface water and their effectiveness; A review. Sci. Total Environ. 2007, 384, 601–613. [Google Scholar] [CrossRef]
  8. Rathnayake, A.P.; Khot, L.R.; Hoheisel, G.A.; Thistle, H.W.; Teske, M.E.; Willett, M.J. Downwind spray drift assessment for airblast sprayer applications in a modern apple orchard system. Trans. ASABE 2021, 64, 1–35. [Google Scholar] [CrossRef]
  9. Ellis, M.C.B.; Lane, A.G.; O’Sullivan, C.M.; Jones, S. Wind tunnel investigation of the ability of drift-reducing nozzles to provide mitigation measures for bystander exposure to pesticides. Biosyst. Eng. 2021, 202, 152–164. [Google Scholar] [CrossRef]
  10. Walklate, P.J.; Cross, J.V. Regulated dose adjustment of commercial orchard spraying products. Crop Prot. 2013, 54, 65–73. [Google Scholar] [CrossRef]
  11. Song, L.; Huang, J.; Liang, X.; Yang, S.X.; Hu, W.; Tang, D. An Intelligent Multi-Sensor Variable Spray System with Chaotic Optimization and Adaptive Fuzzy Control. Sensors 2020, 20, 2954. [Google Scholar] [CrossRef]
  12. Bahn, R.A.; Yehya, A.A.K.; Zurayk, R. Digitalization for Sustainable Agri-Food Systems: Potential, Status, and Risks for the MENA Region. Sustainability 2021, 13, 3223. [Google Scholar] [CrossRef]
  13. Ahmed, M.; Hayat, R.; Ahmad, M.; Kheir, A.M.S.; ul-Hassan, F.; ur-Renhman, M.H.; Shaheen, F.A.; Raza, M.A.; Ahmad, A. Impact of Climate Change on Dryland Agricultural Systems: A Review of Current Status, Potentials, and Further Work Need. Int. J. Plant Prod. 2022, 16, 341–363. [Google Scholar] [CrossRef] [PubMed]
  14. Zanin, A.R.A.; Neves, D.C.; Teodoro, L.P.R.; Da Silva, C.A.; Da Silva, S.P.; Teodoro, P.E.; Rojo-Bajo, F. Reduction of pesticide application via real-time precision spraying. Scientific Report. Sci. Rep. 2021, 12, 563. [Google Scholar] [CrossRef]
  15. Wandkar, S.V.; Bhatt, Y.C.; Jain, H.K.; Nalawade, S.M.; Pawar, S.G. Real-Time Variable Rate Spraying in Orchards and Vineyards: A Review. Inst. Eng. India Ser. A 2018, 99, 385–390. [Google Scholar] [CrossRef]
  16. Abbas, I.; Liu, J.; Faheem, M.; Noor, R.N.; Shaikh, S.A.; Solangi, K.A.; Raza, S.M. Different sensor based intelligent spraying systems in Agriculture. Sens. Actuators 2020, 316, 112265. [Google Scholar] [CrossRef]
  17. Wei, Z.; Xue, X.; Salcedo, R.; Zhang, Z.; Gil, E.; Sun, Y.; Li, Q.; Shen, J.; He, Q.; Dou, Q.; et al. Key Technologies for an Orchard Variable-Rate Sprayer: Current Status and Future Prospects. Agronomy 2022, 13, 59. [Google Scholar] [CrossRef]
  18. Mahmud, M.S.; Zahid, A.; He, L.; Martin, P. Opportunities and Possibilities of Developing an Advanced Precision Spraying System for Tree Fruits. Sensors 2021, 21, 3262. [Google Scholar] [CrossRef]
  19. Gu, C.; Wang, X.; Wang, X.; Yang, F.; Zhai, C. Research progress on variable-rate spraying technology orchards. Appl. Eng. Agric. 2020, 36, 927–942. [Google Scholar] [CrossRef]
  20. Fabula, J.V.; Sharda, A.; Flippo, D.; Ciampiti, I.; Kang, Q. Boom pressure and droplet size uniformity of a pulse width modulation (PWM) spray technology. In Proceedings of the 2020 ASABE Annual International Virtual Meeting, Paper Number 2001041, ASABE Annual Meeting, Omaha, NB, USA, 12–15 July 2020; Volume 2001041. [Google Scholar] [CrossRef]
  21. Butts, T.R.; Butts, L.E.; Luck, J.D.; Fritz, B.K.; Hoffmann, W.C.; Kruger, G.R. Droplet size and nozzle tip pressure from a pulse-width modulation sprayer. Biosyst. Eng. 2019, 178, 52–69. [Google Scholar] [CrossRef] [Green Version]
  22. Fabula, J.; Sharda, A.; Kang, Q.; Flippo, D. Nozzle flow rate, pressure drop, and response time of pulse width modulation (PWM) nozzle control systems. Trans. ASABE 2021, 64, 1519–1532. [Google Scholar] [CrossRef]
  23. Salcedo, R.; Zhu, H.; Jeon, H.; Wei, Z.; Ozkan, E.; Gil, E. Characterization of volumetric droplet size distributions from PWM-controlled hollow-cone nozzles designed for variable-rate air-assisted sprayers. In Proceedings of the 2021 ASABE Annual International Virtual Meeting, Paper Number 2100038, ASABE Annual Meeting, Virtual, 12–18 July 2021; Volume 2100038. [Google Scholar] [CrossRef]
  24. Salcedo, R.; Zhu, H.; Jeon, H.; Ozkan, E.; Wei, Z.; Gil, E.; Campos, J.; Román, C. Droplet Size Distributions from Hollow-Cone Nozzles Coupled with PWM Valves. J. ASABE 2022, 65, 695–706. [Google Scholar] [CrossRef]
  25. Ortí, E.; Cuenca, A.; Pérez, M.; Torregrosa, A.; Ortiz, C.; Rovira-Más, F. Preliminary Evaluation of a Blast Sprayer Controlled by Pulse-Width-Modulated Nozzles. Sensors 2022, 22, 4924. [Google Scholar] [CrossRef] [PubMed]
  26. Campos, J.; Zhu, H.; Jeon, H.; Ozkan, E.; Salcedo, R. Evaluation of PWM solenoid valves to manipulate hollow cone nozzles operated at high pressures and frequencies. In Proceedings of the 2022 ASABE Annual International Meeting, Houston, TX, USA, 17–20 July 2022; p. 2200396. [Google Scholar]
  27. Salcedo, R.; Zhu, H.; Jeon, H.; Ozkan, E.; Wei, Z.; Gil, E. Characterisation of activation pressure, flowrate and spray angle for hollow-cone nozzles controlled by pulse width modulation. Biosyst. Eng. 2022, 218, 139–152. [Google Scholar] [CrossRef]
Figure 1. Air-assisted vineyard sprayer with hollow disc-cone nozzles and solenoid PWM valves. (a) General view. (b) Electronic control box. (c) Nozzle-valve assembly.
Agriculture 13 00499 g001
Figure 2. Sensing and measuring system for the modified vineyard sprayer. (a) Flowmeter. (b) Main line pressure sensor. (c) Shock absorber and pressure sensor for leftwing of sprayer. (d) Shock absorber and pressure sensor for right wing of sprayer.
Agriculture 13 00499 g002
Figure 3. Experimental design, definition of sectors and pressure measuring points.
Agriculture 13 00499 g003
Figure 4. Linear relation between the measured flowrate (Q m ) and the theoretical flowrate calculated from the manufacturer tables (Q n o z z l e ).
Agriculture 13 00499 g004
Figure 5. Measured flowrate (Q m , L · min 1 ) according to the DC set up from the sprayer computer (preset DC, %), mean and 95 percent Fisher LSD values.
Agriculture 13 00499 g005
Figure 6. Sigmoidal relation between the DC set up from the sprayer computer (preset DC, %) and R t h , %.
Agriculture 13 00499 g006
Figure 7. Sigmoidal relation between the DC set up from the sprayer computer (preset DC, %) and R q , %.
Agriculture 13 00499 g007
Figure 8. Spraying activation and deactivation images of nozzle 14, preset DC = 20%.
Agriculture 13 00499 g008
Figure 9. Square waves representing the activation of the valves for the different preset DC cycles ((t s ) = spraying time; (t t ) = transitional time; and (t n ) = non spraying time) deduced from high-speed video frames.
Agriculture 13 00499 g009
Figure 10. Valve actuation times (s) deduced from high-speed video frames according to the preset DC (%).
Agriculture 13 00499 g010
Figure 11. Predicted and measured flowrate (Q m ) according to the time lapse extracted from the high-speed video recordings.
Agriculture 13 00499 g011
Figure 12. Sigmoidal relation between the DC set up from the sprayer computer (preset DC, %) and the time-based DC (DC t , %).
Agriculture 13 00499 g012
Table 1. Analysis of variance of the factor DC set up from the sprayer computer (preset DC, %) on the measured flowrate (Q m , L · min 1 ).
SourceSum of SquaresdfMean SquareF-Ratiop-Value
Between groups0.38838490.043153411.1510 4
Intra groups0.001155110.000011
Total0.38953120
Disclaimer/Publisher’s Note: The statements, opinions and data contained in all publications are solely those of the individual author(s) and contributor(s) and not of MDPI and/or the editor(s). MDPI and/or the editor(s) disclaim responsibility for any injury to people or property resulting from any ideas, methods, instructions or products referred to in the content.

