Article

Identification and Analysis of Phosphatidylethanolamine-Binding Protein Family Genes in the Hangzhou White Chrysanthemum (Chrysanthemum morifolium Ramat)

Zhejiang Provincial Key Laboratory of Biometrology and Inspection & Quarantine, College of Life Sciences, China Jiliang University, Hangzhou 310018, China
*
Author to whom correspondence should be addressed.
These authors contributed equally to this work.
Agriculture 2023, 13(2), 374; https://doi.org/10.3390/agriculture13020374
Submission received: 9 January 2023 / Revised: 30 January 2023 / Accepted: 1 February 2023 / Published: 4 February 2023

Abstract

:
The Hangzhou White Chrysanthemum (Chrysanthemum morifolium Ramat) is one of the “Zhejiang eight flavors” in traditional Chinese medicine. The phosphatidylethanolamine-binding protein (PEBP) plays an important role in flowering and floral organ development. Even so, the biological role of PEBPs in the Hangzhou White Chrysanthemum has not been studied, which attracted us. Here, nine CmPEBP genes that contain the PF01161 domain were identified in the Hangzhou White Chrysanthemum for the first time, and their biological role in flowering was preliminarily studied. A phylogenetic analysis classified the CmPEBP genes into three subfamilies: MFT-like, TFL-like, and FT-like genes. The differential expression analysis was performed under different tissues and different stressors using qRT-PCR. It showed that each CmPEBP displayed tissue-specific expression patterns. Expression patterns in response to different temperatures and hormone stressors were investigated. They were finally demonstrated to be differentially expressed. TFL-like gene expression, which delayed reproductive growth, was upregulated under heat stress. Conversely, FT-like gene expression was upregulated under low temperatures. CmFT1 expression could be inhibited by GA (gibberellin), 6-BA (benzylaminopurine), ET (ethylene), and MeSA (methyl salicylate) but could be activated by IAA (indole-3-aceticacid), ABA (abscisic acid), and SA (salicylic acid) in the dark, whereas CmFT2 and CmFT3 expression levels were upregulated by ET, MeJA (methyl jasmonate), and ABA but were downregulated by 6-BA, SA, and MeSA. GA, IAA, SA, and MeSA inhibited CmTFL gene expression under light and dark treatments. Further research on CmPEBP genes in the Hangzhou White Chrysanthemum could better determine their roles in flowering and floral organ development, especially in response to the prolonged spraying of exogenous hormones.

1. Introduction

The phosphatidylethanolamine-binding protein (PEBP) is found in all taxa, from bacteria to eukaryotes, and plays an important role in the flowering time of plants [1,2]. PEBP genes are ancient, widespread, and highly conserved; they are found in bacteria, animals, and plants [3,4,5]. The PEBP family is usually divided into three subfamilies, including FLOWERING LOCUS T (FT)-like proteins [6], TERMINAL FLOWER 1 (TFL1)-like proteins, and MOTHER OF FT AND TFL1 (MFT)-like proteins [7]. FT encodes a protein that is considered to be the florigen that is transported from the leaves to the shoot apical meristem (SAM) [8,9,10]. TFL1 genes are expressed in the inflorescence meristems and delay the flowering time by negatively regulating inflorescence development [11]. FT is a floral activator, whereas TFL1 is a floral repressor [12]. Although the functions of FT-like and TFL1-like genes are opposite, both are involved in flowering regulation [13]. There is a likelihood that most plants possess FT-like/TFL-like modules, and FT-like/TFL-like gene regulation varies from species to species [2,14,15,16]. In addition, MFT-like genes play a significant role in seed germination and development [17]. Most researchers consider the MFT-like subfamily to be an ancestor of the FT-like and TFL1-like subfamilies [18]. Four and two MFT homologous genes were found in mosses and ferns, respectively, but with no FT or TFL1 homologous genes, indicating that the FT/TFL1-like module was the result of the evolution of seed plants [19]. Hence, the function of FT-like genes may be to promote flowering and floral organ development, whereas TFL-like genes are inhibitory. Additionally, MFT-like genes may simultaneously perform the functions of promotion and inhibition [14,15,16].
In recent years, individual PEBP genes have been studied in many plant species, including more than ten dicotyledons and monocotyledons [3,13,20]. In dicotyledons, such as Arabidopsis thaliana [21], Solanum lycopersicum [10,22], Glycine max [3], Gossypium hirsutum [20,23], Cucumis sativus [24], and Populus tremula [25], the PEBP family comprises 6–9 genes. For example, the PEBP family in Arabidopsis is composed of six genes: FT, TFL1, BFT, ATC, TSF, and MFT [21]. However, the number of PEBP family members in monocotyledons is about three times that of dicotyledons. Zea mays [7], Oryza sativa [9], Triticum aestivum [26,27], and Oncidium Gower Ramsey [28] have 17 to 30 PEBP genes, respectively. This complexity of the PEBP family genes in monocotyledons suggests that the functions of this family are more complex in monocotyledons than in dicotyledons. Notably, no significant difference was observed in the number of TFL-like members in plants. However, the number of FT-like members is much higher in monocotyledons (more than 10) than in dicotyledons (usually 1–2). In contrast, plants with numerous FT-like members have fewer MFT-like members. The sequences of the PEBP family members in these species have high homology with those of A. thaliana, and their mechanism of action in flowering regulation is also similar [3,4].
Plants have produced many repetitive genes through large-fragment and genome-wide duplication during evolution. Some functions are redundant, some genes are silent or nonfunctional, and some neofunctionalization genes have functions that are due to mutations [29,30]. DPDxP and GxHR, which presumably contribute to the conformation of the ligand binding pocket, are considered to be two highly conserved characteristic short motifs of PEBPs [31,32]. Six conserved ligand-binding sites in the PEBPs of different species form a pocket-like structure in which two amino acids are the key sites that determine the function of FT/TFL1 [33]. Hanzawa et al. [34] found that, after replacing the single amino acid Tyr85 in FT with His, the function of FT may be partially converted to that of TFL1 due to molecular interaction or structural changes. In addition, Ahn et al. [35] suggested that the coding amino acid sequence of PEBPs is divided into four segments (A–D) based on conservation; of these, the fourth segment (segment D) plays a crucial role in determining the FT and TFL1 protein functions. Segments B and C, which contain the LYN/IYN triplet conserved motif, are especially important for the determination of the functional specificity between FT and TFL1 [35]. Pin et al. [36] also found that the three amino acids (Tyr138, Gly141, and Trp142) and the exons in the B segment of BvFT1 and BvFT2, which are two FT paralogs with antagonistic functions in sugar beets, led to changes in promoting and inhibiting activities. Thus, the identification and classification of the PEBP family genes have become more important.
The Hangzhou White Chrysanthemum (Chrysanthemum morifolium Ramat), a perennial subshrub, is one of the famous “Zhejiang eight flavors” in traditional Chinese medicine. It is planted separately by pressing branches from April to May. After removing the terminal bud (20 August), the vegetative-to-reproductive growth is rapid with the decrease in temperature and the shortening of sunshine. The Hangzhou White Chrysanthemum is planted in open air; thus, its planting environment is different from other Chrysanthemum species that are used as ornamentals or are cultivated for cut flowers. If artificial light control and shading are used to adjust the flowering period of the Hangzhou White Chrysanthemum, the production cost greatly increases [37]. The complex process of the flowering transition is coregulated by both external (environmental) and internal factors, such as the photoperiod, the temperature, and endogenous hormone-mediated pathways, to ensure that flowering occurs at an appropriate time [38,39,40]. Plant endogenous hormones, which act as major internal influencing factors, participate in the whole life process of plants and govern these processes by controlling their transcriptional and translational networks [41,42,43,44]. The exogenous application of hormones, such as auxin and cytokinin, is likely performed to supplement the content of endogenous hormones and to regulate their functions [45]. Therefore, studying the response patterns of the PEBP family genes to exogenous hormones may provide guidance for the flower bud differentiation and floral organ development of the Hangzhou White Chrysanthemum.
With recent advances in sequencing technologies, a rapid increase in sequenced plant genomes has been accessed in the past few years. Additionally, genome sequence databases have provided researchers with a wealth of encoded information [46,47,48,49]. However, the PEBP gene family identified in the plant species genome is still uncharacterized, particularly in its function and regulation. Especially for polyploid plants with deficient genomes or complexes, comparative genomics is a very good method for mining family genes or transcription factors [46,47,49,50,51]. In this study, we used the sequence of the PEBP family genes in the genome data of Arabidopsis and thirteen other species (Citrus clementina, C. sinensis, C. sativus, G. max, Medicago truncatula, O. sativa, Physcomitrella patens, P. trichocarpa, Prunus persica, Selaginella moellendorffii, Sorghum bicolor, Vitis vinifera, and Z. mays) to identify all the potential PEBP family genes of the Hangzhou White Chrysanthemum for the first time. Furthermore, we used bioinformatics methods to analyze CmPEBP’s characteristics based on the results of the gene structures, physical and biochemical properties, phylogenetic relationships, and conserved motifs. The tissue-specific expression patterns and the transcriptional responses to various abiotic stressors (low and high temperatures and multihormone treatments) of identified CmPEBPs were analyzed to examine their possible involvement in flowering regulation. Our study can enable the investigation of the detailed molecular and biological functions of PEBP members as well as provide a reference for the application of exogenous hormones to control flowering in the Hangzhou White Chrysanthemum.

2. Materials and Methods

2.1. Plant Materials and Abiotic Treatments

Seedlings of the Hangzhou White Chrysanthemum cultivar “Wanxiaoyangju” (C. morifolium cv. Wanxiaoyangju) were selected as study samples. In April 2019, equally sized seedlings were planted in 8 × 10 cm pots containing garden soil and vermiculite without additional fertilizer. Plants were grown with a natural photoperiod under greenhouse conditions at the Extension Center for Agricultural Techniques of Tongxiang City, Zhejiang Province, China (120.45343 N, 30.661041 E). Subsequently, plants were transplanted to the greenhouse of China Jiliang University, with a 12 h light (300 μmol·m−2·s−1)/12 h dark cycle at 25 °C and 75 ± 5% relative humidity. Reasonable pest control and fertilizer management measures were adopted during the growing period [52].
To determine tissue-specific expression patterns of CmPEBP genes, we collected the roots, stems, leaves, petioles, and shoot apices in the vegetative growth stage (19 August) and flowers instead of shoot apices in the reproductive growth stage (7 November). For high and low temperature treatments, plants grown in plant growth chambers (25 ± 2 °C) were transferred to chambers maintained at 38 °C or 4 °C for 24 h [53]. For hormone treatments, the surface of plants was evenly sprayed with a fresh working solution of 100 μM indole-3-acetic acid (IAA), benzylaminopurine (6-BA), gibberellin (GA), abscisic acid (ABA), salicylic acid (SA), methyl salicylate (MeSA), or methyl jasmonate (MeJA) [54,55]. For ethylene (ET) treatments, the surface of plants was evenly sprayed with a fresh working solution of 100 μM Ethrel. For fat-soluble hormones (IAA, GA, etc.), an appropriate amount of 95% ethanol was used to dissolve them, and then they were diluted with distilled water to reach the working solution concentration (the final concentration of ethanol was 1%). For water-soluble hormones (ABA, etc.), 1% ethanol distilled water was directly used as the solvent for their preparation. The control (CK) used 1% ethanol as the working solution. Plants were divided into two groups: dark treatment group (light-interrupted) and light treatment group (light-exposed). The control group included nonstress-treated plants. The fifth and sixth mature leaves in these groups were obtained at 0, 4, 12, and 24 h after the experiment began. Controls were set up at each time point, and for all the above assays, plants of approximately equal sizes were selected for all treatments. Three independent biological replicates of each sample were harvested. The samples were treated with liquid nitrogen immediately after collection and were stored at −80 °C for RNA extraction.

2.2. RNA Isolation and cDNA Synthesis

The sample was ground in liquid nitrogen, and 100 mg of powder was transferred to a 1.5-mL RNase-free centrifuge tube, and then the RNAprep Pure Plant Kit (Tiangen Biotech Co., Ltd., Beijing, China) was used to extract RNA [55]. All instruments used were sterilized with diethylpyrocarbonate liquid in advance, and the isolated RNA was stored at −80 °C. The NanoDrop 2000 spectrophotometer (Thermo Fisher Scientific, Wilmington, DE, USA) was used to measure the concentration of isolated RNA, and the quality was assessed using 1.2% formaldehyde–agarose gel electrophoresis. Finally, first-strand cDNA of the sample was synthesized with the PrimeScript II 1st Strand cDNA Synthesis Kit (TAKARA, Tokyo, Japan). cDNA was diluted 10 fold for PCR amplification.

2.3. Identification of PEBP Family Genes

Using “PF01161 domain” and “phosphatidylethanolamine-binding protein” as keywords, we searched the genomic databases of 13 plant species at different evolutionary stages, including A. thaliana, C. clementina, C. sinensis, C. sativus, G. max, M. truncatula, O. sativa, P. patens, P. trichocarpa, P. persica, S. moellendorffii, S. bicolor, and Z. mays (https://phytozome.jgi.doe.gov/pz/portal.html (accessed on 15 February 2021). The strategy and steps of obtaining each gene of the PEBP family in the plant genome were the same as those of Pan et al. [55]. Based on transcriptome databases previously generated for the Chrysanthemum cv. “Wanxiaoyangju”, all partial nucleotide sequences of the CmPEBP family were initially obtained. Using BLASTx (NCBI) and SeqMan in the DNASTAR package (DNASTAR, Inc., Madison, WI, USA), nucleotide sequences with more than 60% identity were identified and assembled [56]. By comparing them with known PEBP sequences, the candidate sequences were verified with ClustalX [57]. Using Primer Premier 5 (Premier Biosoft International, Palo Alto, CA, USA), specific primer pairs (Table S1) were designed to clone the full-length cDNA sequences, and these were synthesized by Sangon Biotech Co. (Shanghai, China). SMART RACE cDNA Amplification Kit (Clontech, Mountain View, CA, USA) was used to isolate full-length cDNA according to the manufacturer’s instructions [58]. The PCR product was purified and ligated into the pMD-20T vector (TAKARA, Tokyo, Japan) using the Axygen Gel Extraction Kit (Axygen, Union City, CA, USA). The plasmid constructs were sequenced by Sangon Biotech Co. The sequence accuracy was confirmed through sequencing. To confirm the potential CmPEBP genes, the SMART (http://smart.embl-heidelberg.de/ (accessed on 18 February 2021) [59], Pfam 31.0 (https://www.ebi.ac.uk/interpro/ (accessed on 18 February 2021) [60], and NCBI (http://www.ncbi.nlm.nih.gov/ (accessed on 18 February 2021) [61] databases were used.

2.4. Analysis of Sequences

Information on the length of coding and amino acid sequences was determined using DNAMAN and DNASTAR software packages. The molecular weights and theoretical isoelectric points (pIs) were predicted using the ProtParam tool (http://web.expasy.org/protparam/ (accessed on 19 February 2021) [62]. Both WoLF PSORT (http://www.genscript.com/wolf-psort.html (accessed on 19 February 2021) [63] and TargetP (http://www.cbs.dtu.dk/services/TargetP/ (accessed on 19 February 2021) [64] were used to predict subcellular localization of proteins. Full-length sequences of PEBPs of Hangzhou White Chrysanthemum and Arabidopsis were aligned using ClustalW with default parameters in BioEdit [57]. To determine the subgroup classification of CmPEBP genes, the phylogenetic tree and conserved motifs were assessed for CmPEBP-encoded proteins. Arabidopsis and Z. mays PEBPs were used to classify the tea plant proteins into groups using the neighbor-joining method with 1000 bootstrap replicates in MEGA 6.0 [65]. To find their conserved motifs, full-length amino acid sequences of CmPEBP genes were entered into the MEME analysis tool (http://meme.sdsc.edu/meme/website/meme.html (accessed on 20 February 2021) [66], setting the maximum number of motifs to 14. Each de novo detected motif was searched for using the InterPro database (https://www.ebi.ac.uk/interpro/ (accessed on 21 February 2021) [67] to find similarities with known domains. The consensus sequence was separately scanned in the InterPro database to determine the domains present in preidentified PEBPs.

2.5. Gene Expression Analysis Using qRT-PCR

Specific primers (Table S2) for qRT-PCR were designed using Primer Premier 5 and were synthesized by Sangon Biotech Co. (Shanghai, China). The StepOnePlus™ real-time PCR (Thermo Fisher Scientific, Foster City, CA, USA) was used for the quantitative analysis. ROX reference dye was mixed with TB SYBR Premix Ex Taq II (Tli RNase H Plus, TAKARA) in advance to normalize signal and ensure data integrity. The reaction volume of qRT-PCR was 25 μL, which contained 12.5 μL of SYBR Premix Ex Taq II (Tli RNase H Plus), 1 μL of forward primer, 1 μL of reverse primer, and 2 μL of cDNA template, and ddH2O was added to make the volume 25 μL. The reaction program was performed under the following conditions: 95 °C for 30 s followed by 40 cycles at 94 °C for 5 s and 60 °C for 30 s. The mean and standard deviation values were calculated based on three independent biological replicates. CmEF was used as a reference gene to normalize the expression of related genes [68].
The relative gene expression levels were calculated using the comparative 2−ΔΔCt method [69]. When calculating the expression level of different tissues, the expression level of the stem in the vegetative growth stage was calculated as 1, and log2 of the expression level was used to convert the heatmap. In the stress-treated plant samples, values were normalized to plant samples of the 0 h treatment and were expressed as log2 fold changes. In the histogram, values of tissues were normalized to those of bud tissues, whereas values for seed dehydration treatment samples were normalized to those of the 0 h treatment (expression = 1). Differences in gene expression levels were detected using Tukey’s multiple range test at the 0.05 probability level. Three independent qRT-PCR experiments were performed on total RNA samples.

3. Results

3.1. Isolation and Identification of the PEBP Family Genes in the Chrysanthemum

Based on the transcriptome databases previously generated for the Chrysanthemum cv. “Wanxiaoyangju”, more than 40 candidate PEBP genes were obtained. Several sequences were excluded because they shared an approximately 99% open reading frame identity with other candidate CmPEBP genes (data not shown), and nine genes were further analyzed. Each unique gene was named according to the Arabidopsis nomenclature. The coding sequences of all the CmPEBP genes were submitted to GenBank with the following accession numbers: CmFT1 (OP617277), CmFT2 (OP617278), CmFT3 (OP617279), CmTFL1 (OP617271), CmTFL2 (OP617272), CmTFL3 (OP617273), CmTFL4 (OP617274), CmMFT1 (OP617275), and CmMFT2 (OP617276). The gene names, accession numbers, full-length sequences, and other bioinformatics analysis results are summarized in Table 1. The nucleotide sequence lengths of the identified PEBP family genes were between 507 and 531. The PEBP family gene-encoded proteins ranged from 167 (CmTFL2) to 176 (CmTFL3) amino acids (average of 172 amino acids), with a predicted molecular mass of 18.45–19.79 kDa and a pI ranging from 4.71 (CmMFT1) to 9.39 (CmTFL2). Most of the CmPEBP family genes were predicted to be located in the cytoplasm, nucleus, and chloroplast, and these predictions might be related to their functions [3,7,20,31].

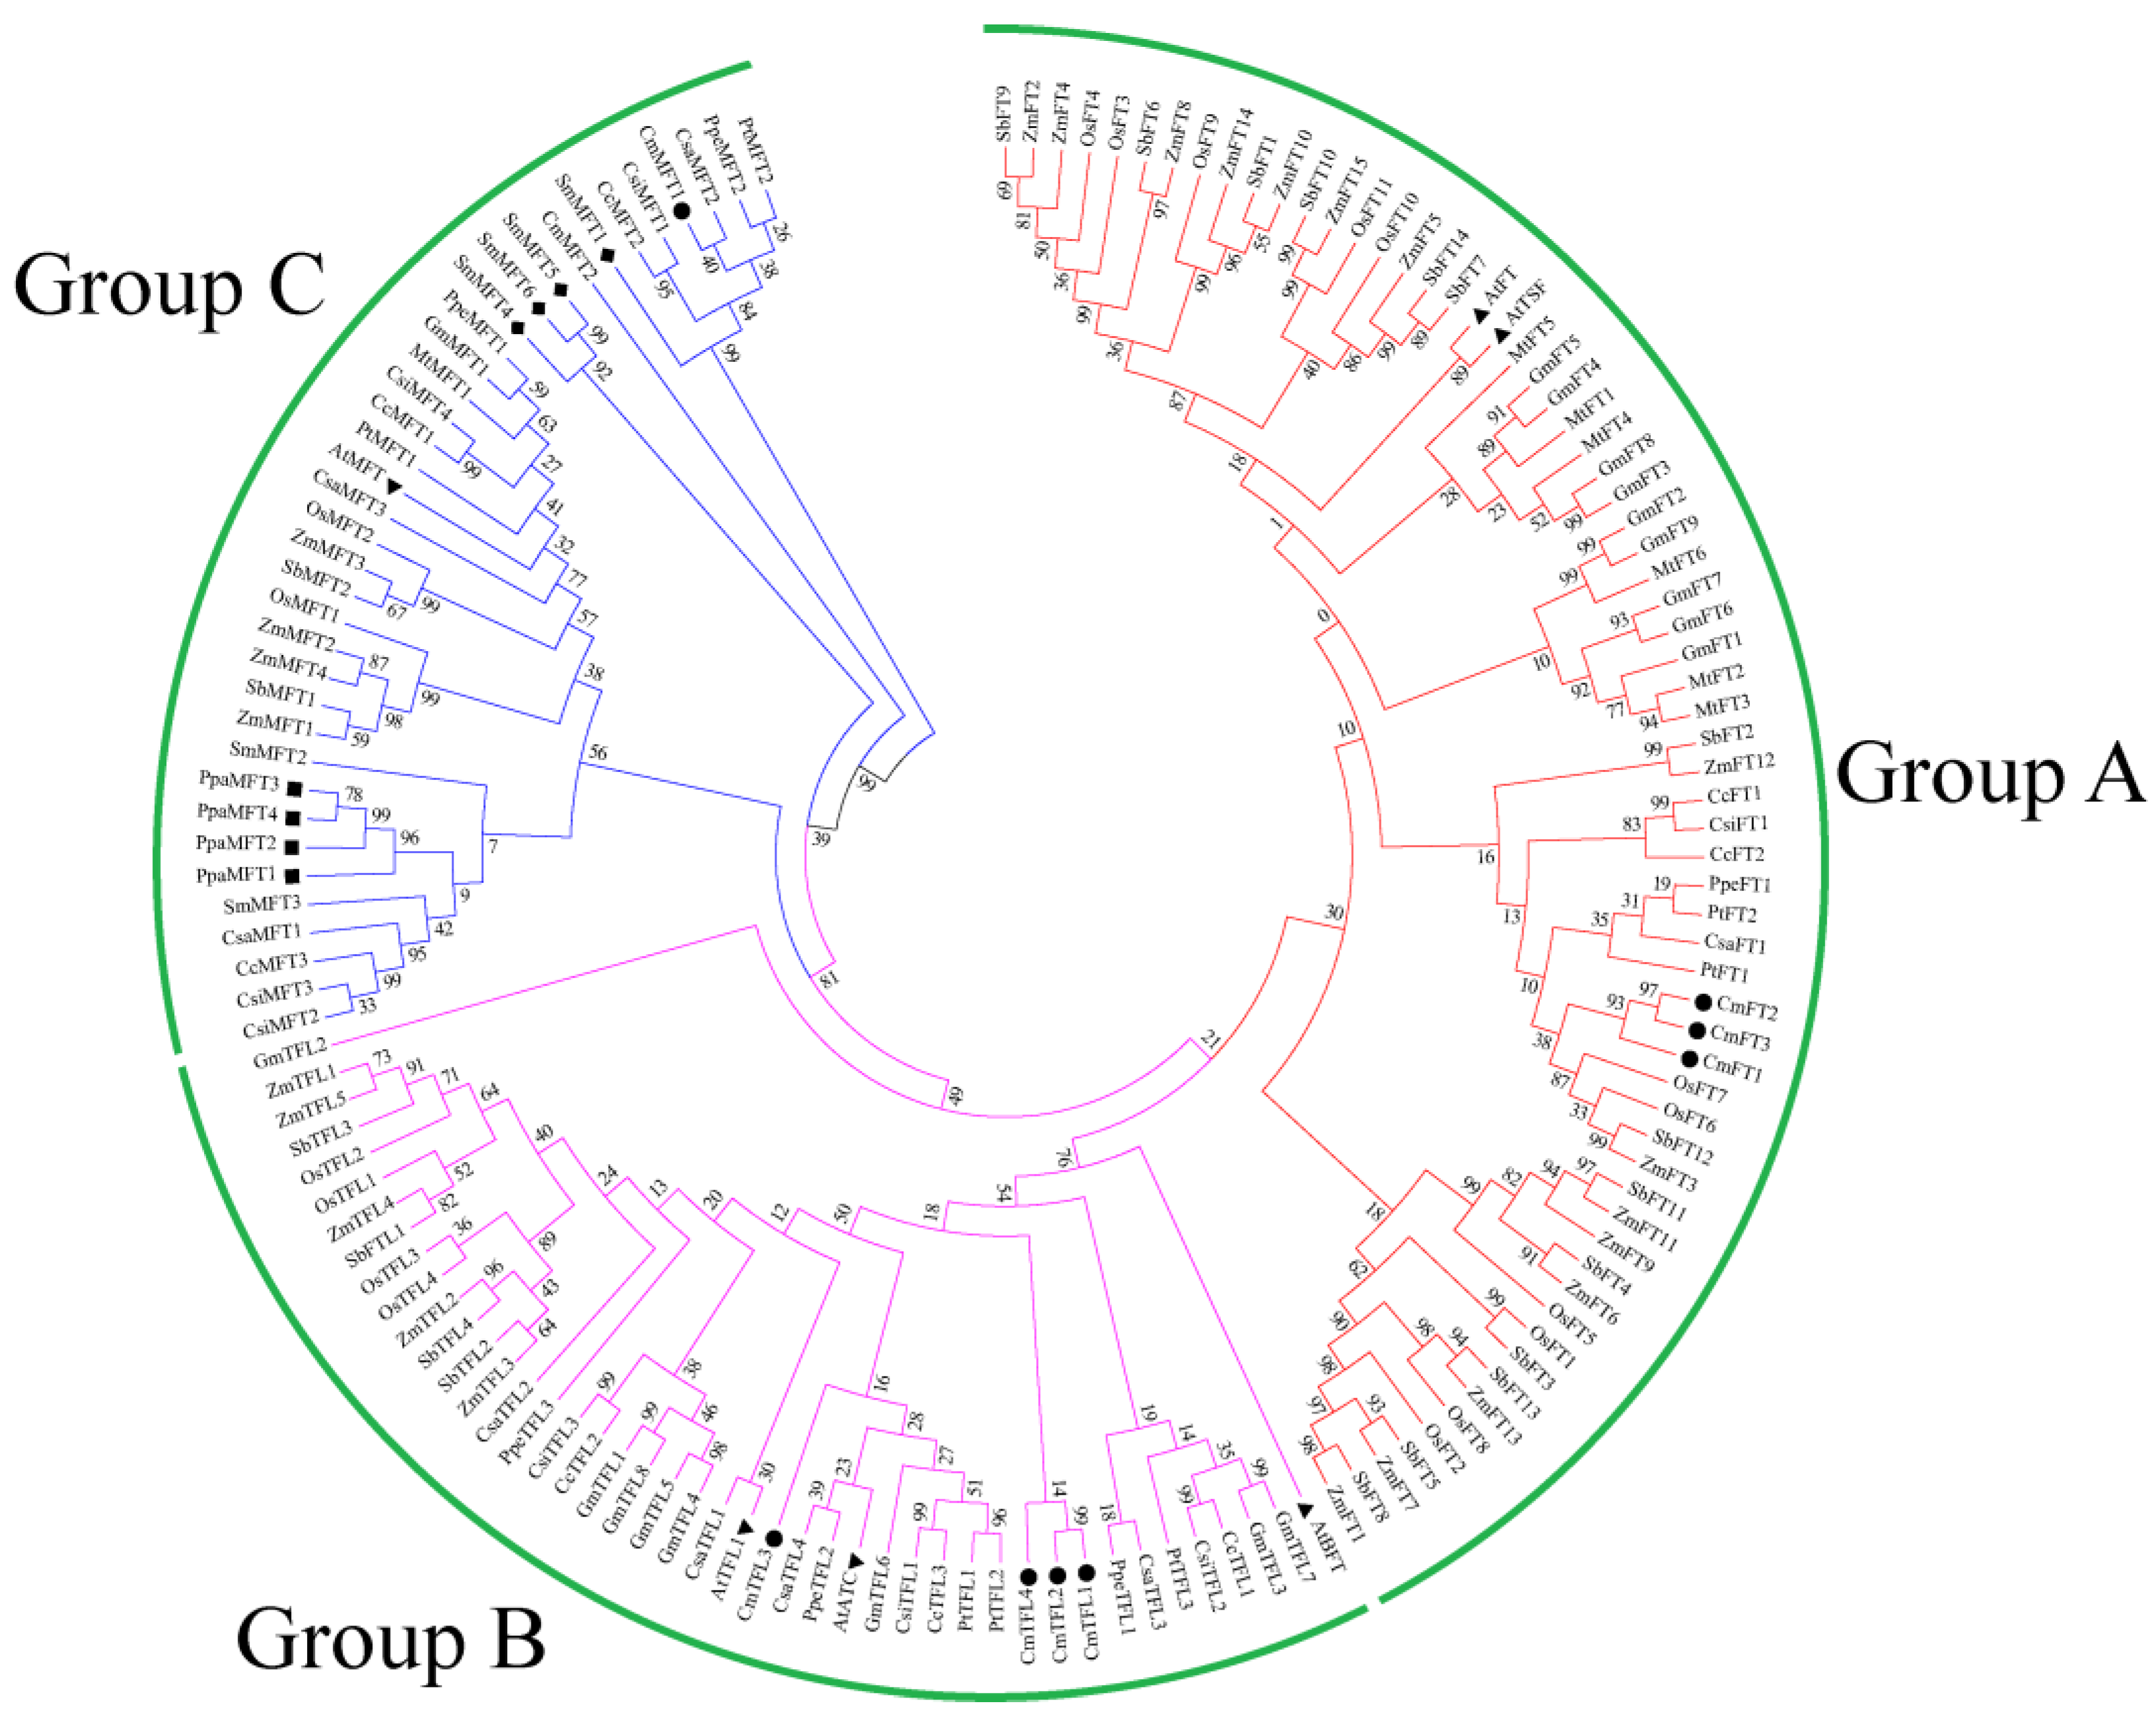
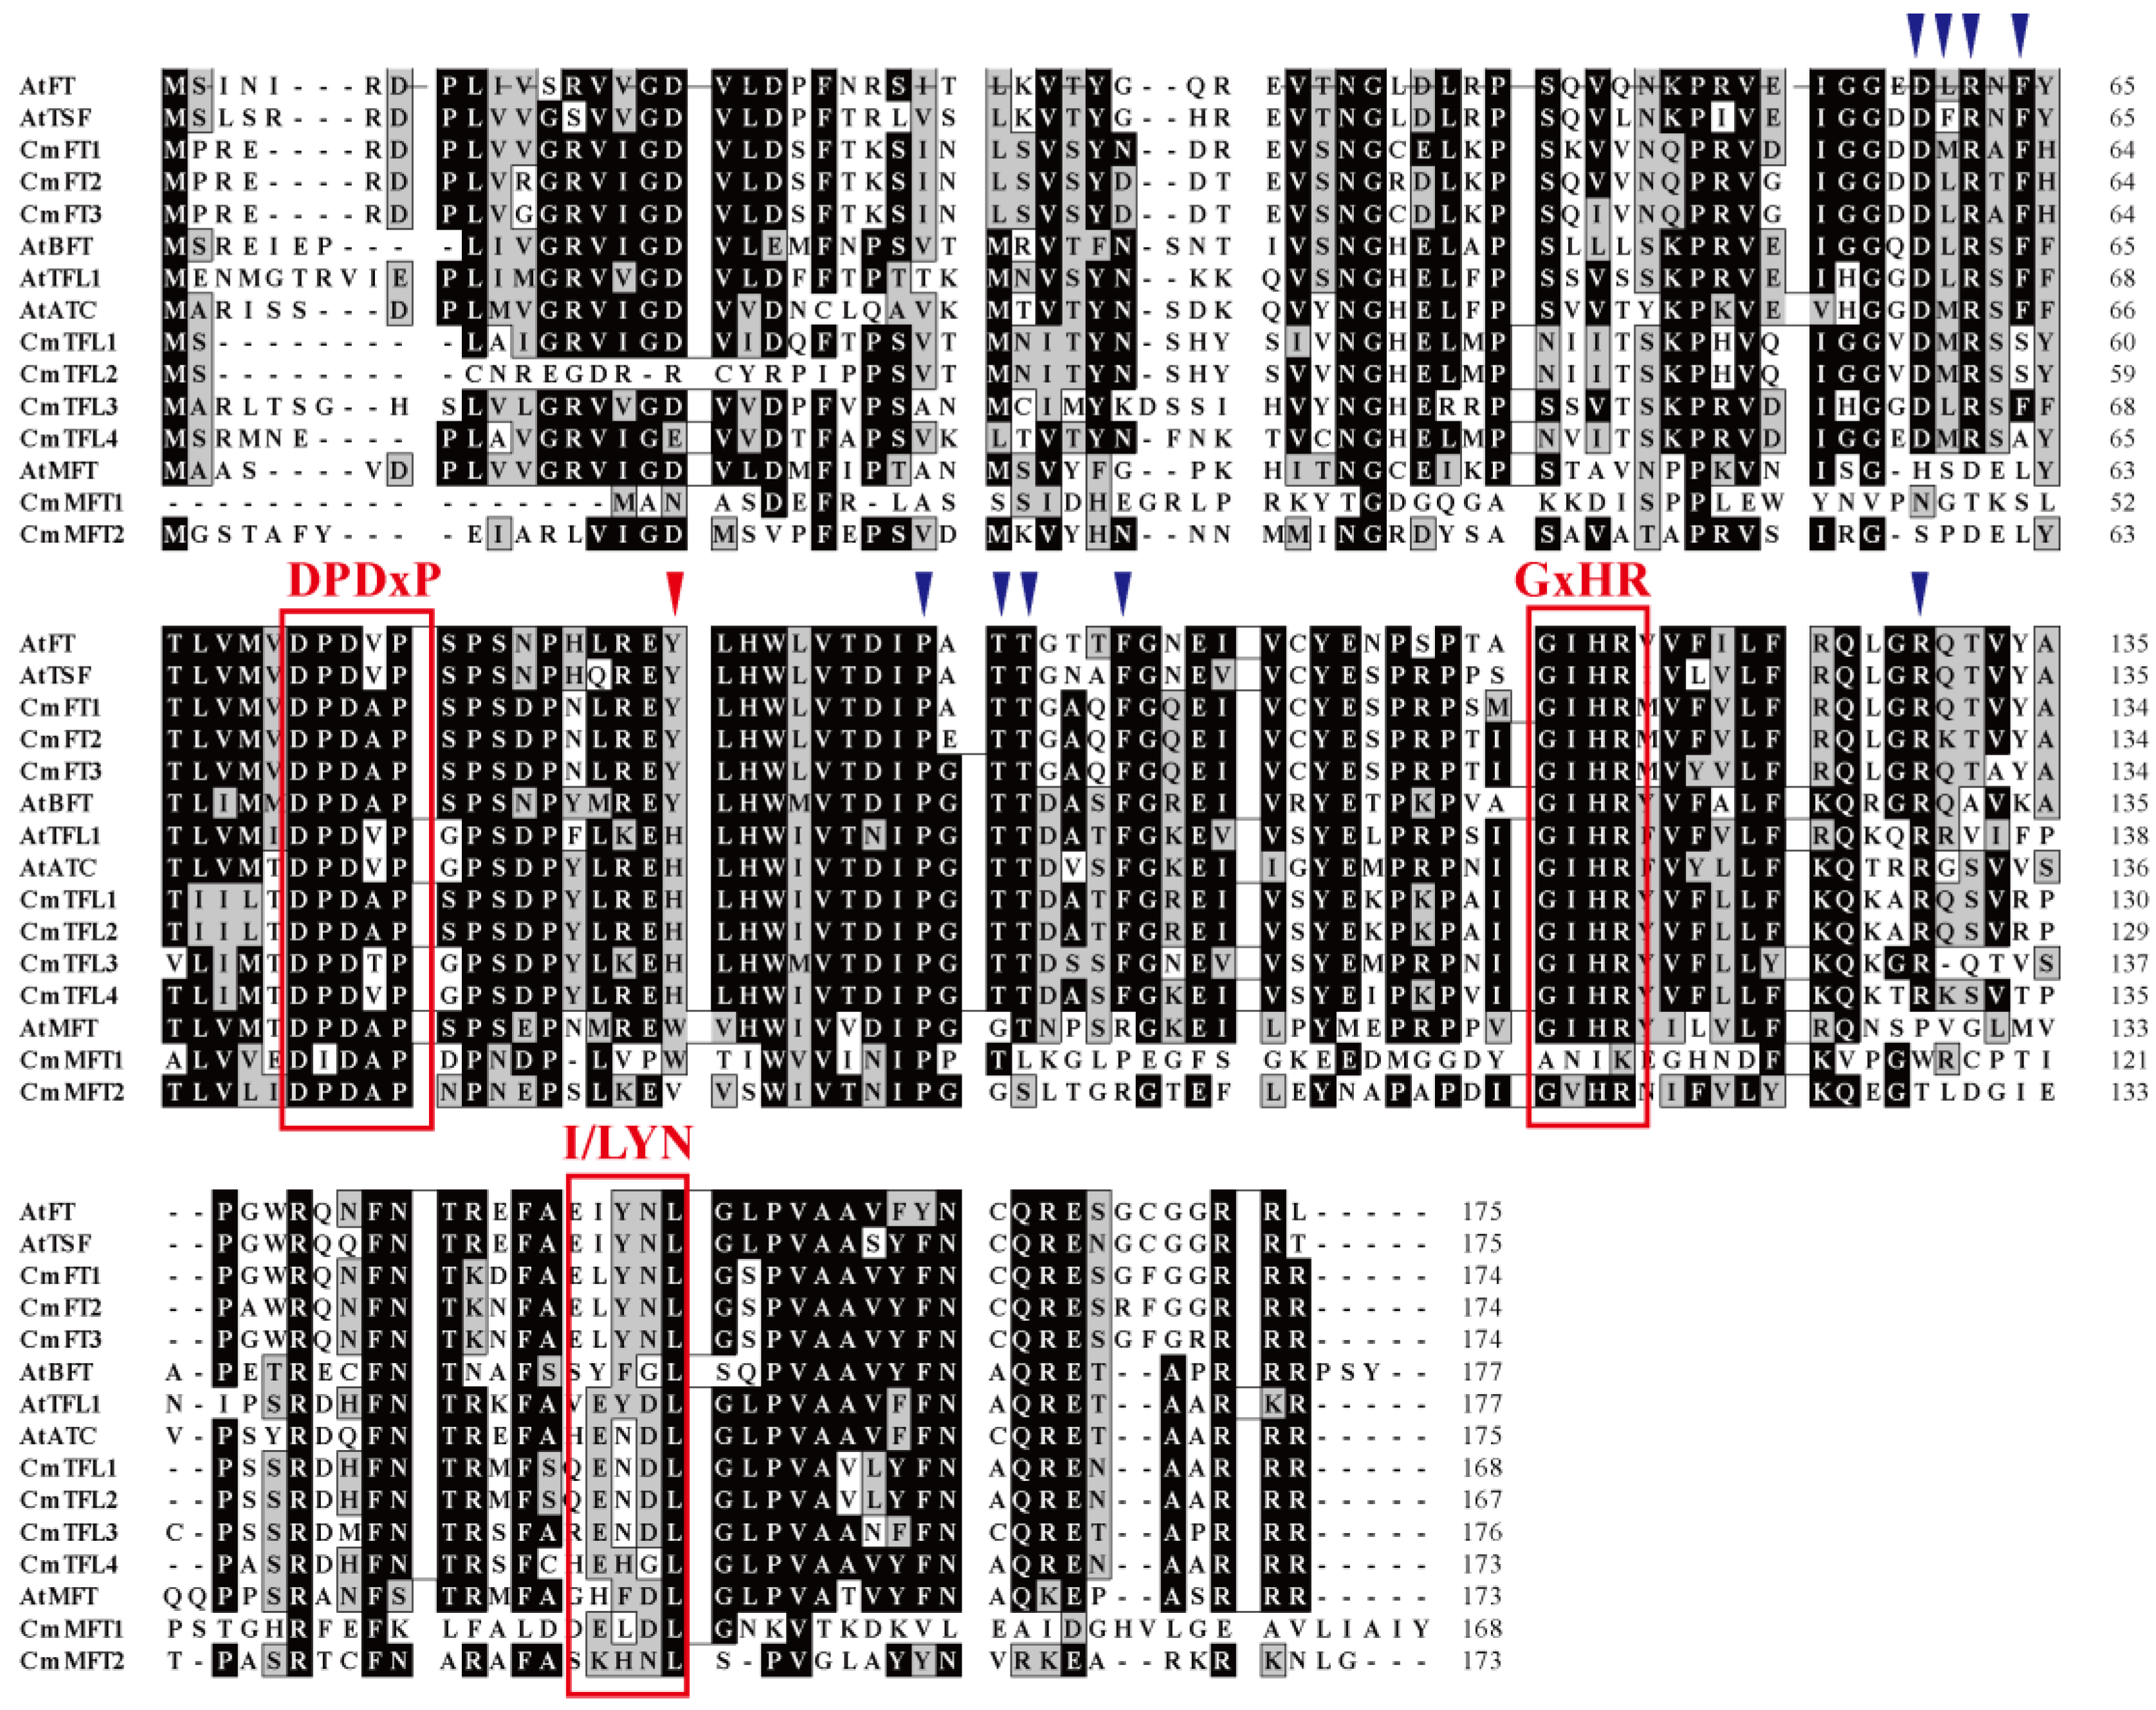
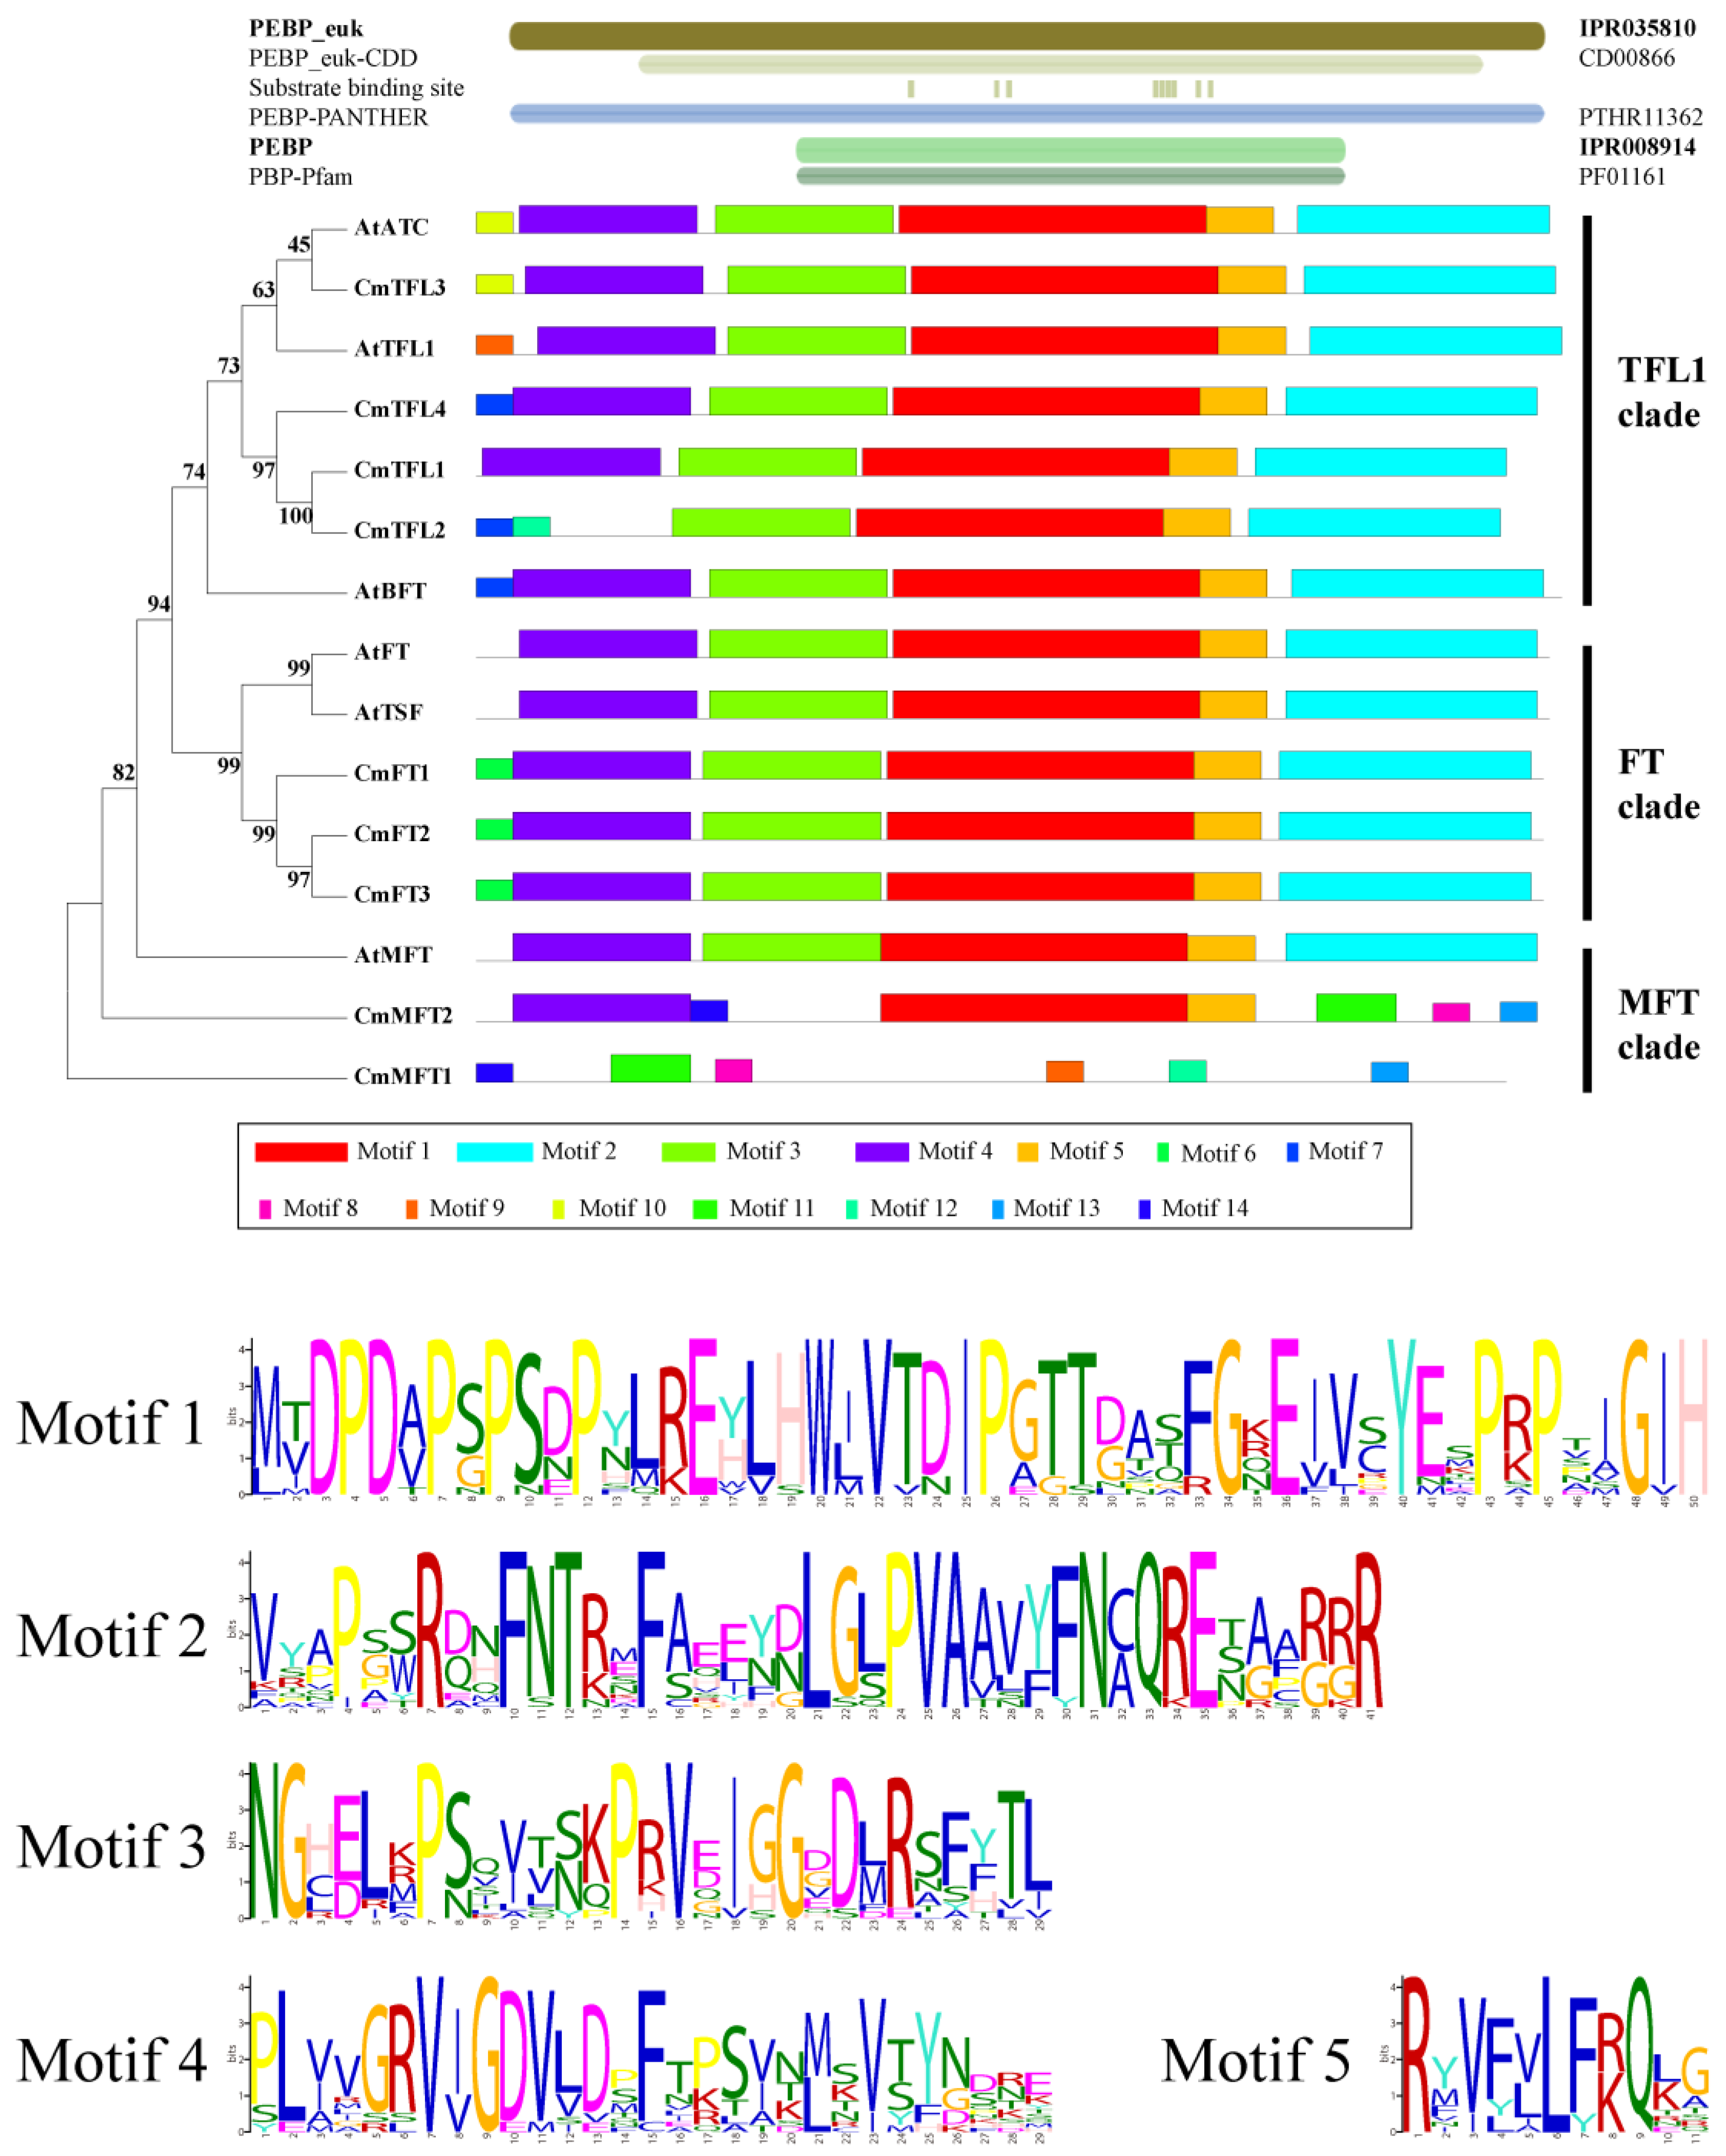
3.2. Similarity and Phylogenetic Gene Structure Analysis

To further analyze the phylogenetic relationships between the PEBP family members in the Chrysanthemum and other species, a phylogenetic tree was generated based on the full-length PEBP sequences from C. morifolium, Arabidopsis, C. clementina, C. sinensis, C. sativus, G. max, M. truncatula, O. sativa, P. patens, P. trichocarpa, P. persica, S. moellendorffii, S. bicolor, V. vinifera, and Z. mays. From a functional point of view, the function of FT-like genes is to promote flowering and floral organ development, whereas that of TFL-like genes is inhibitory. Additionally, MFT-like genes have the functions of simultaneous promotion and inhibition [23,31]. All sequences could be divided into three subfamilies: MFT-like, TFL-like, and FT-like genes. Except for nonflowering plants (P. patens and S. moellendorffii), all the plants had the three subfamily members. No significant difference was observed in the number of TFL-like members between any of the plants except for soybean. Notably, the number of FT-like members was much higher in monocotyledons (more than 10) than in dicotyledons (usually 1–2). In contrast, plants with many FT-like members had fewer MFT-like members. MFT-like genes might be the evolutionary source of FT-like and TFL-like genes, and their differentiation might have occurred when flowering plants appeared. Meanwhile, the evolutionary rate of FT-like genes was faster than that of TFL-like genes. Similarly, FT-like genes changed in two directions: one was to reduce the number of redundant members (dicotyledons), and the other was to increase the number of members (monocotyledons). In addition to soybean and M. truncatula, the FT-like genes showed significant differences between dicotyledons and monocotyledons. The FT-like genes were more conservative in dicotyledons and were more diverse in monocotyledons, and they could be divided into three subgroups [3,20]. Therefore, the CmPEBP genes were classified into three subfamilies (Figure 1, Table 1). A multiple sequence alignment program was used to analyze the nine open reading frames and their encoded amino acid sequences. The results of their similarities are listed in Table S3. The nucleotide sequence similarities varied from 34.7% (CmFT3 and CmMFT1) to 99.0% (CmTFL1 and CmTFL2), whereas proteins exhibited similarities from 17.1% (CmTFL4 and CmMFT1) to 93.7% (CmFT2 and CmFT3).
The predicted amino acid sequences of the 9 CmPEBP and their corresponding sequences in 13 plants, including Arabidopsis, C. clementina, C. sinensis, C. sativus, G. max, M. truncatula, O. sativa, P. patens, P. trichocarpa, P. persica, S. moellendorffii, S. bicolor, and Z. mays were aligned using the ClustalW2 sequence alignment program. The phylogenetic tree was constructed using the MEGA6 software with the neighbor-joining tree method with 1000 bootstrap replicates. Three subgroups were shown in various colors, and the sequences of the Chrysanthemum, Arabidopsis, S. moellendorffii, and P. patens were highlighted with black dots, triangles, diamonds, and squares, respectively.
The alignment showed that these sequences contained the PBP (PF01161) domain (Figure 2). The proposed consensus sequences DPPxP and GxHR were highly conserved in the FT-like and TFL-like subfamilies (Figure 2 and Figures S1 and S2) but were only partially conserved in the MFT-like subfamily (Figure 2 and Figure S3). The blue triangles indicate amino acid residues that interact with 14-3-3 proteins, which were conserved in the FT-like and TFL-like subfamilies but not in the MFT-like subfamily [18,32]. The key amino acid residues that were distinguishable among the FT-like (Y), TFL-like (H), and MFT-like (W) clades were present at position 85 of AtFT in the CmPEBP family proteins (excluding CmMFT2) (Figure 2 and Figure S1–S3) [3,18,20]. However, after analyzing the amino acid sequences of the MFT-like clade in the 13 plants, the key amino acid residues might be Y and L in addition to W (Figure S3). Yang et al. found two highly conserved amino acid sequences, LGRQTVYAPGWRQN and LYN triad, which are considered to be determinant for FT activity and FT/TFL1 function [18]. However, these sequences were conserved only in some sequences of the FT-like subfamily. After comparing all the sequences of the LYN triad, the conserved sequences were mainly LYNL or IYNL in the FT-like subfamily and ENxL in the TFL-like subfamily, and no conservation was found in the equivalent position of the MFT-like subfamily (Figures S1–S3). According to the analysis results of the above conserved sequences and sites, the CmPEBP genes were divided into three subfamilies. These individual genes play a specific role in the flowering process and in floral organ development. Although the diversity of the binding sequences might be related to the diversity of the substrates, more research is needed to clarify this relationship.
The putative Chrysanthemum and Arabidopsis PEBP amino acid sequences were aligned using the ClustalW method and were edited in BioEdit. Identical and similar residues are shaded in black and gray, respectively. The proposed consensus sequence DPDxP, the GxHR motif, and I/LYN were highlighted with the boxes, respectively. The blue triangles indicate amino acid residues that interact with 14-3-3 proteins. The red triangle indicates a key amino acid residue that may determine FT-like and TFL1-like functions.
A phylogenetic tree was constructed, and 14 discrete motifs were found, using AtPEBPs and ZmPEBPs to further assess and classify the CmPEBPs (Figure 3). The PBP domain might consist of motifs 1–5. Because of the lack of motifs 1–5, the CmMFTs were clearly distinguished, and because of the lack of motif 4, CmTFL2 was separated from the other TFL-like and FT-like members. Among all the CmPEBPs, motifs 6–14 were highly diversified. Thus, the CmFT proteins were relatively consistent, whereas the CmTFL proteins showed more diversified changes. The CmPEBPs could be classified into four clades when analyzed together with the motifs. Motif 1 might be contained in the proposed consensus sequences DPPxP and GxHR, whereas motif 2 might be contained in the LYN triad. These motifs might be involved in the binding of the substrate; thus, more studies are needed to clarify this relationship. The results of the MEME prediction suggested evolutionary conservation in the basal architecture of the PEBP family members.

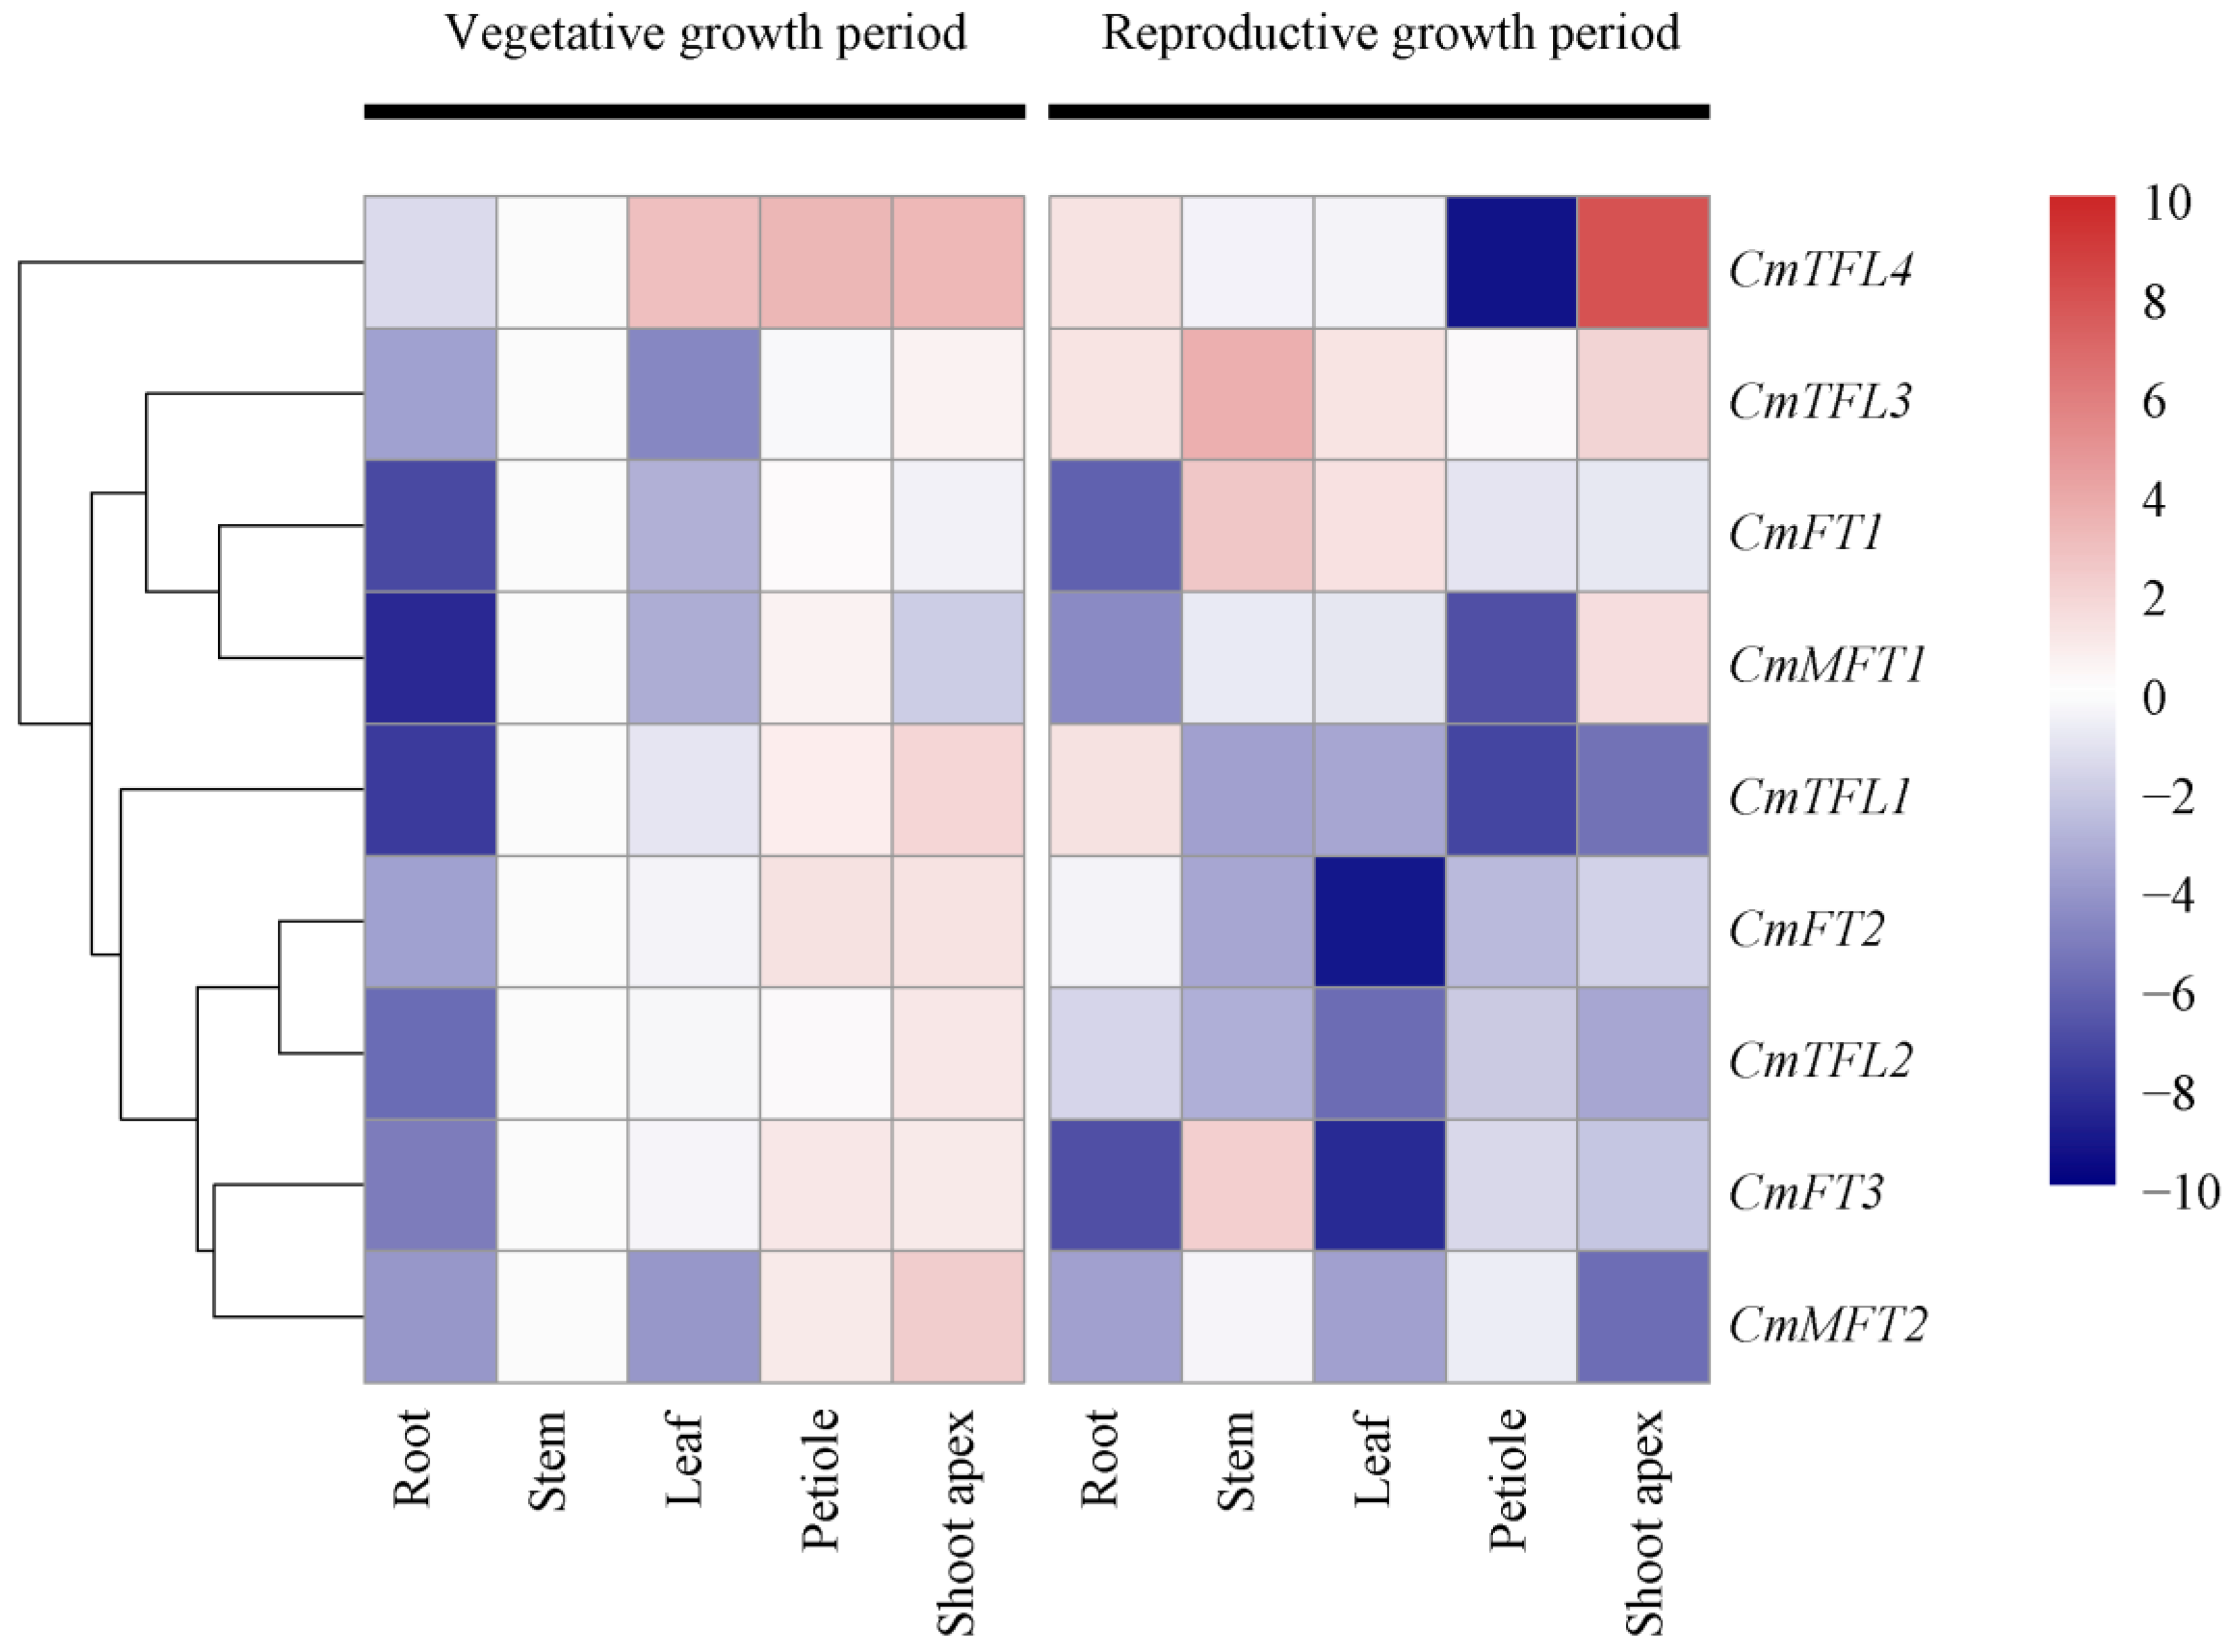
3.3. Tissue-Specific CmPEBP Gene Expression

During flowering, the SAMs transform into floral meristems and then become floral organs, switching the plant from vegetative to reproductive growth [70]. There is a likelihood that most plants possess FT-like/TFL-like modules, but how the FT-like/TFL-like genes are regulated varies from species to species [16].
The tissue specificity of CmPEBP gene expression might be closely associated with the physiological and biochemical functions of each tissue. Therefore, analyzing CmPEBP gene expression in specific tissues and organs is important. The transcript abundance of nine CmPEBP genes in five tissues, including the roots, stems, leaves, petioles, and shoot apices, was obtained. These genes were ubiquitously expressed in all the tissues with variable transcript levels (Figure 4 and Figure S4). In the vegetative growth stage, most of the CmPEBP genes showed lower expression levels in the roots and leaves, while they showed higher expression levels in the petioles and shoot apices. In the reproductive growth stage, most of the CmPEBP genes (CmFT1, CmFT2, CmFT3, CmMFT1, CmTFL1, and CmTFL2) showed expression levels that were several folds lower in the leaf and petiole tissues, whereas some of the other CmPEBP genes (CmTFL1, CmTFL2, and CmTFL4) showed higher expression levels in the root and stem tissues compared with the other three tissue types. Overall, each CmPEBP gene showed tissue-specific expression patterns [18,31], although the levels of expression varied greatly.

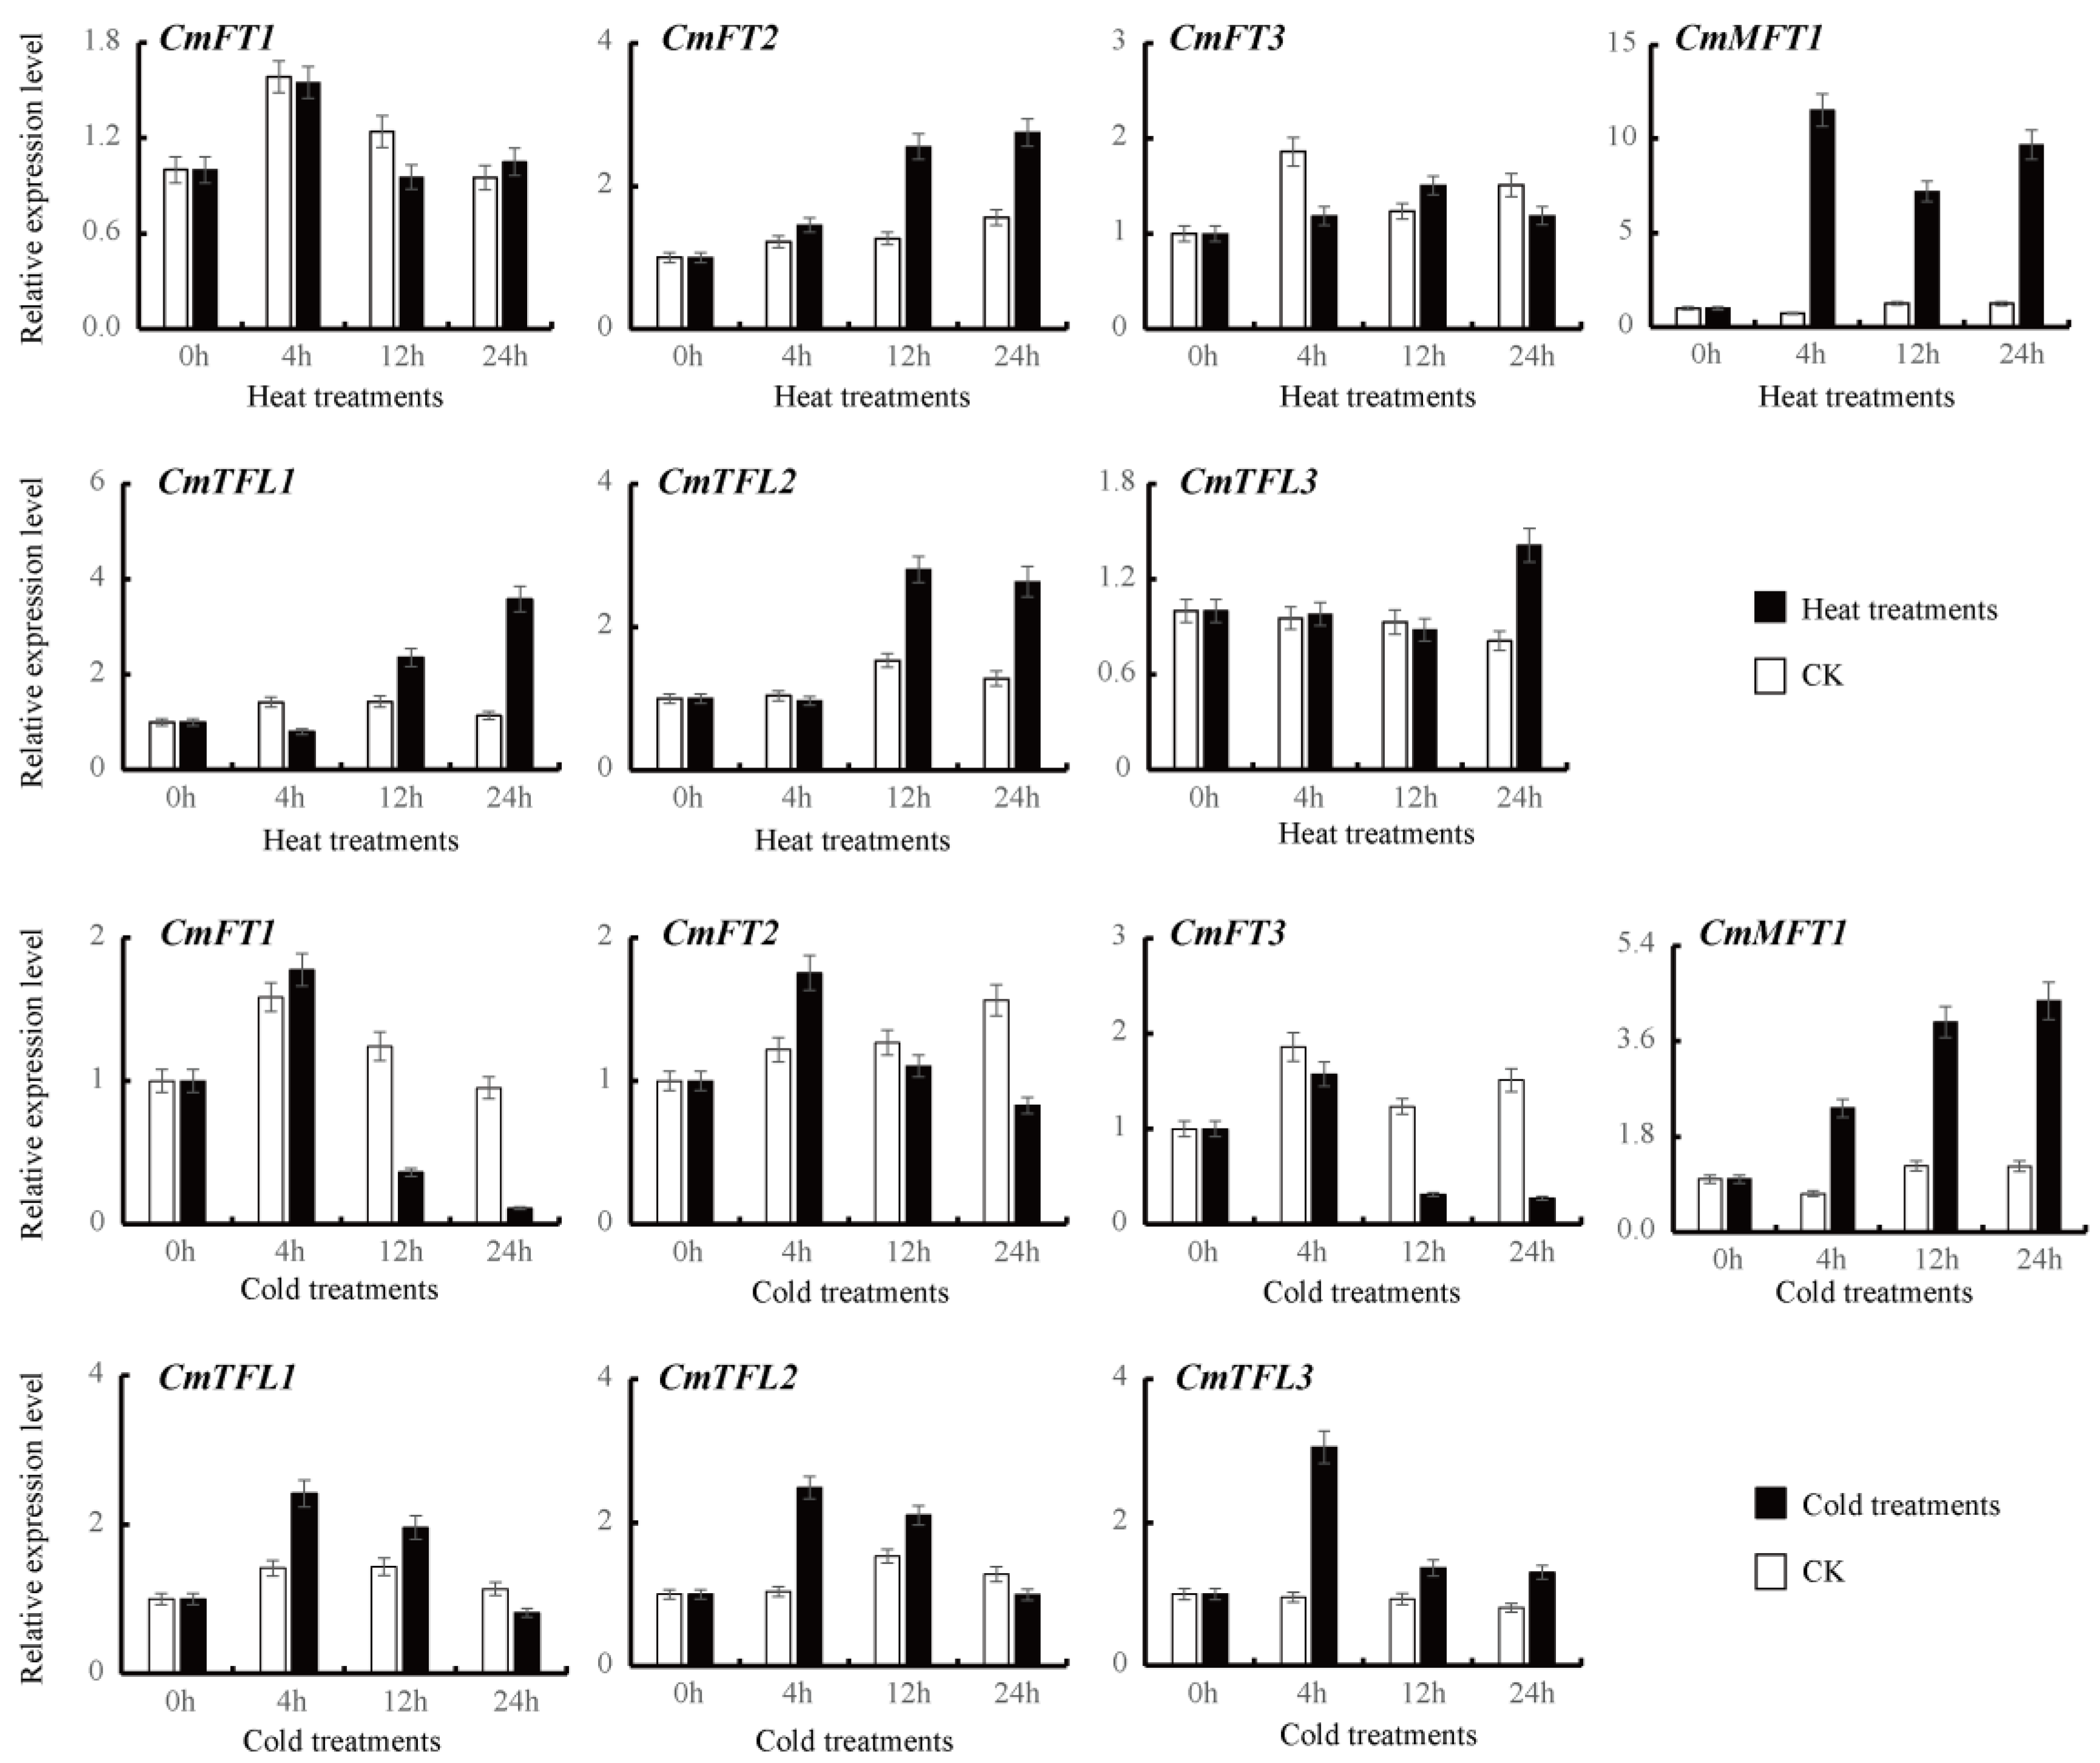
3.4. Differential CmPEBP Gene Expression under High and Low Temperature Treatments

The regulation of flowering mainly includes the photoperiod pathway, vernalization pathway, and temperature pathway [71]. Temperature affects flowering time by influencing the development rate and vernalization [39]. High temperatures may reduce or delay flowering in the Chrysanthemum [38]. To understand the expression profiles of the CmPEBP genes under different temperature stressors, the qRT-PCR experiments were performed on the Chrysanthemum plants subjected to high (38 °C) or low (4 °C) temperature treatments. The differential expression levels of the CmPEBP genes were observed under two stressors (Figure 5). Because the expression levels of CmMFT2 and CmTFL4 in the leaves were low, the stressors of the leaves were not used for the CmMFT2 and CmTFL4 expression analyses.
The genes under different temperatures had diverse expression patterns. The TFL-like genes were significantly upregulated in response to 24 h heat stress (Figure 5). Particularly, CmTFL1 and CmTFL2 showed expression levels that were several folds higher after 24 h heat stress. In contrast, the highest levels of CmTFL1, CmTFL2, and CmTFL3 were observed at 4 h in response to cold stress. The transcript levels of the FT-like genes (CmFT1 and CmFT3) were downregulated with cold stress, while the FT-like genes displayed no significant changes in response to heat stress. Notably, CmMFT1 was upregulated at least five fold in response to heat and cold stress. Similar conclusions were drawn from previous studies [25,39].

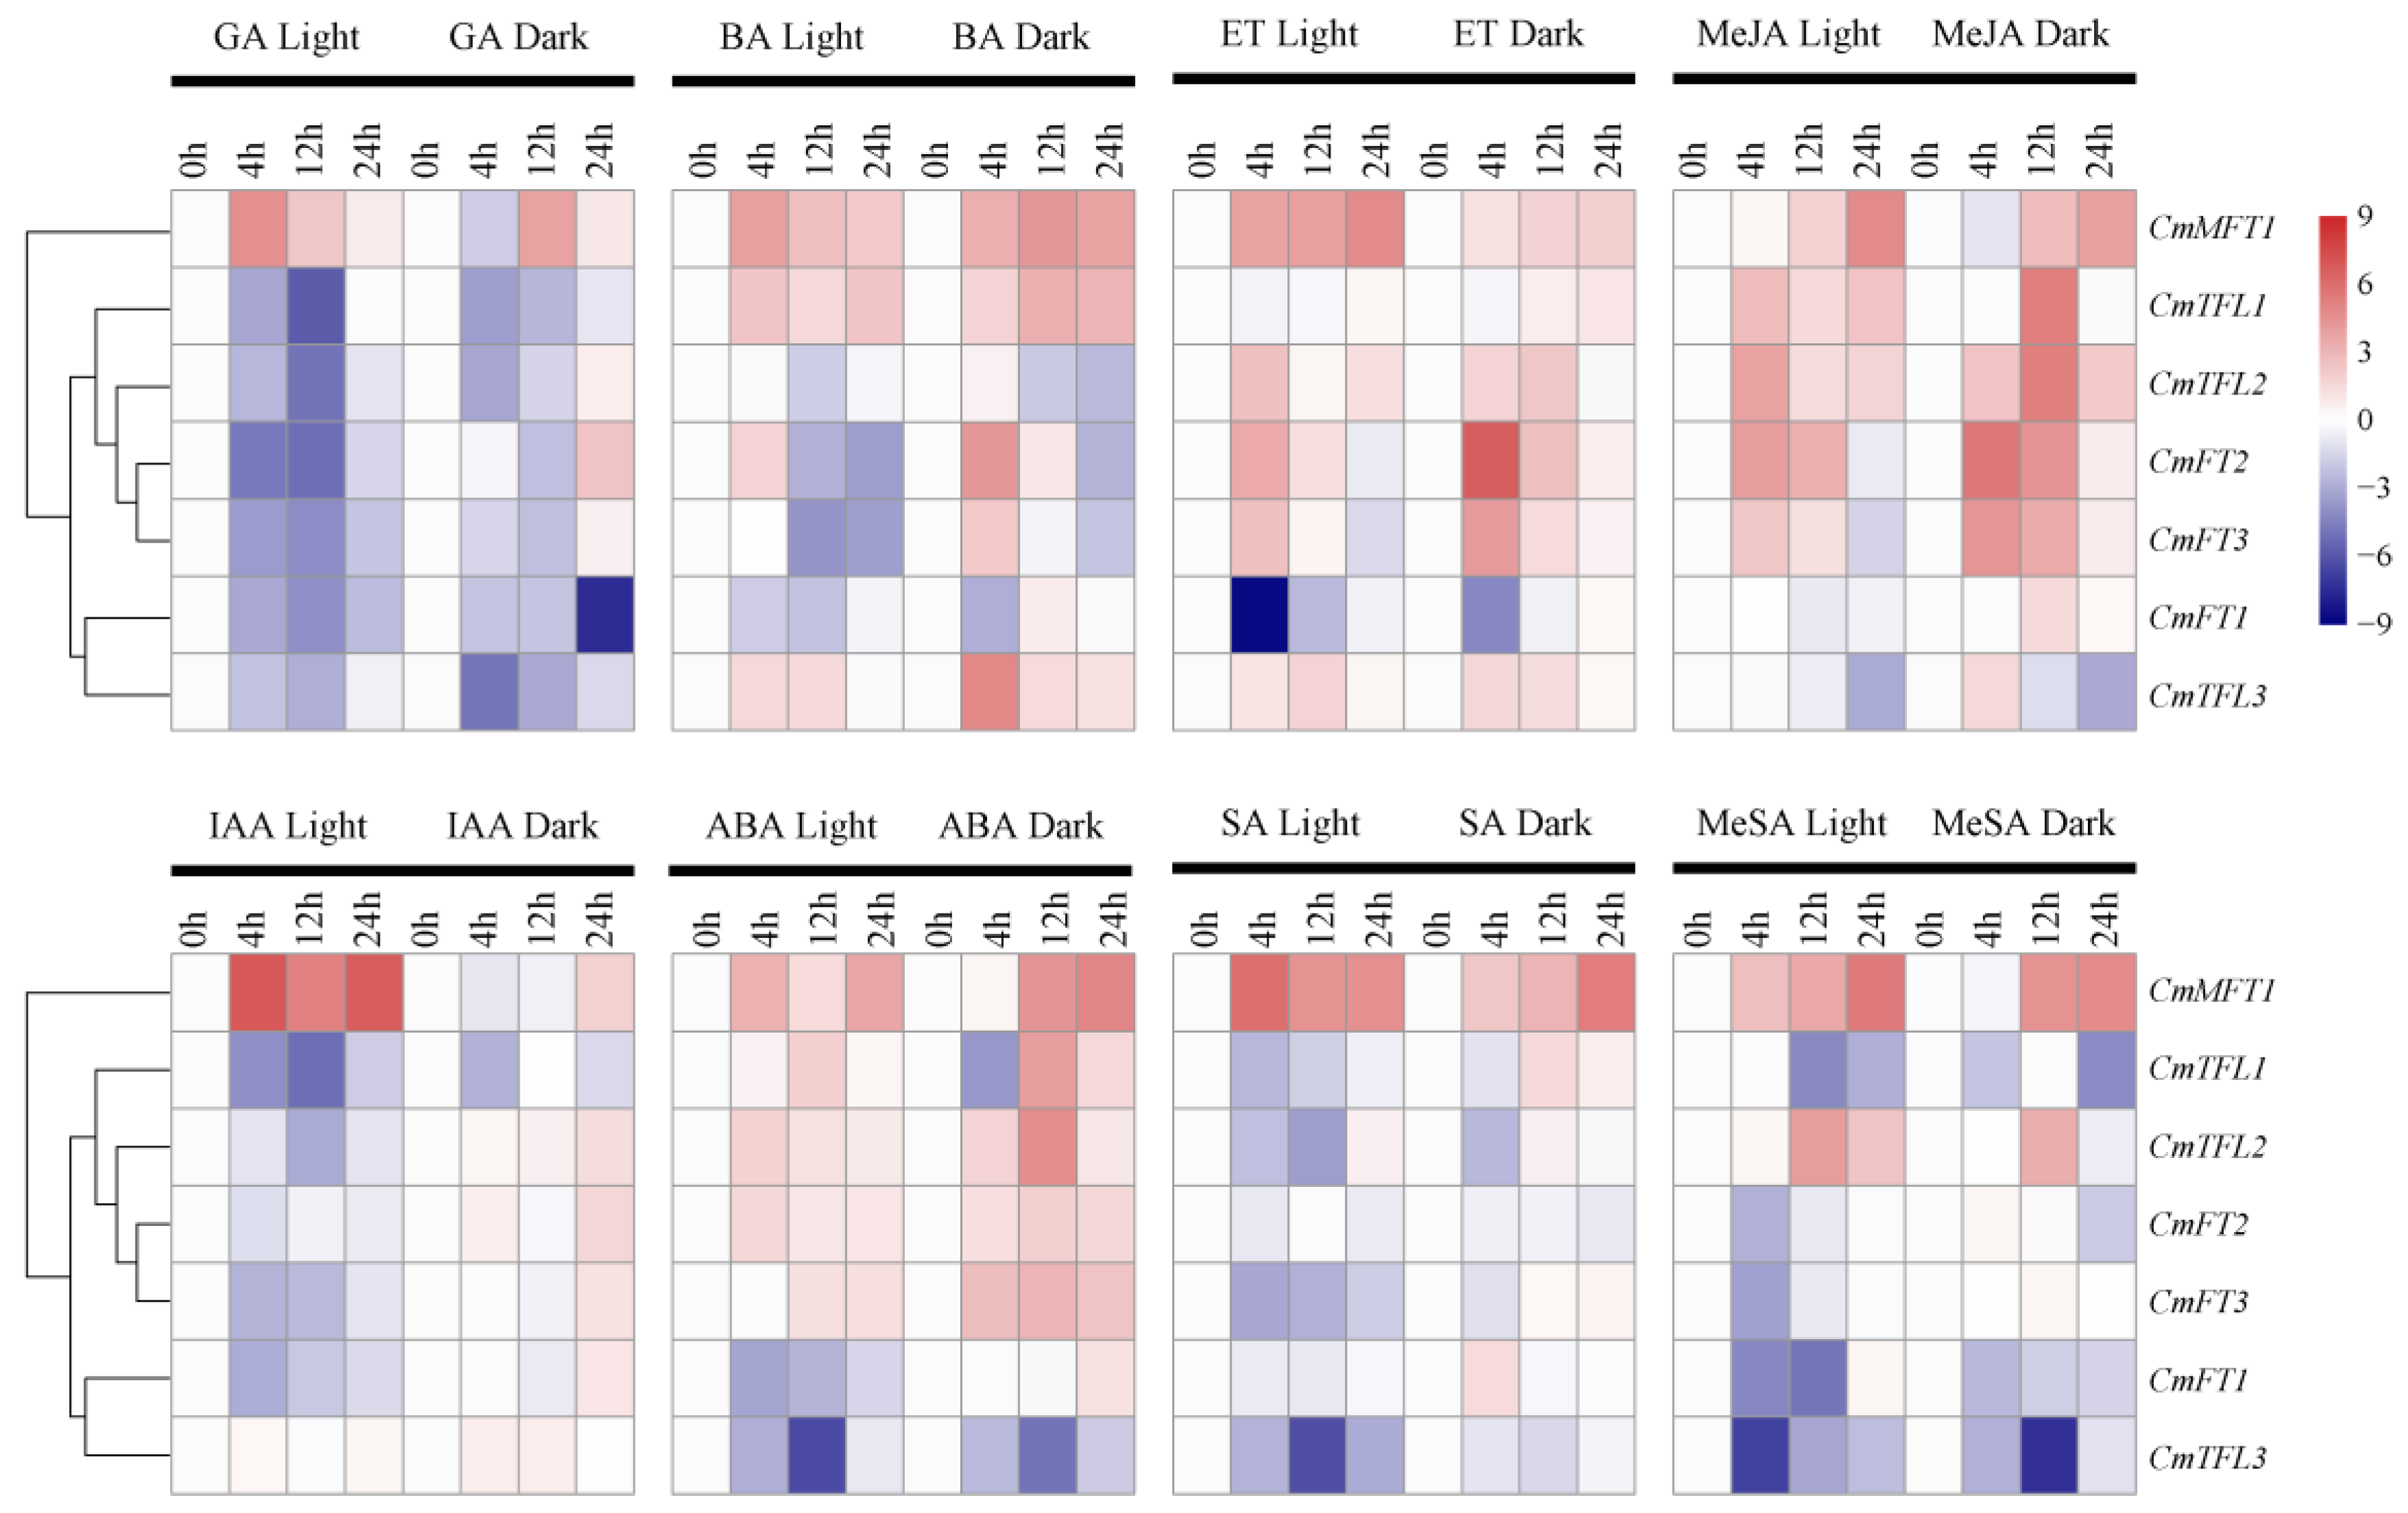
3.5. Differential CmPEBP Gene Expression under Hormone Treatments

Hormones play an important role in the flowering process of plants [42,43,44,72]. For example, the IAA content is significantly lower in early-spring-flowering plants than in unflowered plants, whereas the content of GA3 and ABA is higher [73]. To better understand the changes in the PEBP family genes in the Chrysanthemum under hormone treatments, a qRT-PCR experiment was performed. Plant materials were divided into dark and light treatment groups, and they were subjected to various hormone treatments, such as IAA (100 μM), 6-BA (100 μM), GA (100 μM), ABA (100 μM), ET (100 μM), SA (100 μM), MeSA (100 μM), and MeJA (100 μM). The differential expression levels of the CmPEBP genes were observed under the hormone treatments (Figure 6).
GA plays an important role in one of the major flowering pathways—the GA pathway—and exogenous GA can promote flowering in various plants [74]. Exogenous GA3 could promote flower bud development and could finally improve the flowering quality of the tree peony [75]. Under GA stress (Figure 6 and Figure S5), only CmMFT1 was significantly upregulated during 24 h stress. In the light treatment group, almost all the expression levels of the CmPEBP genes dropped during the 24 h treatment period, with the same patterns of expression. They had the lowest regulation at 12 h, with a reduction of 7–50 times, followed by that at 4 h, and the lowest downregulation was at 24 h of GA treatment. In the dark treatment group, CmFT2, CmFT3, and CmTFL2 were initially downregulated after GA stress, and then their expression increased with time (at 24 h). The remaining three genes (CmFT1, CmTFL1, and CmTFL3) were downregulated to varying degrees, especially CmFT1, as it was downregulated at least 170 fold at 24 h of GA stress. Overall, the CmPEBP genes were downregulated with the GA treatment except for CmMFT1.
Upon 6-BA treatment, the CmTFL2 and CmFT genes displayed similar expression patterns in the light treatment group, and all four genes were downregulated by 6-BA (Figure 6 and Figure S6). Simultaneously, the others (CmMFT1, CmTFL1, and CmTFL3) showed an upward trend under both the light and dark treatments. Among these, CmMFT1 was greatly influenced by 6-BA during 24 h stress, and CmTFL3 expression was at its maximum value at 4 h of dark treatment, reaching 30 times that of the control group. In addition, the expression levels of almost all the CmPEBP genes increased under the short-term 6-BA treatment.
Most of the genes in the Chrysanthemum, particularly CmFT2, CmFT3, CmMFT1, CmTFL2, and CmTFL3, were upregulated after ET stress in both the light and dark treatments (Figure 6 and Figure S7). Among these, CmFT2 and CmFT3 had the same expression patterns; gene expression under the dark treatment was usually greater than that under the light treatment, showing the highest level at 4 h followed by that at 12 h. The CmFT1 gene was downregulated during the light and dark treatments, and the lowest levels were observed at 4 h in the light treatment group, dropping to 0.25% of the control group. Overall, ET had the effect of increasing the expression level.
Upon MeJA stress, the responses among the CmPEBP genes were different. In the dark treatment group, CmTFL3 slipped to 42.98% of the control group at 12 h and declined to 12.68% at 24 h, whereas the other six genes showed various degrees of upregulation (Figure 6 and Figure S8). The expression levels of CmTFL1 and CmTFL2 reached their highest values at 12 h of treatment, reaching about 40 times that of the control group, while that of CmFT2 and CmFT3 reached their highest values at 4 h. In the light treatment group, CmMFT1, CmTFL1, and CmTFL2 showed an upward trend, and CmMFT1 expression surged to 28 times that of the control group at 24 h.
IAA is a major growth hormone that stimulates plant growth in response to vernalization and has a dual function in flowering regulation [76]. Under the IAA treatment, CmTFL2 and three CmFT genes showed similar expression patterns: their expression levels showed varying degrees of decline in the light treatment group but were first reduced and then climbed to two–three times that of the control group at 24 h in the dark (Figure 6 and Figure S9). Meanwhile, CmMFT1 maintained a high expression level under the light treatment which was 30–100 times that of the control group. CmTFL1 was downregulated under exogenous IAA stress at 24 h, and the lowest level was observed at 12 h in the light treatment group. CmTFL3 displayed no significant changes in response to IAA at 24 h in both the dark and light treatment groups.
Controversy remains over the role played by exogenous ABA at present. It has been mostly related to water stress, and one report suggested that exogenous ABA delays the flowering time in Arabidopsis [77]. ABA can promote the transcriptional upregulation of florigen genes [78]. Several genes, notably CmMFT1, CmTFL2, CmFT2, and CmFT3, were upregulated after ABA stress in both the light and dark treatments (Figure 6 and Figure S10). In contrast, CmTFL3 transcription was suppressed by ABA in both the dark and light during 24 h stress. CmFT1 displayed different expression patterns: under light treatment, it was downregulated, but in the dark, it displayed no significant changes in its expression level compared with the control group. In contrast, ABA stress upregulated most of the CmPEBP genes, except for CmFT1 and CmTFL3.
The application of exogenous SA affects many of the physiological processes of plants, including flowering; thus, SA is considered to be a new class of plant hormones. Since the 1990s, SA has been studied as a signaling molecule required for plant responses to stress [79]. Expression under the SA treatment was different from that under the ET and ABA treatments (Figure 6 and Figure S11). Among the seven genes, only the CmMFT1 gene was highly upregulated; a 60-fold increase in the expression level occurred at 4 h in the light treatment group, and it surged from 12 times compared with the control group (first 12 h) to 40 times at 24 h in the dark. CmFT3 and the CmTFLs were suppressed in the light treatment group, especially CmTFL3, as it showed a 70-fold lower expression level after SA stress at 12 h. In the dark treatment group, they were downregulated by SA stress at 4 h but showed no significant changes compared with the control group after that time point. CmFT1 and CmFT2 displayed no significant changes in response to SA in both the light and dark treatment groups.
Gene expression under the MeSA treatment was comparable with that under the SA treatment, and only CmMFT1 and CmTFL2 exhibited highly sensitive upregulation in both the light and dark treatment groups (Figure 6 and Figure S12). The upregulation of CmMFT1 was more sensitive than that of CmTFL2, showing 44-fold higher expression in the light treatment group than in the control group at 24 h. Among the low expression genes, CmTFL3 dropped to 0.96% of the control group under the light treatment at 4 h, and it slipped from 14.78% of the control group to 0.64% at 12 h.

4. Discussions

PEBPs play an important role in the flowering time of higher plants [1,2]. Plant endogenous hormones are major internal influencing factors that participate in the flowering time of higher plants [41,42,43,44]. Although extensive studies have been performed, knowledge of flowering time control is limited. Therefore, it is meaningful to study the relationship between PEBP family genes and endogenous hormones. Due to the complexity of polyploid plants and the deficiency of the genome of the Hangzhou White Chrysanthemum, knowledge on the CmPEBP family genes has remained relatively backward, which is similar to wheat [46,47,48,50]. In the present study, nine full-length CmPEBP coding genes were identified through homology studies using bioinformatics methods, and the results were consistent with the results of other species [3,4,7,9,18,19], all of which contain three subfamilies: MFT-like, TFL-like, and FT-like genes. These results agreed with those of other plants, indicating that the PEBP genes are conserved among species [3,4,18,19]. DPDxP and GxHR, which were found in the FT-like and TFL-like subfamilies, are considered to be two highly conserved characteristic short motifs of PEBPs [31,32]. Except for in the nonflowering plants (P. patens and S. moellendorffii), these sequences can be classified into three subfamilies, including A, B, and C. Most of the CmPEBP family genes were predicted to be located in the cytoplasm, nucleus, and chloroplast. Hou et al. [28] found that the FT protein was localized in the cellular endoplasmic reticulum. However, with the improvement and perfection of the Chrysanthemum genome database, further research is warranted on CmPEBPs, such as research on chromosomal localization and the exon–intron organization of the corresponding CmPEBP genes.
For group A, FT-like genes are an early target gene for CONSTANS (CO) activation, and their expression is activated by the direct transcription of CO induced by the photoperiod [15,80]. Long- and short-day plants perceive light signals through their leaves under the appropriate photoperiods, and then the CO protein initiates the activation of the FT gene in the leaves [15,26,80]. The FT protein is then transferred from the phloem to the SAM and activates flowering locus D (FD) gene expression in the SAM [8,26,35]. The expression of floral-meristem-specific genes, such as AP1, LFT, and, SOC1, is jointly activated by the FT and FD proteins, forming a protein complex that causes flowering [26,35,80]. To date, Arabidopsis contains two paralogous FT-like genes, AtFT and AtTSF, whereas rice contains eleven paralogous FT-like genes, OsFT1 to OsFT11 [3,20]. In the present study, a similar number of CmFTs were isolated and identified, including CmFT1 to CmFT3. The FT-like genes also changed in two directions: one was to reduce the number of redundant members (dicotyledons), and the other was to increase the number of members (monocotyledons). The FT-like genes were more conservative in dicotyledons and were more diverse in monocotyledons, and they could be divided into three subgroups [3,20]. From the evolutionary tree, it can be clearly found that monocotyledons have more than 10 FT proteins at a higher level of classification and that they have all the member types of group A, whereas dicotyledons usually have only 1–2 FT proteins and only 1 of the member types of group A. FT-like genes plays an important role not only in the transformation and development of flowers but also in the regulation of tuber formation, seed germination, bud germination, branching, and stomatal opening [43,44]. More research may be needed in monocotyledonous plants.
For group B, TFL1 prolonged vegetative growth in Arabidopsis by maintaining the infinity of the SAM, thus delaying reproductive growth [16,24,28,35]. Conti et al. [43] showed that TFL-like proteins are synthesized in the leaves and are transported to the SAM to inhibit the expression of floral-meristem-specific genes such as AP1, LFT, and SOC1. TFL-like proteins are also encoded by multiple genes in all plant species. There are three TFL-like members in Arabidopsis and four TFL-like members in rice [3,9]. In this study, the number of TFL-like members in the plants was 3–5 with no significant difference except for in soybean. Four CmTFL isoforms were confirmed and sequenced through qRT-PCR amplification in the Hangzhou White Chrysanthemum. The proposed consensus sequences DPPxP and GxHR were also highly conserved in the TFL-like subfamily (Figure 2 and Figures S1 and S2). We also found the conserved amino acid residues that interacted with 14-3-3 proteins, which were consistent with previous studies [18,20,23,31]. Two highly conserved amino acid sequences (LGRQTVYAPGWRQN and the LYN triad), which are closely related to FT activity and FT/TFL1 function [18,31], were also confirmed. After comparing all the sequences of the LYN triad, the conserved sequences were mainly LYNL or IYNL in the FT-like subfamily and ENxL in the TFL-like subfamily. These differences might be related to FT-like and TFL-like functions, and could also be used to distinguish, identify, and group PEBP members.
For group C, the MFT-like subfamily is the ancestor of the FT-like and TFL1-like subfamilies [17,19]. MFT-like genes play a significant role in seed germination and development [17]. The function of FT-like genes is to promote flowering and floral organ development, whereas that of TFL-like genes is inhibitory, and MFT-like genes perform the functions of simultaneous promotion and inhibition [23,31]. Four and two MFT homologous genes were found in mosses and ferns, respectively, but no FT-like or TFL-like homologous genes were found [3,20]. It was observed that, different from the FT-like and TFL-like subfamilies, the MFT-like subfamily still exists in nonflowering plants. In this study, two to three MFT-like members were present in dicotyledons, whereas the number was lower in monocotyledons (except for in maize). Two CmMFT isoforms were confirmed and sequenced in the Hangzhou White Chrysanthemum. Plants with many FT-like members have fewer MFT-like members [18,31]. The MFT-like subfamily may be the evolutionary source of the FT-like and TFL-like subfamilies, and its differentiation might have occurred when flowering plants appeared. Meanwhile, the evolutionary rate of the FT-like subfamily was faster than that of the TFL-like subfamily. The proposed consensus sequences DPPxP and GxHR were only partially conserved in the MFT-like subfamily (Figure 2 and Figure S3). The conserved amino acid residues that interact with 14-3-3 proteins were not present, which was inconsistent with previous studies [18,20,23,31]. Similarly, no conservation was found in the equivalent position of the MFT-like subfamily after comparing all the sequences of the LYN triad (Figures S1–S3). In summary, the diversified sequence may be related to the binding of the substrate in all PEBPs, and, thus, more studies are needed to clarify this relationship.
In the present study, the expression levels of nine CmPEBP genes during the vegetative and reproductive growth stages were analyzed in the Hangzhou White Chrysanthemum tissues, and the expression levels varied greatly depending on the tissue type. The expression levels of the CmPEBP genes, such as CmTFL1, CmTFL2, CmFT2, CmFT3, and CmMFT2, were higher in the petiole and shoot apex tissues during the vegetative growth stage than during the reproductive growth stage. The CmPEBP genes (e.g., CmTFL1 and CmTFL2) might play a key role in delaying reproductive growth. However, the expression levels of the CmPEBP genes, such as CmFT1, CmTFL3, CmTFL4, and CmMFT1, were lower in the shoot apex tissues during the vegetative growth stage than during the reproductive growth stage. From these results, FT proteins and CmFT1 mRNA, which were synthesized in the stems and leaves, might have been transported to the SAM to bind FD to activate the expression of floral-meristem-specific genes, though more research is needed to prove this conjecture.
The temperature affects the flowering time by influencing the development rate and vernalization [39], and high temperatures reduce or delay flowering in the Chrysanthemum [38]. Thus, we identified candidate genes that may play important roles in response to low and high temperatures. TFL-like gene expression, which delays reproductive growth, was upregulated under heat stress but was only temporarily upregulated under cold stress. The expression level of the FT-like genes was upregulated under low temperatures but did not show a significant difference under high temperatures compared with the control group. CmMFT1, which was upregulated at least five fold in response to heat and cold stress, might have a unique function in specific developmental stages [17,19,23,31]. These results confirmed that our classification of the CmPEBP family genes was correct.
In addition to the plant biological clock, the flowering process is controlled by plant endogenous hormones [42,43,44,72]. The IAA content of early-spring-flowering plants is significantly lower than that of unflowered plants, whereas the content of GA3 and ABA is higher [73]. The exogenous application of auxin and cytokinin is likely performed to supplement the content of endogenous hormones and to regulate their functions [45]. In the present study, the CmPEBP expression profiles were complex in response to eight exogenous hormones. For CmFT genes, the response patterns of different members to different hormones showed a certain degree of differentiation. Four hormones, GA, 6-BA, ET, and MeSA, inhibited CmFT1 expression to varying degrees under the light and dark treatments, whereas IAA, ABA, and SA could stimulate CmFT1 expression under the dark treatment. The expression patterns of CmFT2 and CmFT3 were similar, and their expression levels were upregulated after the ET, MeJA, and ABA treatments but were downregulated after the 6-BA, SA, and MeSA treatments. After treatment with GA and IAA, their expression was promoted in the light treatment group and was inhibited in the dark treatment group. For the CmTFL genes, the response patterns to different hormones were more differentiated than those of the CmFT genes, and they were less affected by the light and dark treatments. The GA, IAA, SA, and MeSA treatments inhibited CmTFL gene expression under the light and dark treatments. CmTFL2 and CmTFL3 gene expression could be activated with the ET treatment. After the MeJA and ABA treatments, the expression levels of CmTFL1 and CmTFL2 were upregulated, whereas that of CmTFL3 was downregulated. However, the 6-BA treatment could upregulate CmTFL1 and CmTFL3 gene expression and could inhibit CmTFL2 gene expression. Interestingly, all the hormones promoted the upregulation of CmMFT1 expression. The CmMFT1 expression level reached its highest value at 4 h of GA treatment and 24 h of MeJA, ABA, and MeSA treatment. After the ET, IAA, 6-BA, and SA treatments, gene expression in the light treatment group was upregulated by more than 10 times. Hence, the use of exogenous hormones can change the expression level of CmFTs and CmTFLs and can thereby promote or inhibit the flower bud differentiation and floral organ development of the Hangzhou White Chrysanthemum.

5. Conclusions

Nine CmPEBP genes, including three CmFTs, four CmTFLs, and two CmMFTs, were identified through comparative genomics analyses in the Hangzhou White Chrysanthemum. Furthermore, gene structure, physical and biochemical property, phylogenetic relationship, and conserved motif analyses on the CmPEBP family were conducted. They contained the PBP (PF01161) domain belonging to PEBPs and were phylogenetically clustered into three subfamilies: MFT-like, TFL-like, and FT-like genes. Each CmPEBP showed tissue-specific expression patterns, although the level of expression varied greatly. The TFL-like genes, which delay reproductive growth, were upregulated under heat stress. Instead, FT-like gene expression was upregulated under low temperatures. Based on the study of their expression patterns, we identified candidate genes that might play important roles in response to exogenous multihormone stress. CmFT1 expression could be inhibited with the GA, 6-BA, ET, and MeSA treatments but could be activated with the IAA, ABA, and SA treatments in the dark, whereas the expression levels of CmFT2 and CmFT3 were upregulated after the ET, MeJA, and ABA treatments but were downregulated after the 6-BA, SA, and MeSA treatments. The GA, IAA, SA, and MeSA treatments inhibited CmTFL gene expression under the light and dark treatments. Our results provide a solid foundation for the further understanding of the role that PEBPs play in flowering and floral organ development and will provide the basis for future research on the functional characterization of the CmPEBP family in response to exogenous hormone stressors.

Supplementary Materials

The following supporting information can be downloaded at https://www.mdpi.com/article/10.3390/agriculture13020374/s1, Table S1: RT-PCR of primers of CmPEBP genes; Table S2: qRT-PCR of primers of CmPEBP genes; Table S3: Comparison of the 9 CmPEBP ORFs and putative amino acid sequences; Figure S1: Predicted amino acid sequence alignment and phylogenetic tree of the CmFTs with the FT-like genes of other plant species; Figure S2: Predicted amino acid sequence alignment and phylogenetic tree of the CmTFLs with the TFL-like genes of other plant species; Figure S3: Predicted amino acid sequence alignment and phylogenetic tree of the CmMFTs with the MFT-like genes of other plant species; Figure S4: Tissue-specific expression profiles of CmPEBPs; Figure S5: Expression profiles of CmPEBP genes in Chrysanthemum leaves under GA stressors; Figure S6: Expression profiles of CmPEBP genes in Chrysanthemum leaves under BA stressors; Figure S7: Expression profiles of CmPEBP genes in Chrysanthemum leaves under ET stressors; Figure S8: Expression profiles of CmPEBP genes in Chrysanthemum leaves under MeJA stressors; Figure S9: Expression profiles of CmPEBP genes in Chrysanthemum leaves under IAA stressors; Figure S10: Expression profiles of CmPEBP genes in Chrysanthemum leaves under ABA stressors; Figure S11: Expression profiles of CmPEBP genes in Chrysanthemum leaves under SA stressors; Figure S12: Expression profiles of CmPEBP genes in Chrysanthemum leaves under MeSA stressors.

Author Contributions

C.P. performed the majority of the experiments and conducted the data analysis; C.P., X.H., S.S., and L.Z. prepared and wrote the manuscript; C.P., X.H., L.Z., and S.S. participated in sample collection; X.H., L.Z., and S.S. were involved in the preparation of the RNA samples for the transcriptome data analysis. C.P., M.W., and B.H. designed this study. All authors have read and agreed to the published version of the manuscript.

Funding

This research was funded by the Zhejiang Provincial Key Research and Development Program of China (grant number: 2020C02026), the National Natural Science Foundation of China (grant number: 32072626 and 32001910), the Zhejiang Provincial Fundamental and Public Welfare of China (grant number: LGN20C140005), the Fundamental Research Funds for the Provincial Universities of Zhejiang (grant number: 2022YW10), the Project of Innovation and Entrepreneurship Training for National Undergraduates (grant number: 202110356040), the Scientific Research Program for the students of China Jiliang University (grant number: 2022X25107).

Institutional Review Board Statement

Not applicable.

Informed Consent Statement

Not applicable.

Data Availability Statement

The data presented in this study are available within the article.

Conflicts of Interest

No potential conflict of interest was reported by the authors.

References

  1. Eshed, Y.; Lippman, Z.B. Revolutions in agriculture chart a course for targeted breeding of old and new crops. Science 2019, 366, eaax0025. [Google Scholar] [CrossRef] [PubMed]
  2. Khanouki, M.A.; Rezanejad, F.; Millar, A.A. Sequence and functional analysis of a TERMINAL FLOWER 1 homolog from Brassica juncea: A putative biotechnological tool for flowering time adjustment. GM Crops Food 2020, 11, 79–92. [Google Scholar] [CrossRef]
  3. Wang, Z.; Zhou, Z.; Liu, Y.; Liu, T.; Li, Q.; Ji, Y.; Li, C.; Fang, C.; Wang, M.; Wu, M.; et al. Functional evolution of phosphatidylethanolamine binding proteins in soybean and Arabidopsis. Plant Cell 2015, 27, 323–336. [Google Scholar] [CrossRef]
  4. Zheng, X.; Wu, F.; Zhang, X.; Lin, Q.; Wang, J.; Guo, X.; Lei, C.; Cheng, Z.; Zou, C.; Wan, J. Evolution of the PEBP gene family and selective signature on FT-like clade. J. Syst. Evol. 2016, 54, 502–510. [Google Scholar] [CrossRef]
  5. Schoentgen, F.; Jollès, P. From structure to function: Possible biological roles of a new widespread protein family binding hydrophobic ligands and displaying a nucleotide binding site. FEBS Lett. 1995, 369, 22–26. [Google Scholar] [CrossRef] [PubMed]
  6. Argiriou, A.; Michailidis, G.; Tsaftaris, A.S. Characterization and expression analysis of TERMINAL FLOWER1 homologs from cultivated alloteraploid cotton (Gossypium hirsutum) and its diploid progenitors. J. Plant Physiol. 2008, 165, 1636–1646. [Google Scholar] [CrossRef] [PubMed]
  7. Danilevskaya, O.N.; Meng, X.; Hou, Z.; Ananiev, E.V.; Simmons, C.R. A genomic and expression compendium of the expanded PEBP gene family from maize. Plant Physiol. 2008, 146, 250–264. [Google Scholar] [CrossRef]
  8. Corbesier, L.; Vincent, C.; Jang, S.; Fornara, F.; Fan, Q.; Searle, I.; Giakountis, A.; Farrona, S.; Gissot, L.; Turnbull, C.; et al. FT protein movement contributes to long-distance signaling in floral induction of Arabidopsis. Science 2007, 316, 1030–1033. [Google Scholar] [CrossRef]
  9. Tamaki, S.; Matsuo, S.; Wong, H.L.; Yokoi, S.; Shimamoto, K. Hd3a protein is a mobile flowering signal in rice. Science 2007, 316, 1033–1036. [Google Scholar] [CrossRef]
  10. Lifschitz, E.; Eviatar, T.; Rozman, A.; Shalit, A.; Goldshmidt, A.; Amsellem, Z.; Alvarez, J.P.; Eshed, Y. The tomato FT ortholog triggers systemic signals that regulate growth and flowering and substitute for diverse environmental stimuli. Proc. Natl. Acad. Sci. USA 2006, 103, 6398–6403. [Google Scholar] [CrossRef] [Green Version]
  11. Yoo, S.J.; Chung, K.S.; Jung, S.H.; Yoo, S.Y.; Lee, J.S.; Ahn, J.H. BROTHER OF FT AND TFL1 (BFT) has TFL1-like activity and functions redundantly with TFL1 in inflorescence meristem development in Arabidopsis. Plant J. 2010, 63, 241–253. [Google Scholar] [CrossRef] [PubMed]
  12. Hanano, S.; Goto, K. Arabidopsis TERMINAL FLOWER1 is involved in the regulation of flowering time and inflorescence development through transcriptional repression. Plant Cell 2011, 23, 3172–3184. [Google Scholar] [CrossRef] [PubMed]
  13. Bradley, D.; Ratcliffe, O.; Vincent, C.; Carpenter, R.; Coen, E. Inflorescence commitment and architecture in Arabidopsis. Science 1997, 275, 80–83. [Google Scholar] [CrossRef]
  14. Bradley, D.; Carpenter, R.; Copsey, L.; Vincent, C.; Rothstein, S.; Coen, E. Control of inflorescence architecture in Antirrhinum. Nature 1996, 379, 791–797. [Google Scholar] [CrossRef]
  15. Yano, M.; Kojima, S.; Takahashi, Y.; Lin, H.; Sasaki, T. Genetic control of flowering time in rice, a short-day plant. Plant Physiol. 2001, 127, 1425–1429. [Google Scholar] [CrossRef] [PubMed]
  16. Kralemann, L.E.M.; Scalone, R.; Andersson, L.; Hennig, L. North European invasion by common ragweed is associated with early flowering and dominant changes in FT/TFL1 expression. J. Exp. Botany 2018, 69, 2647–2658. [Google Scholar] [CrossRef]
  17. Tao, Y.B.; Luo, L.; He, L.L.; Ni, J.; Xu, Z.F. A promoter analysis of MOTHER OF FT AND TFL1 1 (JcMFT1), a seed-preferential gene from the biofuel plant Jatropha curcas. J. Plant Res. 2014, 127, 513–524. [Google Scholar] [CrossRef]
  18. Yang, Z.; Chen, L.; Kohnen, M.V.; Xiong, B.; Zhen, X.; Liao, J.; Oka, Y.; Zhu, Q.; Gu, L.; Linet, C.; et al. Identification and characterization of the PEBP family genes in moso bamboo (Phyllostachys heterocycla). Sci. Rep. 2019, 9, 14998. [Google Scholar] [CrossRef]
  19. Hedman, H.; Kallman, T.; Lagercrantz, U. Early evolution of the MFT-like gene family in plants. Plant Mol. Biol. 2009, 70, 359–369. [Google Scholar] [CrossRef]
  20. Wang, M.; Tan, Y.; Cai, C.; Zhang, B. Identification and expression analysis of phosphatidy ethanolamine-binding protein (PEBP) gene family in cotton. Genomics 2019, 111, 1373–1380. [Google Scholar] [CrossRef]
  21. Kardailsky, I.; Shukla, V.K.; Ahn, J.H.; Dagenais, N.; Christensen, S.K.; Nguyen, J.T.; Chory, J.; Harrison, M.J.; Weigel, D. Activation tagging of the floral inducer FT. Science 1999, 286, 1962–1965. [Google Scholar] [CrossRef]
  22. Cao, K.; Cui, L.; Zhou, X.; Ye, L.; Zou, Z.; Deng, S. Four tomato FLOWERING LOCUS T-Like proteins act antagonistically to regulate floral initiation. Front Plant Sci. 2016, 6, 1213. [Google Scholar] [CrossRef]
  23. Zhang, X.; Wang, C.; Pang, C.; Wei, H.; Wang, H.; Song, M.; Fan, S.; Yu, S. Characterization and Functional Analysis of PEBP Family Genes in Upland Cotton (Gossypium hirsutum L.). PLoS ONE 2016, 11, e0161080. [Google Scholar] [CrossRef]
  24. Sato, H.; Heang, D.; Sassa, H.; Koba, T. Identification and characterization of FT/TFL1 gene family in cucumber. Breed. Sci. 2009, 59, 3–11. [Google Scholar] [CrossRef]
  25. Mohamed, R.; Wang, C.-T.; Ma, C.; Shevchenko, O.; Dye, S.J.; Puzey, J.R.; Etherington, E.; Sheng, X.; Meilan, R.; Strauss, S.H.; et al. Populus CEN/TFL1 regulates first onset of flowering, axillary meristem identity and dormancy release in Populus. Plant J. 2010, 62, 674–688. [Google Scholar] [CrossRef]
  26. Kojima, S.; Takahashi, Y.; Kobayashi, Y.; Monna, L.; Sasaki, T.; Araki, T.; Yano, M. Hd3a, a rice ortholog of the Arabidopsis FT gene, promotes transition to flowering downstream of Hd1 under short-day conditions. Plant Cell Physiol. 2002, 43, 1096–1105. [Google Scholar] [CrossRef] [PubMed]
  27. Chardon, F.; Damerval, C. Phylogenomic analysis of the PEBP gene family in cereals. J. Mol. Evolution 2005, 61, 579–590. [Google Scholar] [CrossRef] [PubMed]
  28. Hou, C.; Yang, C. Functional analysis of FT and TFL1 orthologs from orchid (Oncidium Gower Ramsey) that regulate the vegetative to reproductive transition. Plant Cell Physiol. 2009, 50, 1544–1557. [Google Scholar] [CrossRef] [PubMed]
  29. Schiessl, S.V.; Huettel, B.; Kuehn, D.; Reinhardt, R.; Snowdon, R.J. Flowering time gene variation in Brassica species shows evolutionary principles. Front Plant Sci. 2017, 8, 1742. [Google Scholar] [CrossRef]
  30. Muhammad, N.; Khurram, S.; Saddam, S.; Asim, S.; Nasrullah; Muhammad, Y.; Muhammad, I.A. The Solanum melongena COP1LIKE manipulates fruit ripening and flowering time in tomato (Solanum lycopersicum). Plant Growth Regul. 2022, 96, 369–382. [Google Scholar]
  31. Karlgren, A.; Gyllenstrand, N.; Källman, T.; Sundström, J.F.; Moore, D.; Lascoux, M.; Lagercrantz, U. Evolution of the PEBP gene family in plants: Functional diversification in seed plant evolution. Plant Physiol. 2011, 156, 1967–1977. [Google Scholar] [CrossRef] [Green Version]
  32. Banfield, M.J.; Brady, R.L. The structure of Antirrhinum centroradialis protein (CEN) suggests a role as a kinase regulator. J. Mol. Biol. 2000, 297, 1159–1170. [Google Scholar] [CrossRef] [PubMed]
  33. Johnson, M.A.; Harper, J.F.; Palanivelu, R. A fruitful journey: Pollen tube navigation from germination to fertilization. Annu Rev. Plant Biol. 2019, 70, 809–837. [Google Scholar] [CrossRef] [PubMed]
  34. Hanzawa, Y.; Money, T.; Bradley, D. A single amino acid converts a repressor to an activator of flowering. Proc. Natl. Acad. Sci. USA. 2005, 102, 7748–7753. [Google Scholar] [CrossRef] [PubMed]
  35. Ahn, J.H.; Miller, D.; Winter, V.J.; Banfield, M.J.; Lee, J.H.; Yoo, S.Y.; Henz, S.R.; Brady, R.L.; Weigel, D. A divergent external loop confers antagonistic activity on floral regulators FT and TFL1. EMBO J. 2006, 25, 605–614. [Google Scholar] [CrossRef]
  36. Pin, P.A.; Benlloch, R.; Bonnet, D.; Wremerth-Weich, E.; Kraft, T.; Gielen, J.J.L.; Nilssonet, O. An antagonistic pair of FT homologs mediates the control of flowering time in sugar beet. Science 2010, 330, 1397–1400. [Google Scholar] [CrossRef]
  37. Okada, M. Classification of chrysanthemum varieties in view of their enivronmental responses to flowering. J. Jpn. Soc. Hortic. Sci. 1957, 26, 59–72. [Google Scholar] [CrossRef]
  38. Amasino, R. Seasonal and developmental timing of flowering. Plant J. 2010, 61, 1001–1013. [Google Scholar] [CrossRef]
  39. Kazan, K.; Lyons, R. The link between flowering time and stress tolerance. J. Exp. Botany 2016, 67, 47–60. [Google Scholar] [CrossRef]
  40. Li, J.; Li, C.; Smith, S.M. Hormone Metabolism and Signaling in Plants. J. Exp. Botany 2016, 67, 47–60. [Google Scholar]
  41. Santner, A.; Estelle, M. Recent advances and emerging trends in plant hormone signalling. Nature 2009, 459, 1071–1078. [Google Scholar] [CrossRef] [PubMed]
  42. Wolters, H.; Jürgens, G. Survival of the flexible: Hormonal growth control and adaptation in plant development. Nat. Rev. Genet. 2009, 10, 305–317. [Google Scholar] [CrossRef]
  43. Conti, L. Hormonal control of the floral transition: Can one catch them all? Dev. Biol. 2017, 430, 288–301. [Google Scholar] [CrossRef]
  44. Bao, S.; Hua, C.; Shen, L.; Yu, H. New insights into gibberellin signaling in regulating flowering in Arabidopsis. J. Integr. Plant Biol. 2020, 62, 118–131. [Google Scholar] [CrossRef]
  45. Piotrowska-Niczyporuk, A.; Bajguz, A.; Kotowska, U.; Zambrzycka-Szelewa, E.; Sienkiewicz, A. Auxins and cytokinins regulate phytohormone homeostasis and thiol-mediated detoxification in the green alga acutodesmus obliquus exposed to lead stress. Sci. Rep. 2020, 10, 10193. [Google Scholar] [CrossRef] [PubMed]
  46. Kesawat, M.S.; Kherawat, B.S.; Singh, A.; Dey, P.; Routray, S.; Mohapatra, C.; Saha, D.; Ram, C.; Siddique, K.H.M.; Kumar, A.; et al. Genome-wide analysis and characterization of the proline-rich extensin-like receptor kinases (perks) gene family reveals their role in different developmental stages and stress conditions in wheat (Triticum aestivum L.). Plants 2022, 11, 496. [Google Scholar] [CrossRef] [PubMed]
  47. Ye, H.; Qiao, L.; Guo, H.; Guo, L.; Ren, F.; Bai, J.; Wang, Y. Genome-wide identification of wheat WRKY gene family reveals that TaWRKY75-A is referred to drought and salt resistances. Front. Plant Sci. 2021, 12, 663118. [Google Scholar] [CrossRef]
  48. Kesawat, M.S.; Kherawat, B.S.; Singh, A.; Dey, P.; Kabi, M.; Debnath, D.; Saha, D.; Khandual, A.; Rout, S.; Manorama; et al. Genome-wide identification and characterization of the brassinazole-resistant (BZR) gene family and its expression in the various developmental stage and stress conditions in wheat (Triticum aestivum L.). Int. J. Mol. Sci. 2021, 22, 8743. [Google Scholar]
  49. Zhu, T.; Liu, Y.; Ma, L.; Wang, X.; Zhang, D.; Han, Y.; Ding, Q.; Ma, L. Genome-wide identification, phylogeny and expression analysis of the SPL gene family in wheat. BMC Plant Biol. 2020, 20, 420. [Google Scholar] [CrossRef]
  50. Li, S.; Liu, Z.; Guo, L.; Li, H.; Nie, X.; Chai, S.; Zheng, W. Genome-wide identification of wheat ZIP gene family and functional characterization of the TaZIP13-B in plants. Front. Plant Sci. 2021, 12, 748146. [Google Scholar] [CrossRef]
  51. Shao, W.; Chen, W.; Zhu, X.; Zhou, X.; Jin, Y.; Zhan, C.; Liu, G.; Liu, X.; Ma, D.; Qiao, Y. Genome-wide identification and characterization of wheat 14-3-3 genes unravels the role of TaGRF6-A in salt stress tolerance by binding MYB transcription factor. Int. J. Mol. Sci. 2021, 22, 1904. [Google Scholar] [CrossRef] [PubMed]
  52. Guo, Z.; Zhang, W. Chrysanthemum—Flower Production Technology and Its Application Series; China Forestry Publishing House: Beijing, China, 2001. [Google Scholar]
  53. Li, H.; Huang, W.; Wang, G.; Wu, Z.; Zhuang, J. Expression profile analysis of ascorbic acid-related genes in response to temperature stress in the tea plant, Camellia sinensis (L.) O. Kuntze. Genet. Mol. Res. 2016, 15. [Google Scholar] [CrossRef] [PubMed]
  54. Zhang, S.; Chen, S.; Chen, F.; Teng, N.; Fang, W.; Guan, Z. Anatomical structure and gravitropic response of the creeping shoots of ground-cover chrysanthemum ‘Yuhuajinhua’. Plant Growth Regul. 2008, 56, 141. [Google Scholar] [CrossRef]
  55. Pan, C.; Tian, K.; Ban, Q.; Wang, L.; Sun, Q.; He, Y.; Yang, Y.; Pan, Y.; Li, Y.; Jiang, J.; et al. Genome-wide analysis of the biosynthesis and deactivation of gibberellin-dioxygenases gene family in Camellia sinensis (L.) O. Kuntze. Genes 2017, 8, 235. [Google Scholar] [CrossRef]
  56. Altschul, S.F.; Madden, T.L.; Schäffer, A.A.; Zhang, J.; Zhang, Z.; Miller, W.; Lipman, D.J. Gapped BLAST and PSI-BLAST: A new generation of protein database search programs. Nucleic Acids Res. 1997, 25, 3389–3402. [Google Scholar] [CrossRef]
  57. Thompson, J.D.; Gibson, T.J.; Plewniak, F.; Jeanmougin, F.; Higgins, D.G. The CLUSTAL_X windows interface: Flexible strategies for multiple sequence alignment aided by quality analysis tools. Nucleic Acids Res. 1997, 25, 4876–4882. [Google Scholar] [CrossRef]
  58. Yue, C.; Cao, H.; Wang, L.; Zhou, Y.; Hao, X.; Zeng, J.; Wang, X.; Yang, Y. Molecular cloning and expression analysis of tea plant aquaporin (AQP) gene family. Plant Physiol. Biochem. 2014, 83, 65–76. [Google Scholar] [CrossRef]
  59. Letunic, I.; Doerks, T.; Bork, P. SMART 7: Recent updates to the protein domain annotation resource. Nucleic Acids Res. 2012, 40, 302–305. [Google Scholar] [CrossRef]
  60. Finn, R.D.; Coggill, P.; Eberhardt, R.Y.; Eddy, S.R.; Mistry, J.; Mitchell, A.L.; Potter, S.C.; Punta, M.; Qureshi, M.; Sangrador-Vegas, A.; et al. The Pfam protein families database: Towards a more sustainable future. Nucleic Acids Res. 2016, 44, 279–285. [Google Scholar] [CrossRef]
  61. Johnson, M.; Zaretskaya, I.; Raytselis, Y.; Merezhuk, Y.; McGinnis, S.; Madden, T.L. NCBI BLAST: A better web interface. Nucleic Acids Res. 2008, 36, 5–9. [Google Scholar] [CrossRef] [PubMed]
  62. Wilkins, M.R.; Gasteiger, E.; Bairoch, A.; Sanchez, J.C.; Williams, K.L.; Appel, R.D.; Hochstrasser, D.F. Protein identification and analysis tools in the ExPASy server. Methods Mol. Biol. 1999, 112, 531–552. [Google Scholar] [PubMed]
  63. Horton, P.; Park, K.-J.; Obayashi, T.; Fujita, N.; Harada, H.; Adams-Collier, C.J.; Nakai, K. WoLF PSORT: Protein localization predictor. Nucleic Acids Res. 2007, 35, W585–W587. [Google Scholar] [CrossRef] [PubMed]
  64. Emanuelsson, O.; Brunak, S.; von Heijne, G.; Nielsen, H. Locating proteins in the cell using TargetP, SignalP and related tools. Nat. Protocols 2007, 2, 953–971. [Google Scholar] [CrossRef]
  65. Tamura, K.; Stecher, G.; Peterson, D.; Filipski, A.; Kumar, S. MEGA6: Molecular evolutionary genetics analysis version 6.0. Mol. Biol. Evol. 2013, 30, 725–2729. [Google Scholar] [CrossRef]
  66. Bailey, T.L.; Boden, M.; Buske, F.A.; Frith, M.; Grant, C.E.; Clementi, L.; Ren, J.; Li, W.E.; Nobleet, W.S. MEME SUITE: Tools for motif discovery and searching. Nucleic Acids Res. 2009, 37, W202–W208. [Google Scholar] [CrossRef]
  67. Hunter, S.; Apweiler, R.; Attwood, T.K.; Bairoch, A.; Bateman, A.; Binns, D.; Bork, P.; Das, U.; Daugherty, L.; Duquenne, L.; et al. InterPro: The integrative protein signature database. Nucleic Acids Res. 2009, 37, D211–D215. [Google Scholar] [CrossRef] [PubMed]
  68. Li, D.; Zaman, W.; Lu, J.; Niu, Q.; Zhang, X.; Ayaz, A.; Saqib, S.; Yang, B.; Zhang, J.; Zhao, H.; et al. Natural lupeol level variation among castor accessions and the upregulation of lupeol synthesis in response to light. Ind. Crop Prod. 2023, 192, 116090. [Google Scholar] [CrossRef]
  69. Livak, K.J.; Schmittgen, T.D. Analysis of relative gene expression data using real-time quantitative PCR and the 2(-Delta Delta C(T)) Method. Methods 2001, 25, 402–408. [Google Scholar] [CrossRef]
  70. Liao, W.Y.; Lin, L.F.; Lin, M.D.; Hsieh, S.C.; Li, A.Y.S.; Tsay, Y.S.; Chou, M.L. Overexpression of Lilium formosanumMADS-box (LFMADS) Causing Floral Defects While Promoting Flowering in Arabidopsis thaliana, Whereas only affecting floral transition time in Nicotiana tabacum. Int. J. Mol. Sci. 2018, 19, 2217. [Google Scholar] [CrossRef]
  71. Cho, L.H.; Yoon, J.; An, G. The control of flowering time by environmental factors. Plant J. 2017, 90, 708–719. [Google Scholar] [CrossRef]
  72. Campos-Rivero, G.; Osorio-Montalvo, P.; Sánchez-Borges, R.; Us-Camas, R.; Duarte-Aké, F.; De-la-Peña, C. Plant hormone signaling in flowering: An epigenetic point of view. J. Plant Physiol. 2017, 214, 16–27. [Google Scholar] [CrossRef]
  73. Yan, X.; Liu, J.; Wu, K.X.; Yang, N.; Pan, L.B.; Song, Y.; Liu, Y.; Tang, Z.H. Comparative analysis of endogenous hormones and metabolite profiles in early-spring flowering plants and unflowered plants revealing the strategy of blossom. J. Plant Growth Regul. 2022, 41, 2421–2434. [Google Scholar] [CrossRef]
  74. Wilson, R.N.; Heckman, J.W.; Somerville, C.R. Gibberellin is required for flowering in arabidopsis thaliana under short days. Plant Physiol. 1992, 100, 403–408. [Google Scholar] [CrossRef] [Green Version]
  75. Guan, Y.; Xue, J.; Xue, Y.; Yang, R.; Wang, S.; Zhang, X. Effect of exogenous GA_3 on flowering quality, endogenous hormones, and hormone- and flowering-associated gene expression in forcing-cultured tree peony (Paeonia suffruticosa). J. Integr. Agric. 2019, 18, 1295–1311. [Google Scholar] [CrossRef]
  76. Liang, N.; Cheng, D.; Liu, Q.; Cui, J.; Luo, C. Difference of proteomics vernalization-induced in bolting and flowering transitions of Beta vulgaris. Plant Physiol. Biochem. 2018, 123, 222–232. [Google Scholar] [CrossRef] [PubMed]
  77. Wang, Y.; Li, L.; Ye, T.; Lu, Y.; Chen, X.; Wu, Y. The inhibitory effect of ABA on floral transition is mediated by ABI5 in Arabidopsis. J. Exp. Botany 2013, 64, 675–684. [Google Scholar] [CrossRef] [PubMed]
  78. Riboni, M.; Test, A.; Galbiati, M.; Tonelli, C.; Conti, L. ABA-dependent control of GIGANTEA signalling enables drought escape via up-regulation of FLOWERING LOCUS T in Arabidopsis thaliana. J. Exp. Botany 2016, 67, 6309–6322. [Google Scholar] [CrossRef]
  79. Liu, Y.; Gong, F.; Zhao, X. Salicylic acid-mediated signal transduction pathway associated with stress resistance of plants. Chin. Agric. Sci. Bulletin. 2005, 21, 227–229. [Google Scholar]
  80. Böhlenius, H.; Huang, T.; Charbonnel-Campaa, L.; Brunner, A.M.; Jansson, S.; Strauss, S.H.; Nilssonet, O. CO/FT regulatory module controls timing of flowering and seasonal growth cessation in trees. Science 2006, 312, 1040–1043. [Google Scholar] [CrossRef] [Green Version]
Figure 1. Phylogenetic analysis of putative PEBP family proteins in Chrysanthemum.
Agriculture 13 00374 g001
Figure 2. Alignment of the predicted amino acid sequences for the CmPEBP and AtPEBP genes.
Agriculture 13 00374 g002
Figure 3. Conserved motif identification of PEBP proteins in Chrysanthemum and Arabidopsis. Interpro analysis revealed domains in previously defined PEBP proteins to be a part of phosphatidylethanolamine-binding protein family. De novo motif identification of PEBP proteins; motifs 1, 2, 3, 4, and 5 show resemblance to PBP (PF01161) domain.
Agriculture 13 00374 g003
Figure 4. Tissue-specific expression of CmPEBPs. CmPEBP transcript abundance in root, stem, leaf, petiole, and shoot apex tissues was analyzed using qRT-PCR. The results were calculated using the 2−ΔΔCt method and the CmEF housekeeping gene, and the average log2 values of three replicates were used to generate a heat map in R software. The intensity value bars are shown to the right of the heat maps. Bule represents low expression, white represents no significant difference in expression, and red denotes high expression.
Agriculture 13 00374 g004
Figure 5. Expression profiles of CmPEBP genes in Chrysanthemum leaves under heat (up) and cold stressors (down).
Agriculture 13 00374 g005
Figure 6. Expression profiles of CmPEBP genes in Chrysanthemum leaves under eight hormone treatments. Gene expression analyses were examined through qRT-PCR using cDNA from fifth and sixth mature leaves in Chrysanthemum after treatment with eight hormones for 0, 4, 12, and 24 h, respectively. The results were calculated using the 2−ΔΔCt method and the CmEF housekeeping gene, and the average log2 values of three replicates were used to generate a heat map in R software. The intensity value bars are shown to the right of the heat maps. Bule represents low expression, white represents no significant difference in expression, and red denotes high expression.
Agriculture 13 00374 g006
Table 1. The 9 CmPEBP genes in the Chrysanthemum morifolium.
Gene NamesAccession NosOpen Reading
Frame (bp)
Number of Deduced Amino Acid (aa)Molecular Weight (kDa)Subcellular Location (WoLF PSORT/TargetP)Theoretical pIGroups
CmFT1OP61727752517419.26chlo/cyto/nucl6.83Group A
CmFT2OP61727852517419.79cyto/chlo/nucl/mito8.64Group A
CmFT3OP61727952517419.52cyto/nucl/plas/chlo6.82Group A
CmTFL1OP61727150716819.04cyto/nucl8.96Group B
CmTFL2OP61727250416719.14cyto/nucl/extr9.39Group B
CmTFL3OP61727353117619.87cyto/chlo/vacu8.86Group B
CmTFL4OP61727452217319.44cyto8.93Group B
CmMFT1OP61727550716818.45cyto/cysk4.71Group C
CmMFT2OP61727652217318.99cyto/chlo6.83Group C
WoLF PSORT [63] and TargetP [64] were used to predict the subcellular localization of the 9 CmPEBP family genes; the most likely locations are listed. The abbreviation chlo represents chloroplast, cysk represents cytoskeleton, cyto represents cytoplasmic, extr represents extracell, mito represents mitochondrion, nucl represents nucleus, plas represents plasma membrane, and vacu represents vacuole. Groups were classified based on phylogenetic trees with their corresponding numbers in Arabidopsis and Z. mays.
Disclaimer/Publisher’s Note: The statements, opinions and data contained in all publications are solely those of the individual author(s) and contributor(s) and not of MDPI and/or the editor(s). MDPI and/or the editor(s) disclaim responsibility for any injury to people or property resulting from any ideas, methods, instructions or products referred to in the content.

