Article

Validation of Genome-Wide SSR Markers Developed for Genetic Diversity and Population Structure Study in Grain Amaranth (Amaranthus hypochondriacus)

1
Division of Genomic Resources, ICAR-National Bureau of Plant Genetic Resources, Pusa, New Delhi 110012, India
2
Division of Germplasm Evaluation, ICAR-National Bureau of Plant Genetic Resources, Pusa, New Delhi 110012, India
3
Division of Germplasm Conservation, ICAR-National Bureau of Plant Genetic Resources, Pusa, New Delhi 110012, India
4
International Crop Research Institute for the Semi-Arid Tropics, Hyderabad 502324, India
*
Author to whom correspondence should be addressed.
Agriculture 2023, 13(2), 431; https://doi.org/10.3390/agriculture13020431
Submission received: 27 December 2022 / Revised: 9 February 2023 / Accepted: 9 February 2023 / Published: 12 February 2023

Abstract

:
Grain Amaranth is the most promising C4 dicotyledonous pseudocereal and is distributed globally. It has an excellent nutritional profile and adaptability against a broad range of environmental factors. These traits have renewed the interest of researchers and breeders in exploring this underutilized orphan crop. The present study aimed to validate the genome-wide SSR to assess the genetic diversity among 94 Amaranthus hypochondriacus accessions using 57 genomic SSR (g-SSR) markers developed in-house. A total of 36 g-SSRs were recorded as polymorphic and amplified 138 alleles, with an average of 3.83 alleles per locus. Major allele frequency ranged from 0.29 to 0.98, with an average of 0.63 per marker. The expected heterozygosity ranged from 0.03 to 0.81, with an average of 0.46 per locus. Polymorphism information content (PIC) ranged from 0.03 to 0.79, with an average of 0.40, indicating a high level of polymorphism across amaranth accessions. Population structure analysis resulted into two major genetic clusters irrespective of their geographical origin, which suggests there may be sharing of common genomic regions across the accessions. High allelic frequency and heterozygosity levels indicate significant genetic variability in the germplasm, which can be further used in future breeding programs.

1. Introduction

Grain amaranth (Amaranthus spp.) is an underutilized, highly nutritious, cross-pollinated pseudocereal that belongs to the family Amaranthaceae, which comprises approximately 60–70 widely distributed species in wild as well as domesticated forms [1]. Since ancient times, a variety of amaranth species have been cultivated for their diverse use as leafy vegetables, grains, ornamentals, and forage crops [2]. Out of the known species, 55 are considered to have originated in the Americas, with the remaining species possibly being native to Europe, Asia, Africa, and Australia [3,4]. Amaranth represents immortality and derives its name from the Greek word “amarantos” because of its potential for growth and fulfillment, even in unfavorable environmental conditions. Amaranth has been proven to be more nutritious than our traditional staple food, rice, and it contains more than three times the average amount of calcium present in most common used cereals. It is also a rich source of iron, magnesium, phosphorus, and potassium [5]. Grain amaranth is recognized as a super grain, miracle grain, and grain of the future because of its high nutraceutical value. It has higher content of protein, unsaturated oils, dietary fibers, flavonoids, vitamins, and a well-balanced concentration of the essential amino acids, especially lysine, which ranges from 0.73 to 0.84 percent of the total seed protein content and is often considered as a limiting amino acid in other cereal grains [6,7,8]. Despite having a good-quality amino acid profile, amaranth protein is gluten-free, making it an excellent diet for patients who have coeliac disease [9]. The regular consumption of amaranth seed or seed oil provides a significant amount of vitamin E and squalene, which benefit people suffering from hypertension or cardiovascular disease by lowering blood pressure and cholesterol levels and improving antioxidant status [10,11]. Squalene has strong antioxidant properties that protect the skin from premature aging by preventing cell damage [12]. Worldwide recognition of amaranth as an excellent crop is due to its extraordinary nutrient profile, capacity to survive in extremely challenging eco-geographic conditions, and lack of any severe diseases [13,14]. Thus, due to the growing demand for food and rising malnutrition, development of amaranth as an alternative crop could prove to be a boon for developing nations that suffer from malnutrition and overpopulation.
Genetic diversity plays a significant role in the development of superior cultivars for crop improvement. Diversity in plant genetic resources provides an opportunity for plant breeders to develop improved cultivars with variable characteristics, including both farmer-preferred and breeder-preferred traits [15]. Diversity can be evaluated by using morphological, cytological, biochemical, and molecular markers. Previously, morphological markers were used for diversity analysis because they were naturally occurring variants of a particular plant species [16,17]. Afterward, differentiation occurs at the cytological and biochemical level in the genotypes of a particular species to be used in genetic diversity assessment [18,19]. With the rapid advancements in sequencing technologies and bioinformatics analysis in recent years, the development of molecular markers has become the method of choice for genetic diversity assessment because it was much easier and more cost-effective [20]. Therefore, evaluating genetic diversity using molecular markers gives more accurate, quick, and authentic results in less time. Among all molecular markers, simple sequence repeat (SSR) markers have been considered more reliable markers for genetic diversity analysis [21,22]. SSRs, also known as microsatellites, are short DNA sequences consisting of tandem repeats of 1-6 nucleotides and distributed in both coding and non-coding regions of the genome. They are highly polymorphic, multi-allelic, co-dominant, highly reproducible, transferable to related species, and easily detectable with polymerase chain reaction (PCR), making them suitable for the understanding genetic diversity in different plant species such as potato (Solanum tuberosum) [23], vetiver grass (Vetiveria zizanioides L. Nash) [24], rice (Oryza sativa) [25], drumstick (Moringa oleifera Lam.) [26], kala bhat (Glycine max (L.) Merrill) [27], Tinospora cordifolia [28], and guava (Psidium guajava L.) [29]. They are important in the construction of linkage maps, diversity assessment, marker-assisted selection, and identifying genetic relationships among closely related species [30,31,32].
To efficiently utilize plant genetic resources, it is necessary to evaluate genetic divergence among and within the crop species [33]. Amaranths exhibit high morphological diversity among their species and display versatile levels of adaptation to a wide range of environmental factors [34]. Different DNA markers have been employed over time for the analysis of intraspecific and interspecific diversity along with hereditary relationships among different species of amaranth due to their agro-economic importance. However, only a few molecular studies with well-established markers such as random amplified polymorphic DNAs (RAPDs) [35], restriction fragment length polymorphisms (RFLPs) [36], amplified fragment length polymorphisms (AFLPs) [37], single nucleotide polymorphisms (SNPs) [38] and simple sequence repeats (SSRs) [39,40,41] have been performed in Amaranthus species. Identification of potential genotypes for different breeding purposes requires an accurate evaluation of the genetic diversity and population structure of any germplasm to achieve the ultimate goal of sustainable agriculture. Therefore, the present investigation was undertaken to assess the informativeness of the g-SSR markers and screen them against 94 different accessions of Amaranth hypochondriacus, consisting of 92 indigenous and four exotic accessions from USA and Russia, to study their molecular diversity and population structure.

2. Materials and Methods

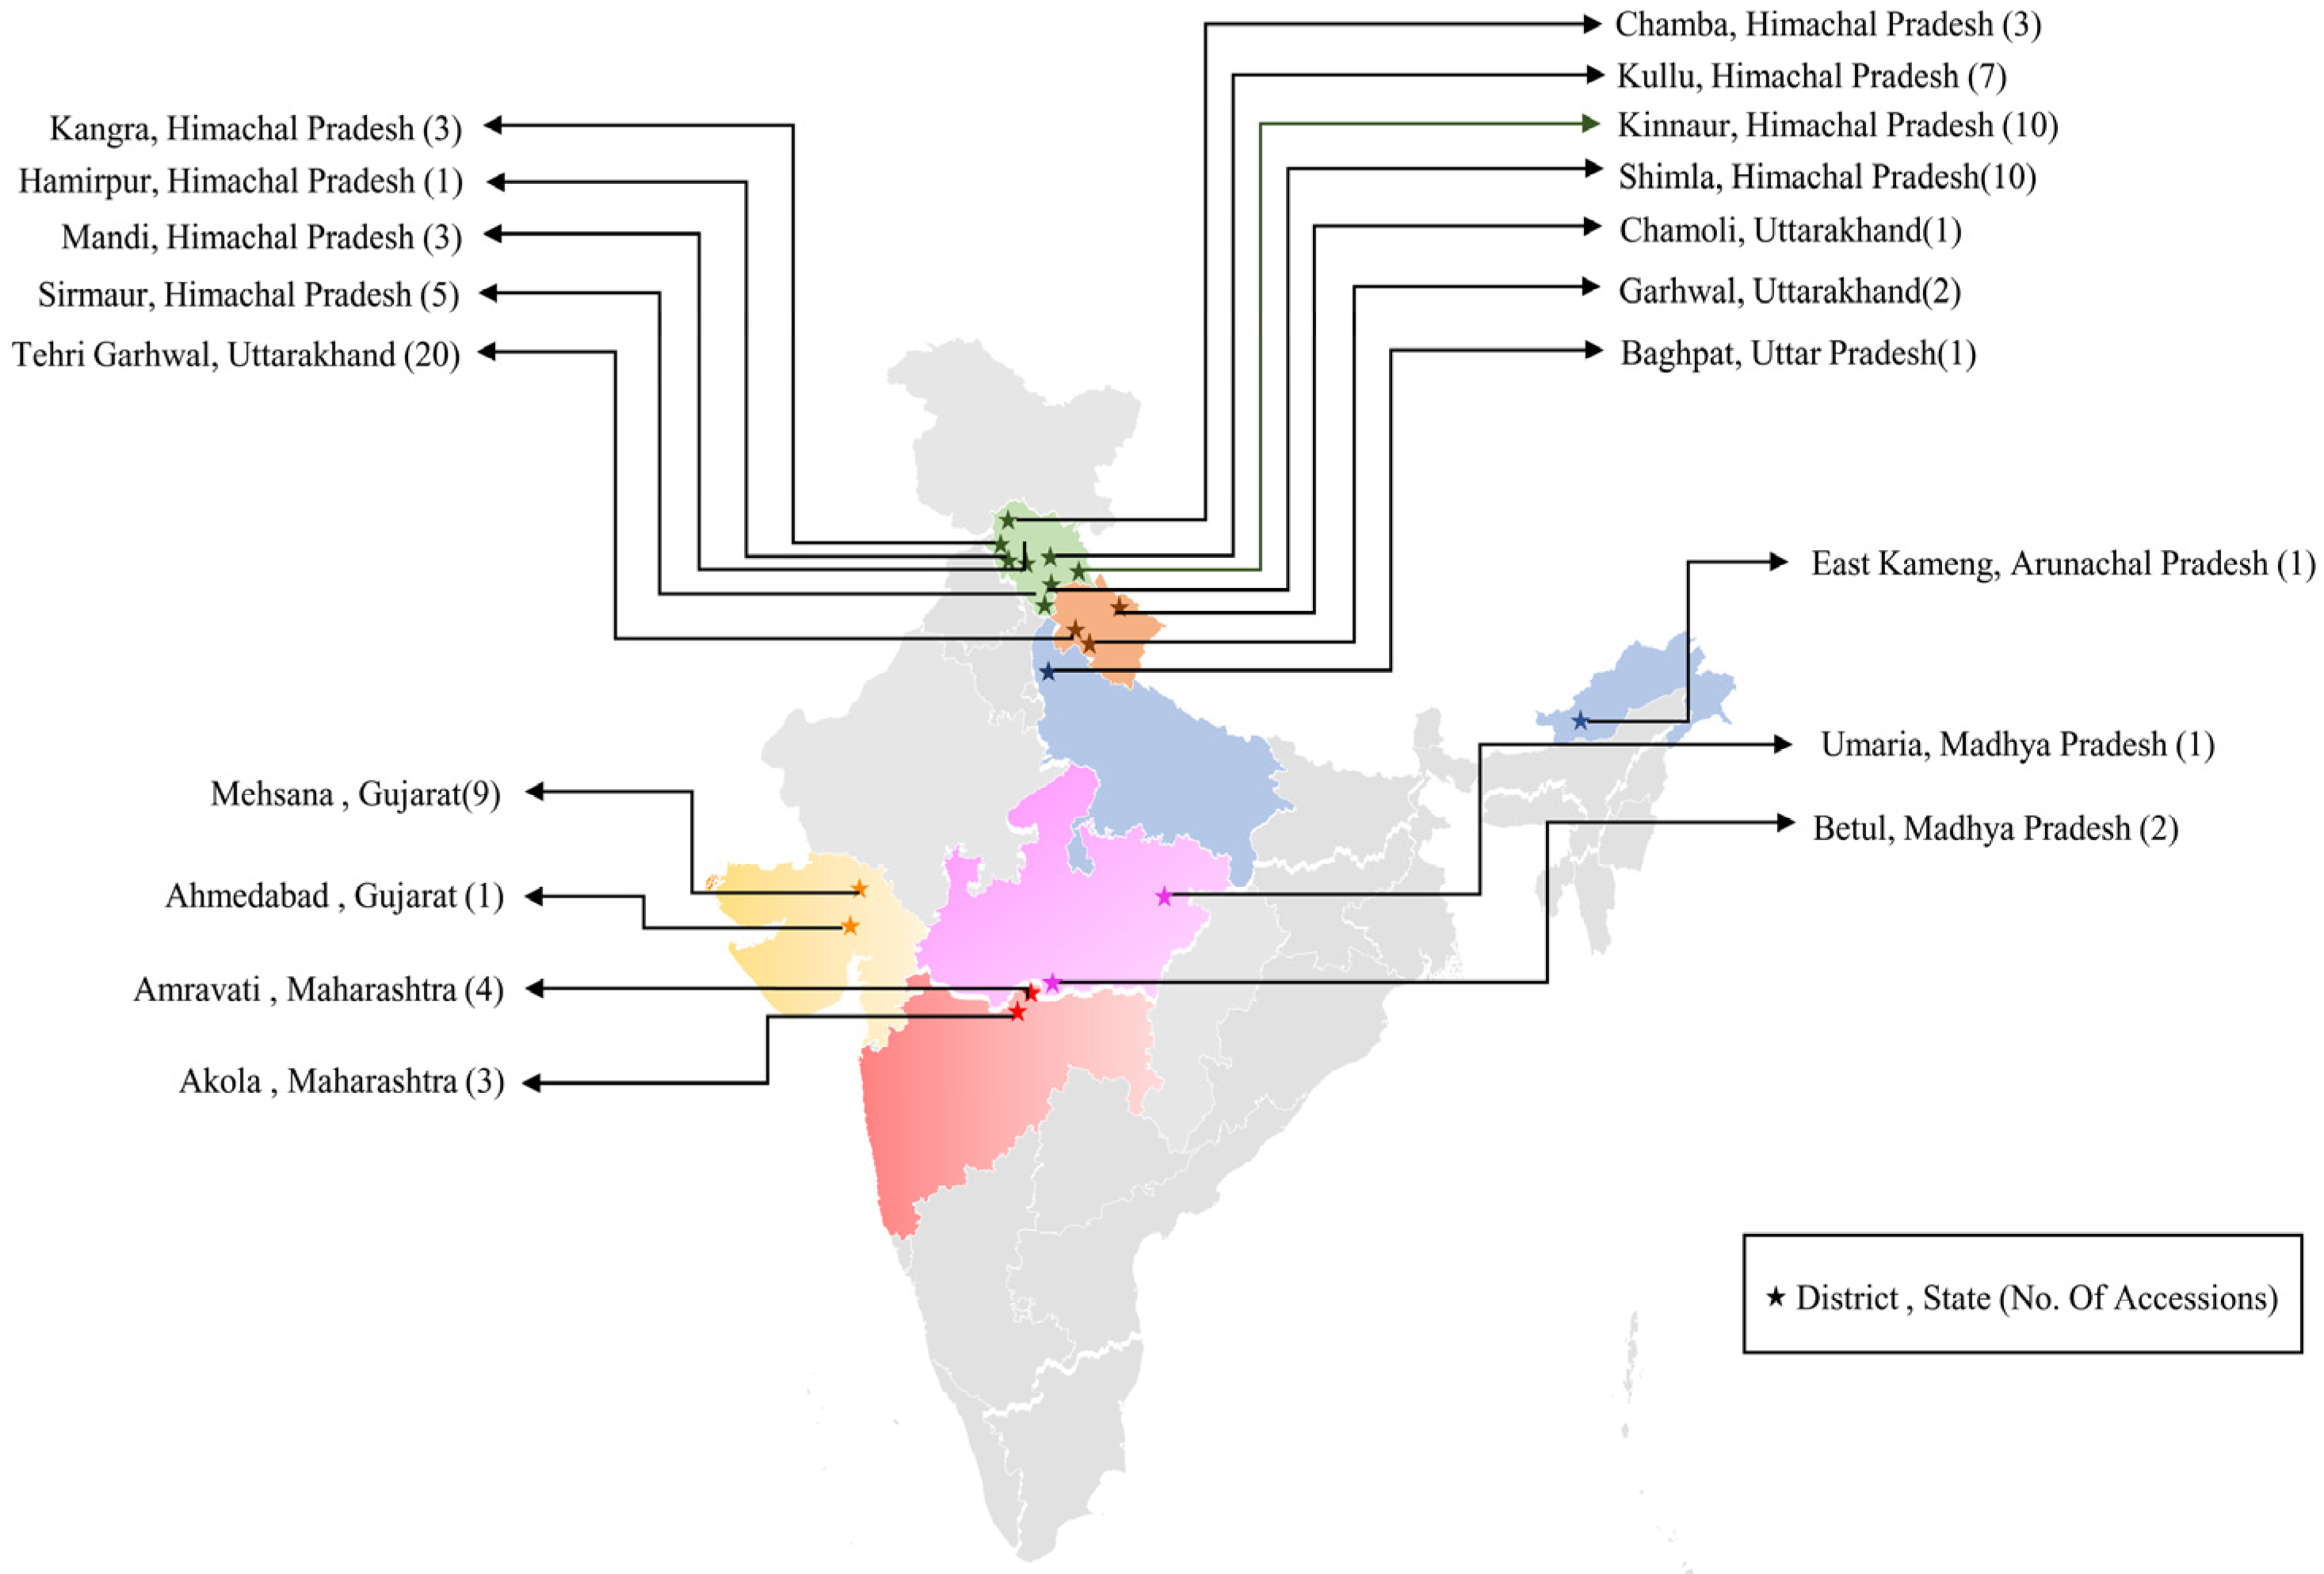
2.1. Plant Materials

The seed materials of 94 diverse grain amaranth accessions belonging to different Indian states (Himachal Pradesh (42), Uttarakhand (23), Uttar Pradesh (1), Madhya Pradesh (3), Arunachal Pradesh (1), Maharashtra (7), and Gujrat (10)) and four exotic accessions (USA (3) and Russia (1)) were obtained from the National Gene Bank, ICAR-National Bureau of Plant Genetic Resources (NBPGR), New Delhi, as depicted in Figure 1 and Table S1. The seeds were sown in the greenhouse at ICAR-NBPGR in three-dimensional seedling trays with 18 cavities, with each cavity having dimensions of 8 cm × 8 cm × 8 cm.

2.2. Plant Genomic DNA Extraction

The fresh and healthy leaves of each accession were collected from 30-day-old seedlings and immediately stored at −80 °C until DNA extraction. The leaves of five seedlings for each accession were pooled for genomic DNA isolation following the Triton-X 100 protocol with slight modifications [42]. The isolated genomic DNA samples were diluted in 1X TE (Tris-EDTA) buffer and stored at a temperature of −20 °C for further use. The quality and quantity of the isolated DNA samples were measured using a NanoDrop 1000 spectrophotometer (Thermo Fisher Scientific, Waltham, MA, USA). The quality of DNA was checked on 0.8% agarose gel, and the final working concentration of each accession was further tuned to 10 ng/µL and stored at 4 °C.

2.3. PCR Amplification and Gel Documentation

The genomic SSR (g-SSR) markers and their PCR primer pairs have been developed using the MISA tool (http://pgrc.ipk-gatersleben.de/misa/, accessed on 15 June 2022) and Primer3 (http://bioinfo.ut.ee/primer3-0.4.0/, accessed on 15 June 2022) software for the development of our in-house database, the Amaranth Genomic Resource Database (AGRDB) (http://www.nbpgr.ernet.in:8080/AmaranthGRD/, accessed on 15 June 2022), using the A. hypochondriacus genome version 2.0. A total of 57 g-SSR markers that were developed in-house were used to assess the genetic variability of the 94 amaranth accessions. The PCR amplification reaction was performed in a total volume of 25 µL, containing 2 µL template DNA (10 ng/µL), 1.5 µL of each forward and reverse primers (10 pmole/µL), and 10 µL of PCR master mix (G-Biosciences, St. Louis, MO, USA) added along with 10 µL of double-distilled water (Invitrogen, Thermo Fisher Scientific, Waltham, MA, USA) to make up the final volume. PCR amplification was carried out using a thermal cycler (G-Storm, Essex, England) according to the following conditions: initial denaturation for 5 min at 95 °C, followed by 30 cycles of denaturation for 40 s at 94 °C, annealing temperature (determined by gradient PCR for each primer pair) for 40 s (Table S2), initial extension for 40 s at 72 °C, and a final extension for 10 min at 72 °C accompanied by cooling temperature of 4 °C. The final amplified PCR products were stained with ethidium bromide and separated on 4% metaphor agarose gel (Lonza, Rockland, ME, USA) along with 100 bp DNA ladder at a constant supply of 120 V for about 3 h in 1 X TAE (Tris-acetate-EDTA) buffer. The pictures of the amplified products on the gel were captured under UV light using a gel documentation system (CLiNX, Shanghai, China).

2.4. Scoring of Markers and Data Analysis

The scoring of PCR-amplified DNA fragments was carried out based on band size (bp) as per Power Marker software format. Different indices of diversity viz., the major allele frequency (MAF), gene diversity or expected heterozygosity, observed heterozygosity, and polymorphism information content (PIC) values for every polymorphic g-SSR marker, were estimated by unbiased estimator using Power Marker v3.5 [43]. The discriminating power of the marker is represented by its PIC value, which is based on the number of amplified alleles and their respective frequency distribution. PIC values were described using the following formula [44].
PIC i = 1 j = 1 n P i j     2 j = 1 n 1   k = j + 1 n 2 P i j   2 P i k 2
where Pij and Pik are the frequencies of the jth and kth alleles for marker i.
Percentage Polymorphic Loci (PPL) was calculated using GenAlEx v6.5 [45]. The scored data obtained by selected polymorphic g-SSRs was used to construct a neighbor-joining (NJ) tree based on genetic distances using DARwin v6.0.021 [46] software. The phylogenetic tree was built according to the dissimilarity matrix formed by the application of unweighed neighbor-joining algorithm. Analysis of population structure was performed using the Structure v2.3.4 software [47]. A total of ten runs were carried out for each value of K that was set from 1 to 10 with burn-in iterations of 500,000, accompanied by 500,000 Markov Chain Monte Carlo (MCMC) replications using the admixture model. The Structure Harvester (https://taylor0.biology.ucla.edu/structureHarvester/ accessed on 16 November 2022) was used to obtain the possible number of subpopulations by ΔK methodology.
Analysis of Molecular Variance (AMOVA) is a technique for studying molecular variance within a species. It was performed to calculate the genetic variability among and within the populations using GenAlex v6.5. Principal coordinates analysis (PCoA) is a method of multidimensional scaling (MDS) which uses a similarity matrix or dissimilarity matrix to assign a specific position to each variable in a low dimensional space. In our present study, PCoA was also carried out using GenAlex v6.5 to assess percentage of genetic variance based on dissimilarity indices.

3. Results

3.1. Genetic Diversity Indices for g-SSR Markers

A total of 94 accessions of A. hypochondriacus were analyzed using 57 g-SSR markers that were developed in silico in our laboratory. Among them, 36 g-SSRs produced polymorphic alleles, and they were consequently used for molecular characterization (Table S2). For the diversity analysis, parameters such as major allele frequency (MAF), gene diversity (GD), observed heterozygosity (Ho), and PIC were computed and are summarized in Table 1. A total of 138 alleles were amplified across 36 g-SSR markers, with a mean value of 3.83 alleles per locus. The major allele frequency showed a range of 0.28 to 0.98 with an average of 0.63. The gene diversity (expected heterozygosity) calculated among 36 g-SSR loci varied from 0.03 to 0.81, with a mean of 0.46 per locus. The g-SSR marker AhySSR39451 showed the maximum gene diversity (0.81), while the minimum value (0.03) was recorded in AhySSR31577. The value of observed heterozygosity was lowest in AhySSR31577 (0.016) and the highest in AhySSR5081, AhySSR18586, AhySSR29571 (1.0), with a mean value of 0.61 per locus. The values of polymorphism information content (PIC) showed a range from 0.03 (AhySSR31577) to 0.78 (AhySSR29571) with a mean value of 0.40. Ten g-SSRs markers viz. AhySSR0595, AhySSR5081, AhySSR18586, AhySSR19060, AhySSR23586, AhySSR29093, AhySSR29571, AhySSR43465, AhySSR49996 and AhySSR39451, had PIC values greater than 0.5 for the amaranth accessions, indicating superior discriminatory power as compared to others (Table 1 and Figure S1).
The percentage of polymorphic loci across all the studied accessions was 85.42%. Within the accessions, polymorphic loci percentages ranged from 63.89% to 100.00%. The maximum values of polymorphic loci were detected in accessions from Himachal Pradesh (100%) and with exotic origins (80.56%). The highest values of Shannon’s information index (I) (0.883) and expected heterozygosity (He) (0.497) were observed in the population from Himachal Pradesh indicating high genetic variability in accessions from Himachal Pradesh. The maximum value of observed heterozygosity (Ho) (0.583) was recorded in accessions belonging to Madhya Pradesh and with exotic origins (Table 2).

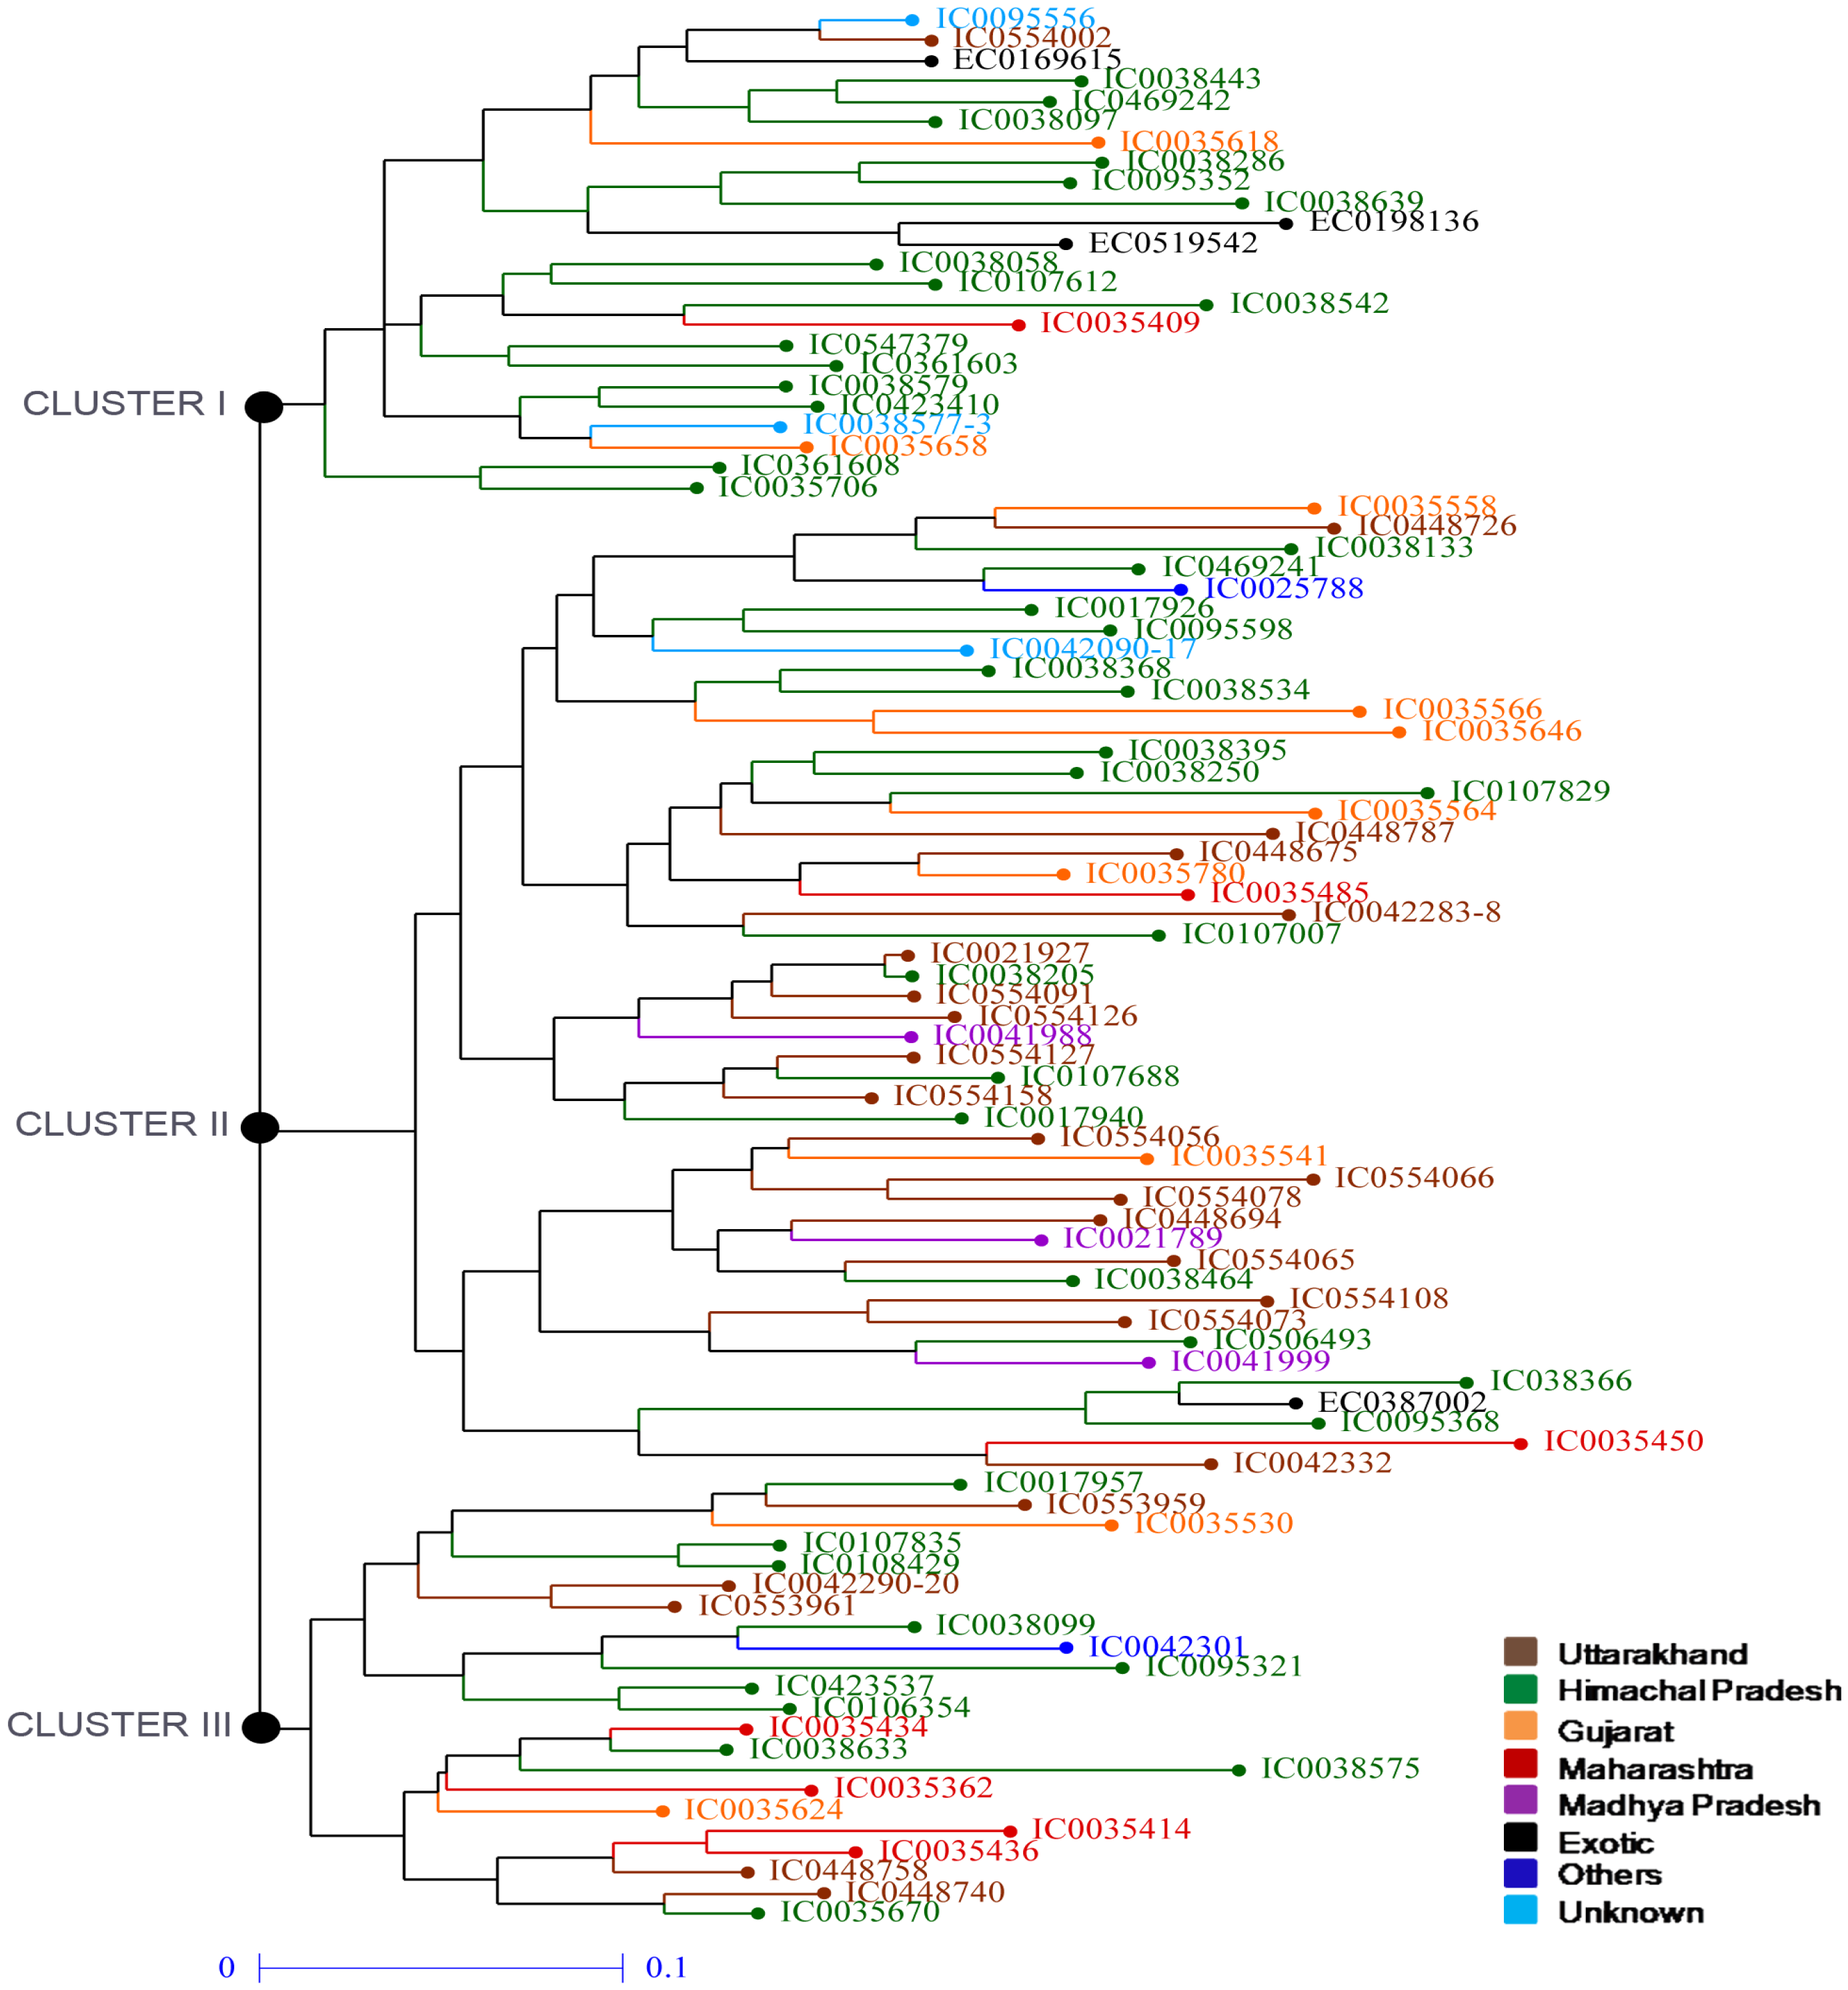
3.2. Phylogenetic Analysis of Amaranth Accessions

To further investigate the genetic relationships among the studied amaranth accessions, a neighbor-joining tree was constructed based on 36 g-SSR loci. The results based on genetic distance, as observed in the NJ tree, clustered 94 amaranth accessions into three major genetic clusters (Figure 2). In cluster I, 24 accessions were grouped. Among these accessions, fifteen were from Himachal Pradesh, two accessions each were from Gujarat and the USA, one accession each was from Uttarakhand, Maharashtra, and Russia, and two accessions were of unknown origin. The major cluster II consisted of 48 accessions. Among these, seventeen accessions were from Uttarakhand, seventeen accessions were from Himachal Pradesh, six accessions were from Gujarat, three accessions were from Madhya Pradesh, two accessions were from Maharashtra, and one accession each was from Arunachal Pradesh and the USA, along with one accession from unknown origin. Cluster III contained 22 accessions. It comprised ten accessions from Himachal Pradesh, five accessions from Uttarakhand, four accessions from Maharashtra, two accessions from Gujarat, and one accession from Uttar Pradesh (Figure 2).

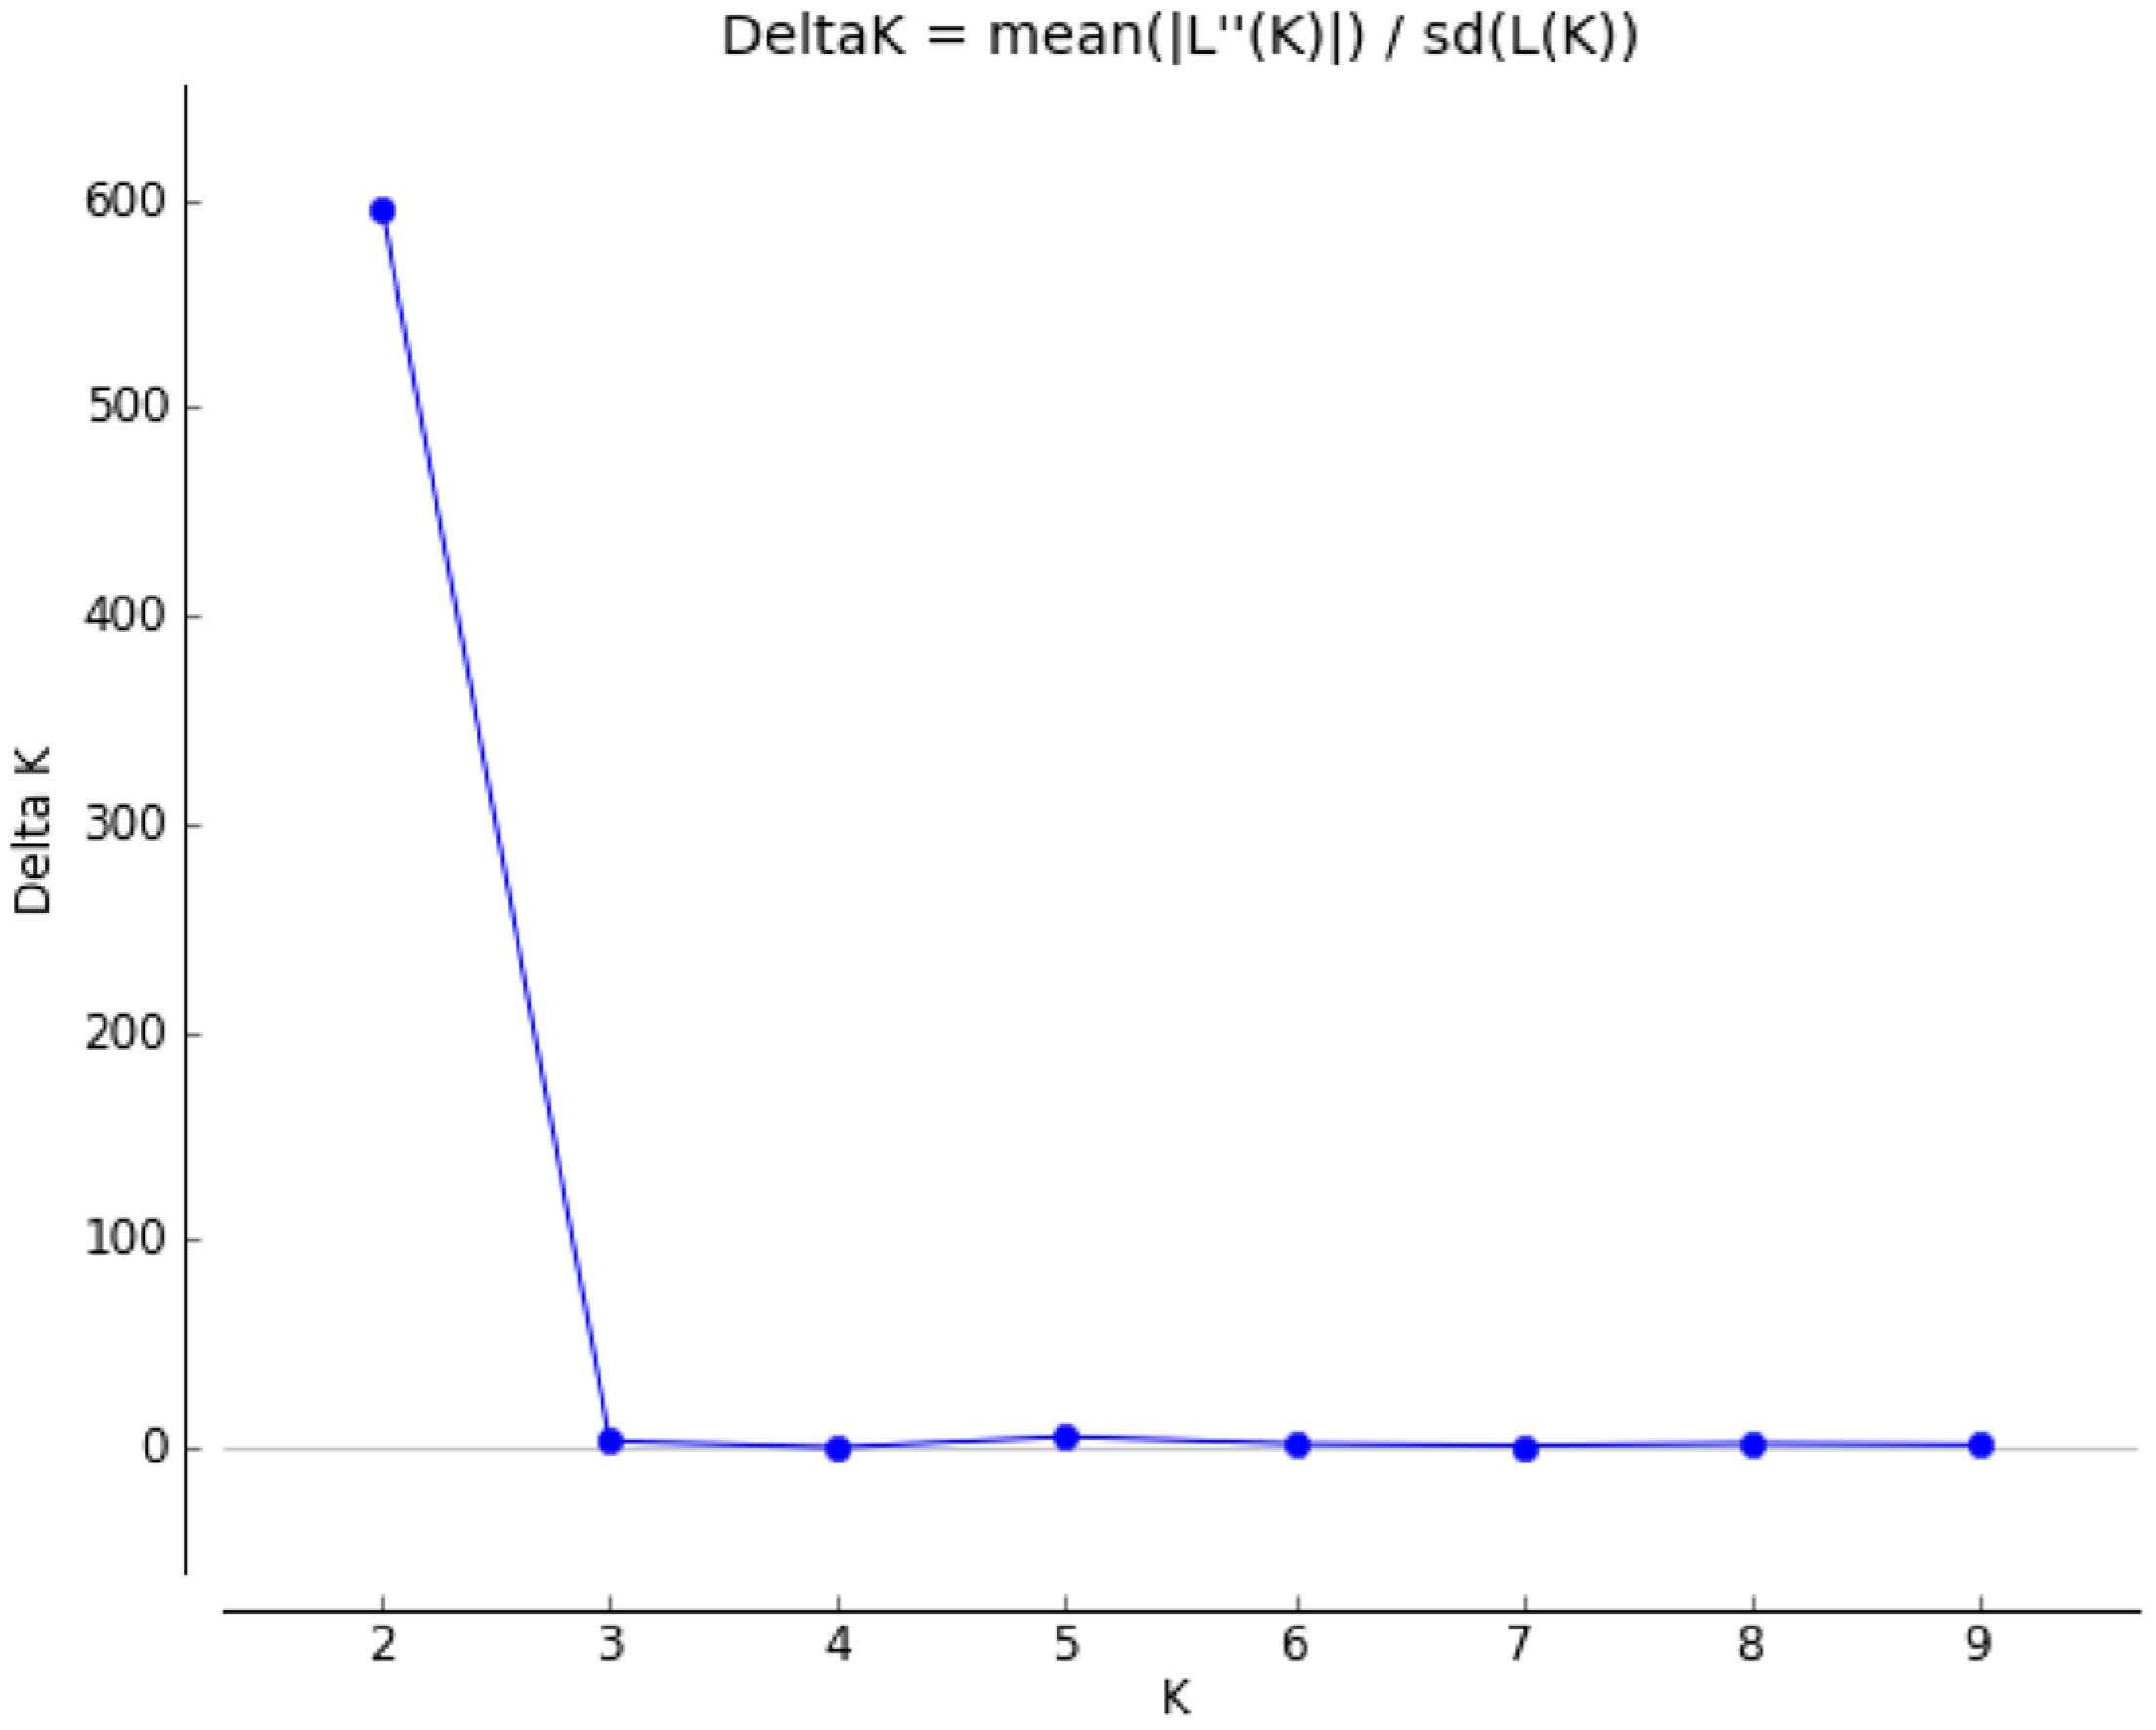
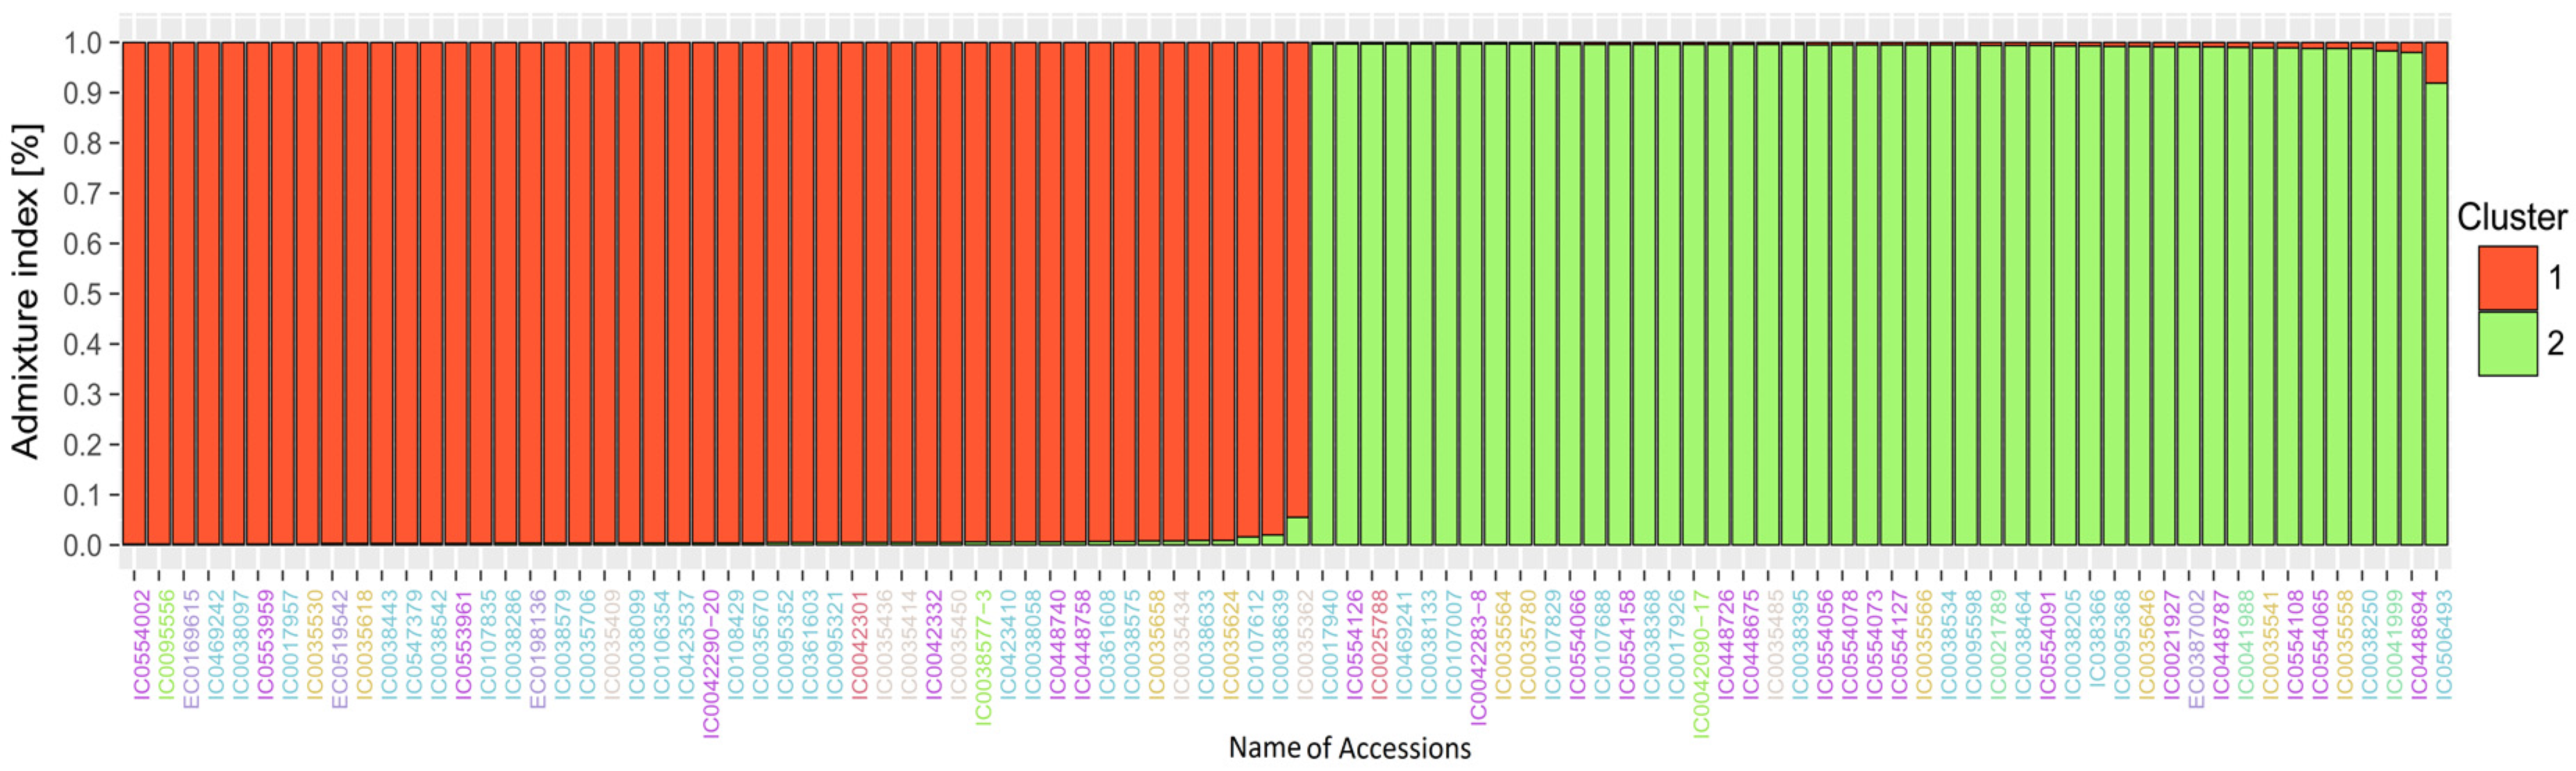
3.3. Analysis of Population Structure

The model-based population structure analysis of the 94 studied accessions revealed the presence of two different genetic populations. The maximum value of ΔK was recorded at ΔK = 2, which corresponded to the most possible number of populations in the study (Figure 3). The accessions with a probability score of >0.80 can be considered as genetically pure accessions, while those with a probability score of <0.80 can be considered as admixture. The grouping of amaranth accessions is illustrated in the bar plot diagram obtained using Structure Harvester (Figure 4). Population I contained 46 accessions and population II comprised48 accessions without any admixture. Population I comprised twenty-five accessions from Himachal Pradesh, seven accessions from Uttarakhand, six accessions from Maharashtra, four accessions from Gujarat, two accessions from the USA, and one accession each from Uttar Pradesh and Russia, along with two accessions belonging to an unknown location. Population II included seventeen accessions from Himachal Pradesh, sixteen accessions from Uttarakhand, six accessions from Gujarat, three accessions from Madhya Pradesh, one accession each from Maharashtra, Arunachal and USA along with one accession of unknown origin. If we compare the grouping of population structure with the neighbor-joining tree, Population I correspond to Clusters 1 and 3 of the neighbor-joining tree, whereas population II corresponds to Cluster 2. This shows that the neighbor-joining tree and population correspond to each other. The only difference is that clusters 1 and 3 are becoming merged together in population 1 during structure analysis.

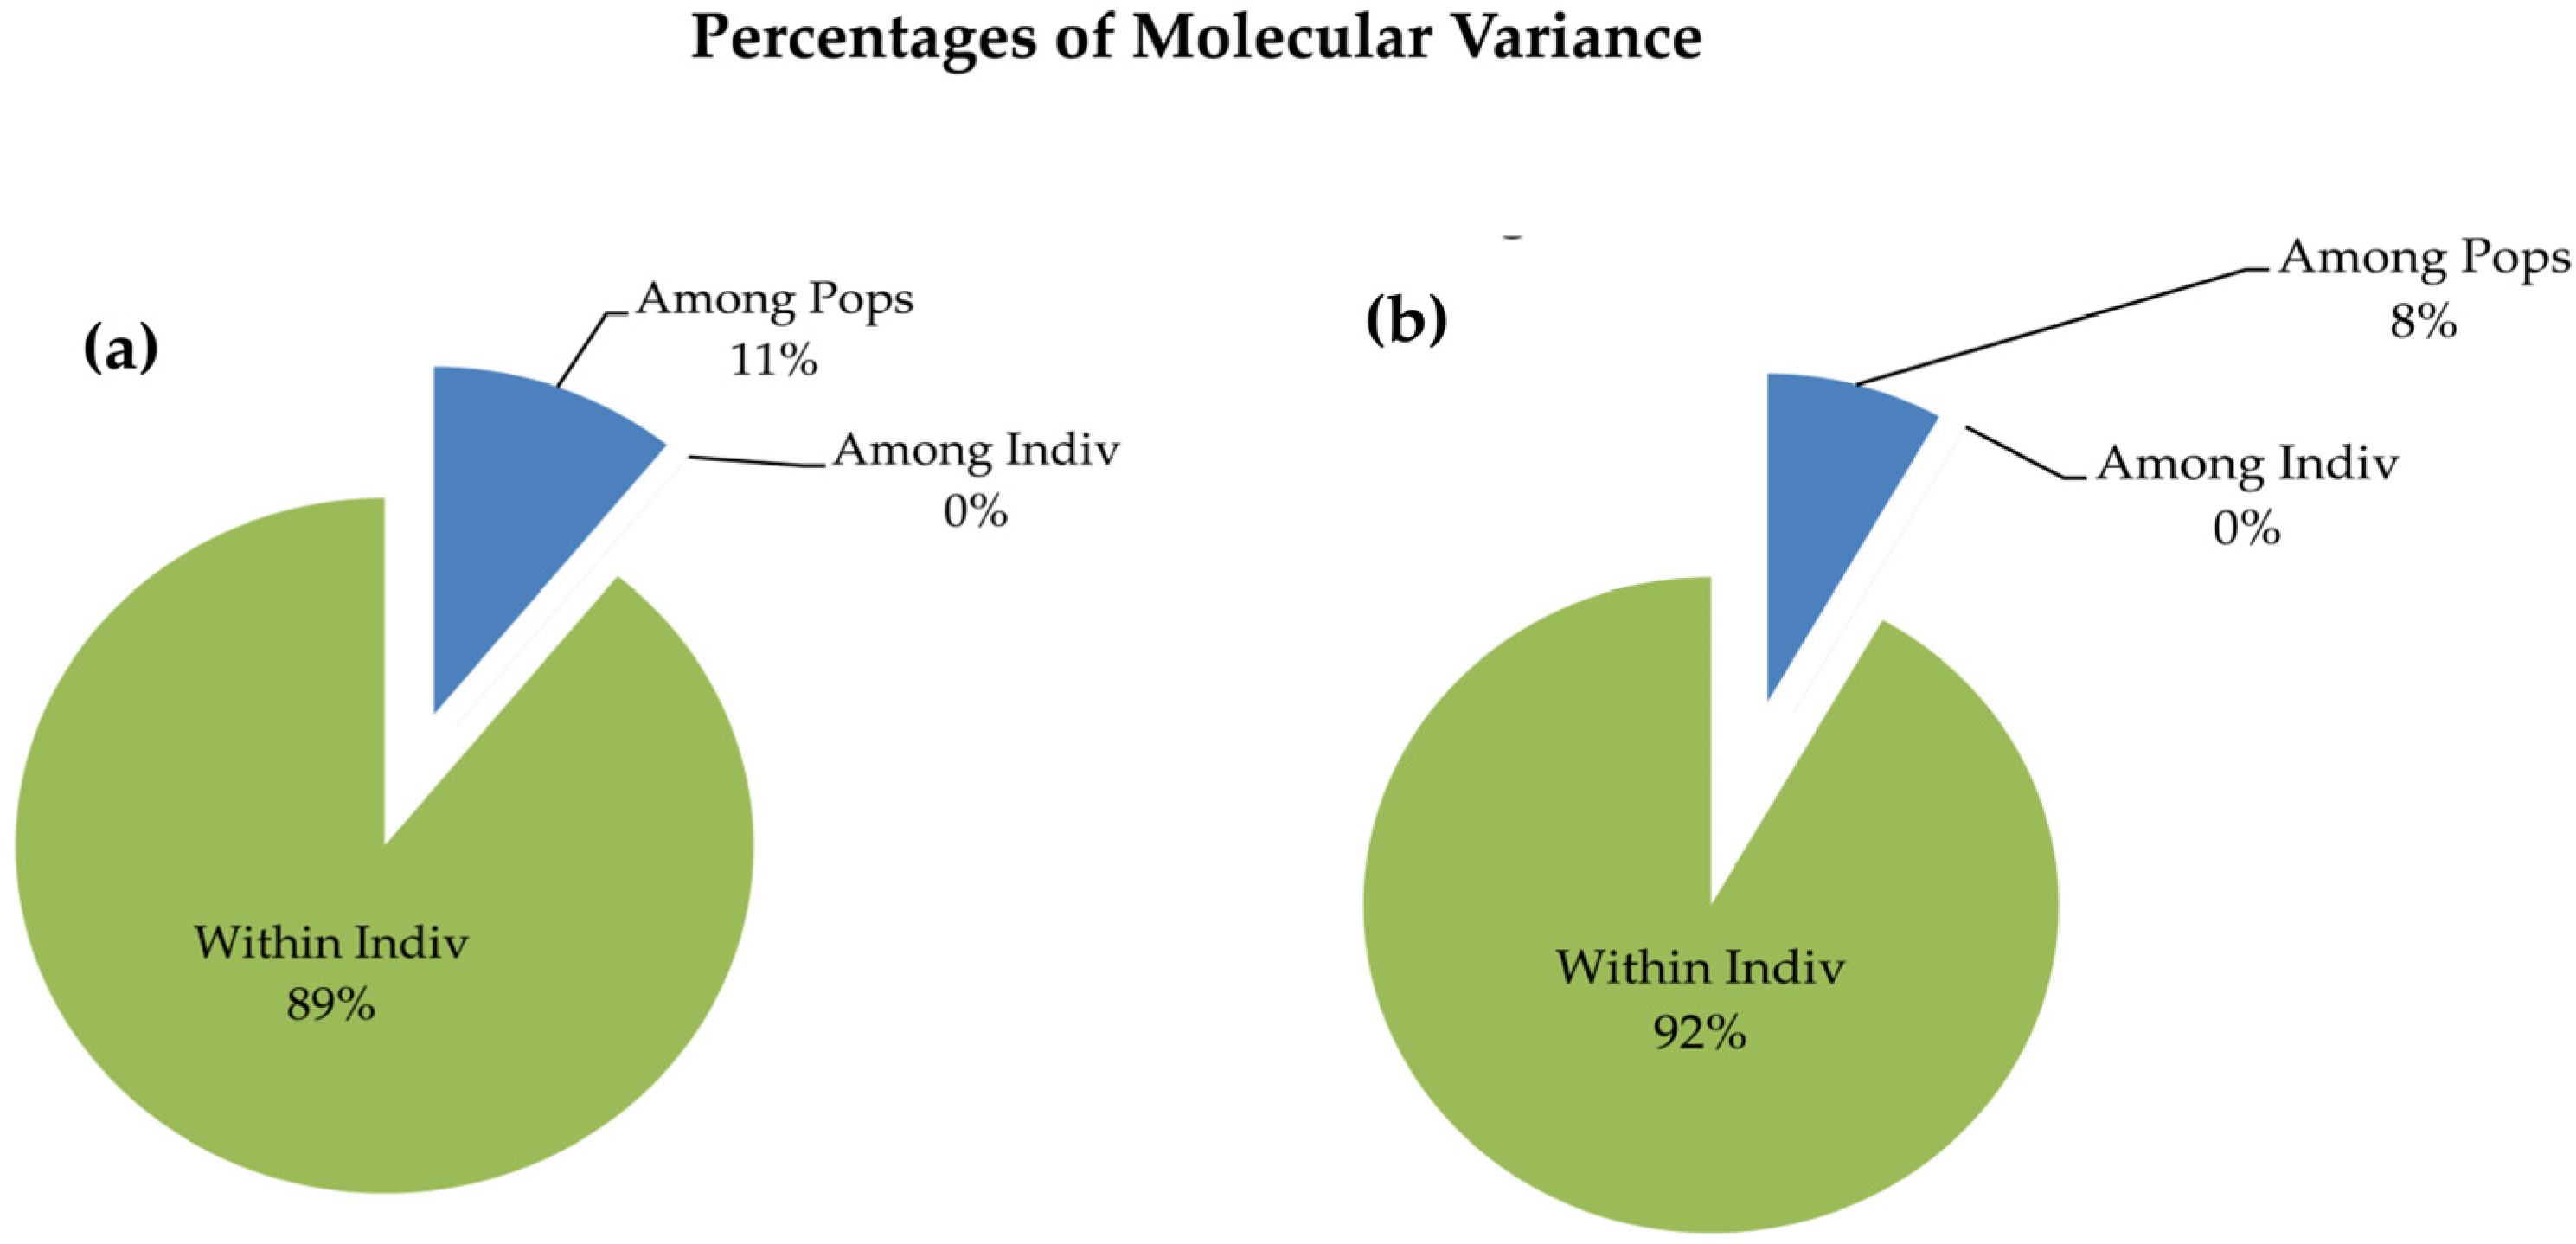
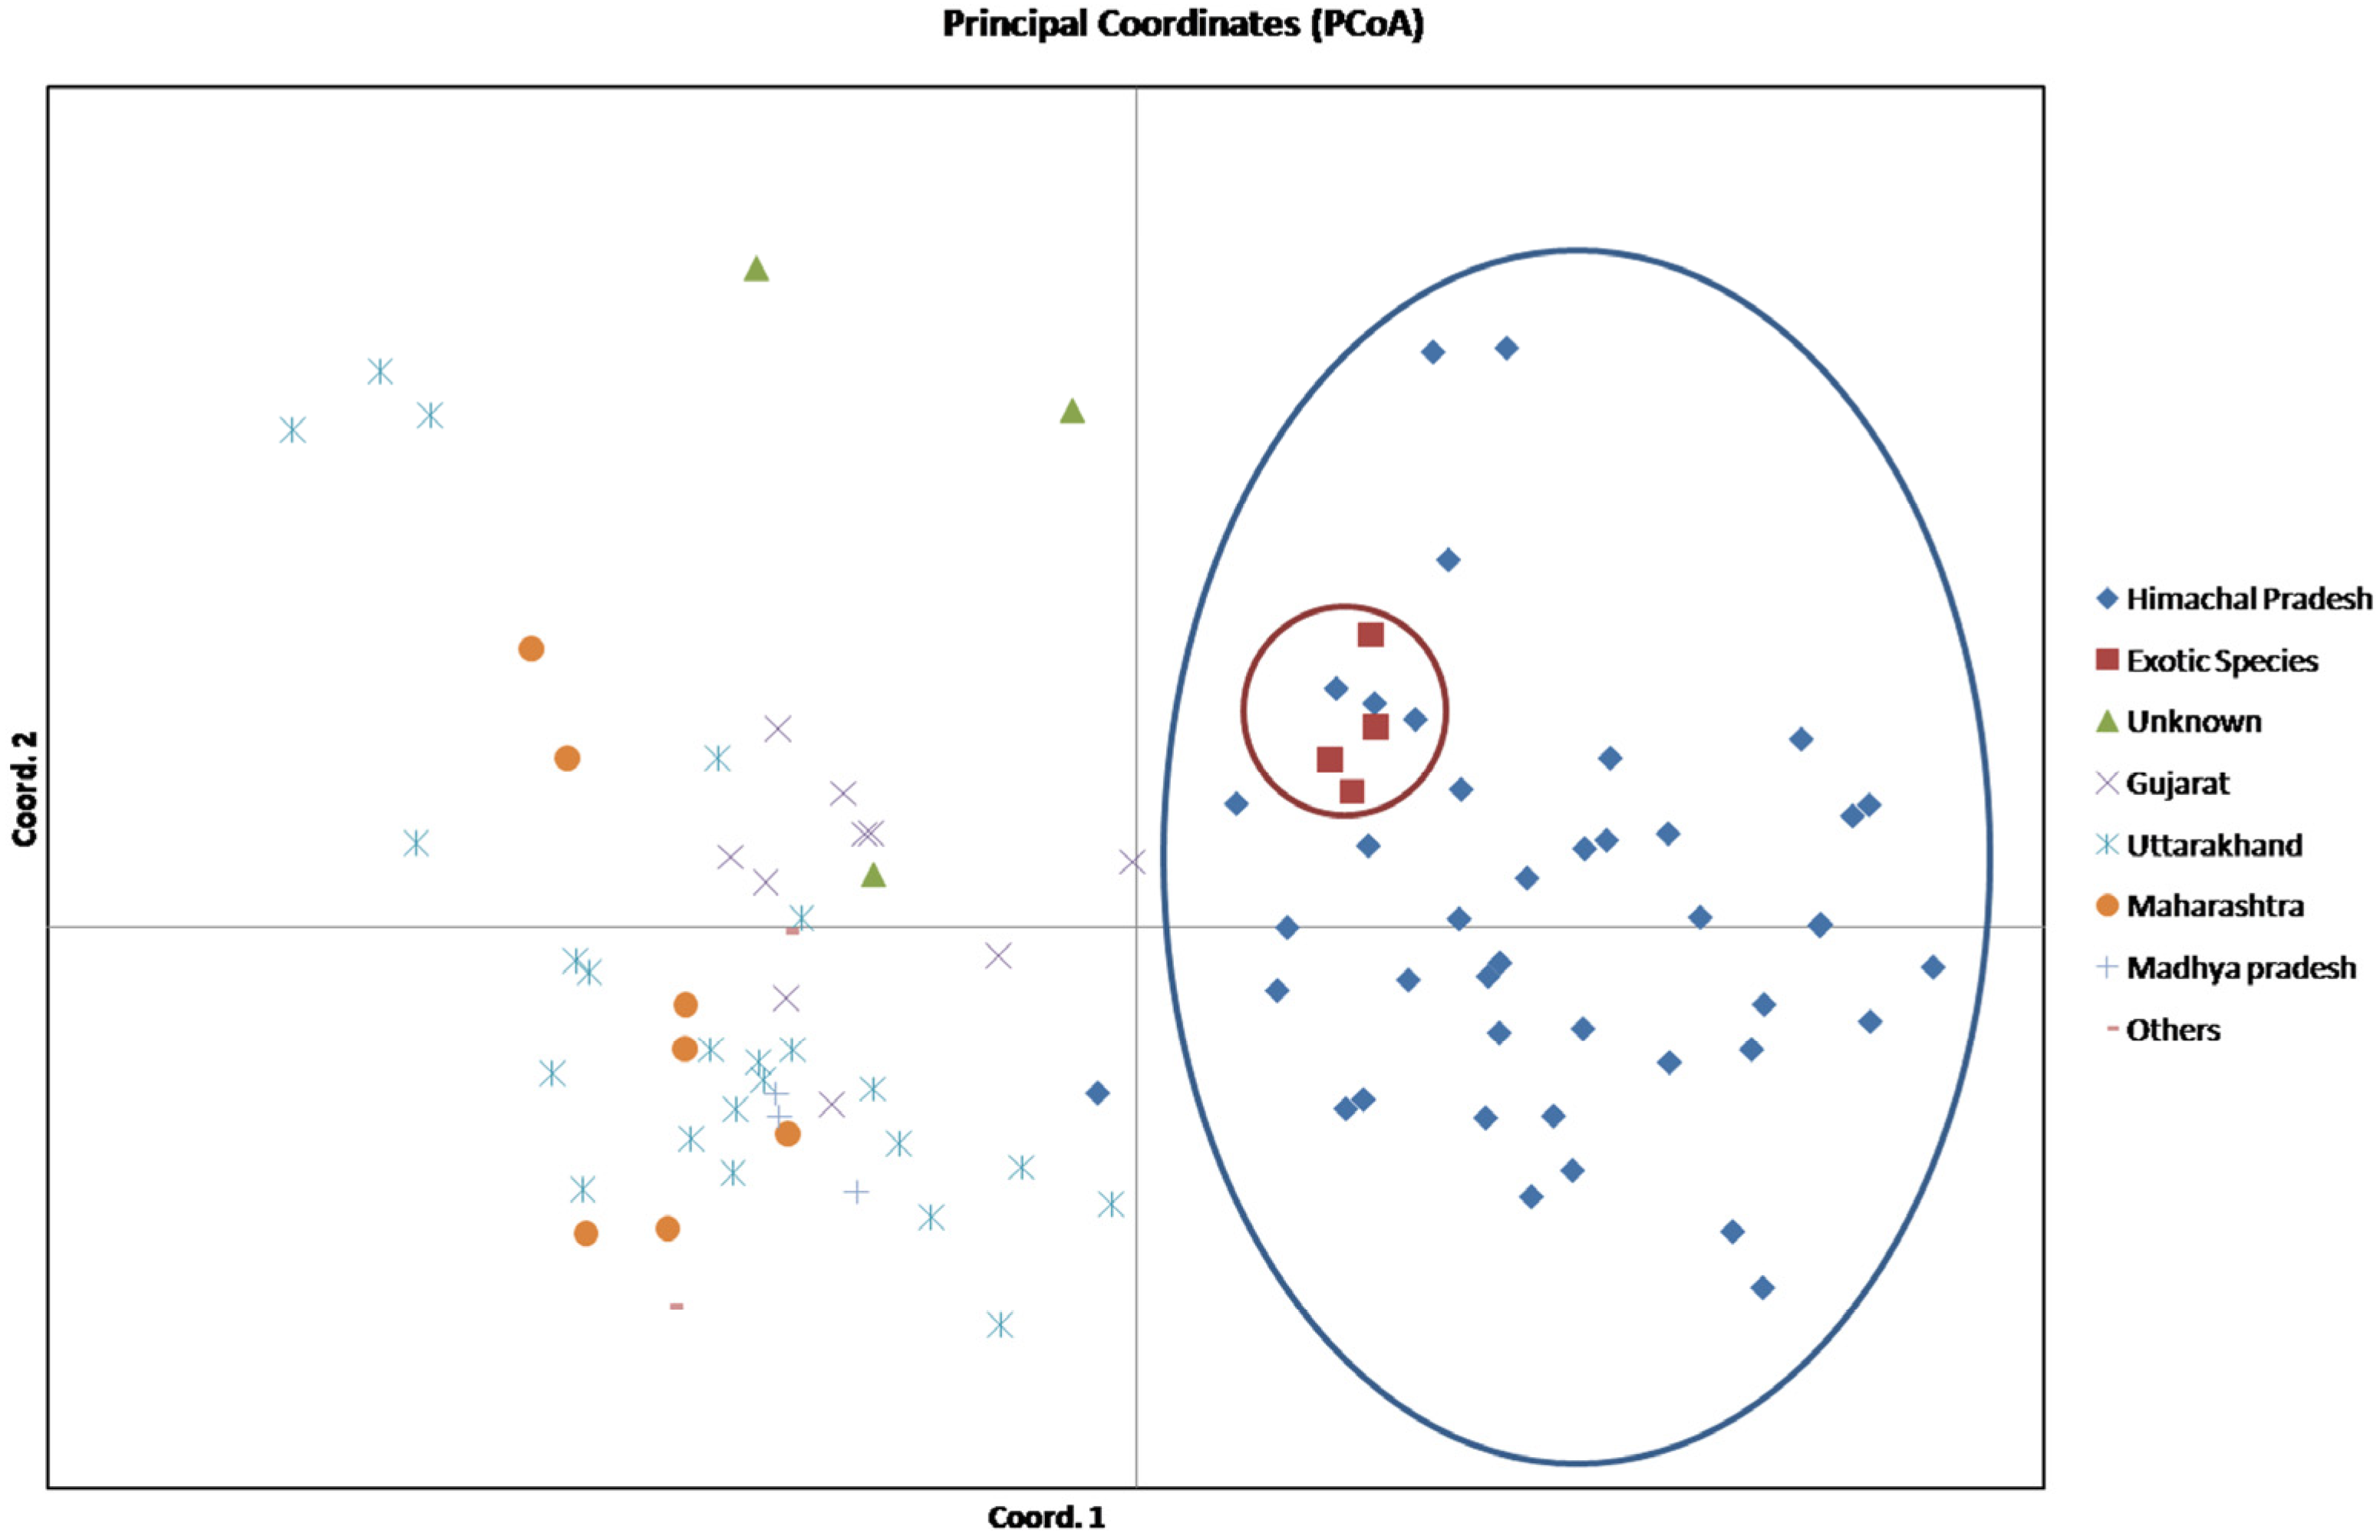
3.4. AMOVA and PCoA Analysis

The Analysis of Molecular Variance (AMOVA) was first performed based on geographic populations and then based on the two populations as obtained by the model-based population structure analysis. The genetic variance recorded between the subpopulations in origin-based AMOVA was 11%, whereas within the individuals, 89% variance was recorded (Figure 5a and Table S3). The model-based AMOVA displayed a genetic variation of 8% between the two obtained subpopulations, and a variation of 92% was found within the individuals (Figure 5b and Table S4). There was no significant difference observed among the origin-based and model-based AMOVA analysis.
In addition, the principal coordinate analysis (PCoA) plot displayed the existence of a significant amount of molecular diversity among the analyzed amaranth accessions. The first three axes of the PCoA accounted for a cumulative variation of 27.7%, wherein the first, second and third axes expressed 11.7%, 8.51%, and 7.48% of the total variation, respectively (Table 3). Furthermore, in the PCoA matrix, the amaranth accessions were distributed across the coordinates represented with different colors. The PCoA analysis clearly indicates that accessions from Himachal Pradesh were very distinctly isolated from other states accessions. Similarly, the exotic accessions shared more similarity among themselves and were very close to Himachal Pradesh accessions (Figure 6), whereas accessions from Uttarakhand were more diverse and shared genetic similarity with accessions from Maharashtra, Gujrat, and Madhya Pradesh.

4. Discussion

A. hypochondriacus is an ancient paleopolyploid with high nutritional value and excellent agronomic characters [48]. Grain amaranth is a cross-pollinated crop species that is mainly pollinated by wind. To enhance the use of this crop, information on its genetic diversity needs to be generated. Knowledge of genetic variability within crop species is vital for the potential use of plant genetic resources [49]. Assessment of genetic diversity is considered important in studies related to evolution, population structure, and plant breeding programs [50]. Molecular markers are used to study genetic variability. Over the years, SSRs have proved to be reliable genetic markers for molecular diversity studies, linkage mapping, and marker-aided selection [39,51]. Construction of population structure with the use of molecular data further enables the development of a framework for future breeding programs.
In our present investigation, 36 g-SSR markers were used to analyze 94 accessions of A. hypochondriacus. A total of 138 alleles were detected among 36 SSRs across 94 different accessions of amaranth. The mean allelic richness in our study was 3.83 alleles per locus, which was lower than the values obtained in most of the previous studies by Wang et al., 2013 (4.79), Suresh et al., 2014 (11.1), Khaing et al., 2013 (12.9), and Mallory et al., 2008 (4.0) [39,40,52,53]. This difference may be due to the use of different g-SSRs and sample sizes. The values of heterozygosity ranged from 0.01 to 1.00, with a mean value of 0.61 per locus, which is comparable with the studies performed earlier in cultivated relatives of amaranth such as sugar beet (0.61) [54], and quinoa (0.57) [55]. The average value of PIC obtained in our study was 0.40, which is higher than the values obtained previously 0.34 [39] and 0.29 [56]), but lower than others 0.66 [40] and 0.71 [52]. The cause of this difference in PIC values may be due to the variation in sample size considered for the study.
Understanding the population structure is a necessary condition for proper selection of accessions. The model-based structure analysis distributed 94 accessions into two subpopulations. The ΔK at K = 2, meaning all of the accessions were assigned to two subgroups without admixture, suggesting rare genetic connection between the two subgroups based on g-SSR used in this study. Similarly, Suresh et al., 2014 used 11 SSR markers to study population structure among 348 amaranth accessions and classified these into two populations [40]. The clustering analysis based on DNA polymorphism is a better and more trustworthy approach of determining relationships between individuals. As DNA is not affected by several environmental influences, the linkages revealed by DNA markers can give a clear picture of syntenic relations, conservation, and differences between the analyzed individuals of a group or distinct species. A large number of studies on SSR markers in various crops have been reported previously [23,24,25,26,27,28]. The dendrogram of A. hypochondriacus showed three major groups. However, no clear clustering pattern was observed between accessions that were geographically close to each other, which shows that genetic distance has no correlation with geographical distance which is consistent with the results of Wang et al., 2013 [39]. Suresh et al. 2014 also performed clustering analysis based on SSR markers across 348 amaranth accessions, but, similar to our study, no separate groups were observed based on geographical origin. The lack of significant association between genetic divergence and geographical diversity denotes that factors other than geographical origin contribute to genetic diversity such as reproductive nature, genetic sampling error, spontaneous mutation, and natural and artificial selection [57]. This dissociation can also be a result of the cosmopolitan nature of amaranth and activities of human interference such as breeding and resource exchange. Although the neighbor-joining tree and population structure showed a grouping of 94 accessions in to three and two groups, respectively, critical analysis shows that they correspond to each other and that Clusters 1 and 3 are represented by Population 1, while Cluster 2 corresponds to Population 2 with exactly the same number accessions.
The scattered plot generated by PCoA distributed all of the 94 accessions into two distinct groups according to the dissimilarity indices. The total cumulative variation of 20.23% showed less variation as compared to the 34.8% variation among 42 A. paniculata accessions [21] and 57.6% variation among 46 pomegranate genotypes [58] reported previously. In the PCoA plot, axis 1 explained a higher proportion of variance (11.72%) compared to axis 2 (8.51%). Furthermore, the grouping pattern of 42 accessions from Himachal Pradesh showed that these accessions are very distinct from the rest of the accessions representing other states (Uttarakhand, Maharashtra, Gujrat, and Madhya Pradesh) of India. This type of clear distinction was not observed in the cluster analysis or population structure analysis. The four exotic accessions from USA and Russia were very close to each other but were grouped with accessions from Himachal Pradesh. The PCoA also showed that accessions from Uttarakhand are distinct from those from Himachal Pradesh, although geographically both are adjoining states of North India. The Uttarakhand accessions are closer to accessions of Gujrat, Maharashtra, and Madhya Pradesh. Thus, the in-house-developed 36 g-SSRs were found to be effective and informative, and can show that even accessions from neighboring states are very distinct from each other and may represent two different gene pools. Based on PCoA analysis it can be assumed that introduction of grain amaranth might have occurred in Himachal Pradesh because exotic accessions were closer to those from Himachal Pradesh in comparison with other Indian states’ accessions. The accessions from Uttarakhand are distinct; this might be due to a different gene pool, or the accessions may have moved from Himachal Pradesh in later stages, become further diversified and moved to western (Maharashtra and Gujrat) and central parts (Madhya Pradesh) of India, before becoming further diversified due to possible cross-pollination with weedy Amaranthus. This may be the reason that accessions from western and central parts of India were not found to share much genetic similarity with exotic and Himachal Pradesh accessions based on PCoA analysis, although this result was not supported by the neighbor-joining tree or population structure study, where intermixing of accessions was observed.

5. Conclusions

In the present study, a set of 36 in-house-developed g-SSR loci were validated through the assessment of genetic diversity and population structure among 94 diverse accessions of A. hypochondriacus. The diversity indices represented a substantial amount of molecular diversity among 94 accessions with the in-house-developed g-SSR markers. These markers might distribute the amaranth accessions into different sub-populations. The information related to population structure and diversity analysis of A. hypochondriacus proved to be beneficial for further genomic selection, marker-assisted selection (MAS), and genome-wide association studies (GWAS). Based on our study, we also conclude that these 36 polymorphic g-SSR markers are significantly efficient. PCoA studies based on these markers indicated how exotic accessions and Himachal Pradesh accessions were close to each other and distinct from those from other states. Further, this also indicated how grain amaranth has moved to different states of India and diversified. Thus, these markers could be added as new desirable genomic tools for further studies related to the characterization of germplasm banks and future breeding programs.

Supplementary Materials

The following supporting information can be downloaded at: https://www.mdpi.com/article/10.3390/agriculture13020431/s1, Figure S1: Gel image representation displaying g-SSR profile of 94 accessions of A. hypochondriacus using AhySSR0595 marker. Lane M denotes 100 bp DNA ladder; Table S1: List of grain amaranth accessions used in the present study; Table S2: List of g-SSR markers used along with their forward and reverse sequences and annealing temperature; Table S3: Analysis of molecular variance (AMOVA) based on geographic populations using 36 g-SSRs among and within subpopulation of 94 amaranth accessions; Table S4: Model-based analysis of molecular variance (AMOVA) using 36 g-SSRs among and within subpopulation of amaranth accessions.

Author Contributions

R.S. conceived and designed the experiments; G.V., D.D. and R.G. performed data curation and formal data analysis; G.V. performed PCR analysis; R.G. and A.M. performed formal data analysis; D.D. wrote original draft of the manuscript; A.S. performed visualization, reviewed and edited the manuscript; R.S. supervised the study, and provided funding acquisition; V.G. and K.S. provided reagents and material for study; S.R., A.K.S., R.B., S.K., S.K.K. and R.S. writing—review and editing the manuscript. All authors have read and agreed to the published version of the manuscript.

Funding

This research was funded by Department of Biotechnology, Government of India, grant number “BT/PR23811/AGIII/103/1029/2018”. The funder has no role in the design of the study and collection, analysis and interpretation of data and in writing the manuscript.

Institutional Review Board Statement

Not applicable.

Data Availability Statement

All the data and Supplementary Materials are available with the manuscript.

Acknowledgments

We are thankful to the Director, ICAR-NBPGR, New Delhi, for providing necessary facilities to carry out this research work.

Conflicts of Interest

The authors declare no conflict of interest.

References

  1. Aderibigbe, O.R.; Ezekiel, O.O.; Owolade, S.O.; Korese, J.K.; Sturm, B.; Hensel, O. Exploring the potentials of underutilized grain amaranth (Amaranthus spp.) along the value chain for food and nutrition security: A review. Crit. Rev. Food Sci. Nutr. 2020, 62, 656–669. [Google Scholar] [CrossRef] [PubMed]
  2. Brenner, D.M.; Baltensperger, D.D.; Kulakow, P.A.; Lehmann, J.W.; Myers, R.L.; Slabbert, M.M.; Sleugh, B.B. Genetic Resources and Breeding of Amaranthus. Plant Breed. Rev. 2010, 19, 227–285. [Google Scholar]
  3. Sauer, J.D. The Grain Amaranths and Their Relatives: A Revised Taxonomic and Geographic Survey. Ann. Mo. Bot. Gard. 1967, 54, 103. [Google Scholar] [CrossRef]
  4. Waselkov, K.E.; Boleda, A.S.; Olsen, K.M. A Phylogeny of the Genus Amaranthus (Amaranthaceae) Based on Several Low-Copy Nuclear Loci and Chloroplast Regions. Syst. Bot. 2018, 43, 439–458. [Google Scholar] [CrossRef]
  5. Nascimento, A.C.; Mota, C.; Coelho, I.; Gueifão, S.; Santos, M.; Matos, A.S.; Gimenez, A.; Lobo, M.; Samman, N.; Castanheira, I. Characterisation of nutrient profile of quinoa (Chenopodium quinoa), amaranth (Amaranthus caudatus), and purple corn (Zea mays L.) consumed in the North of Argentina: Proximates, minerals and trace elements. Food Chem. 2014, 148, 420–426. [Google Scholar] [CrossRef]
  6. Joshi, N.; Verma, K.C. A review on nutrition value of Amaranth (Amaranthus caudatus L.): The crop of future. J Pharm. Phytochem. 2020, 9, 317–319. [Google Scholar]
  7. Pedersen, B.; Hallgren, L.; Hansen, I.; Eggum, B.O. The nutritive value of amaranth grain (Amaranthus caudatus). Qual. Plant. Plant Foods Hum. Nutr. 1987, 36, 325–334. [Google Scholar] [CrossRef]
  8. Bressani, R.; Gonzáles, J.M.; Zúñiga, J.; Breuner, M.; Elías, L.G. Yield, selected chemical composition and nutritive value of 14 selections of amaranth grain representing four species. J. Sci. Food Agric. 1987, 38, 347–356. [Google Scholar] [CrossRef]
  9. Rodriguez, J.P.; Rahman, H.; Thushar, S.; Singh, R.K. Healthy and Resilient Cereals and Pseudo-Cereals for Marginal Agriculture: Molecular Advances for Improving Nutrient Bioavailability. Front. Genet. 2020, 11, 49. [Google Scholar] [CrossRef]
  10. Martirosyan, D.M.; Miroshnichenko, L.A.; Kulakova, S.N.; Pogojeva, A.V.; Zoloedov, V.I. Amaranth oil application for coronary heart disease and hypertension. Lipids Health Dis. 2007, 6, 1. [Google Scholar] [CrossRef] [PubMed]
  11. Berger, A.; Gremaud, G.; Baumgartner, M.; Rein, D.; Monnard, I.; Kratky, E.; Geiger, W.; Burri, J.; Dionisi, F.; Allan, M.; et al. Cholesterol-Lowering Properties of Amaranth Grain and Oil in Hamsters. Int. J. Vitam. Nutr. Res. 2003, 73, 39–47. [Google Scholar] [CrossRef] [PubMed]
  12. Huang, Z.R.; Lin, Y.K.; Fang, J.Y. Biological and Pharmacological Activities of Squalene and Related Compounds: Potential Uses in Cosmetic Dermatology. Molecules 2009, 14, 540–554. [Google Scholar] [CrossRef]
  13. Achigan-Dako, E.G.; Sogbohossou, O.E.D.; Maundu, P. Current knowledge on Amaranthus spp.: Research avenues for improved nutritional value and yield in leafy amaranths in sub-Saharan Africa. Euphytica 2014, 197, 303–317. [Google Scholar] [CrossRef]
  14. Rastogi, A.; Shukla, S. Amaranth: A New Millennium Crop of Nutraceutical Values. Crit. Rev. Food Sci. Nutr. 2013, 53, 109–125. [Google Scholar] [CrossRef]
  15. Begna, T. Role and economic importance of crop genetic diversity in food security. J. Agric. Sc. Food Technol. 2021, 7, 164–169. [Google Scholar]
  16. EL-Mansy, A.; Abd El-Moneim, D.; ALshamrani, S.; Safhi, F.; Abdein, M.; Ibrahim, A. Genetic Diversity Analysis of Tomato (Solanum lycopersicum L.) with Morphological, Cytological, and Molecular Markers under Heat Stress. Horticulturae 2021, 7, 65. [Google Scholar] [CrossRef]
  17. Kumar, C.; Singh, S.K.; Pramanick, K.K.; Verma, M.K.; Srivastav, M.; Singh, R.; Bharadwaj, C.; Naga, K.C. Morphological and biochemical diversity among the Malus species including indigenous Himalayan wild apples. Sci. Hortic. 2018, 233, 204–219. [Google Scholar] [CrossRef]
  18. Bhandari, H.R.; Bhanu, A.N.; Srivastava, K.; Singh, M.N.; Shreya; Hemantaranjan, A. Assessment of genetic diversity in crop plants—An overview. Adv. Plants Agric. Res. 2017, 7, 279–286. [Google Scholar]
  19. Kumar, P.; Gupta, V.K.; Misra, A.K.; Modi, D.R.; Pandey, B.K. Potential of molecular markers in plant biotechnology. Plant Omics J. 2009, 2, 141–162. [Google Scholar]
  20. Zhang, Y.; He, Q.; Zhou, X.; Zheng, S.; Wang, Y.; Li, P.; Wang, Y. Genetic diversity and population structure of 93 rice cultivars (lines) (Oryza sativa Xian group) in Qinba in China by 3 types of genetic markers. BMC Genom. 2022, 23, 550. [Google Scholar] [CrossRef] [PubMed]
  21. Kumar, R.; Kumar, C.; Paliwal, R.; Choudhury, D.R.; Singh, I.; Kumar, A.; Kumari, A.; Singh, R. Development of Novel Genomic Simple Sequence Repeat (g-SSR) Markers and Their Validation for Genetic Diversity Analyses in Kalmegh [Andrographis paniculata (Burm. F.) Nees]. Plants 2020, 9, 1734. [Google Scholar] [CrossRef]
  22. Paliwal, R.; Singh, R.; Choudhury, D.R.; Tiwari, G.; Kumar, A.; Bhat, K.C.; Singh, R. Molecular Characterization of Tinospora cordifolia (Willd.) Miers Using Novel g-SSR Markers and Their Comparison with EST-SSR and SCoT Markers for Genetic Diversity Study. Genes 2022, 13, 2042. [Google Scholar] [CrossRef] [PubMed]
  23. Jian, Y.; Yan, W.; Xu, J.; Duan, S.; Li, G.; Jin, L. Genome-wide simple sequence repeat markers in potato: Abundance, distribution, composition, and polymorphism. DNA Res. 2021, 28, dsab020. [Google Scholar] [CrossRef]
  24. Singh, R.; Narzary, D.; Bhardwaj, J.; Singh, A.K.; Kumar, S.; Kumar, A. Molecular diversity and SSR transferability studies in Vetiver grass (Vetiveria zizanioides L. Nash). Ind. Crops Prod. 2014, 53, 187–198. [Google Scholar] [CrossRef]
  25. Choudhury, D.R.; Singh, N.; Singh, A.K.; Kumar, S.; Srinivasan, K.; Tyagi, R.K.; Ahmad, A.; Singh, N.K.; Singh, R. Analysis of Genetic Diversity and Population Structure of Rice Germplasm from North-Eastern Region of India and Development of a Core Germplasm Set. PLoS ONE 2014, 9, e113094. [Google Scholar] [CrossRef] [PubMed] [Green Version]
  26. Ganesan, S.K.; Singh, R.; Choudhury, D.R.; Bharadwaj, J.; Gupta, V.; Singode, A. Genetic diversity and population structure study of drumstick (Moringa oleifera Lam.) using morphological and SSR markers. Ind. Crops Prod. 2014, 60, 316–325. [Google Scholar] [CrossRef]
  27. Hipparagi, Y.; Singh, R.; Choudhury, D.R.; Gupta, V. Genetic diversity and population structure analysis of Kala bhat (Glycine max (L.) Merrill) genotypes using SSR markers. Hereditas 2017, 154, 9. [Google Scholar] [CrossRef]
  28. Paliwal, R.; Kumar, R.; Choudhury, D.R.; Singh, A.K.; Kumar, S.; Kumar, A.; Bhatt, K.C.; Singh, R.; Mahato, A.K.; Singh, N.K.; et al. Development of genomic simple sequence repeats (g-SSR) markers in Tinospora cordifolia and their application in diversity analyses. Plant Gene 2016, 5, 118–125. [Google Scholar] [CrossRef]
  29. Kumar, C.; Kumar, R.; Singh, S.K.; Goswami, A.K.; Nagaraja, A.; Paliwal, R.; Singh, R. Development of novel g-SSR markers in guava (Psidium guajava L.) cv. Allahabad Safeda and their application in genetic diversity, population structure and cross species transferability studies. PLoS ONE 2020, 15, e0237538. [Google Scholar] [CrossRef]
  30. Das, M.; Banerjee, S.; Dhariwal, R.; Vyas, S.; Mir, R.R.; Topdar, N.; Kundu, A.; Khurana, J.P.; Tyagi, A.K.; Sarkar, D.; et al. Development of SSR markers and construction of a linkage map in jute. J. Genet. 2012, 91, 21–31. [Google Scholar] [CrossRef]
  31. Kaur, G.; Joshi, A.; Jain, D. SSR-Marker assisted evaluation of Genetic Diversity in Mungbean (Vigna radiata (L.) Wilcezk) genotypes. Braz. Arch. Biol. Technol. 2018, 61. [Google Scholar] [CrossRef]
  32. Moe, K.T.; Zhao, W.; Song, H.S.; Kim, Y.H.; Chung, J.W.; Cho, Y.I.; Park, P.H.; Park, H.S.; Chae, S.C.; Park, Y.J. Development of SSR markers to study diversity in the genus Cymbidium. Biochem. Syst. Ecol. 2010, 38, 585–594. [Google Scholar] [CrossRef]
  33. Govindaraj, M.; Vetriventhan, M.; Srinivasan, M. Importance of Genetic Diversity Assessment in Crop Plants and Its Recent Advances: An Overview of Its Analytical Perspectives. Genet. Res. Int. 2015, 2015, 431487. [Google Scholar] [CrossRef]
  34. Lee, J.R.; Hong, G.Y.; Dixit, A.; Chung, J.W.; Ma, K.H.; Lee, J.H.; Kang, H.K.; Cho, Y.H.; Gwag, J.G.; Park, Y.J. Characterization of microsatellite loci developed for Amaranthus hypochondriacus and their cross-amplifications in wild species. Conserv. Genet. 2007, 9, 243–246. [Google Scholar] [CrossRef]
  35. Faseela, K.V.; Salikutty, J. Molecular characterization of amaranth landraces and assessment of interspecific relationships among Amaranthus spp. (L.) using RAPD markers. Indian J. Genet. Plant Breed. 2007, 67, 12–17. [Google Scholar]
  36. Park, Y.J.; Nishikawa, T.; Matsushima, K.; Minami, M.; Nemoto, K. A rapid and reliable PCR-restriction fragment length polymorphism (RFLP) marker for the identification of Amaranthus cruentus species. Breed Sci. 2014, 64, 422–426. [Google Scholar] [CrossRef] [Green Version]
  37. Chandi, A.; Milla-Lewis, S.R.; Jordan, D.L.; York, A.C.; Burton, J.D.; Zuleta, M.C.; Whitaker, J.R.; Culpepper, A.S. Use of AFLP Markers to Assess Genetic Diversity in Palmer Amaranth (Amaranthus palmeri) Populations from North Carolina and Georgia. Weed Sci. 2013, 61, 136–145. [Google Scholar] [CrossRef]
  38. Jimenez, F.R.; Maughan, P.J.; Alvarez, A.; Kietlinski, K.D.; Smith, S.M.; Pratt, D.B.; Elzinga, D.B.; Jellen, E.N. Assessment of Genetic Diversity in Peruvian Amaranth (Amaranthus caudatus and A. hybridus) Germplasm using Single Nucleotide Polymorphism Markers. Crop Sci. 2013, 53, 532–541. [Google Scholar] [CrossRef]
  39. Wang, X.Q.; Park, Y.J. Comparison of Genetic Diversity among Amaranth Accessions from South and Southeast Asia using SSR Markers. Korean J. Med. Crop Sci. 2013, 21, 220–228. [Google Scholar] [CrossRef]
  40. Suresh, S.; Chung, J.W.; Cho, G.T.; Sung, J.S.; Park, J.H.; Gwag, J.G.; Baek, H.J. Analysis of molecular genetic diversity and population structure in Amaranthus germplasm using SSR markers. Plant Biosyst.—Int. J. Deal. All Asp. Plant Biol. 2014, 148, 635–644. [Google Scholar]
  41. Nguyen, D.C.; Tran, D.S.; Tran, T.T.H.; Ohsawa, R.; Yoshioka, Y. Genetic diversity of leafy amaranth (Amaranthus tricolor L.) resources in Vietnam. Breed. Sci. 2019, 69, 640–650. [Google Scholar] [CrossRef]
  42. Sahu, S.K.; Thangaraj, M.; Kathiresan, K. DNA Extraction Protocol for Plants with High Levels of Secondary Metabolites and Polysaccharides without Using Liquid Nitrogen and Phenol. ISRN Mol. Biol. 2012, 2012, 205049. [Google Scholar] [CrossRef]
  43. Liu, K.; Muse, S.V. PowerMarker: An integrated analysis environment for genetic marker analysis. Bioinformatics 2005, 21, 2128–2129. [Google Scholar] [CrossRef] [PubMed]
  44. Botstein, D.; White, R.L.; Skolnick, M.; Davis, R.W. Construction of a genetic linkage map in man using restriction fragment length polymorphisms. Am. J. Hum. Genet. 1980, 32, 314–331. [Google Scholar] [PubMed]
  45. Peakall, R.; Smouse, P.E. GenAlEx 6.5: Genetic analysis in Excel. Population genetic software for teaching and research-an update. Bioinformatics 2012, 28, 2537–2539. [Google Scholar] [CrossRef]
  46. Perrier, X.; Flori, A.; Bonnot, F. Data Analysis Methods. In Genetic Diversity of Cultivated Tropical Plants; Hamon, P., Seguin, M., Perrier, X., Glaszmann, J.C., Eds.; Science Publishers: Enfield, UK, 2003; pp. 43–76. [Google Scholar]
  47. Pritchard, J.K.; Stephens, M.; Donnelly, P. Inference of population structure using multilocus genotype data. Genetics 2000, 155, 945–959. [Google Scholar] [CrossRef]
  48. Barba de la Rosa, A.; Fomsgaard, I.S.; Laursen, B.; Mortensen, A.G.; Olvera-Martínez, L.; Silva-Sánchez, C.; Mendoza-Herrera, A.; Gonzalez-Castaneda, J.; De León-Rodríguez, A. Amaranth (Amaranthus hypochondriacus) as an alternative crop for sustainable food production: Phenolic acids and flavonoids with potential impact on its nutraceutical quality. J. Cereal Sci. 2009, 49, 117–121. [Google Scholar] [CrossRef]
  49. Brown, A.H.D. Core collections: A practical approach to genetic resources management. Genome 1989, 31, 818–824. [Google Scholar] [CrossRef]
  50. Fatinah, A.A.; Arumingtyas, E.L.; Mastuti, R. Morphological and genetic variation of Amaranthus spinosus L.: An adaptation evidence of climate differences and gene interaction. Int. J. Biosci. 2013, 11, 205–212. [Google Scholar]
  51. Miah, G.; Rafii, M.; Ismail, M.; Puteh, A.; Rahim, H.; Islam, K.; Latif, M. A Review of Microsatellite Markers and Their Applications in Rice Breeding Programs to Improve Blast Disease Resistance. Int. J. Mol. Sci. 2013, 14, 22499–22528. [Google Scholar] [CrossRef]
  52. Khaing, A.A.; Moe, K.T.; Chung, J.W.; Baek, H.J.; Park, Y.J. Genetic diversity and population structure of the selected core set inAmaranthus using SSR markers. Plant Breed. 2013, 132, 165–173. [Google Scholar] [CrossRef]
  53. Mallory, M.A.; Hall, R.V.; McNabb, A.R.; Pratt, D.B.; Jellen, E.N.; Maughan, P.J. Development and Characterization of Microsatellite Markers for the Grain Amaranths. Crop Sci. 2008, 48, 1098. [Google Scholar] [CrossRef]
  54. Rae, S.J.; Aldam, C.; Dominguez, I.; Hoebrechts, H.; Barnes, S.R.; Edwards, K.J. Development and incorporation of microsatellite markers into the linkage map of sugar beet (Beta vulgaris spp.). Appl Genet. 2000, 100, 1240–1248. [Google Scholar] [CrossRef]
  55. Mason, S.L.; Stevens, M.R.; Jellen, E.N.; Bonifacio, A.; Fairbanks, D.J.; Coleman, C.E.; McCarty, R.R.; Rasmussen, A.G.; Maughan, P.J. Development and Use of Microsatellite Markers for Germplasm Characterization in Quinoa (Chenopodium quinoa Willd.). Crop Sci. 2005, 45, 1618–1630. [Google Scholar] [CrossRef]
  56. Tiwari, K.K.; Thakkar, N.J.; Dharajiya, D.T.; Bhilocha, H.L.; Barvaliya, P.P.; Galvadiya, B.P.; Prajapati, N.N.; Patel, M.P.; Solanki, S.D. Genome-wide microsatellites in amaranth: Development, characterization, and cross-species transferability. 3 Biotech 2021, 11, 395. [Google Scholar] [CrossRef]
  57. Gupta, S.; Kumari, K.; Muthamilarasan, M.; Subramanian, A.; Prasad, M. Development and utilization of novel SSRs in foxtail millet [Setaria italica (L.) P. Beauv.]. Plant Breed. 2013, 132, 367–374. [Google Scholar] [CrossRef]
  58. Patil, P.G.; Singh, N.V.; Parashuram, S.; Bohra, A.; Sowjanya, R.; Gaikwad, N.; Mundewadikar, D.M.; Sangnure, V.R.; Jamma, S.M.; Injak, A.S.; et al. Genome-wide characterization and development of simple sequence repeat markers for genetic studies in pomegranate (Punica granatum L.). Trees 2020, 34, 987–998. [Google Scholar] [CrossRef]
Figure 1. Distribution of grain amaranth accessions across India.
Agriculture 13 00431 g001
Figure 2. Neighbor-Joining tree analysis across 94 accessions of A. hypochondriacus. Three major clusters were observed. Different colors denote the accessions belonging to different states.
Agriculture 13 00431 g002
Figure 3. Value of Delta K (ΔK) for determining the optimum number of subpopulations.
Agriculture 13 00431 g003
Figure 4. Bar plot generated by population structure analysis of 94 A. hypochondriacus accessions based on K = 2. The name of accessions in different colors represents their different states of origin.
Agriculture 13 00431 g004
Figure 5. AMOVA analysis depicting variation among populations and within individual accessions. (a) The AMOVA analysis based on geographical origin, and (b) AMOVA analysis based on model-based population structure analysis.
Agriculture 13 00431 g005
Figure 6. Principal coordinates analysis (PCoA) plot showing the distribution of 94 accessions according to 36 g-SSRs.
Agriculture 13 00431 g006
Table 1. Characteristics and genetic diversity indices of 36 g-SSR loci used for genotyping 94 accessions of A. hypochondriacus.
S.No.Marker NameScaffold Numberg-SSR Start Positiong-SSR End PositionMAFAllele NoGDHoPIC
1AhySSR0595Scaffolds_1568861356886660.467930.63040.91030.5557
2AhySSR3176Scaffolds_123101765231018060.505420.49990.98910.375
3AhySSR4597Scaffolds_135176079351761780.591540.49770.76830.391
4AhySSR0261Scaffolds_1261822626182700.506820.49990.93150.375
5AhySSR1363Scaffolds_1022467372224674070.690220.42760.57610.3362
6AhySSR33457Scaffolds_1039900399150.732120.39220.51190.3153
7AhySSR37960Scaffolds_11962891696289450.76430.36560.4270.3065
8AhySSR39451Scaffolds_1122234840222348660.286580.81020.85390.7845
9AhySSR38506Scaffolds_1114445677144457150.97820.0430.0440.0421
10AhySSR0471Scaffolds_1118505355185054160.977320.04440.04550.0434
11AhySSR41001Scaffolds_1212761843127618770.880720.21020.07950.1881
12AhySSR39465Scaffolds_1240173402110.53920.4970.29870.3735
13AhySSR12555Scaffolds_131467461468170.798720.32160.40260.2699
14AhySSR43989Scaffolds_13952419495242110.483950.57970.93550.4904
15AhySSR43465Scaffolds_13617513961751800.534280.65380.43840.6173
16AhySSR44477Scaffolds_1313640854136408770.947720.09920.08140.0943
17AhySSR46467Scaffolds_14729522772952700.505320.49990.92550.375
18AhySSR48966Scaffolds_15688953668896370.598830.53490.80250.457
19AhySSR49996Scaffolds_1513907952139080260.532580.62730.93510.5736
20AhySSR0542Scaffolds_1511049934110500330.549520.49510.83520.3725
21AhySSR51527Scaffolds_16835365483537370.744360.43010.51140.4124
22AhySSR51061Scaffolds_16428447042844890.752720.37230.49460.303
23AhySSR5081Scaffolds_2102060410206390.3444100.753310.7189
24AhySSR8059Scaffolds_222784760227848310.577420.4880.01190.3689
25AhySSR11576Scaffolds_316269717162697920.63320.46460.67020.3567
26AhySSR12579Scaffolds_323384578233846880.792620.32880.41490.2748
27AhySSR16096Scaffolds_418892950188929760.572240.55660.85560.4796
28AhySSR18586Scaffolds_510835301108353480.447160.682810.6324
29AhySSR19060Scaffolds_514161515141616190.4718100.66460.95770.6119
30AhySSR18091Scaffolds_5746111374611630.619320.47150.76140.3604
31AhySSR23586Scaffolds_620936577209366390.367350.70970.93880.6602
32AhySSR21572Scaffolds_6605158360516040.950620.09390.07410.0895
33AhySSR28598Scaffolds_810843033108430920.674420.43920.65120.3427
34AhySSR29093Scaffolds_814673069146731190.490260.6820.72550.6407
35AhySSR29571Scaffolds_817923890179239610.340490.807710.7855
36AhySSR31577Scaffolds_9784989778499470.982820.03390.01150.0333
Mean 0.62863.83330.46410.60750.4002
Table 2. Percentage of polymorphic loci detected by 36 g-SSR markers across A. hypochondriacus populations, state-wise.
PopulationPercent PolymorphismIHoHe
Himachal Pradesh100.00%0.8830.5550.497
Uttarakhand97.22%0.820.5270.48
Maharashtra91.67%0.7510.4840.459
Gujarat91.67%0.7150.5470.444
Madhya Pradesh75.00%0.5870.5830.39
Exotic species80.56%0.5480.5830.368
Unknown83.33%0.6510.4350.412
Other63.89%0.490.4310.33
Mean85.42%0.6810.5180.423
Table 3. Percentage of cumulative variation explained by the first three axes among amaranth accessions in PCoA analysis.
AxisAxis-1Axis-2Axis-3
Variation (%)11.728.517.48
Cumulative variation (%)11.7220.2327.71
Disclaimer/Publisher’s Note: The statements, opinions and data contained in all publications are solely those of the individual author(s) and contributor(s) and not of MDPI and/or the editor(s). MDPI and/or the editor(s) disclaim responsibility for any injury to people or property resulting from any ideas, methods, instructions or products referred to in the content.

