
Weight Prediction of Landlly Pigs from Morphometric Traits in Different Age Classes Using ANN and Non-Linear Regression Models
 and
and
Abstract
:1. Introduction
2. Materials and Methods
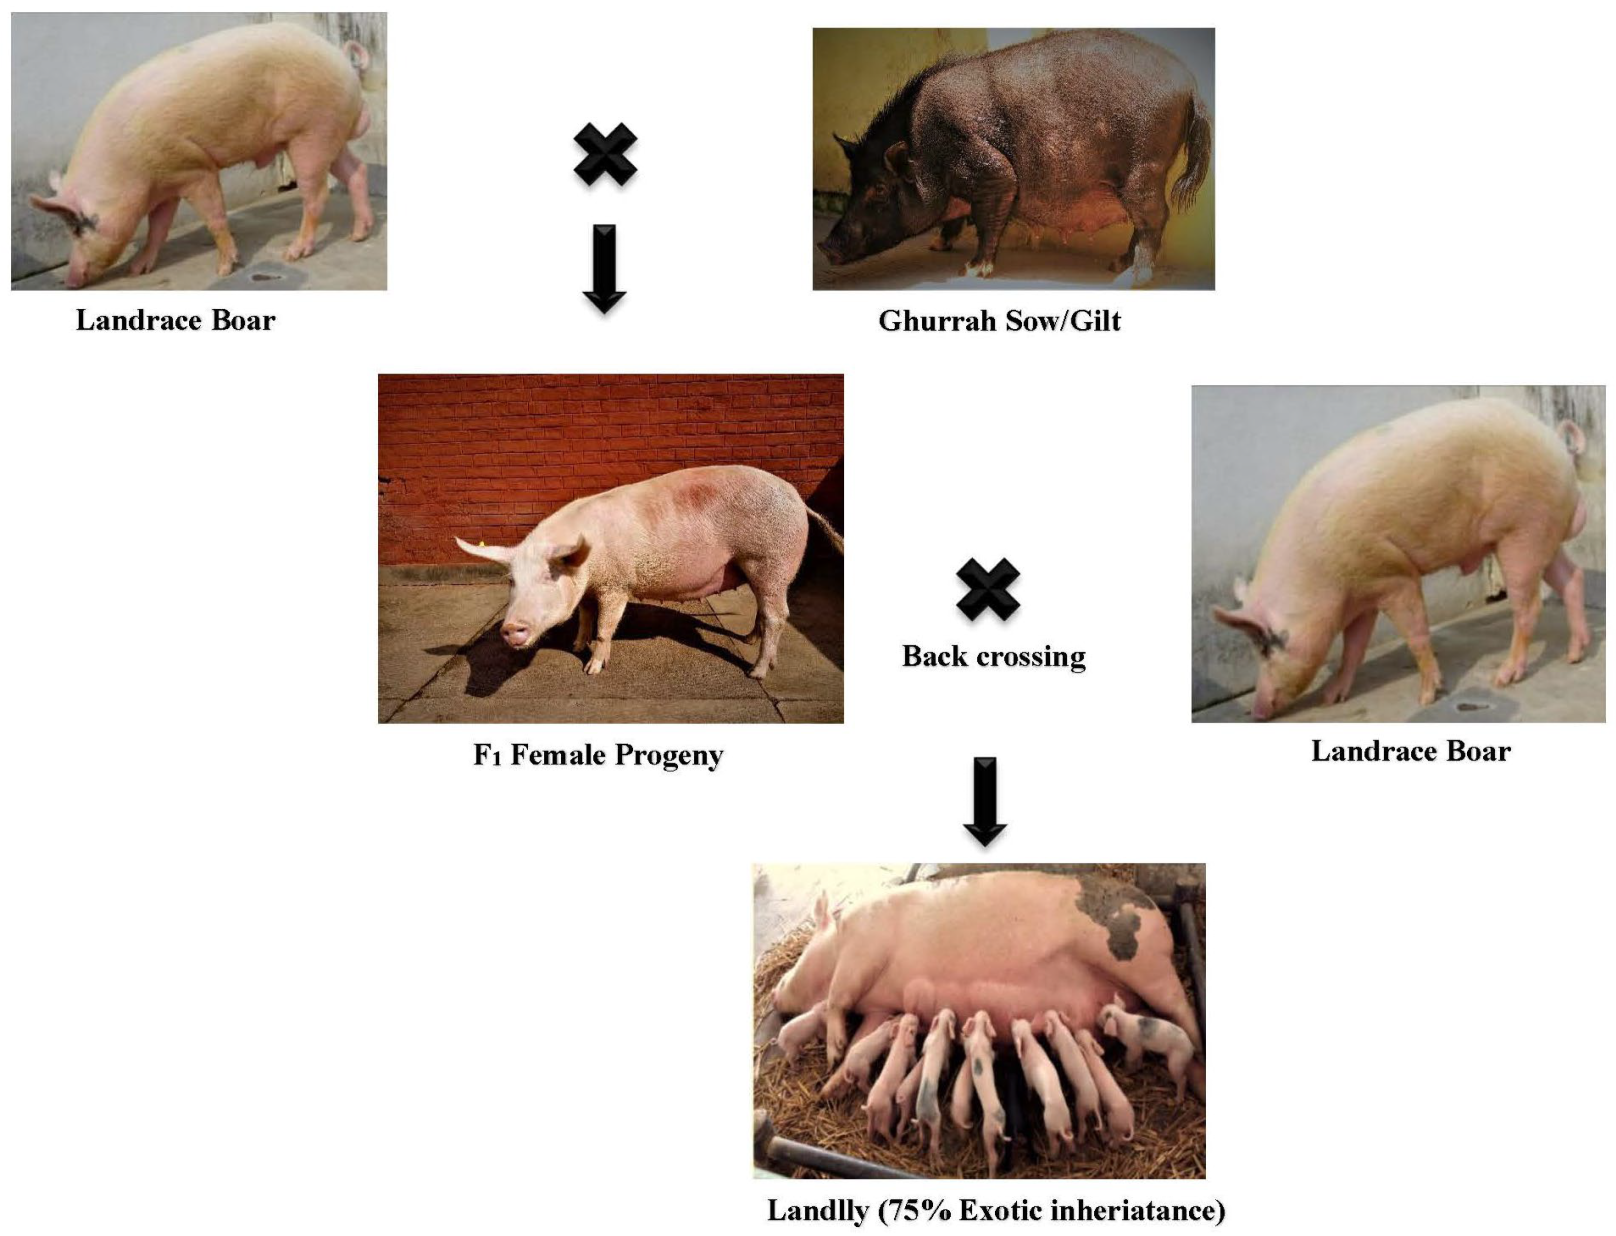
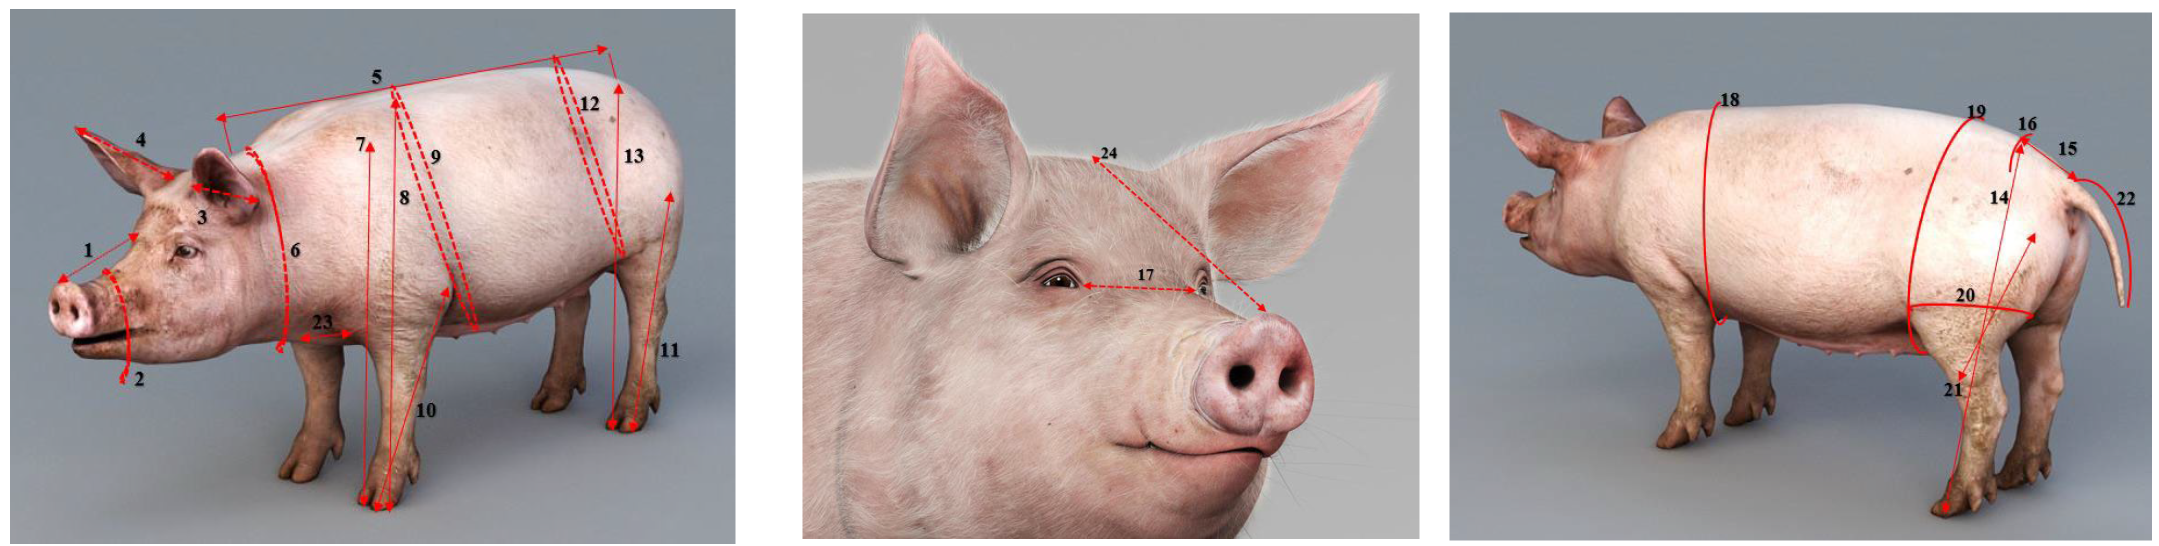
2.1. Population, Data Collection and Management
2.2. Data Modelling
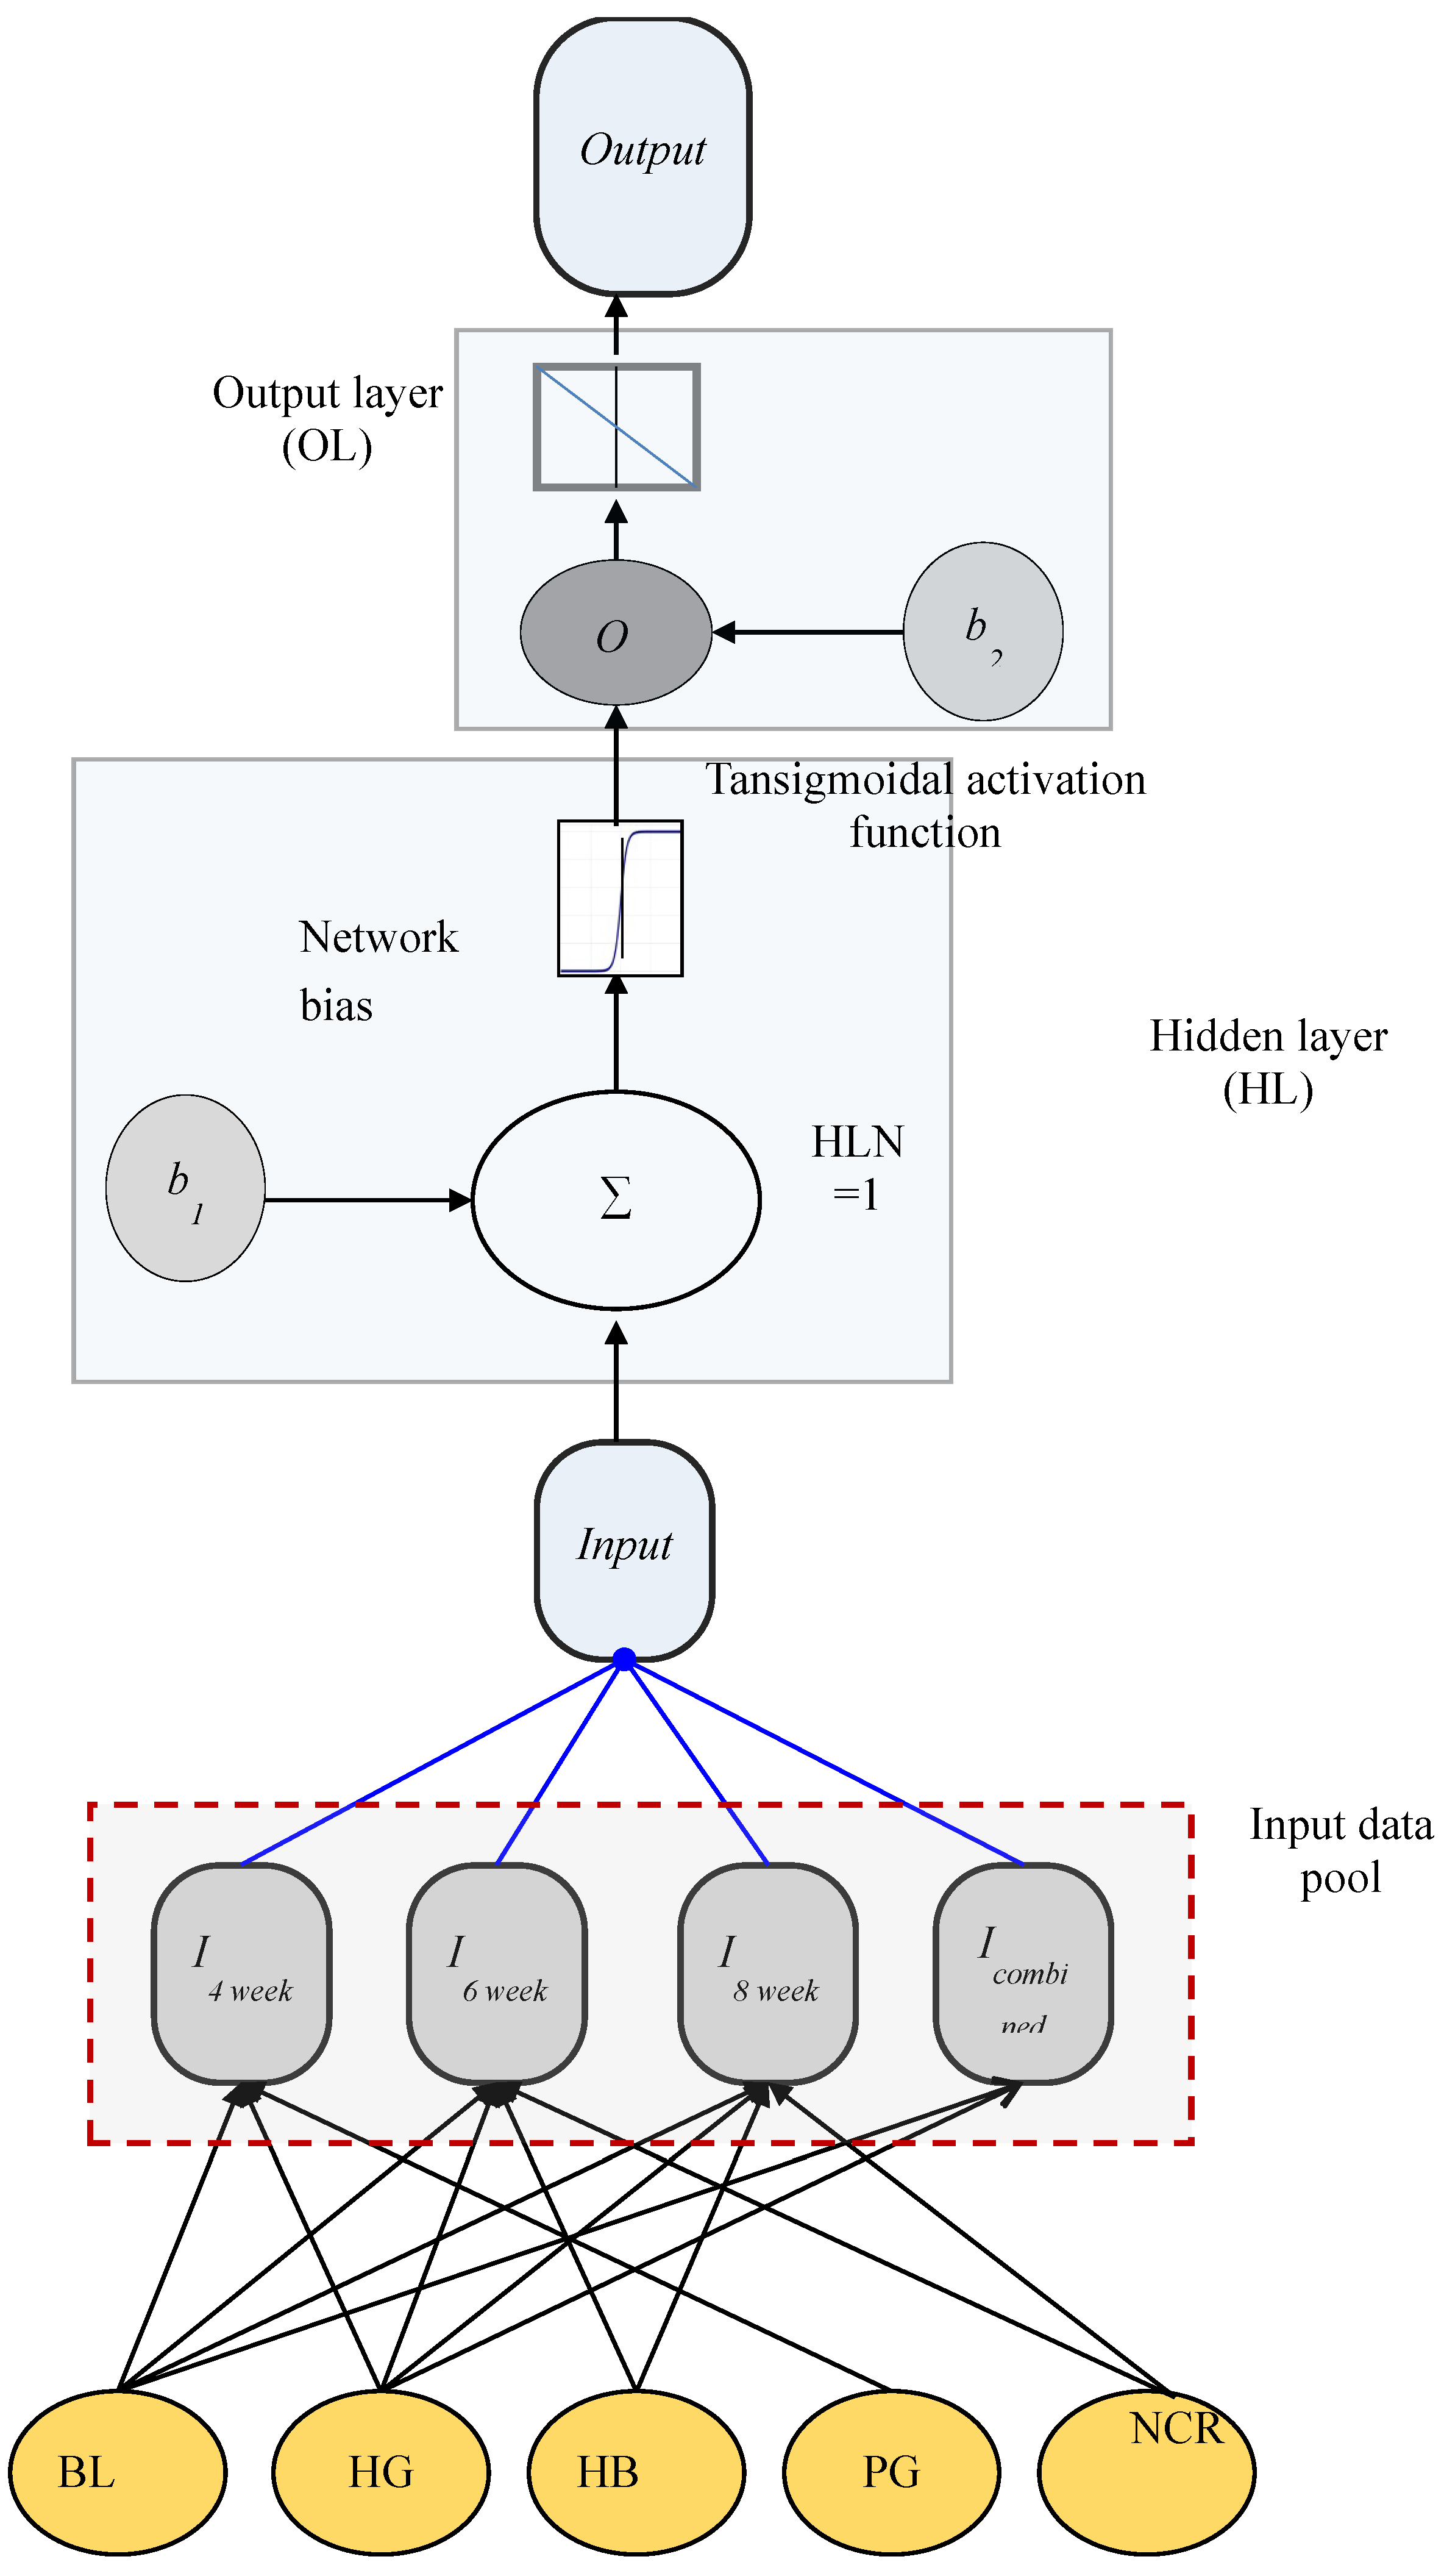
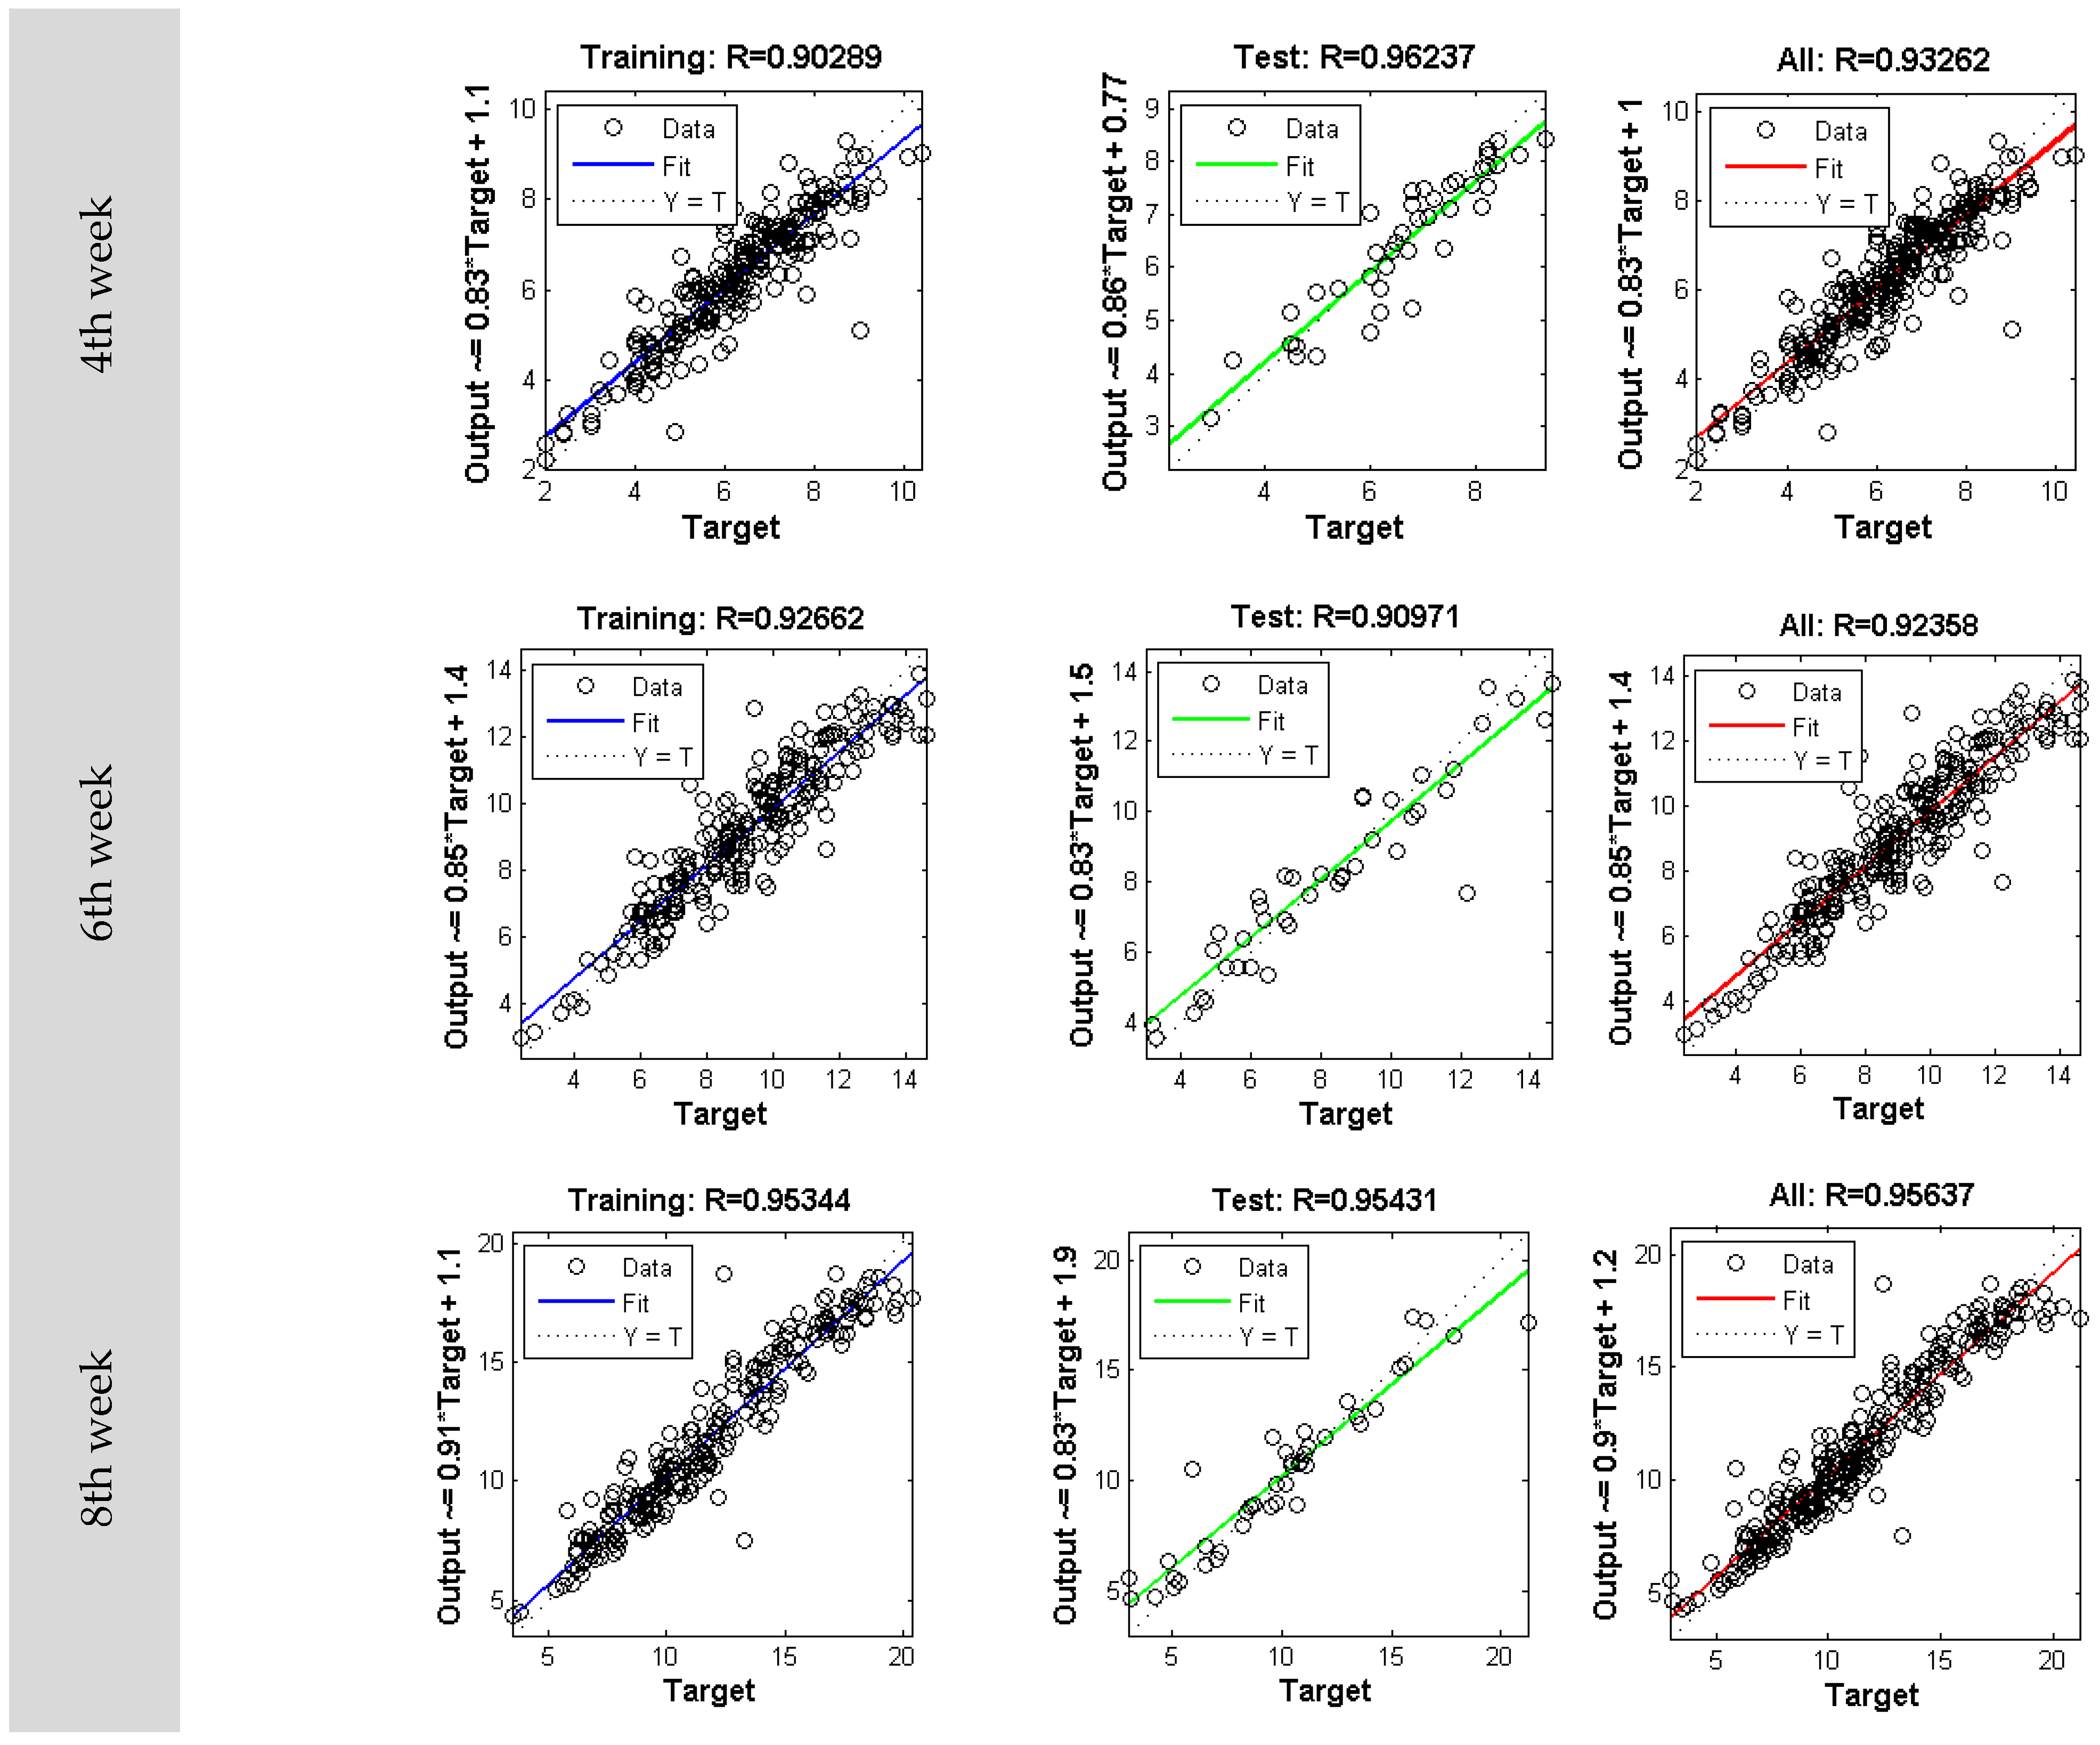
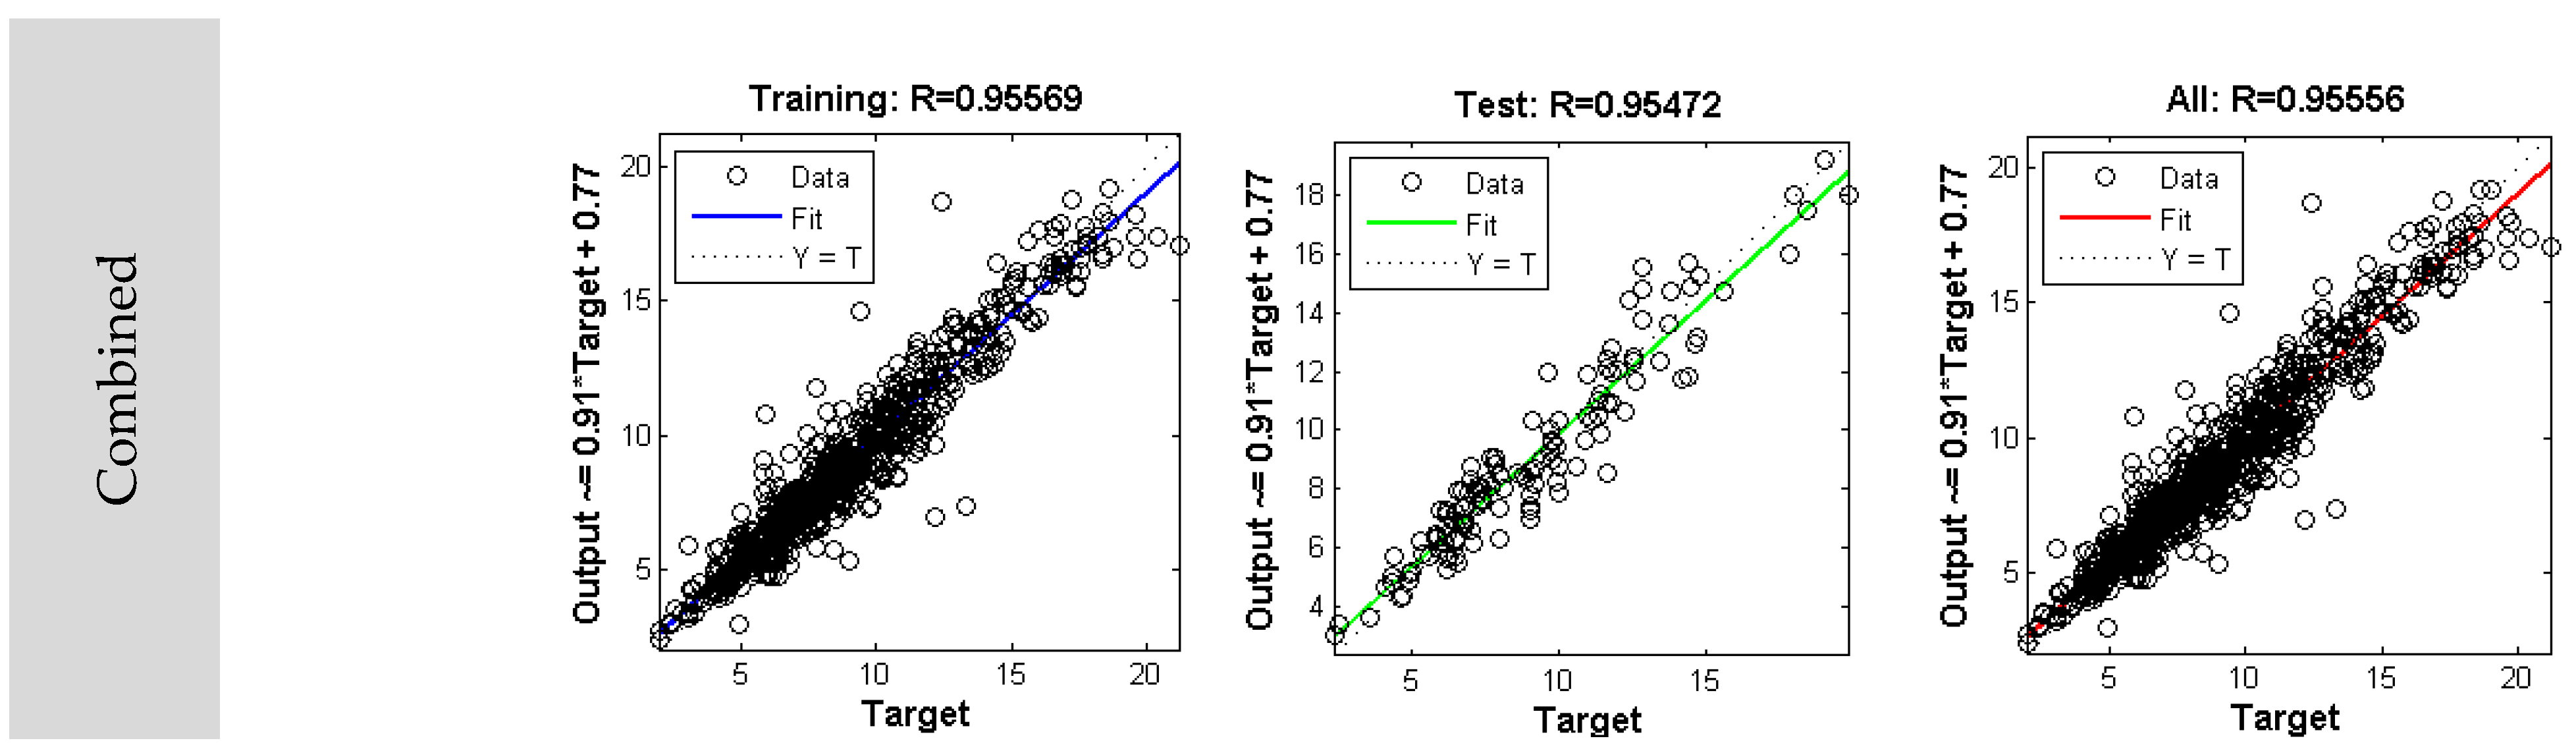
2.2.1. Artificial Neural Network Models
2.2.2. Non-Linear Regression Models
3. Results and Discussion
4. Conclusions
Author Contributions
Funding
Institutional Review Board Statement
Data Availability Statement
Conflicts of Interest
References
- BAHS. Basic Animal Husbandry Statistics. 2019. Available online: https://dahd.nic.in/circulars/basic-animal-husbandry-statistics-2019 (accessed on 10 March 2022).
- Ho, K.Y.; Tsai, Y.J.; Kuo, Y.F. Automatic monitoring of lactation frequency of sows and movement quantification of newborn piglets in farrowing houses using convolutional neural networks. Comput. Electron. Agric. 2021, 189, 106376. [Google Scholar] [CrossRef]
- Qiao, Y.; Kong, H.; Clark, C.; Lomax, S.; Su, D.; Eiffert, S.; Sukkarieh, S. Intelligent perception for cattle monitoring: A review for cattle identification, body condition score evaluation, and weight estimation. Comp. Electron. Agric. 2021, 185, 106143. [Google Scholar] [CrossRef]
- Panda, S.; Gaur, G.K.; Jena, D.; Chhotaray, S.; Tarang, M.; Wara, A.B. Principal component analysis of litter traits in crossbred piglets. Pharma Innov. J. 2020, 9, 31–33. [Google Scholar]
- Reproto, R.O. Genetic Selection and Advances in Swine Breeding: A Review of its Impact on Sow’s Reproductive Traits. Int. J. Res. 2020, 7, 41–52. [Google Scholar]
- Dohmen, R.; Catal, C.; Liu, Q. Image-based body mass prediction of heifers using deep neural networks. Biosyst. Eng. 2021, 204, 283–293. [Google Scholar] [CrossRef]
- He, H.; Qiao, Y.; Li, X.; Chen, C.; Zhang, X. Automatic weight measurement of pigs based on 3D images and regression network. Comput. Electron. Agric. 2021, 187, 106299. [Google Scholar] [CrossRef]
- Meckbach, C.; Tiesmeyer, V.; Traulsen, I. A promising approach towards precise animal weight monitoring using convolutional neural networks. Comput. Electron. Agric. 2021, 183, 106056. [Google Scholar] [CrossRef]
- Kumari, A.; Dutt, T.; Kumar, A.; Verma, M.R.; Tiwari, R. Evaluation of Morphometric Measurements to Estimate Body Weight in Crossbred Landlly Pigs (Landrace·desi). J. Anim. Res. 2020, 10, 1099–1102. [Google Scholar] [CrossRef]
- Tsegaye, D.; Belay, B.; Haile, A. Linear body measurements as predictor of body weight in hararghe highland goats under farmers environment: Ethiopia. Glob. Vet. 2013, 11, 649–656. [Google Scholar]
- Mahieu, M.; Navès, M.; Arquet, R. Predicting the body mass of goats from body measurements. Livestock Research for Rural Development. 2011, 23, 192. [Google Scholar]
- Thiruvenkadan, A.K. Determination of best fitted regression model for estimation of body weight in KanniAdu kids under farmer’s management system. Livest. Res. Rural Dev. 2005, 17, 76–87. [Google Scholar]
- Musa, A.M.; Elamin, K.M.; Mohammed, S.A.; Abdalla, H.O. Morphometric traits as indicators for body weight in Sudanese Kenana cattle. Online J. Anim. Feed Res. 2011, 1, 218–222. [Google Scholar]
- Hassan, H.E.; Elamin, K.M.; Yousif, I.A.; Musa, A.M.; Elkhairey, M.A. Evaluation of Body Weight and some Morphometric Traits at Various Ages in Local Rabbits of Sudan. J. Anim. Sci. Adv. 2012, 2, 407–415. [Google Scholar]
- Shafiq, M.; Khan, M.T.; Rehman, M.S.; Raziq, F.; Bughio, E.; Farooq, Z.; Gondal, M.A.; Rauf, M.; Liaqat, S.; Sarwar, F.; et al. Assessing growth performance, morphometric traits, meat chemical composition and cholesterol content in four phenotypes of naked neck chicken. Poult. Sci. 2022, 101, 101667. [Google Scholar] [CrossRef] [PubMed]
- Lukuyu, M.N.; Gibson, J.P.; Savage, D.B.; Duncan, A.J.; Mujibi, F.D.N.; Okeyo, A.M. Use of body linear measurements to estimate liveweight of crossbred dairy cattle in smallholder farms in Kenya. SpringerPlus 2016, 5, 63. [Google Scholar] [CrossRef] [PubMed]
- Silva, N.C.D.; Gaspar, R.C.; Chaves, A.S.; Geraseev, L.C.; Athayde, A.L.M.; Crocomo, L.F. Morphometric measurements of sheep fed with increasing levels of sunflower meal. Acta Sci. Anim. Sci. 2019, 41, e42891. [Google Scholar] [CrossRef]
- Obike, O.M.; Ibe, S.N.; Oke, U.K. Estimation of pre-and post-weaning body weight of rabbits in a humid tropical environment using linear body measurements. Am.-Eurasian J. Agric. Environ. Sci. 2010, 9, 440–444. [Google Scholar]
- Sarker, I.H. Machine learning: Algorithms, real-world applications and research directions. SN Comput. Sci. 2021, 2, 160. [Google Scholar] [CrossRef]
- Behzadi, M.R.B.; Aslaminejad, A.A. A comparison of neural network and nonlinear regression predictions of sheep growth. J. Anim. Vet. Adv. 2010, 9, 2128–2131. [Google Scholar] [CrossRef]
- Walugembe, M.; Nadiope, G.; Stock, J.D.; Stalder, K.J.; Pezo, D.; Rothschild, M.F. Prediction of live body weight using various body measurements in Ugandan village pigs. Livest. Res. Rural Dev. 2014, 26, 1. [Google Scholar]
- Sungirai, M.; Masaka, L.; Benhura, T.M. Validity of weight estimation models in pigs reared under different management conditions. Vet. Med. Int. 2014, 2014, 530469. [Google Scholar] [CrossRef] [PubMed]
- Birteeb, P.T.; Tetteh, S.O.; Salifu, A.S. Growth performance and weight estimation of Large White piglets weaned at different ages. Res. Rev. 2015, 4, 15–23. [Google Scholar]
- Cam, M.A.; Olfaz, M.; Soydan, E. Possibilities of using morphometrics characteristics as a tool for body weight prediction in Turkish Hair Goats (Kilkeci). Asian J. Anim. Vet. Adv. 2010, 5, 52–59. [Google Scholar] [CrossRef]
- Nosike, R.J.; Onunkwo, D.N.; Obasi, E.N.; Amaduruonye, W.; Ukwu, H.O.; Nwakpu, O.F.; Ezike, J.C.; Chijioke, E.I. Prediction of body weight with morphometric traits in some broiler chicken strains. Niger. J. Anim. Prod. 2017, 44, 15–22. [Google Scholar] [CrossRef]
- Ibrahim, A.; Artama, W.T.; Budisatria, I.G.S.; Yuniawan, R.; Atmoko, B.A.; Widayanti, R. Regression model analysis for prediction of body weight from body measurements in female Batur sheep of Banjarnegara District, Indonesia. Biodiversitas J. Biol. Divers. 2021, 22, 2723–2730. [Google Scholar] [CrossRef]
- Ruhil, A.P.; Raja, T.V.; Gandhi, R.S. Preliminary study on prediction of body weight from morphometric measurements of goats through ANN models. J. Indian Soc. Agric. Stat. 2013, 67, 51–58. [Google Scholar]
- Raja, T.V.; Venkatachalapathy, R.T.; Kannan, A.; Bindu, K.A. Determination of best-fitted regression model for prediction of body weight in Attappady black goats. Int. J. Agric. Sci. 2015, 5, 423–457. [Google Scholar]
- Basheer, I.A.; Hajmeer, M. Artificial neural networks: Fundamentals, computing, design, and application. J. Microbiol. Methods 2000, 43, 3–31. [Google Scholar] [CrossRef]
- Salawu, E.O.; Abdulraheem, M.; Shoyombo, A.; Adepeju, A.; Davies, S.; Akinsola, O.; Nwagu, B. Using artificial neural network to predict body weights of rabbits. Open J. Anim. Sci. 2014, 4, 48015. [Google Scholar] [CrossRef]
- Salehi, F.; Lacroix, R.; Wade, K.M. Improving dairy yield predictions through combined record classifiers and specialized artificial neural networks. Comput. Electron. Agric. 1998, 20, 199–213. [Google Scholar] [CrossRef]
- Pour, H.S.; Mohammadabadi, M.R.; AsadiFoozi, M.; Nezamabadi-Pour, H. Prediction of breeding values for the milk production trait in Iranian Holstein cows applying artificial neural networks. J. Livest. Sci. Technol. 2017, 5, 53–61. [Google Scholar]
- Roush, W.B.; Dozier, W.A., 3rd; Branton, S.L. Comparison of Gompertz and neural network models of broiler growth. Poult. Sci. 2006, 85, 794–797. [Google Scholar] [CrossRef] [PubMed]
- Raja, T.V.; Ruhil, A.P.; Gandhi, R.S. Comparison of connectionist and multiple regression approaches for prediction of body weight of goats. Neural Comp. Appl. 2012, 21, 119–124. [Google Scholar] [CrossRef]
- Akkol, S.; Akilli, A.; Cemal, I. Comparison of artificial neural network and multiple linear regression for prediction of live weight in hair goats. Yyu J. Agric. Sci. 2017, 27, 21–29. [Google Scholar]
- Khorshidi-Jalali, M.; Mohammadabadi, M.; Esmailizadeh, A.; Barazandeh, A.; Babenko, O. Comparison of Artificial Neural Network and Regression Models for Prediction of Body Weight in Raini Cashmere Goat. Iran. J. Appl. Anim. Sci. 2019, 9, 453–461. [Google Scholar]
- Panda, S.; Gaur, G.K.; Chauhan, A.; Kar, J.; Mehrotra, A. Accurate assessment of body weights using morphometric measurements in Landlly pigs. Trop. Anim. Health Prod. 2021, 53, 362. [Google Scholar] [CrossRef]
- Tarafdar, A.; Shahi, N.C.; Singh, A. Color assessment of freeze-dried mushrooms using Photoshop and optimization with genetic algorithm. J. Food Process Eng. 2020, 43, e12920. [Google Scholar] [CrossRef]
- Banik, S.; Naskar, S.; Pankaj, P.K.; Sahoo, N.R.; Tamuli, M.K.; Das, A. Effect of different body measurements on body weight in Ghungroo pigs. Indian J. Anim. Sci. 2012, 82, 1094. [Google Scholar]
- Groesbeck, C.N.; Lawrence, K.R.; Young, M.G.; Goodband, R.D.; DeRouchey, J.M.; Tokach, M.D.; Nelssen, J.L.; Dritz, S.S. Using Heart Girth to Determine Weight in Finishing Pigs; Kansas State University: Manhattan, KS, USA, 2002. [Google Scholar]
- Sabbioni, A.; Beretti, V.; Righi, F.; Superchi, P. Allometric coefficients for body measures and morphometric indexes in a meat-type sheep breed. Small Rumin. Res. 2016, 144, 248–254. [Google Scholar] [CrossRef]
- Chu, T.T.; Madsen, P.; Norberg, E.; Wang, L.; Marois, D.; Henshall, J.; Jensen, J. Genetic analysis on body weight at different ages in broiler chicken raised in commercial environment. J. Anim. Breed. Genet. 2020, 137, 245–259. [Google Scholar] [CrossRef]
- Ghotbaldini, H.; Mohammadabadi, M.; Nezamabadi-pour, H.; Babenko, O.I.; Bushtruk, M.V.; Tkachenko, S.V. Predicting breeding value of body weight at 6-month age using Artificial Neural Networks in Kermani sheep breed. Acta Sci. Anim. Sci. 2019, 41, e45282. [Google Scholar] [CrossRef] [Green Version]


| Age | Trait * | R2 |
|---|---|---|
| 4 weeks | HG | 0.8001 |
| BL | 0.7616 | |
| NCR | 0.7244 | |
| PG | 0.7002 | |
| HB | 0.6344 | |
| 6 weeks | BL | 0.8111 |
| HG | 0.7871 | |
| NCR | 0.7679 | |
| PG | 0.7429 | |
| HB | 0.7382 | |
| 8 weeks | HG | 0.8641 |
| BL | 0.8601 | |
| HB | 0.8008 | |
| NCR | 0.7971 | |
| PG | 0.7753 |
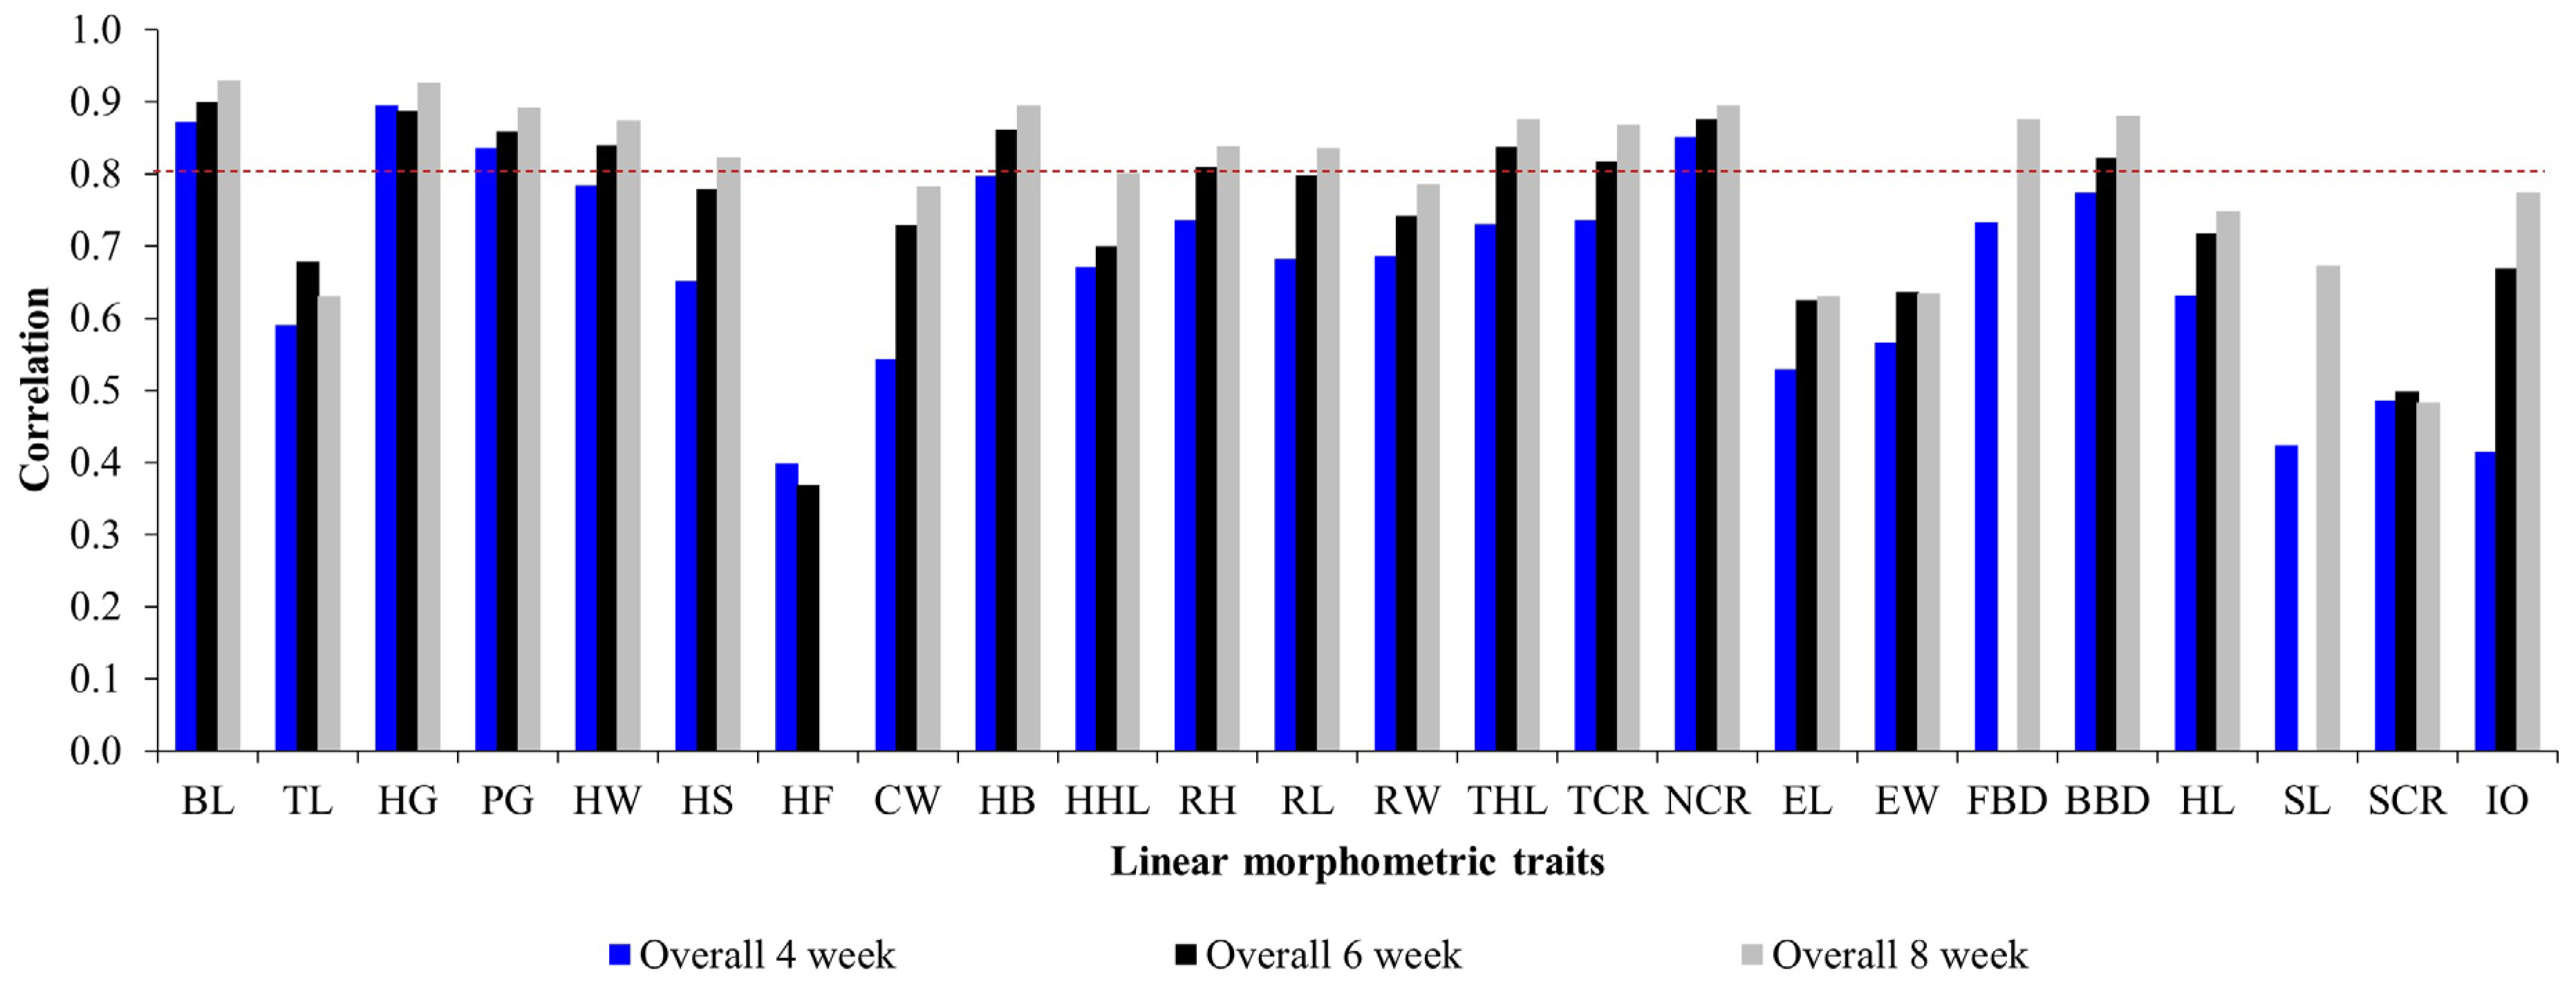
| Correlation | 4 Week | 6 Week | 8 Week |
|---|---|---|---|
| HG-BL | 0.87 ± 0.03 | 0.92 ± 0.05 | 0.90 ± 0.03 |
| BL-NCR | 0.83 ± 0.03 | 0.87 ± 0.05 | 0.87 ± 0.03 |
| NCR-PG | 0.85 ± 0.03 | 0.89 ± 0.04 | 0.88 ± 0.03 |
| PG-HB | 0.75 ± 0.04 | 0.83 ± 0.03 | 0.86 ± 0.03 |
| HB-HG | 0.83 ± 0.03 | 0.87 ± 0.04 | 0.90 ± 0.03 |
| HG-NCR | 0.89 ± 0.03 | 0.91 ± 0.05 | 0.91 ± 0.03 |
| HG-PG | 0.91 ± 0.02 | 0.95 ± 0.04 | 0.93 ± 0.02 |
| BL-PG | 0.81 ± 0.04 | 0.89 ± 0.04 | 0.87 ± 0.03 |
| NCR-HB | 0.75 ± 0.04 | 0.83 ± 0.05 | 0.84 ± 0.03 |
| BL-HB | 0.83 ± 0.03 | 0.90 ± 0.04 | 0.91 ± 0.03 |
| 4 Weeks | 6 Weeks | 8 Weeks | ||||||
|---|---|---|---|---|---|---|---|---|
| Combinations | Train MSE | Adj-R2 | Combinations | Train MSE | Adj-R2 | Combinations | Train MSE | Adj-R2 |
| BL-HG-PG-HB-NCR | 0.3788 | 0.829 | BL-HG-PG-HB-NCR | 0.9927 | 0.849 | BL-HG-PG-HB-NCR | 1.3915 | 0.909 |
| BL-HB | 0.6017 | 0.788 | BL-HB | 1.1551 | 0.821 | BL-HB | 1.8428 | 0.877 |
| BL-HB-NCR | 0.4978 | 0.850 | BL-HB-NCR | 0.8957 | 0.849 | BL-HB-NCR | 1.5035 | 0.899 |
| BL-HG | 0.4512 | 0.864 | BL-HG | 0.9626 | 0.830 | BL-HG | 1.4511 | 0.905 |
| BL-HG-HB | 0.4361 | 0.823 | BL-HG-HB | 1.0488 | 0.836 | BL-HG-HB | 1.3856 | 0.906 |
| BL-HG-HB-NCR | 0.4207 | 0.833 | BL-HG-HB-NCR | 0.8719 | 0.849 | BL-HG-HB-NCR | 1.2713 | 0.911 |
| BL-HG-NCR | 0.4475 | 0.862 | BL-HG-NCR | 0.9909 | 0.845 | BL-HG-NCR | 1.3438 | 0.909 |
| BL-HG-PG | 0.4419 | 0.867 | BL-HG-PG | 1.0231 | 0.830 | BL-HG-PG | 1.4508 | 0.904 |
| BL-HG-PG-HB | 0.3635 | 0.724 | BL-HG-PG-HB | 1.0001 | 0.835 | BL-HG-PG-HB | 1.2949 | 0.905 |
| BL-HG-PG-NCR | 0.446 | 0.867 | BL-HG-PG-NCR | 1.0037 | 0.843 | BL-HG-PG-NCR | 1.3149 | 0.908 |
| BL-NCR | 0.4898 | 0.778 | BL-NCR | 0.9779 | 0.842 | BL-NCR | 1.6412 | 0.894 |
| BL-PG | 0.4698 | 0.750 | BL-PG | 1.0477 | 0.823 | BL-PG | 1.6500 | 0.886 |
| BL-PG-HB | 0.489 | 0.804 | BL-PG-HB | 0.9311 | 0.837 | BL-PG-HB | 1.6124 | 0.891 |
| BL-PG-HB-NCR | 0.4699 | 0.857 | BL-PG-HB-NCR | 0.8993 | 0.848 | BL-PG-HB-NCR | 1.5419 | 0.902 |
| BL-PG-NCR | 0.4799 | 0.836 | BL-PG-NCR | 0.9789 | 0.843 | BL-PG-NCR | 1.5384 | 0.898 |
| HB-NCR | 0.5525 | 0.774 | HB-NCR | 1.0786 | 0.827 | HB-NCR | 1.9607 | 0.868 |
| HG-HB | 0.4074 | 0.756 | HG-HB | 1.1194 | 0.820 | HG-HB | 1.6972 | 0.883 |
| HG-HB-NCR | 0.9094 | 0.776 | HG-HB-NCR | 0.9789 | 0.838 | HG-HB-NCR | 1.5852 | 0.890 |
| HG-NCR | 0.5011 | 0.826 | HG-NCR | 1.2344 | 0.811 | HG-NCR | 1.7502 | 0.875 |
| HG-PG | 0.4984 | 0.806 | HG-PG | 1.3421 | 0.788 | HG-PG | 2.0297 | 0.864 |
| HG-PG-HB | 0.5001 | 0.843 | HG-PG-HB | 1.1056 | 0.822 | HG-PG-HB | 1.7812 | 0.883 |
| HG-PG-HB-NCR | 0.4473 | 0.813 | HG-PG-HB-NCR | 1.0774 | 0.836 | HG-PG-HB-NCR | 1.58000 | 0.891 |
| HG-PG-NCR | 0.5038 | 0.839 | HG-PG-NCR | 1.1990 | 0.811 | HG-PG-NCR | 1.725 | 0.875 |
| PG-HB | 0.6504 | 0.796 | PG-HB | 1.1592 | 0.807 | PG-HB | 2.2244 | 0.852 |
| PG-HB-NCR | 0.8982 | 0.759 | PG-HB-NCR | 0.9818 | 0.833 | PG-HB-NCR | 1.9429 | 0.877 |
| PG-NCR | 0.5695 | 0.704 | PG-NCR | 1.2357 | 0.793 | PG-NCR | 2.2363 | 0.844 |
| Age | Prediction Model | Error Variation |
|---|---|---|
| 4 weeks |  |  |
| 6 weeks |  |  |
| 8 weeks |  |  |
| Combined |  |  |
| Model | 4th Week a | 6th Week b | 8th Week b | Combined c | ||||||||
|---|---|---|---|---|---|---|---|---|---|---|---|---|
| R2 | MSE | AIC | R2 | MSE | AIC | R2 | MSE | AIC | R2 | MSE | AIC | |
| Linear regression | 0.834 | 0.436 | −94.08 | 0.853 | 0.936 | −0.13 | 0.908 | 1.388 | 47.55 | 0.900 | 1.243 | 83.81 |
| Non-linear regression | 0.842 | 0.425 | −87.85 | 0.855 | 0.960 | 14.53 | 0.916 | 1.307 | 52.63 | 0.914 | 1.080 | 37.53 |
| ANN | 0.869 | 0.441 | −87.20 | 0.852 | 0.871 | −2.73 | 0.913 | 1.271 | 43.05 | 0.913 | 1.004 | 14.48 |
Disclaimer/Publisher’s Note: The statements, opinions and data contained in all publications are solely those of the individual author(s) and contributor(s) and not of MDPI and/or the editor(s). MDPI and/or the editor(s) disclaim responsibility for any injury to people or property resulting from any ideas, methods, instructions or products referred to in the content. |
© 2023 by the authors. Licensee MDPI, Basel, Switzerland. This article is an open access article distributed under the terms and conditions of the Creative Commons Attribution (CC BY) license (https://creativecommons.org/licenses/by/4.0/).
Share and Cite
Preethi, A.L.; Tarafdar, A.; Ahmad, S.F.; Panda, S.; Tamilarasan, K.; Ruchay, A.; Gaur, G.K. Weight Prediction of Landlly Pigs from Morphometric Traits in Different Age Classes Using ANN and Non-Linear Regression Models. Agriculture 2023, 13, 362. https://doi.org/10.3390/agriculture13020362
Preethi AL, Tarafdar A, Ahmad SF, Panda S, Tamilarasan K, Ruchay A, Gaur GK. Weight Prediction of Landlly Pigs from Morphometric Traits in Different Age Classes Using ANN and Non-Linear Regression Models. Agriculture. 2023; 13(2):362. https://doi.org/10.3390/agriculture13020362
Chicago/Turabian StylePreethi, Andrew Latha, Ayon Tarafdar, Sheikh Firdous Ahmad, Snehasmita Panda, Kumar Tamilarasan, Alexey Ruchay, and Gyanendra Kumar Gaur. 2023. "Weight Prediction of Landlly Pigs from Morphometric Traits in Different Age Classes Using ANN and Non-Linear Regression Models" Agriculture 13, no. 2: 362. https://doi.org/10.3390/agriculture13020362