Article

Droplet Penetration Model Based on Canopy Porosity for Spraying Applications

College of Mechanical and Electronic Engineering, Nanjing Forestry University, Nanjing 210037, China
*
Author to whom correspondence should be addressed.
Agriculture 2023, 13(2), 339; https://doi.org/10.3390/agriculture13020339
Submission received: 23 November 2022 / Revised: 23 January 2023 / Accepted: 28 January 2023 / Published: 30 January 2023
(This article belongs to the Special Issue Agrochemical Ecology)

Abstract

:
Analysing the penetration and droplet deposition characteristics in the canopy of fruit trees is critical for optimising the operational parameters of air-assisted spraying equipment, achieving precise application of chemicals, and improving the effectiveness of fruit tree pest and disease control. We used a mobile LIDAR system to detect the tree canopy characteristics and optical porosity and conduct wind tunnel experiments to investigate the interaction between the tree canopy, the airflow field, and the droplet penetration ratio in the canopy of fruit trees. The results show that the relative wind velocity decreases rapidly during canopy penetration, and that the minimum value occurs at the back of the canopy. The smaller the optical porosity, the greater the reduction in wind velocity is. The quadratic exponential regression model had the highest coefficient of determination (R2) (0.9672) and the lowest root mean square error (RMSE) (5.56%). This paper provides information on optimising the spraying parameters, improving the pesticide utilisation rate, and selecting the optimum spraying conditions and application parameters.

1. Introduction

Pest and disease control are critical aspects of fruit tree cultivation and ensure high fruit quality [1,2]. Fruit trees are treated at least five to eight times a year during the growth cycle, and the application quality affects fruit yield and quality [3,4]. Fruit tree depression and canopy parameters affect the application performance. The leaves at the outer of the canopy block the spray droplets, preventing the spray from entering the interior. Thus, it is difficult to achieve an even distribution of the pesticide and a satisfactory performance [5,6,7,8,9]. The fan in the spraying equipment generates strong airflow to deliver the atomised liquid into the canopy of fruit trees, improving the pesticide utilisation and reducing environmental pollution. Therefore, it is crucial to investigate the penetration characteristics of the airflow in the canopy to optimise the operational parameters of the spraying equipment to achieve precise pesticide application and improve the effectiveness of fruit tree pest and disease control [10,11].
Cross et al. [12,13,14] investigated the effects of three factors—air volume, nozzle atomisation quality, and nozzle flow rate—on the droplet distribution and application effectiveness in the canopy of apple trees of different sizes. They showed that the air volume and spray flow rate of the sprayer had significant effects on droplet penetration and deposition. Xue et al. [15] investigated the effectiveness and droplet penetration of a wide sprayer in the canopy of an orchard and analysed the droplet deposition in four cross-sections of the target tree in spraying tests. Duga et al. [16] examined the relationship between tree canopy structure and spray deposition using spraying targets in four canopies with different structures, showing that the tree volume, canopy density, and leaf wall porosity significantly affected the droplet deposition rate. Concentrating the flow increased the penetration depth of the droplets. Therefore, the spraying parameters should be chosen based on the canopy structure of the crop to achieve good application results. Sun et al. [17] investigated the effects of pear leaf density, penetration distance, and sprayer airflow on the penetration, drift, and deposition rates of droplets in the canopy. They conducted spraying tests on pear trees at different times of the year and collected data to establish a model to estimate the penetration, flow, and deposition rates of droplets in the canopy of pear trees with different leaf densities. Subsequently, Sun et al. [18] constructed a quadratic exponential mathematical model of the droplet penetration rate and experimentally analysed the effects of leaf density, sampling depth, and airflow rate on the penetration ratio. Miranda-Fuentes et al. [19] investigated the effect of the airflow speed and application rate of air-assisted sprayers on the application performance in an olive tree orchard. The results of the experimental study provided information on the optimum application rate and airflow speed. A stochastic deposition model was established to calculate the droplet deposition rate on the leaves as a function of leaf optical porosity, leaf area density, and leaf droplet retention coefficient. The model was validated and used to calibrate the sprayer parameters to improve the spray efficiency and reduce the environmental impact [20]. Hong et al. [21] improved the canopy local branching equivalent porous medium model proposed by Endalew et al. by virtually defining the canopy with different profiles as a single porous medium with different shapes, and proposed a simplified equivalent porous medium model in order to reduce the complexity of the model and reduce the computational power requirements of the simulation.Chen et al. [22] developed one regression model between the amount of droplet deposition in the effective spray area and the factor Z-directional wind speed, and another regression model between the penetration of droplet deposition in the effective spray area and the factors Y and Z-directional wind speed, which can provide guidance for practical operations. Salcedo et al. [23] used a computational fluid dynamics (CFD) technique and regarded the citrus tree canopy as a porous body. They used three turbulence models to simulate air-assisted spraying and determine the airflow around the canopy. Wang [24] developed a three-dimensional microscopic canopy model that used the difference in the grey values between the tree canopy and the background to calculate the leaf area and optical porosity. The porosity was used to characterise the complex tree canopy structure, and a CFD model was used to investigate the air flow and other characteristics inside the canopy.
Most studies that investigated the airflow and droplet deposition rate of air-assisted sprayers conducted spray tests on real plants or used plant models to analyse the effects of the nozzle type, airflow speed, and application rate on the penetration characteristics of the droplets inside the plant canopy. Others used cameras or CFD simulation software to observe or predict droplet movement. Camera-based methods to obtain canopy porosity are the most commonly used, but their accuracy is influenced by the spectral characteristics of the measurement target and ambient light factors. LIDAR scans the target by actively emitting laser light to obtain 3D point cloud data of the target, which can more accurately describe the plant canopy structural parameters.Porosity is a critical parameter describing the internal structure of plant canopies and the spatial distribution of leaves because it influences the penetration and deposition rates of the droplets inside the canopy. We used LIDAR to characterise the tree canopy, obtain the optical porosity of a single tree, and study the influence of the airflow speed, optical porosity, and droplet penetration ratio in a wind tunnel test. We established a model to predict the penetration ratio of the droplets in the canopy to improve the pesticide utilisation rate and select the optimum spraying conditions and application parameters.

2. Determination of Canopy Porosity

Canopy porosity is divided into optical porosity and volumetric porosity. Optical porosity refers to the ratio of the void area in the plant canopy to the area of the canopy. Volumetric porosity refers to the ratio of the volume of the voids to the total volume. The porosity affects the penetration ratio of the droplets of air-assisted sprayers. Optical porosity can be regarded as the result of volumetric porosity in the projection plane and reflects the openness of the plant canopy. It is easier to obtain than volumetric porosity. Therefore, we calculated the optical porosity of the canopy to characterise it. The procedure for calculating optical porosity is shown in Figure 1.

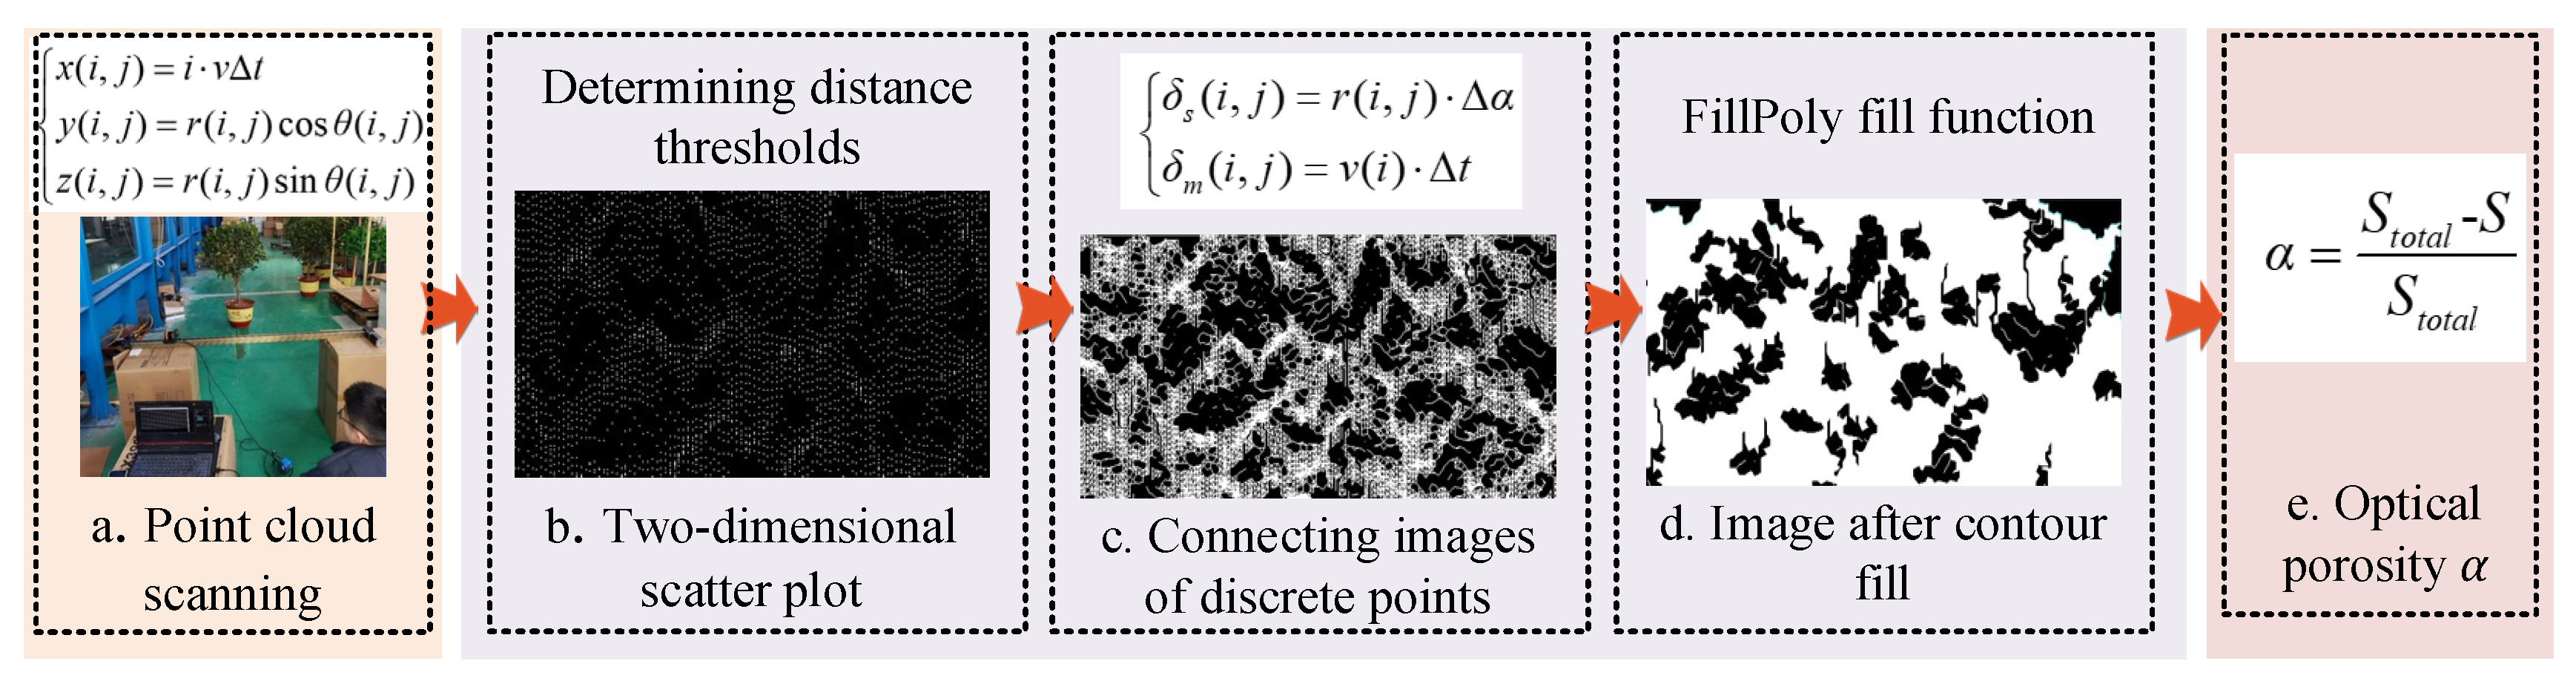
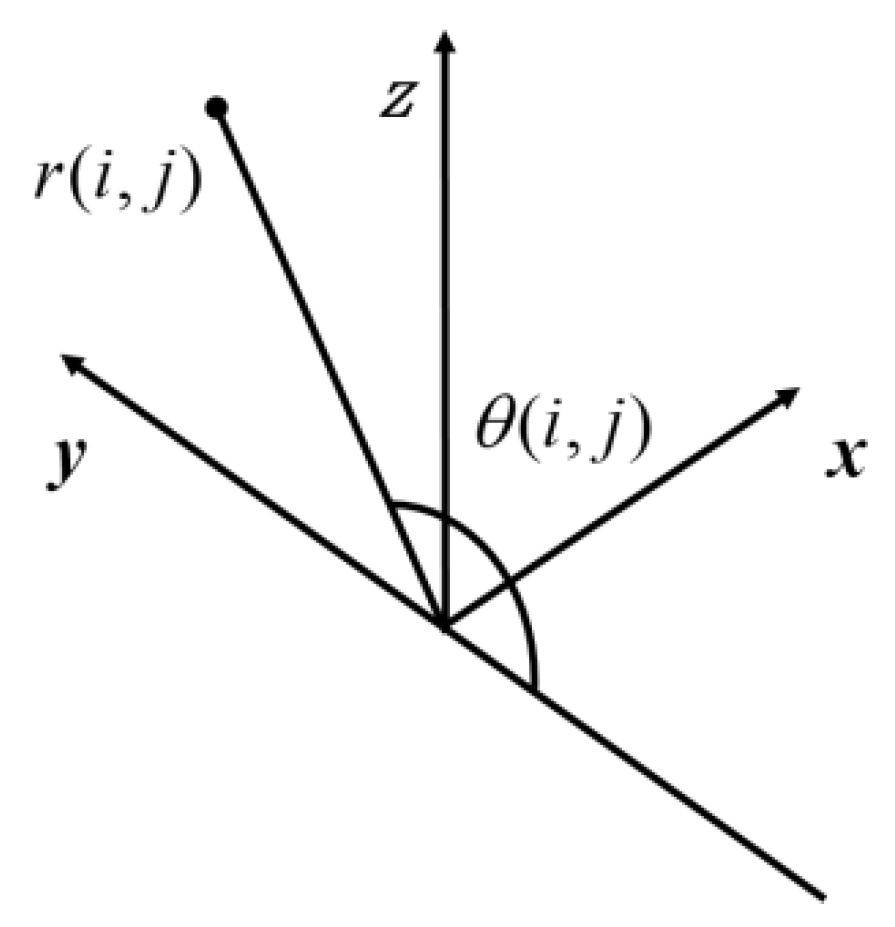
2.1. Point Cloud Data Acquisition

The laser point cloud data was obtained from a LIDAR scanning sensor and processed in the Visual Studio 2015 software. The data were acquired in a scanner-centric polar coordinate system and had to be converted into a Cartesian coordinate system. The polar coordinate system in which the LIDAR data were collected is shown in Figure 2, where θ is the laser beam angle, r is the distance, x is the moving direction of the LIDAR instrument, y is the scanning direction, and z is the direction perpendicular to the ground.
The points ( i , j ) in polar coordinates were mapped to the 3D coordinates of the Cartesian coordinate system using Equation (1):
x ( i , j ) = i v Δ t y ( i , j ) = r ( i , j ) cos θ ( i , j ) z ( i , j ) = r ( i , j ) sin θ ( i , j )
where θ ( i , j ) is the scan angle of the j-th point in frame i.

2.2. Generating a Two-Dimensional Image Scatter

The dat data file was converted to a text format, and the Numpy matrix library was used to convert the 3D Cartesian coordinates in the text format to a 1D matrix. All parameters in the matrix were converted from floating-point data to integer data to facilitate subsequent processing. The matrix data were divided into three columns representing [X, Y, Z] in the point cloud data. The maximum values (Xmax, Ymax, Zmax), minimum values (Xmin, Ymin, Zmin), and maximum differences (W, L, Hc) were calculated for the three columns. The maximum differences of the three columns represent the interval lengths in the three directions in the point cloud data, i.e., Hc, W, and L represent the canopy height, canopy width, and half of the maximum thickness of the canopy, respectively. We created an all-zero matrix for the dimensions, added the [X, Z] values of the point cloud data as coordinates, and assigned a value of 255 to the all-zero matrix, resulting in a two-dimensional scatter of the point cloud data, as shown in Figure 1b.

2.3. Determination of Distance Thresholds

The determination of the distance threshold is critical for calculating the optical porosity. This distance should be long enough to identify stems and a small enough distance to identify the pores. Thresholds were established for different scanning resolutions and different scanning distances. Equation (2) is the expression of the distance threshold in the LIDAR scanning direction:
δ s ( i , j ) = r ( i , j ) Δ α δ m ( i , j ) = v ( i ) Δ t
where r ( i , j ) is the scanning distance at point ( i , j ) , mm; Δ α is the arc resolution; v ( i ) is the LIDAR travel speed for frame i, mm/s; Δ t is the scan period, ms.
We set the distance threshold δ = max δ s , δ m . If the distance between two points is within the distance threshold, we connected the points using a white line with a thickness of 1 pixel, as shown in Figure 1c.

2.4. Contour Detection and Filling

We used an edge detection algorithm to detect the edge pixels of the contours in the image to create contours.

2.5. Optical Porosity Calculations

A fill function was used for contour filling. The outline of the canopy was obtained by searching for the outer contour. The number of pixels in the outer contour was determined; the projected area of the canopy was also calculated by traversing the entire image. The optical porosity α is defined as:
α = S t o t a l S S t o t a l
where α is the optical porosity; Stotal is the area of the canopy (number of pixels); S is the projected area of the canopy (number of pixels).

3. Materials and Methods

Optical porosity measurements, canopy-flow field tests, and droplet penetration experiments were carried out to investigate the effect of porosity on the airflow speed and profile in front and behind the tree. The experiment was conducted in a wind tunnel at different wind speeds, optical porosities and collection point distances (distance between the collection point and the nozzle).

3.1. Test Set-Up

The optical porosity measurements were conducted using a mobile laser scanning system consisting of a synchronous belt guide with a stepper motor, a 2D LIDAR sensor (Hokuyo, UTM-30LX-EW, scanning range 0.1~30 m, laser beam scanning angle up to 270°, angular resolution approx. 0.25°, scanning frequency 40 Hz, each frame includes 1080 data points), a lithium battery, a stepper motor driver, a 24V DC power supply, a programmable automation controller, and a PC. The 2D LIDAR sensor was attached to a sliding table on a synchronous belt rail, and the system used a programmable automation controller to drive the stepper motor. The LIDAR sensor moved with a uniform linear motion on the rail, continuously collecting 3D point cloud data of the trees. The data were saved on a PC computer.
The canopy airflow field test and the droplet penetration test were carried out in a BLWT-2000/1750 DC low-speed wind tunnel at Nanjing Forestry University. The test section was 10 m long with a cross-sectional area of 2 m × 2 m, and wind speed adjustment range of 0.5~10 m/s. The canopy airflow field was measured using a multi-point anemometer (Kanomax, model 6242, Suita, Japan). Its probe was attached to a pole that moved along the rail. A programmable controller powered by a stepper motor controlled the linear movement of the probe on the pole to achieve high-accuracy positioning and movement. The droplet penetration test system consisted of water-sensitive paper (water-sensitive paper WPS, 26 mm × 76 mm, Spraying System Co., Wheaton, IL, USA) to collect the droplets and a spray system (including a water tank, electric diaphragm pump, pressure-regulating valve, pressure gauge, piping, spray nozzle mounting bracket, spray nozzle, and spray movement control device). Figure 3 and Figure 4 show the diagrams of the airflow field and spray deposition test systems in the wind tunnel to investigate the effect of the airflow speed and porosity on the droplet penetration ratio.

3.2. Test Methods

3.2.1. Canopy Laser Scanning

The trees used in this experiment were Fortunella margarita with regular shapes and different densities, as shown in Figure 5. The LIDAR sensor was mounted on a horizontal synchronous belt driven by a stepper motor and moved at a constant speed. It was connected to a PC. The LIDAR control program was started, and the network parameters and scanning parameters were set. The LIDAR sensor began to scan the trees. The effective travel length of the rail slide was 1.5 m, and the speed was adjustable. We installed the LIDAR sensor to focus on the centre of the tree crown. The start angle was 135°, and the end angle was −135°. The LIDAR scanning distance, i.e., the distance from the LIDAR to the tree trunk, was 1.5 m. The minimum travel speed of an orchard sprayer is 0.3 m/s. Therefore, we set the LIDAR moving velocity to 0.3 m/s. Point cloud data were acquired in real time in the dat format. We used MATLAB to write a point cloud processing program. The dat format was converted to a txt format using the Geomagic studio software to read and delete data outside of the area of interest. The final data were saved in a text format.

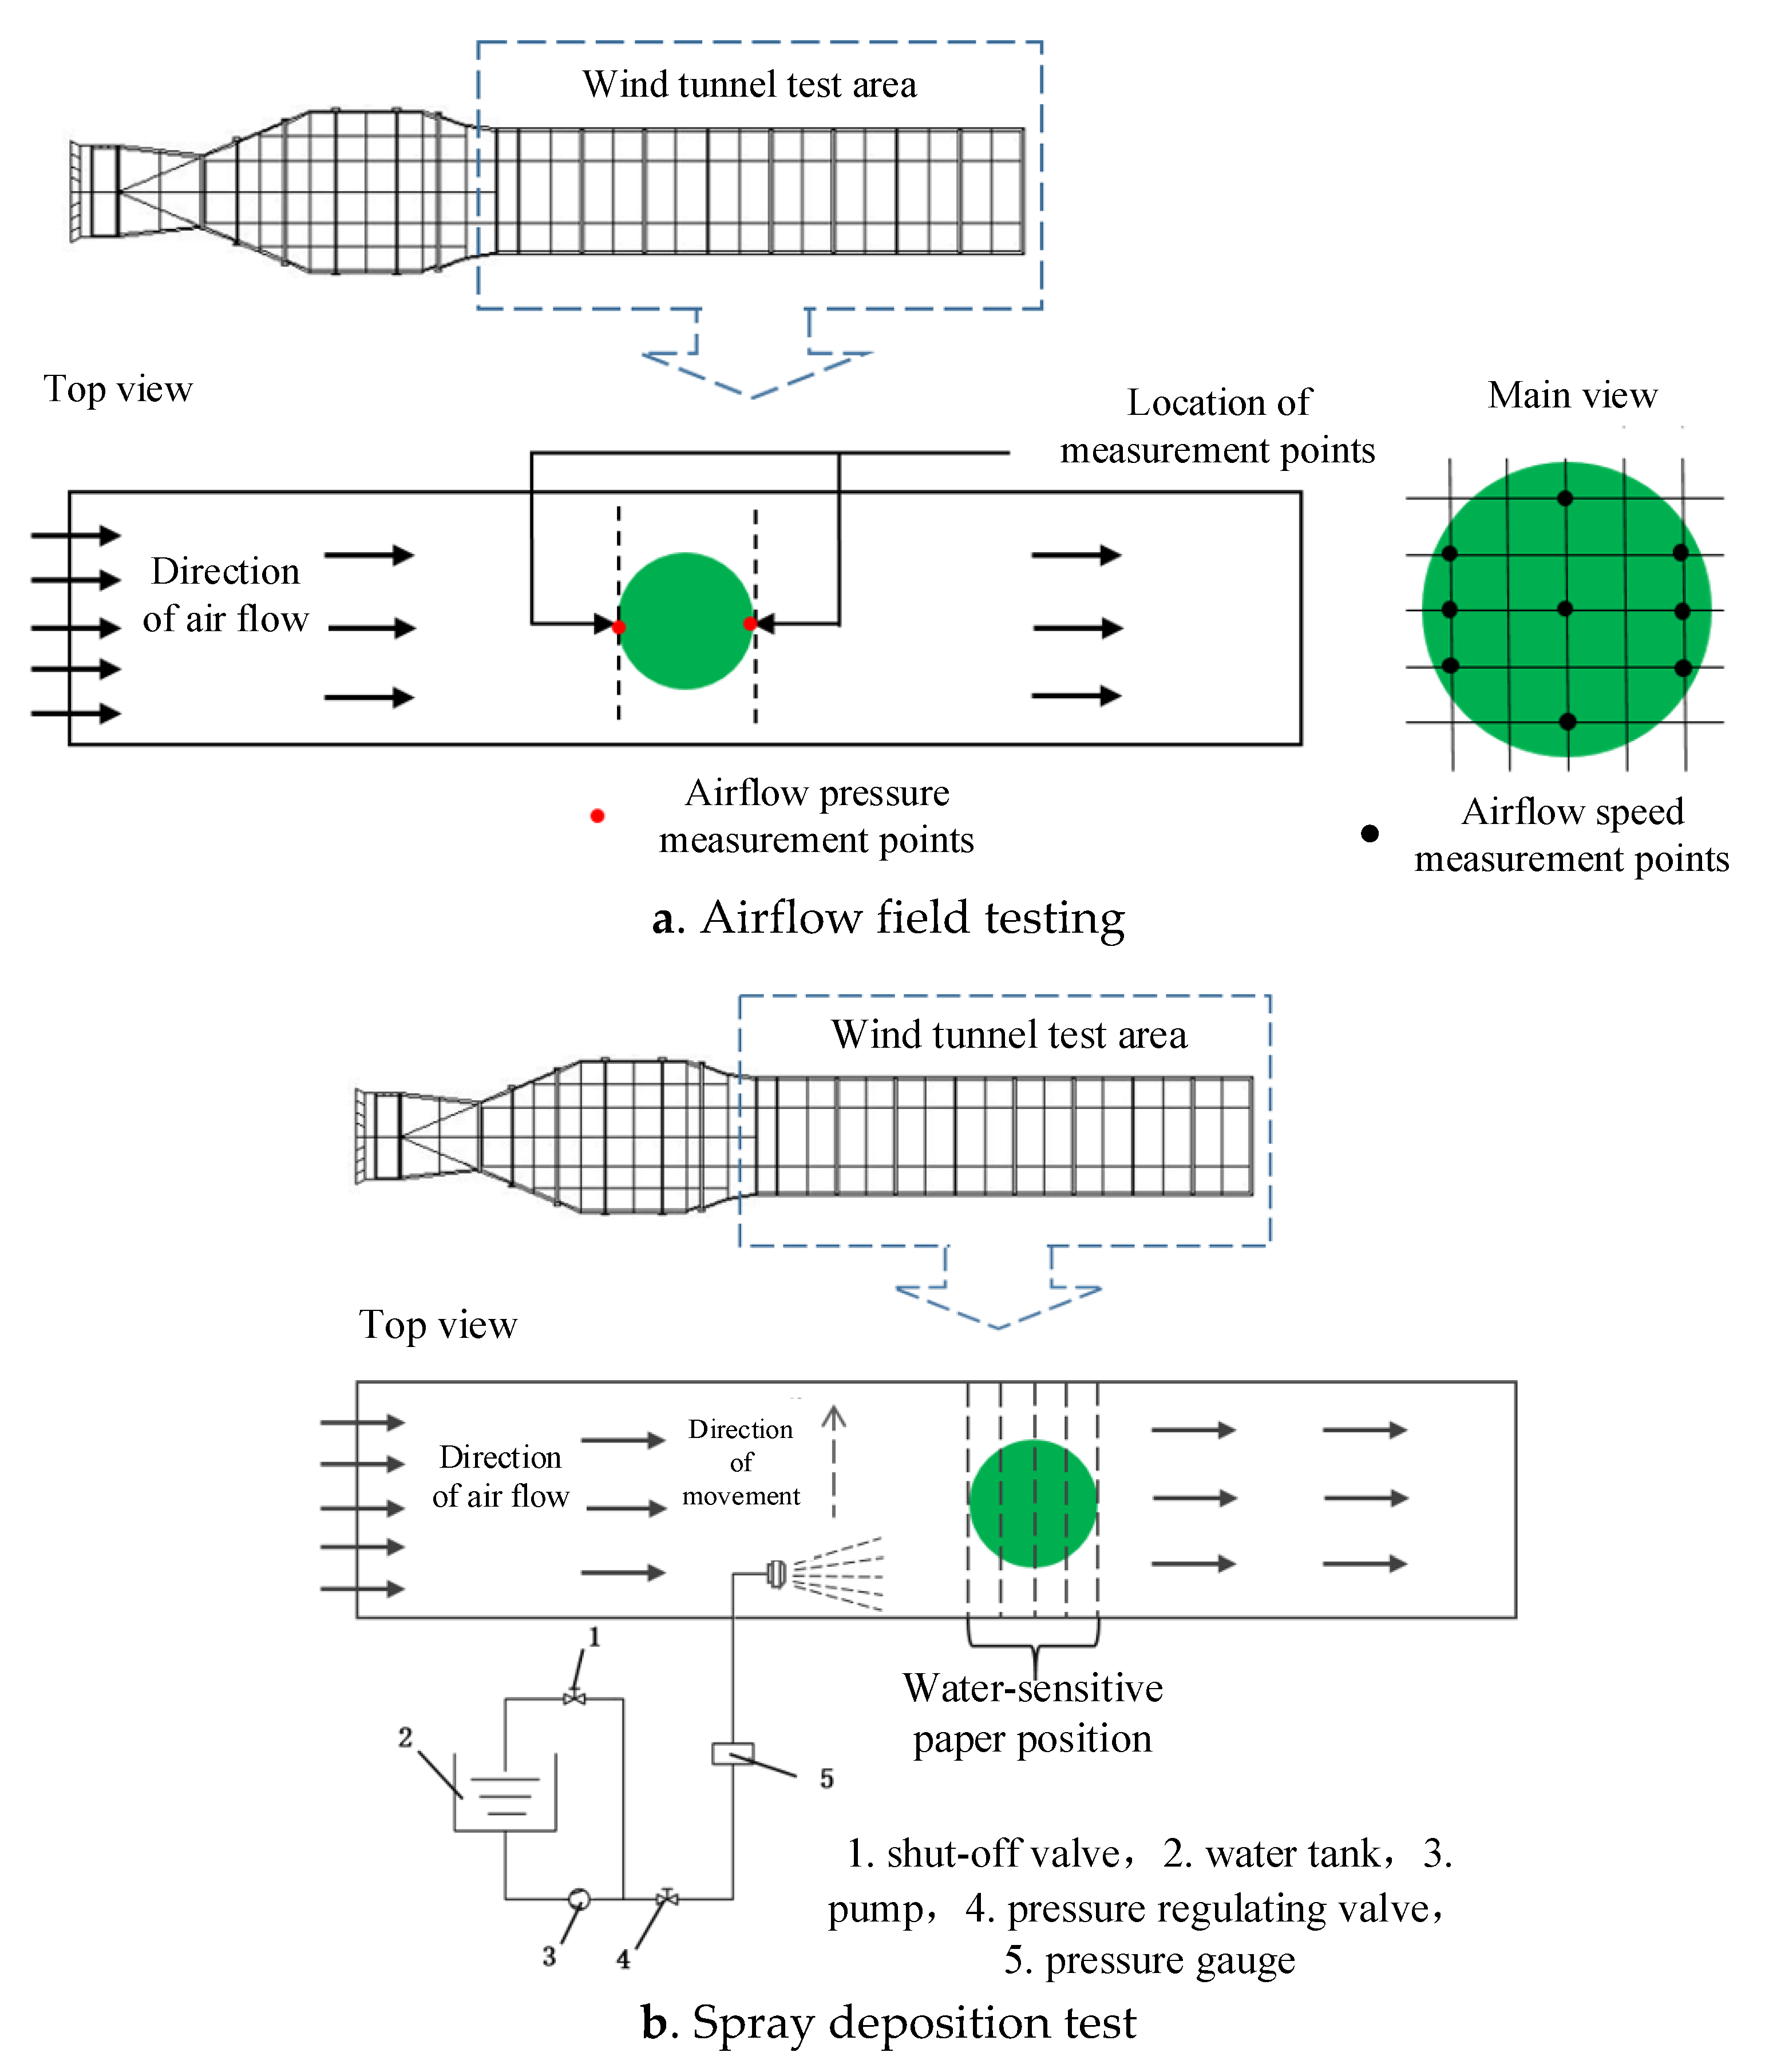
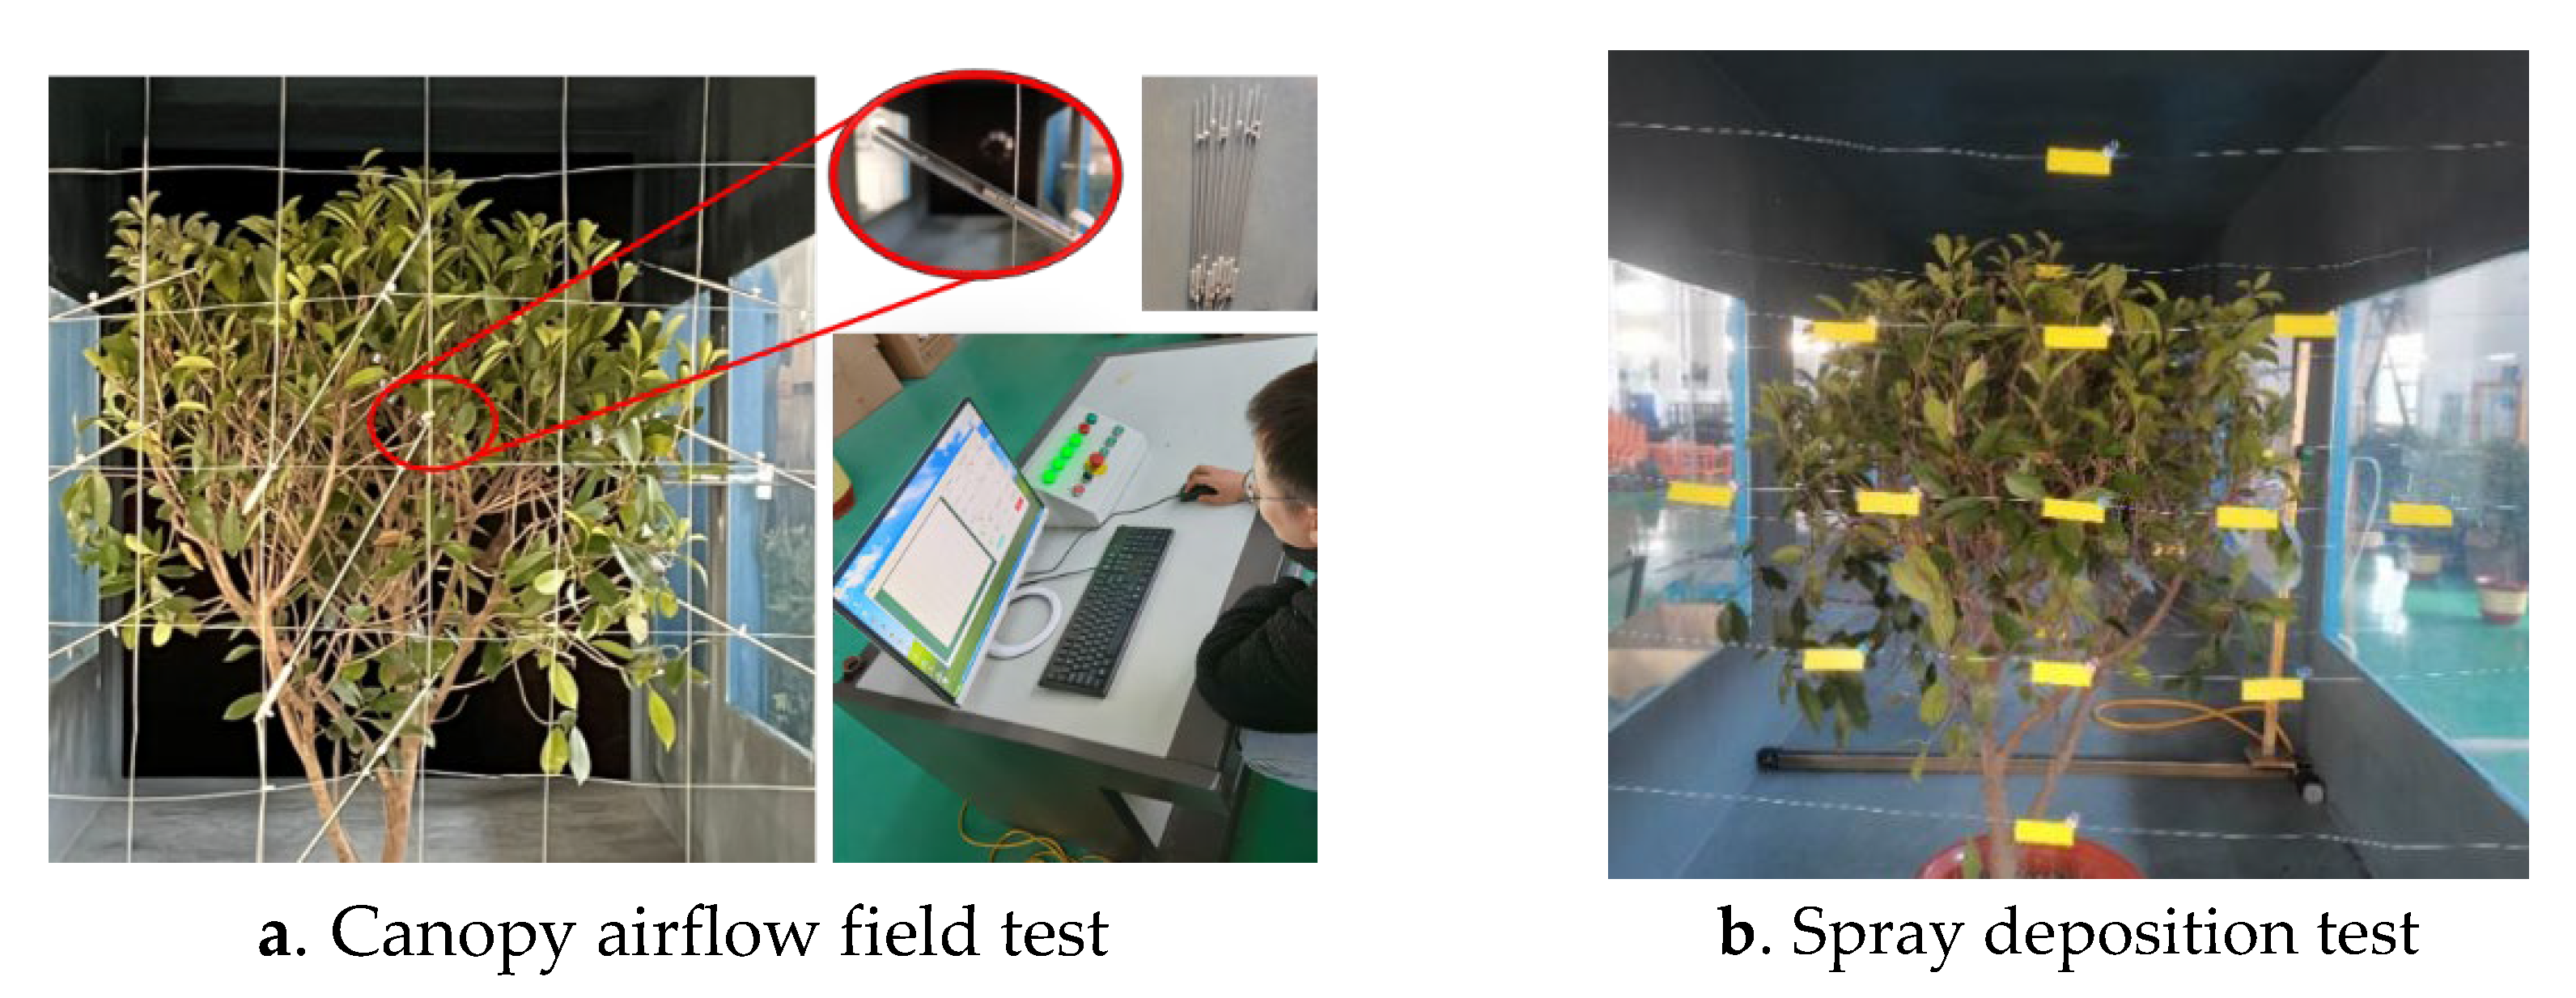
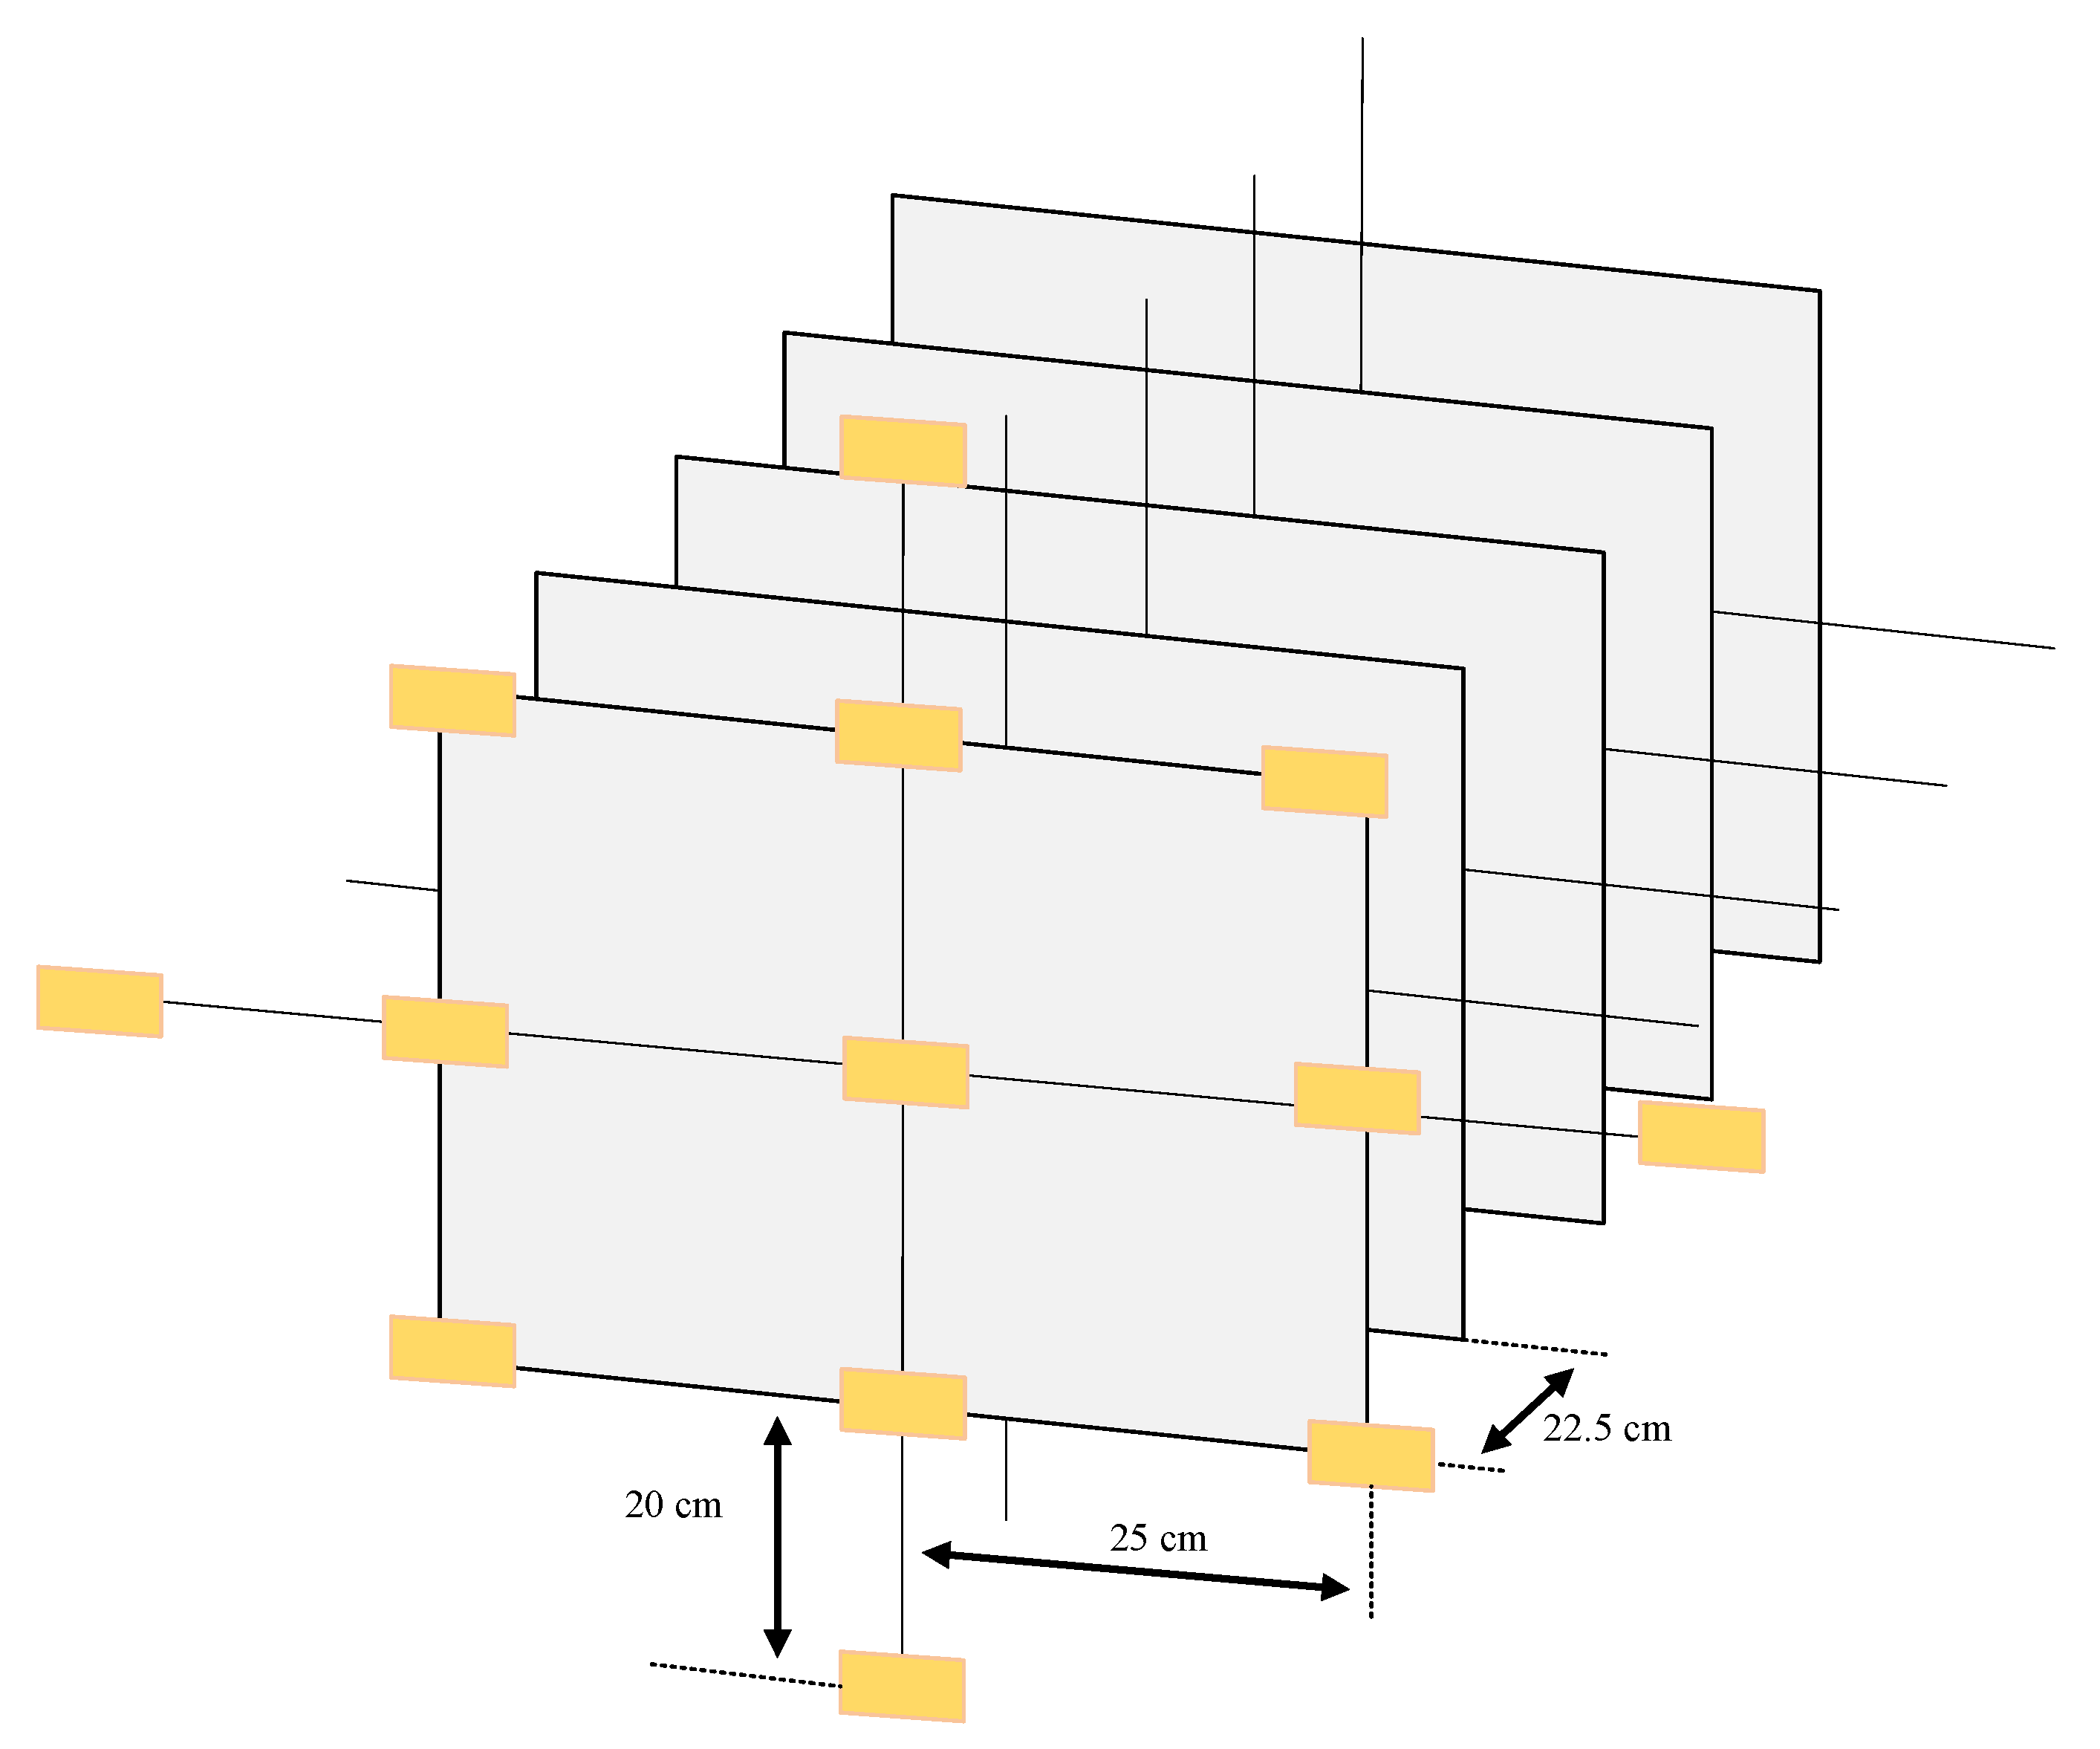
3.2.2. Canopy Airflow Field Test

The wind speed of the wind tunnel was 8 m/s. The wind speed was measured at −0.6 m, −0.4 m, −0.2 m, 0 m, 0.2 m, 0.4 m, 0.6 m, 0.8 m and 1 m, in front and behind of the centre of the canopy, using the centre as the origin. A positive value indicates that the measurement was obtained behind the centre of the canopy, a negative value indicates that the measurement was obtained in front of the centre of the canopy. The airflow speed was measured at the canopy centre. The wind speed profiles were measured longitudinally at 0.1 m behind the canopy, starting at the ground level and obtaining measurements at heights of 0.4 m, 0.5 m, 0.6 m, 0.7 m, 0.8 m, 0.95 m, 1.05 m, 1.15 m, 1.25 m, 1.4 m, and 1.6 m. Measurements of tree number 5 were obtained at wind speeds of 5 m/s, 6 m/s, 7 m/s, and 8 m/s to investigate the effect of different wind speeds on the lateral and longitudinal wind speeds in the canopy. The wind speed in the wind tunnel was measured using a multi-point anemometer for 10 s after each wind speed had stabilised. This test was repeated three times, and the average value was used as the wind speed value at that point.

3.2.3. Droplet Deposition Test

The LICHENG agricultural fan spray nozzle (type VP110-04) was used in the spraying tests of the five trees to investigate the effect of different optical porosities and wind speeds on the droplet penetration ratio and distribution. The spray nozzle and pipe were attached to a vertical bar using a connector. The spraying was controlled by a stepping motor that drove a synchronous belt to move the vertical bar and slider in a uniform and linear movement. The spraying pressure was controlled by a pressure-regulating valve. The wind tunnel wind speed was set to 5 m/s, 6 m/s, 7 m/s and 8 m/s, and the nozzle height from the ground and the canopy was 95 cm and 50 cm, respectively, with a moving speed of 0.3 m/s, a spray pressure of 2.5 MPa, a flow rate of 24 mL/s, and a spray direction along the wind tunnel airflow direction, mimicking the actual operating parameters of the 3WG-8 orchard wind-driven sprayer. The droplet collection points in the canopy were configured as follows. The canopy was divided into five equal layers from front to back in the spray direction, and the layers were spaced 22.5 cm apart. Thirteen measurement points were located at the top and bottom of each layer, and the points were spaced 20 cm apart at the top and bottom and 25 cm apart left and right, resulting in 65 measurement points, as shown in Figure 6. Water-sensitive paper was placed at the measurement points to collect the droplets; the water-sensitive paper was placed perpendicular to the spray direction. After the test, the droplets on the water-sensitive paper was collected and stored in a sealed container after drying. The water-sensitive paper is scanned by the scanning software and the scanned image was analysed using the special image processing software DepositScan to obtain the amount of droplet deposition and coverage, which can be used to calculate the amount of droplet deposition (mg/cm2) for later analysis of droplet penetration and distribution patterns.

4. Results and Discussion

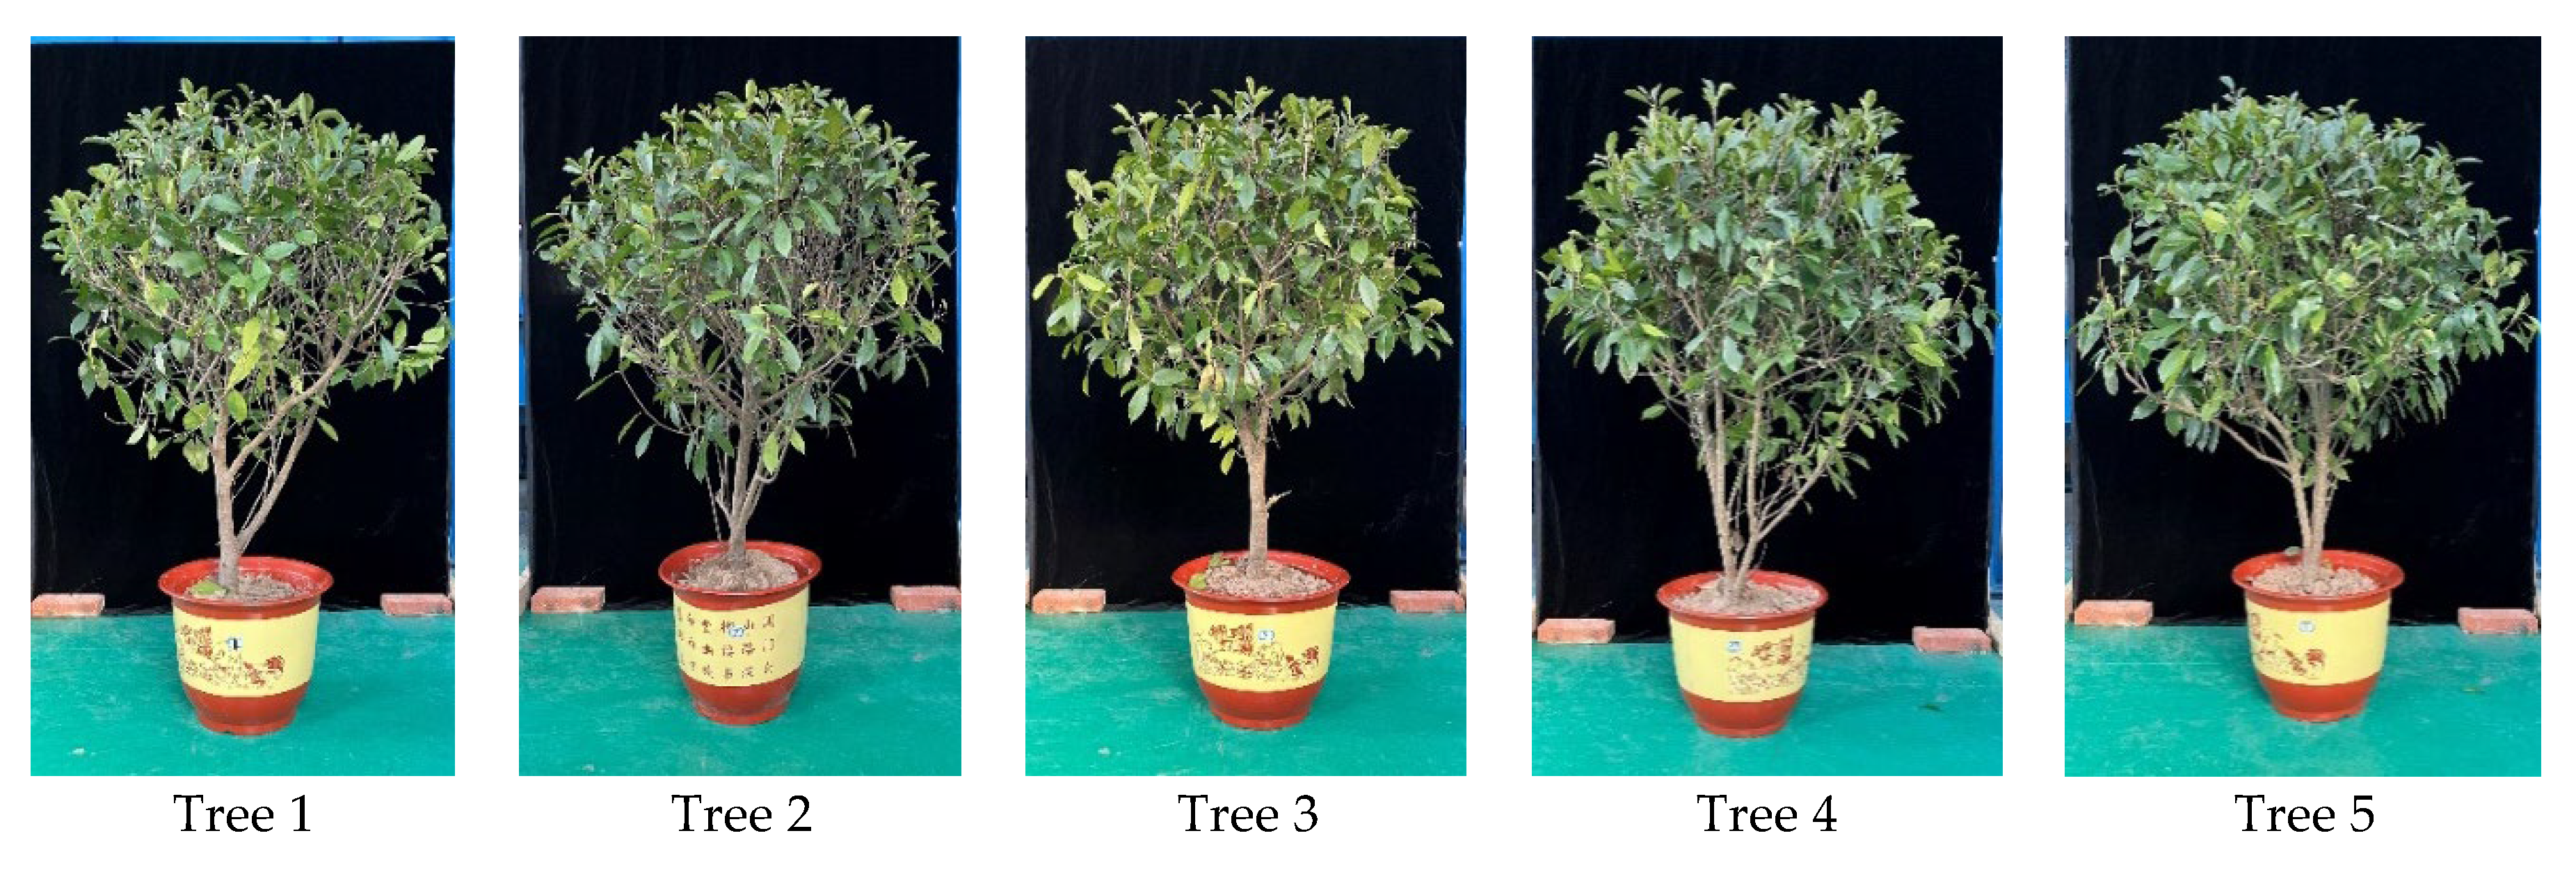
4.1. Optical Porosity of the Test Trees

The point cloud data from the laser scans were processed according to Figure 1, and the optical porosity of the trees was calculated using Equation (3). The canopy characteristics and optical porosity of the trees are listed in Table 1.

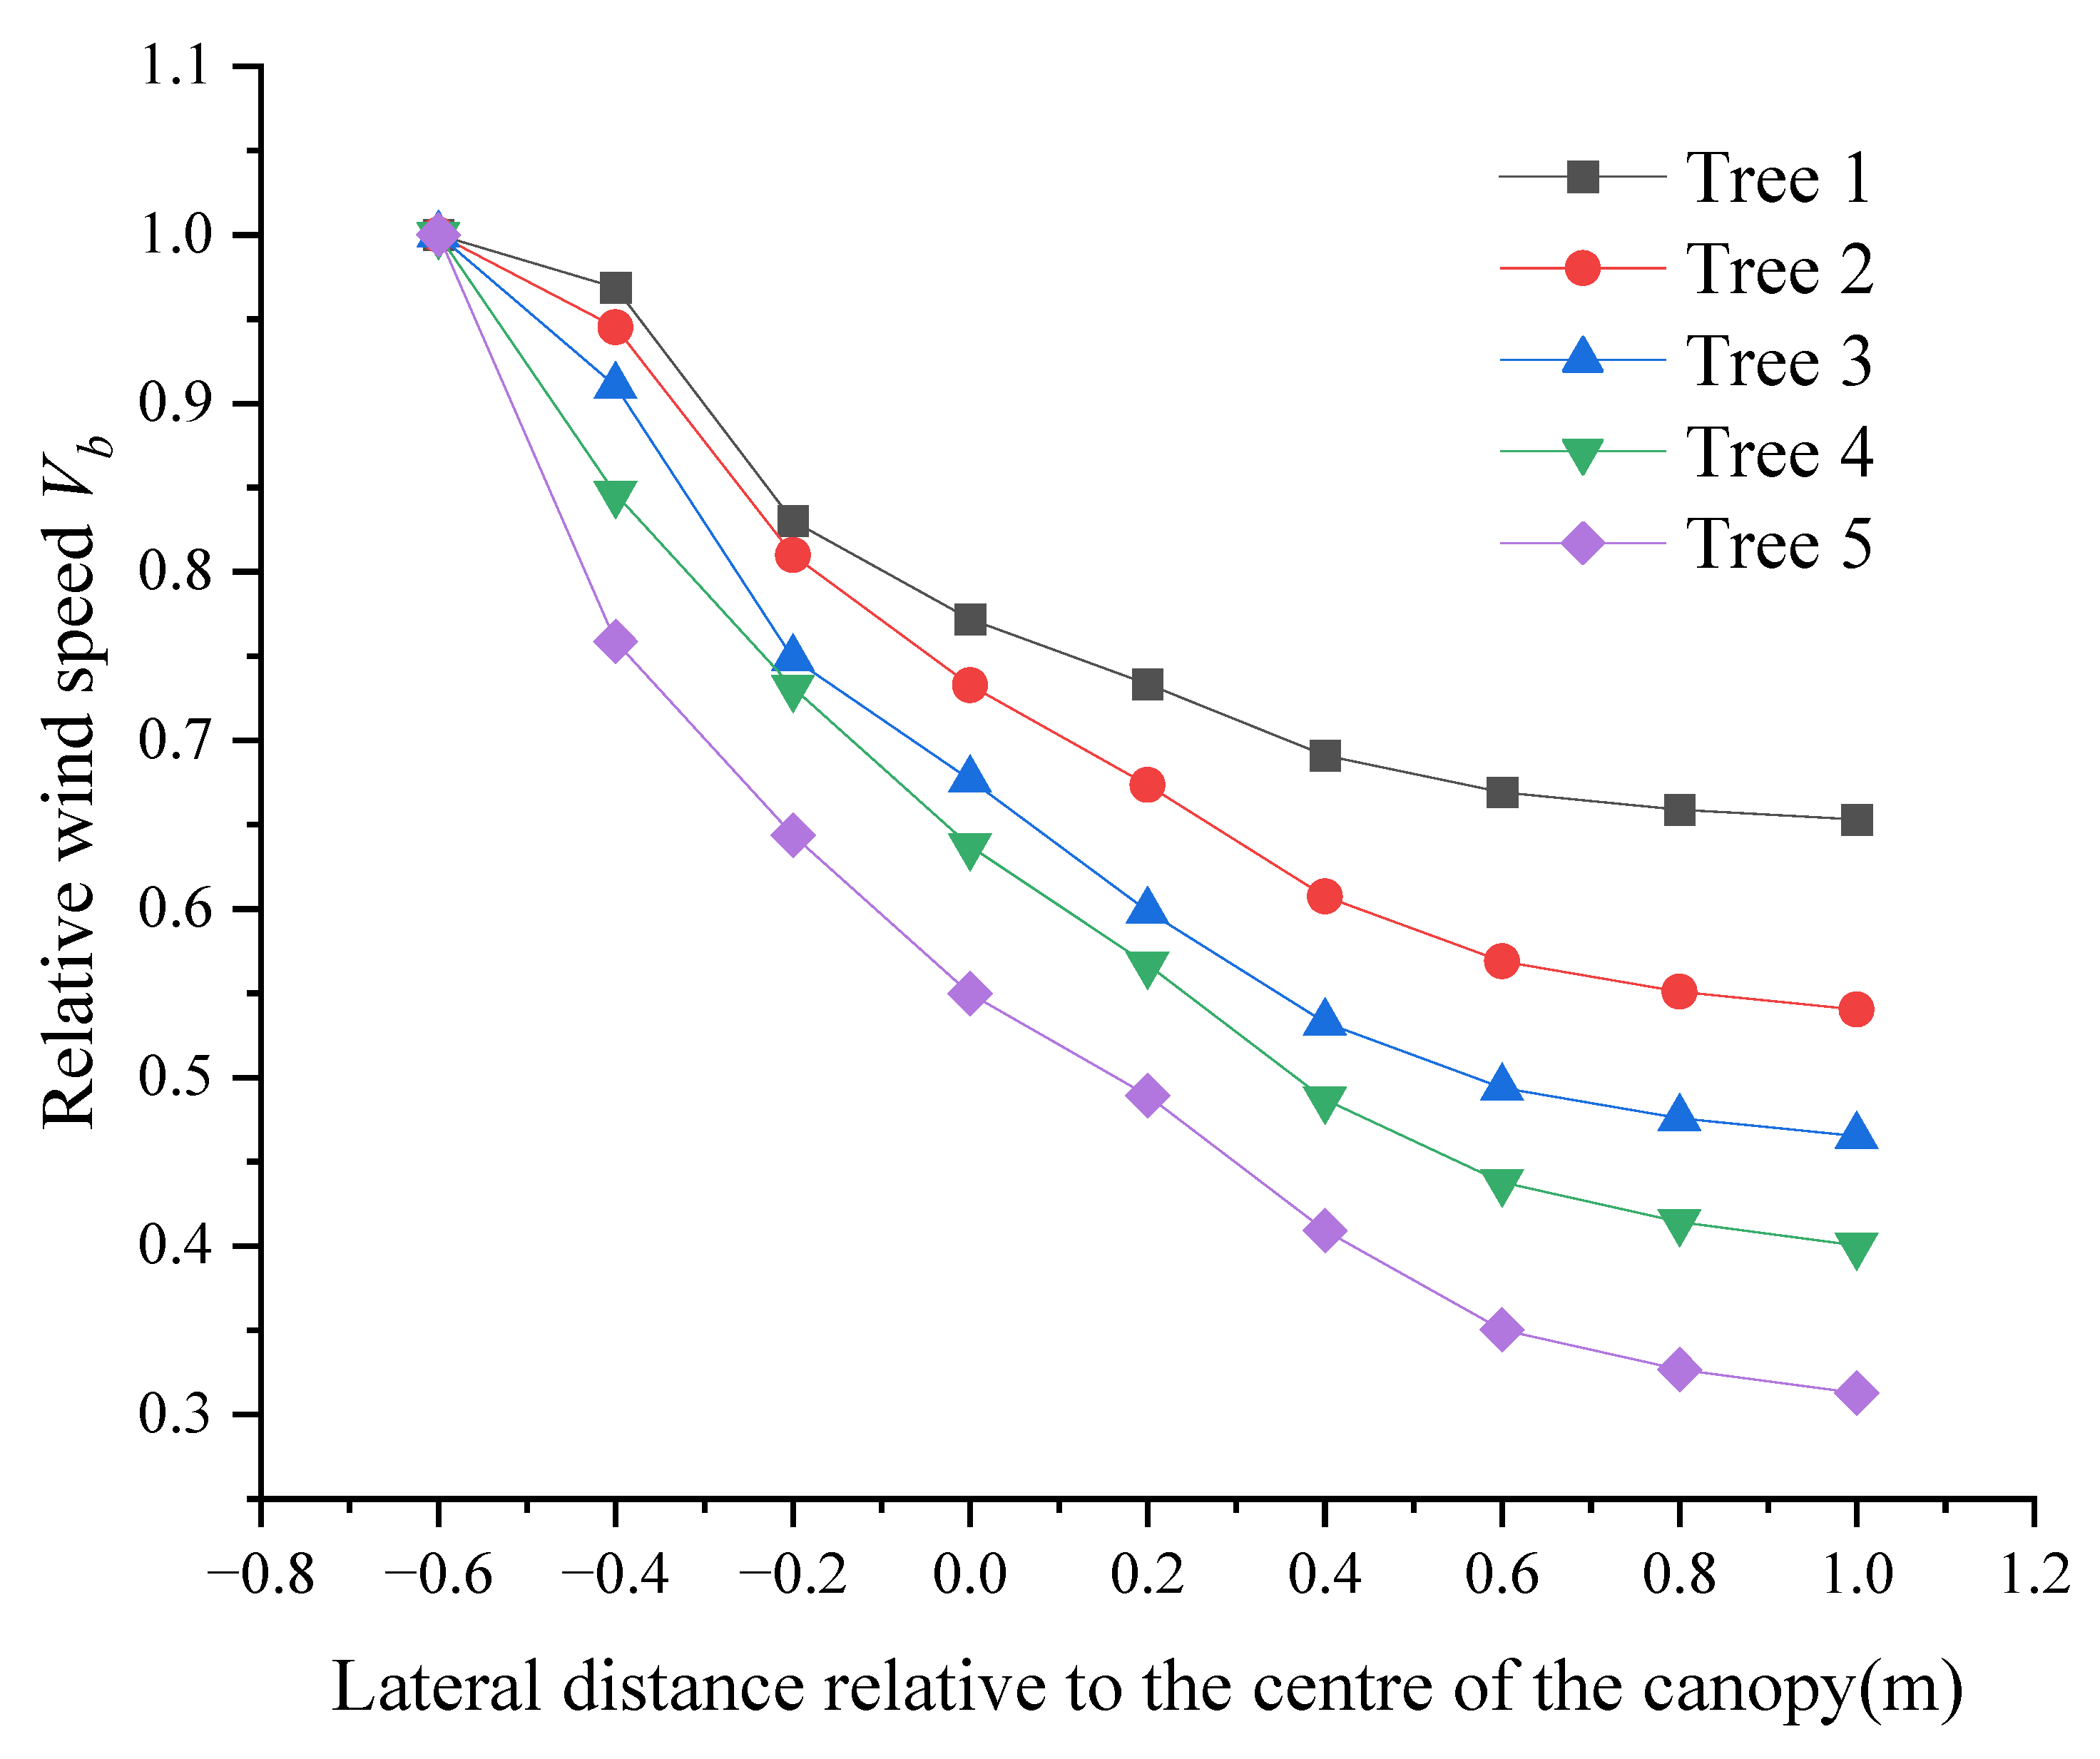
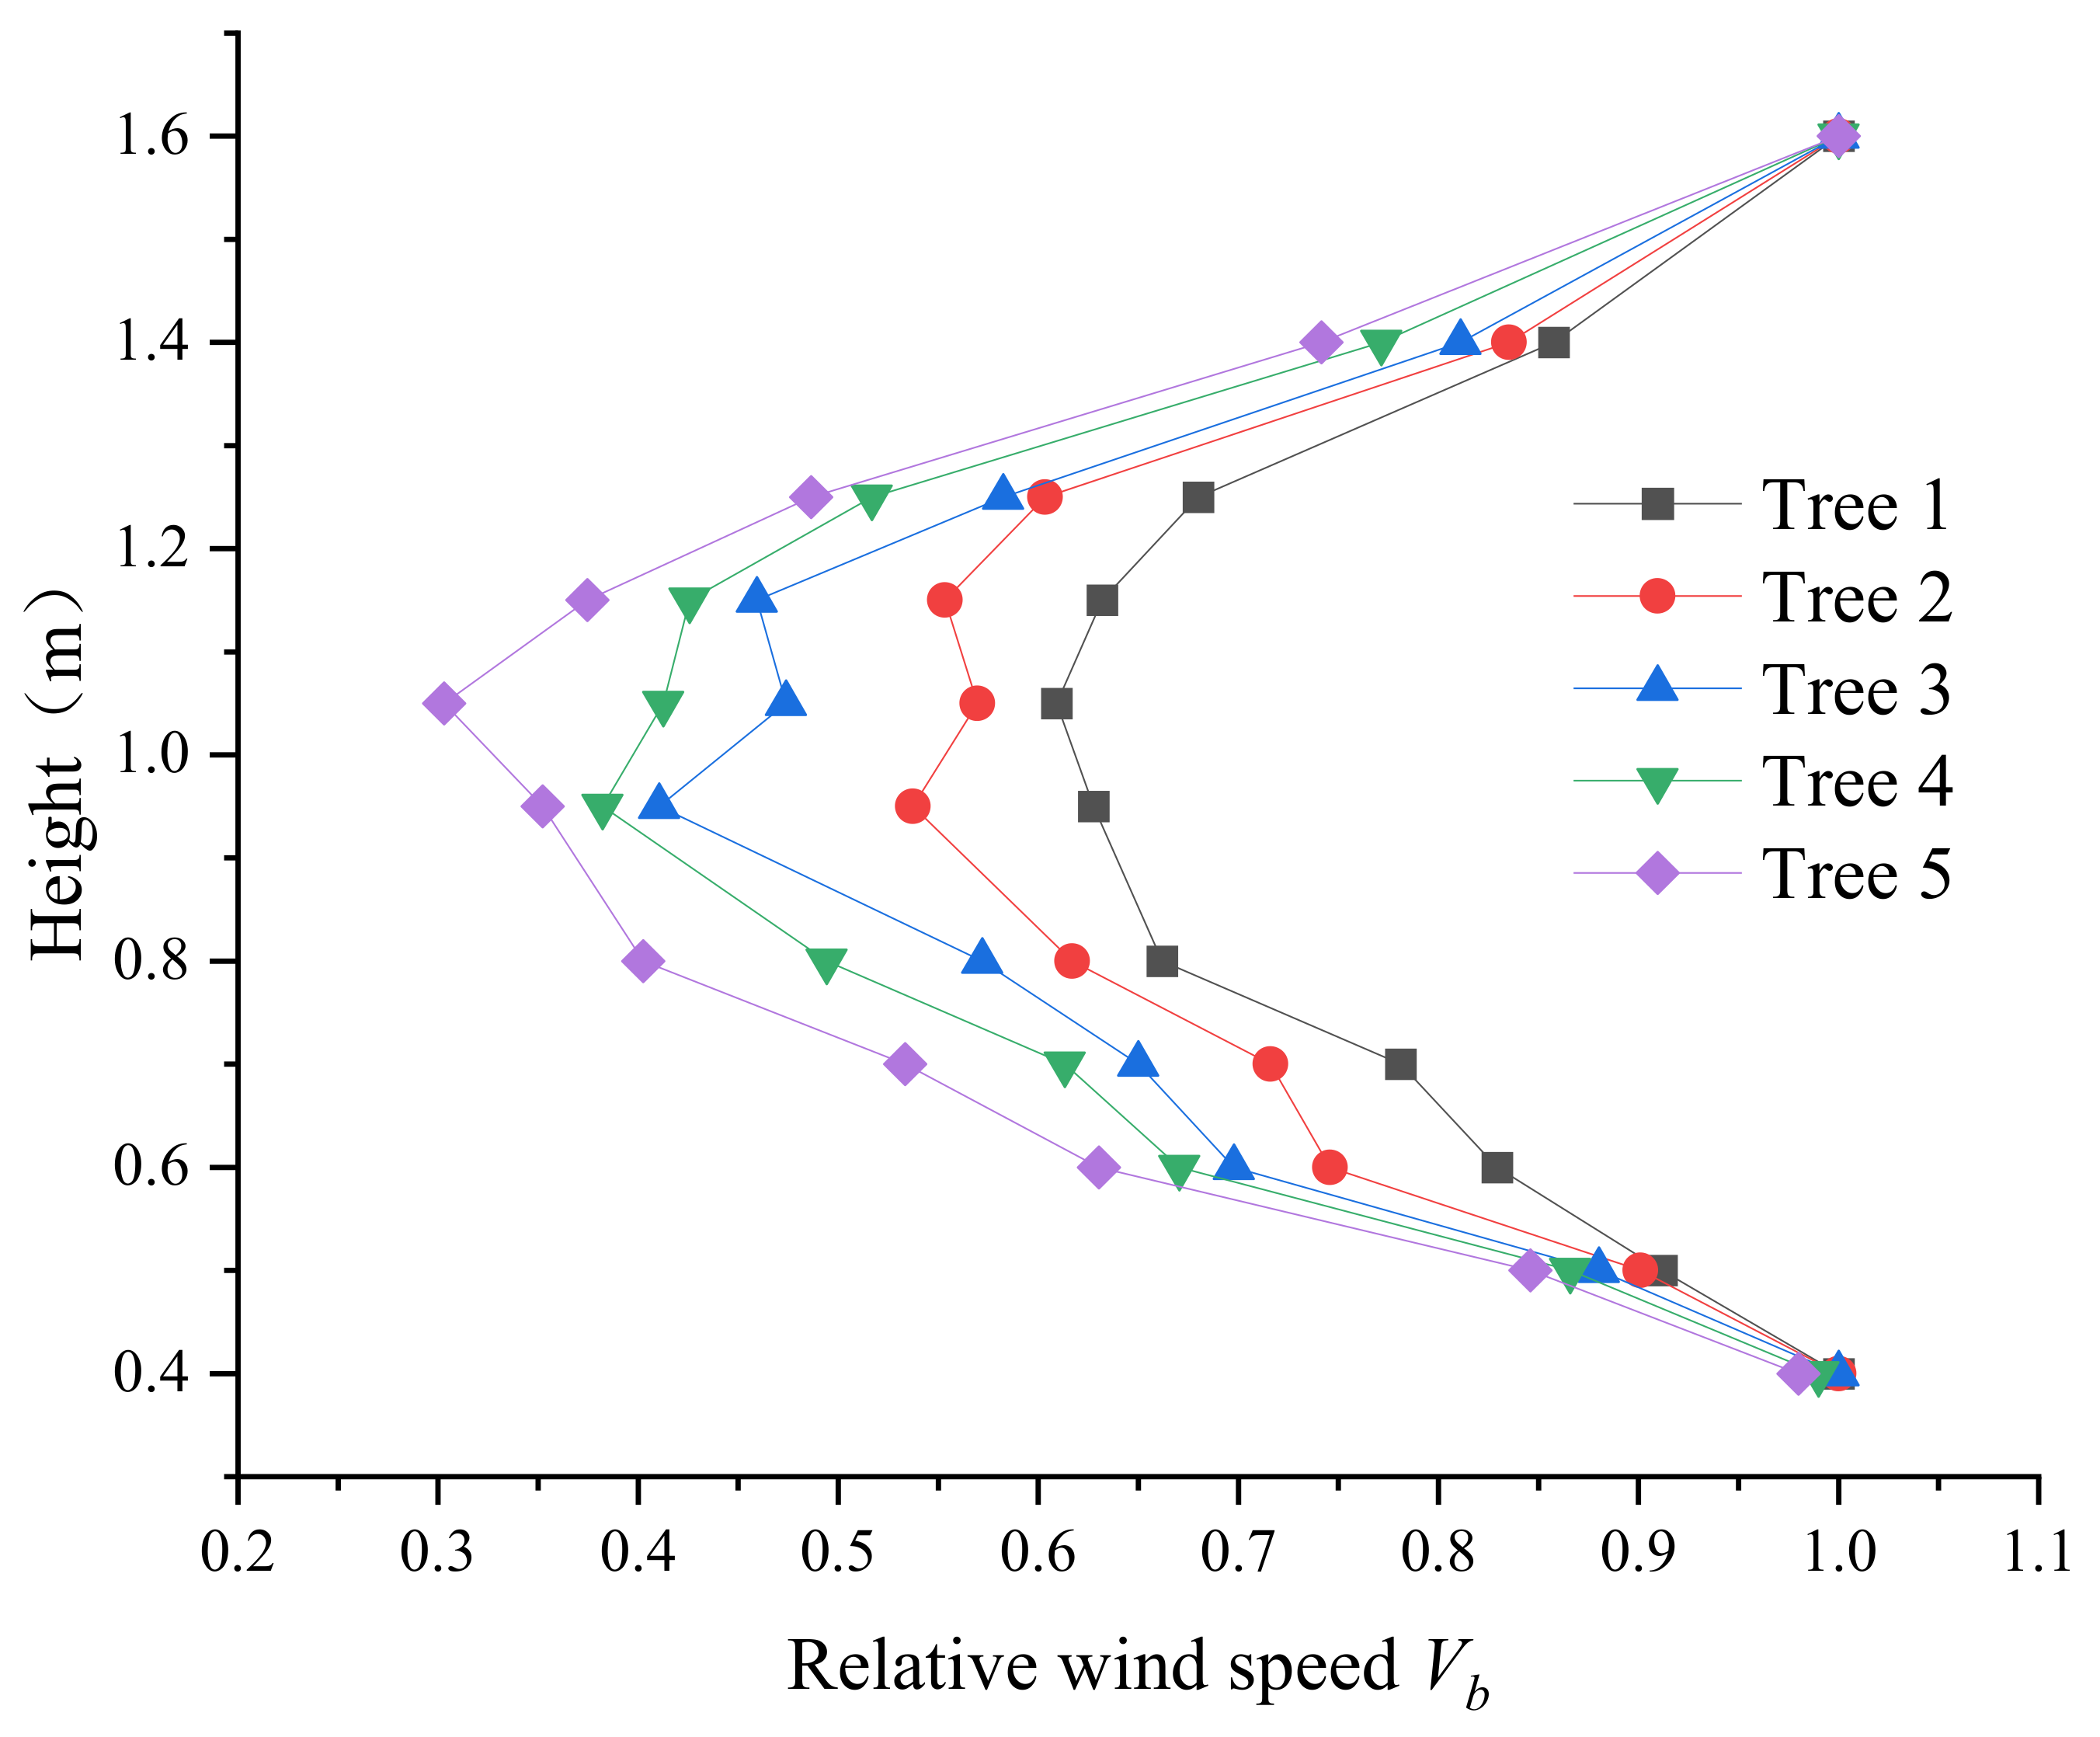
4.2. Effect of Optical Porosity on Airflow

The wind-fed airflow size variation in the canopy front and rear within −0.6 m~1 m at the canopy centre height under the incoming wind speed of 8 m/s is shown in Figure 7. The horizontal coordinate is relative to the lateral measurement position of the canopy centre, where the horizontal coordinate 0 represents the canopy centre position, and the direction closer to the wind tunnel outlet is negative and the reverse is positive; the vertical coordinate is the relative wind speed, which is the normalised value of the wind speed test data of different experimental trees and can be more convenient to analyse the influence of different parameters on the airflow of wind delivery. The relative wind speed divides the wind speed at the measurement point by the incoming wind speed at the same height in the wind direction above the canopy, as shown in Equation (4).
V b = V i V l
where V b is the relative wind speed, dimensionless; V i is the wind speed at the measurement point i, m/s; V l is the incoming wind speed at the same height at the measurement point, m/s.
Figure 7 shows that the relative wind speed decreases rapidly as the airflow penetrates the canopy. The difference between the maximum and minimum airflow velocity in front of and behind the canopy of tree No. 5 (with a porosity of 0.06594) is 0.687 m/s, and those of trees 1, 2, 3, and 4 are 0.347 m/s, 0.46 m/s, 0.535 m/s, and 0.60 m/s, respectively. The airflow can more easily pass through a thinner canopy, i.e., the denser the canopy, the greater the internal resistance is, and the greater the reduction in the airflow velocity is at the same position in the canopy.
These results only reflect the airflow at the centre of the canopy. However, due to different configurations of the branches and leaves, the canopy has different effects on blocking the airflow at different heights. Therefore, the airflow velocity was also measured at 0.1 m behind the canopy of the five trees to reflect the effect of different optical porosities on the longitudinal wind speed (Figure 8).
The relative wind speed at 0.1 m downwind of the canopy tends to decrease before increasing with the height. The minimum wind speed occurs at the height of 1 m because the canopy has the maximum thickness at this location. At the same canopy height position, the relative wind speed of test trees 1, 2, 3, 4 and 5 gradually decreased at 0.1 m downwind, indicating that the smaller the optical porosity, the weaker the airflow penetration, especially at the middle of the canopy (height of 1.05 m), where the relative wind speed of test tree 5 differed the most. At canopy boundary locations, i.e., at heights of 0.4 m and 1.6 m respectively, the wind speed behind the canopy was essentially equal to the wind tunnel wind speed.

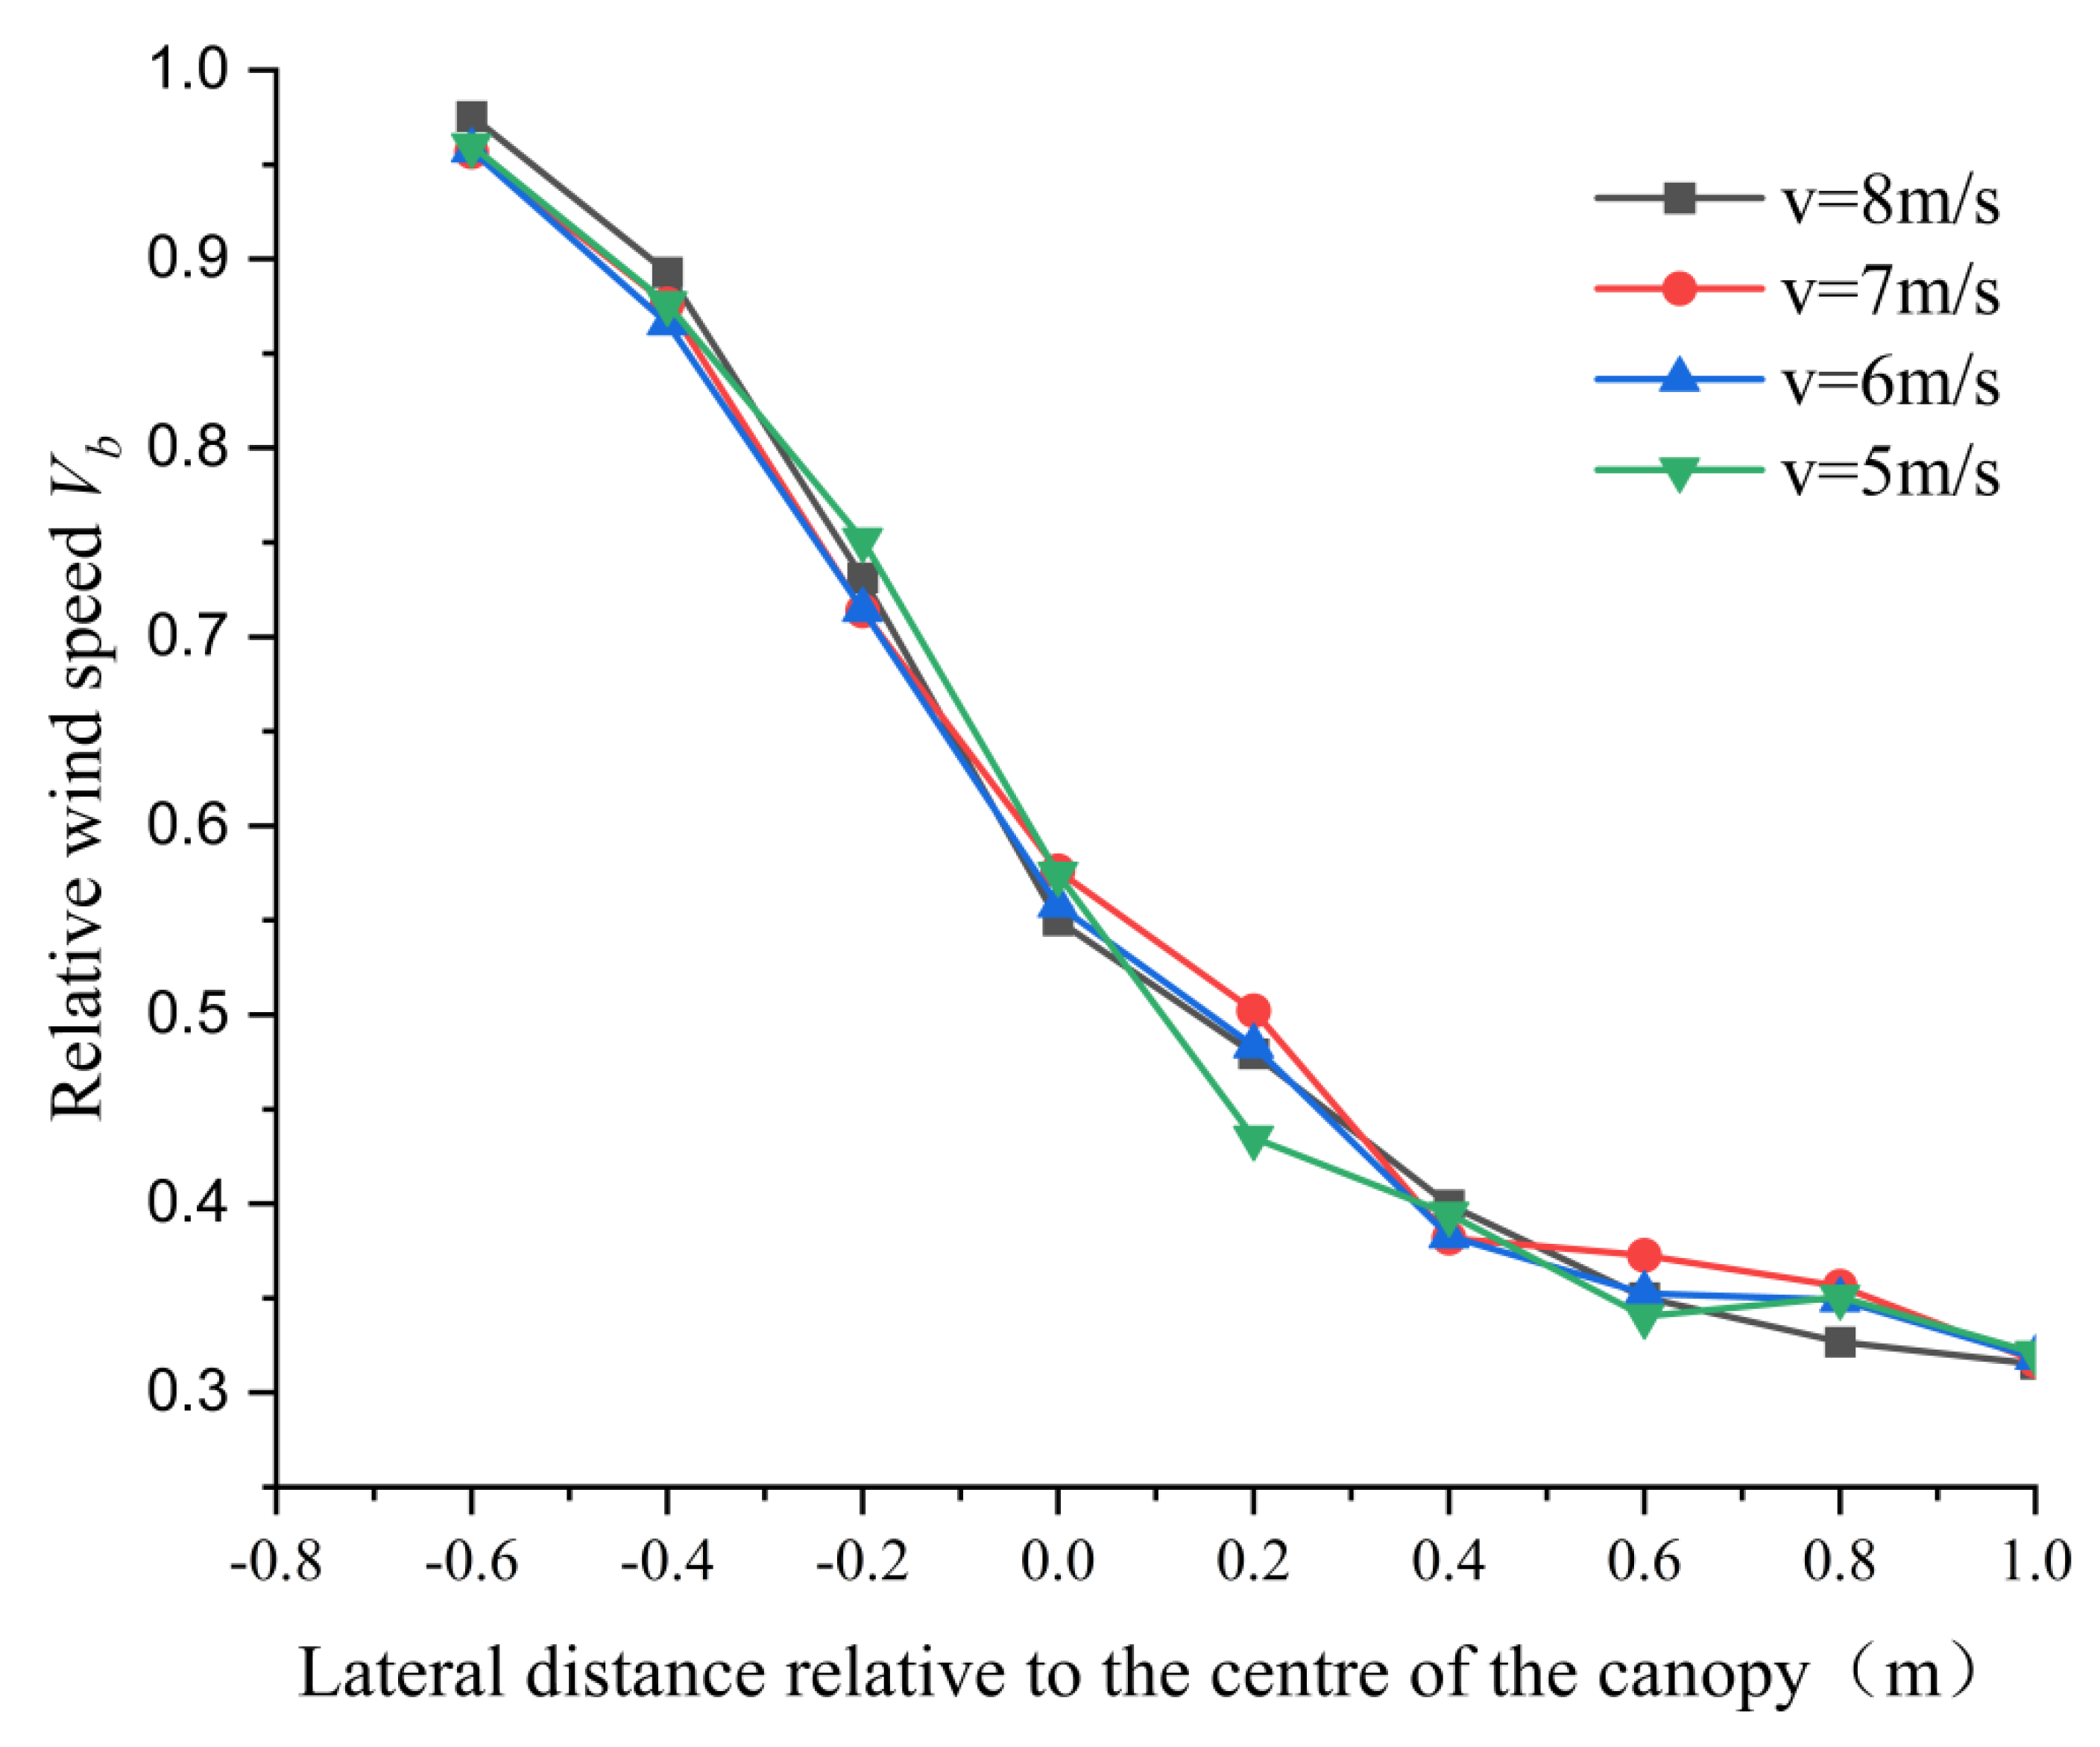
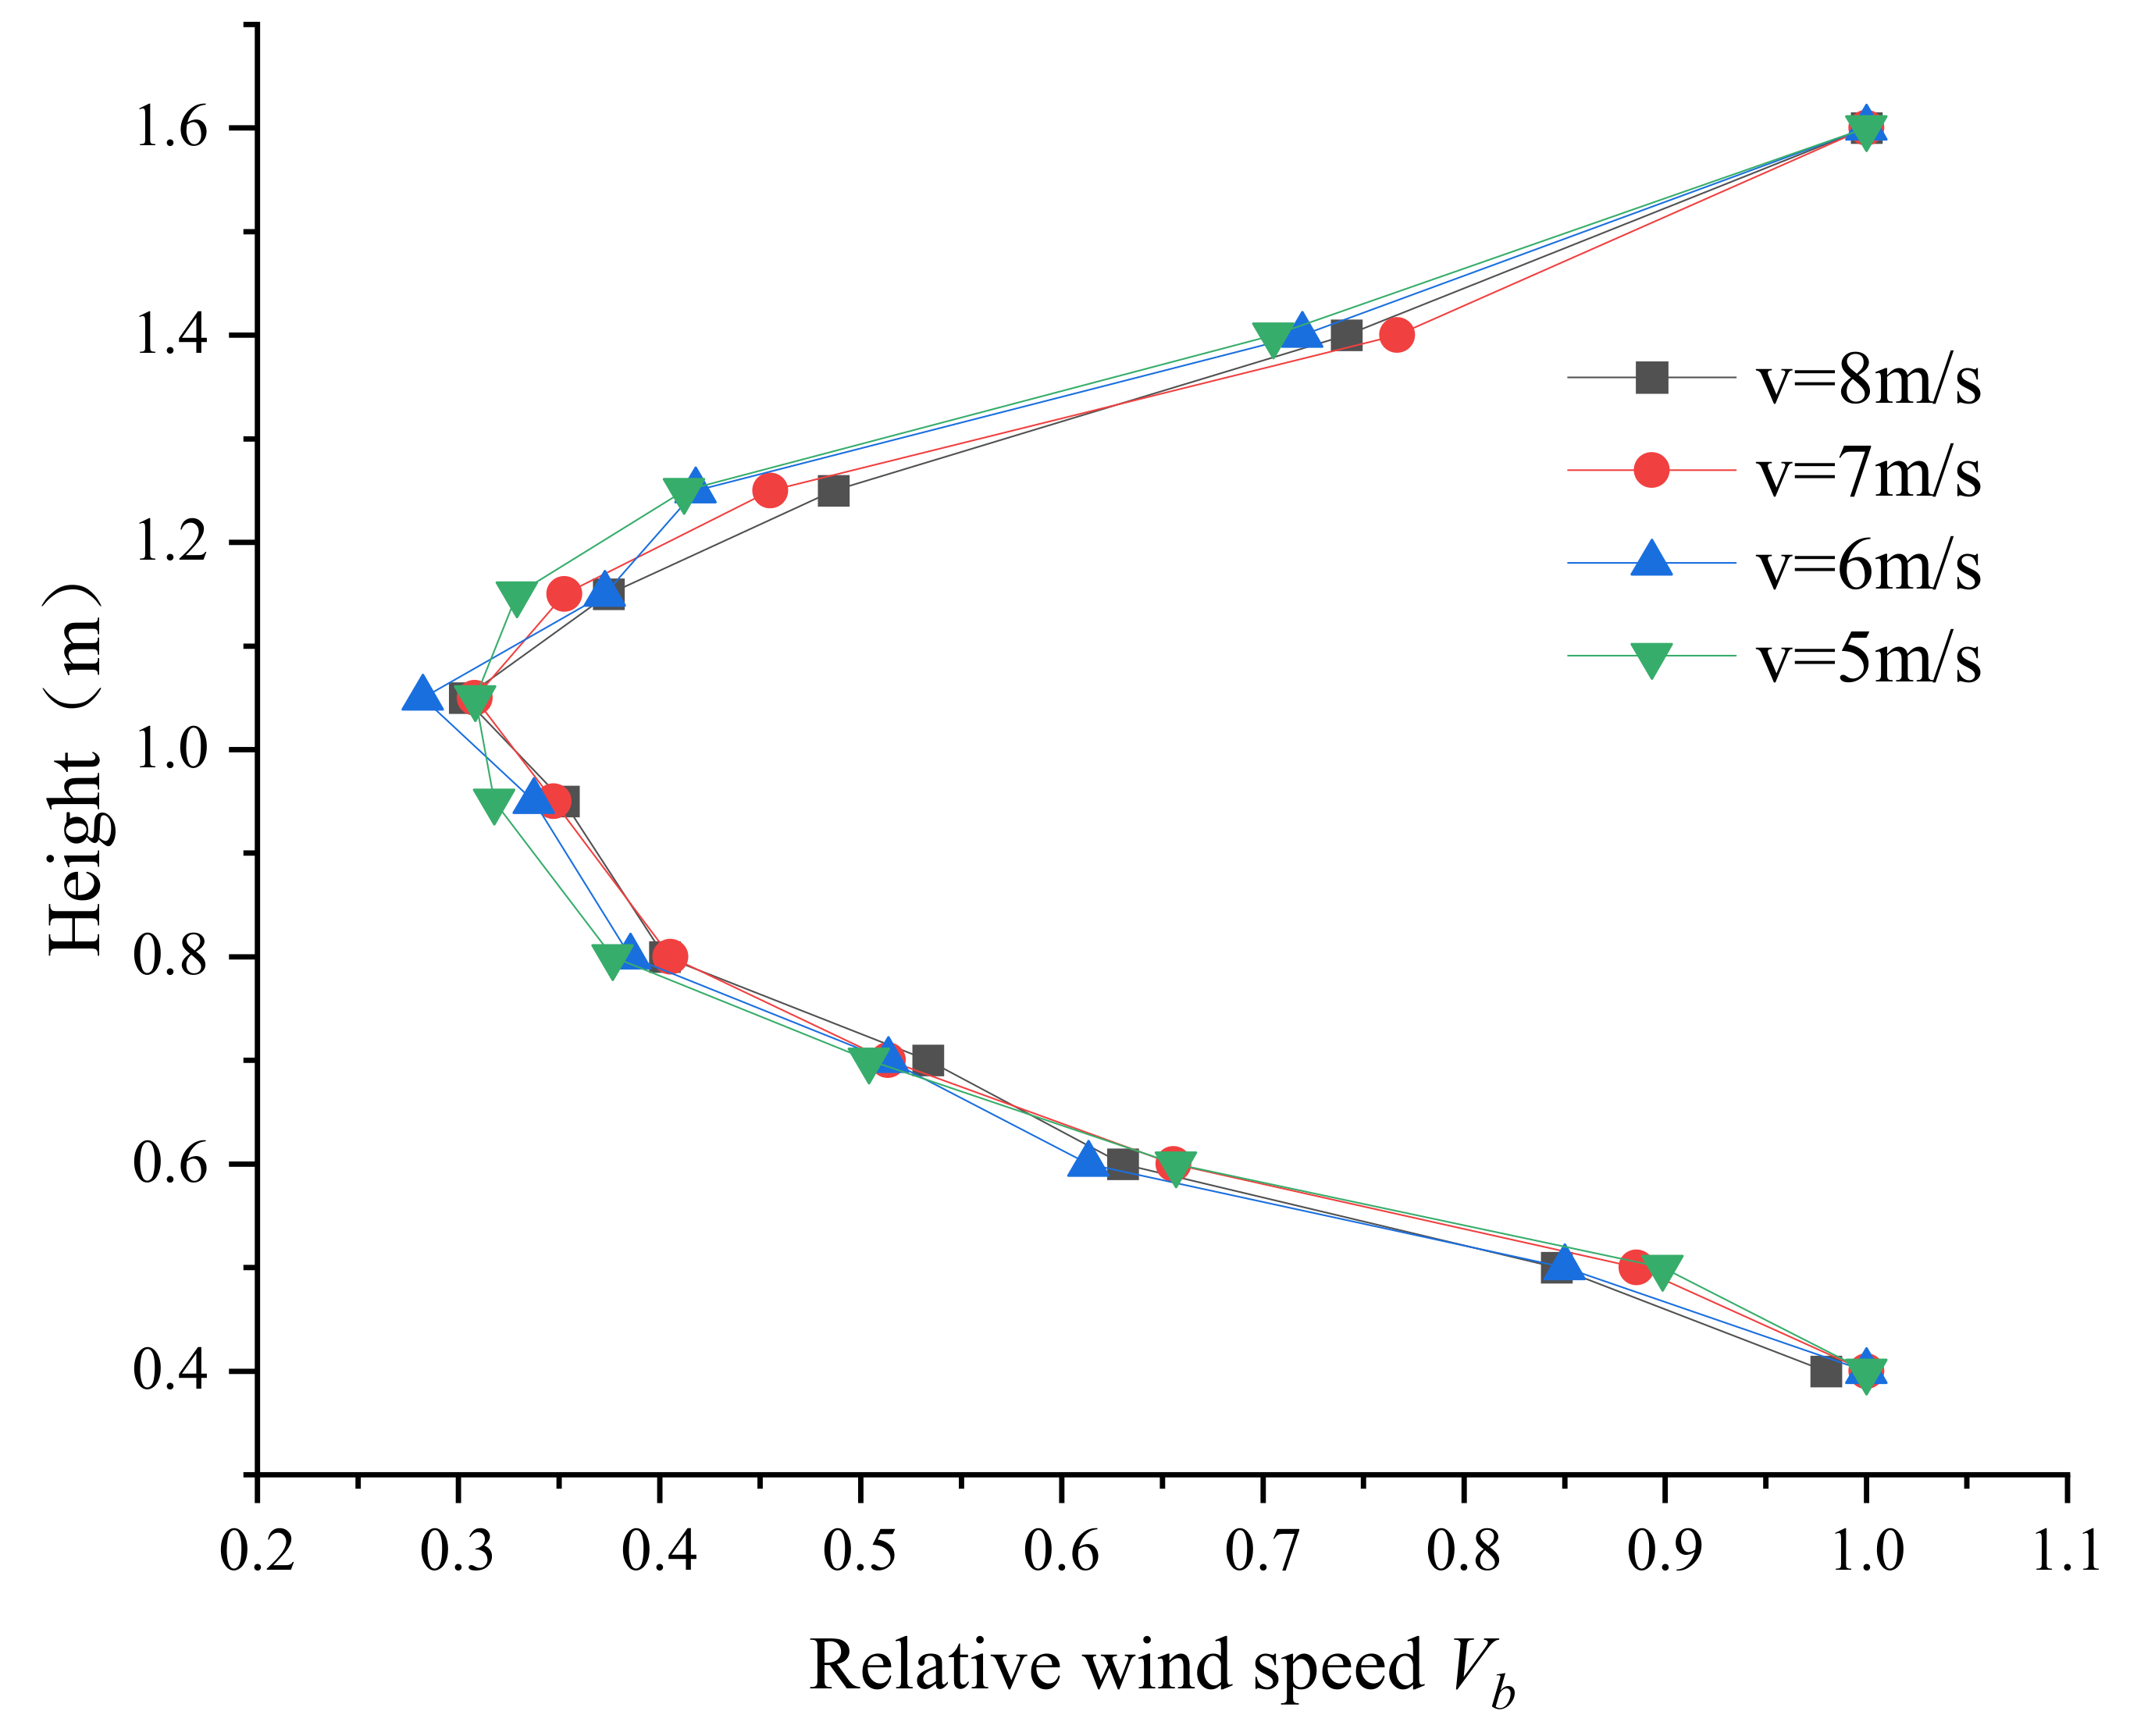
4.3. Effect of Different Incoming Wind Speeds on Airflow Velocity

Figure 9 shows the airflow velocity at the canopy centre at wind tunnel wind speeds of 5 m/s, 6 m/s, 7 m/s, and 8 m/s for tree 5. When the optical porosity is constant, the airflow velocity in the lateral direction (the front and rear direction of the airflow penetrating the canopy) is the same at different incoming wind speeds. Before the airflow enters the canopy (x = −0.6 m), the wind speed in the lateral direction is equal to the incoming wind speed, and the relative wind speed is close to 1. Due to the blocking effect of the canopy, a small area of velocity fluctuation occurs on the canopy surface. When the airflow enters the canopy, the velocity decreases in the lateral direction inside the canopy, and the velocity decays faster; the wind speed is about 0.35 m in the lateral direction at the centre of the canopy. At 0.35 m in the lateral direction, the relative wind speed decays to 0.5, and the decay rate decreases after 0.6 m due to less obstruction from the canopy.
The wind speed profiles of tree 5 measured at 0.1 m behind the canopy at incoming wind speeds of 5 m/s, 6 m/s, 7 m/s, and 8 m/s are shown in Figure 10. The relative wind speed decreases before increasing with the height, and the minimum wind speed occurs at the maximum canopy thickness (approximately 1 m in height). The trend of the relative wind speed across the canopy is very similar for different incoming wind speeds, indicating that the higher the incoming wind speed, the greater the airflow velocity is inside and outside of the canopy and the greater the penetration capacity is.

4.4. Canopy Penetration Ratio of Droplets

The droplet penetration ratio P was calculated as [19]:
P = Q i Q 1
where P is the droplet penetration ratio, dimensionless units; Q 1 is the average number of droplets per unit area at the first collection point in the canopy, mg/cm2; Q i is the average number of droplets per unit area at the collection point in layer i, mg/cm2.
In order to obtain more data to derive a more accurate droplet penetration model, 19 water-sensitive paper collection surfaces were set at 0.5–1.4 m collection depth. The effect of the incoming wind speed and optical porosity on the droplet deposition ratio was calculated. Due to the data volume, a partial histogram is shown in Figure 11.
When the collection point depth and optical porosity are constant, the droplet penetration ratio increases with the incoming wind speed. The maximum droplet penetration ratio was 0.88051 at V = 8 m/s. When the porosity and incoming wind speed are constant, the droplet penetration ratio decreases as the collection point depth increases because of the attenuation of the airflow. For example, as shown in Figure 11a, α = 0.40576 and S = 0.5 m. The droplet penetration ratio was 0.82859, and as the depth of the collection point increased, the droplet penetration ratio decreased to 0.11109 at S = 1 m. The same trend was observed for other values of α . When the collection point depth and incoming wind speed are constant, the droplet penetration ratio also decreases as the optical porosity decreases due to the blocking effect of the canopy. For example, in Figure 11a, the droplet penetration ratio was 0.82859 for S = 0.5 m, α = 0.40576 and decreased to 0.53999 when the porosity decreased to 0.06594. The same trend was observed for other values of S. Despite measurement errors, the same trends are observed at V = 6 m/s (Figure 11b), V = 7 m/s (Figure 11c), and V = 8 m/s (Figure 11d). Thus, we can conclude that as wind speed increases, the percentage of droplet penetration also increases, and the percentage of droplet penetration is more sensitive to changes in the depth of the collection point than the optical porosity. A similar pattern of variation in droplet penetration is observed for different wind speeds as the depth of the collection point and the optical porosity change, and it is also observed that the higher the wind speed, the higher the percentage of droplet penetration, all other things being equal.
The wind tunnel wind speed V, optical porosity α , and collection point depth S were used as independent variables, and the droplet penetration ratio P was used as the dependent variable to construct a model to predict the penetration ratio. The model was evaluated using the root mean square error (RMSE) and the coefficient of determination (R2) [23,24] as indicators to determine the fitting performance of the regression model. The RMSE represents the average prediction error, with lower values indicating a higher accuracy. The R2 represents the model’s goodness of fit. It ranges from 0 to 1, with a larger R2 indicating a better fit, as shown in Equations (6) and (7).
R M S E = 1 N N 1 P r e a l P p r e d 2
R 2 = 1 N 1 ( P p r e d P r e a l ) 2 N 1 ( P m e a n P r e a l ) 2
Based on the characteristics that the droplet penetration ratio increased with increasing optical porosity and incoming wind speed and decreased with an increase in the collection point depth, different regression models were fitted using the statistical analysis software SPSS 22.0 [25,26]. We used polynomial and exponential functions. Table 2 lists the different regression models and their estimation errors.
Table 2 indicates that regression model 7 has the highest R2 of 0.9672 and the smallest RMSE of 5.56%; therefore, the quadratic exponential regression model 7 is the optimum model for predicting the droplet penetration ratio. The coefficients of model 7 are listed in Table 3.
The optimal droplet penetration ratio model based on the results of the wind tunnel spray test is:
P = 30.874 e 0.023 S 2 + 113.038 S + 65.979 ( 0.057 V + 9.622 ) ( 0.351 α + 3.262 )
It can be used to predict the droplet penetration ratio for spraying applications.

5. Conclusions

A mobile LIDAR scanner was used to obtain the canopy characteristics of trees, and wind tunnel tests were conducted to determine the effects of the incoming wind speed and optical porosity on the canopy and airflow field and droplet penetration ratio. The following results were obtained:
(1) A method for calculating the optical porosity of tree canopies based on mobile laser scanning was proposed. The characteristics of the point cloud data obtained by the system were analysed to determine the distance threshold and the optical porosity of the trees. Five Fortunella margarita trees were used to measure the tree height, canopy height, canopy width, and canopy thickness.
(2) The variation of relative wind speed with optical porosity and canopy height before and after was obtained by wind tunnel tests. The wind tunnel wind speed, porosity and collection point depth were used as independent variables to study the distribution of fog droplet penetration ratio inside the canopy and to construct a fog droplet penetration ratio model, in which the quadratic exponential regression model had the highest coefficient of determination R2 of 0.9672 and the smallest root mean square error RMSE of 5.56%.
Variable air-volume spraying belongs to the key technology of precise application in orchards. Proper control of wind volume size according to the canopy structure, number of branches and leaves, and growth period allows for better penetration and deposition of fog droplets in the canopy of fruit trees and improves the effective utilization rate of pesticides, which is key to realizing the precise use of pesticides and to significantly reduce the loss of pesticide fog droplets. This paper constructed a fog droplet penetration ratio model based on wind tunnel wind speed, porosity and collection point depth. Through the research of this paper, the basis for wind volume adjustment and theoretical support are provided for wind-delivered variable application in orchards

Author Contributions

Conceptualization, Y.R. and X.C.; Methodology, X.C.; Software, C.H.; Validation, S.F.; Formal analysis, F.Y. and J.L.; Investigation, C.Z.; Resources, Y.R.; Data curation, C.Z.; Writing—original draft, X.C.; Writing—review & editing, C.H.; Supervision, S.F.; Project administration, Y.R.; Funding acquisition, Y.R. and F.Y. All authors have read and agreed to the published version of the manuscript.

Funding

The state scholarship fund by China Schaolarship council: 202008320017; National Natural Science Foundation of China: 52275257; Jiangsu Agricultural Science and Technology Independent Innovation Fund Project: cx(18)1007802.

Institutional Review Board Statement

Not applicable.

Data Availability Statement

The data presented in this study are available on request from the corresponding author. The data are not publicly available due to privacy.

Conflicts of Interest

The authors declare no conflict of interest.

References

  1. Cui, E. Design and Research of the Qiaohua Orchard Operation Vehicle. Master’s Thesis, Northwest Agriculture and Forestry University of Science and Technology, Xianyang, China, 2018. [Google Scholar]
  2. Zhang, H.F.; Xu, L.Y. Current status and outlook of orchard sprayer development. China J. Agric. Chem. 2014, 35, 112–118. [Google Scholar]
  3. Tu, J. Experimental Research on the Design and Optimization of Key Operational Parameters of Tower-Type Air-Fed Spraying System. Master’s Thesis, Chinese Academy of Agricultural Sciences, Beijing, China, 2020. [Google Scholar]
  4. Zhao, Y.; Xiao, H.; Mei, S.; Song, Z.Y.; Ding, W.Q.; Jing, Y.; Xia, X.; Yang, G. Current situation and development strategies of mechanized orchard production in China. J. China Agric. Univ. 2017, 22, 116–127. [Google Scholar]
  5. Zhang, L.; Wang, J.; Ye, Y.; Yang, D.; Yuan, H.; Tian, H.; Xia, C. Preliminary observations on the attenuation of droplet deposition distribution on maize plants in high pole spraying technology: Public Plant Protection and Green Control. In Proceedings of the 2010 Annual Conference of the Chinese Society for Plant Protection, Hebi, China, 28–31 November 2010. [Google Scholar]
  6. Qin, W.; Xue, X.; Zhou, L.; Zhang, S.; Sun, Z.; Kong, W.; Wang, B. Influence of spray parameters of unmanned helicopters on the distribution of droplet deposition in maize canopies. J. Agric. Eng. 2014, 30, 50–56. [Google Scholar]
  7. Gaskin, R.E.; Manktelow, D.W.; Cook, S.; May, W.A. Effects of canopy density on spray deposition in kiwifruit. N. Z. Plant Prot. 2013, 66, 194–198. [Google Scholar] [CrossRef] [Green Version]
  8. Zhu, Y.K.; Zheng, Y.M.; Wang, J.; Xiao, X.M.; Wang, K.Y. Effect of spraying method and spray volume on the deposition distribution of pirimicarb and acetamiprid in cotton fields and the control effect of cotton aphids. J. Insects 2013, 56, 530–536. [Google Scholar]
  9. Kong, X.; Wang, G.; Ji, J.; Xu, D.; Yuan, H. Study on the distribution of droplet deposition and pesticide utilization rate of seven plant protection machines in maize field spraying: Green ecological sustainable development and plant protection. In Proceedings of the 12th National Members’ Congress and Annual Conference of the Chinese Society for Plant Protection, Changsha, China, 9–10 November 2017. [Google Scholar]
  10. Zhai, C.; Zhao, C.; Ning, W.; Long, J.; Wang, X.; Weckler, P.; Zhang, H. Research progress on precision control methods of air-assisted spraying in orchards. Trans. Chin. Soc. Agric. Eng. 2018, 34, 1–15. [Google Scholar]
  11. Zhou, L.; Xue, X.; Zhou, L.; Zhang, L.; Ding, S.; Chang, C.; Zhang, X.; Chen, C. Research situation and progress analysis on orchard variable rate spraying technology. Trans. Chin. Soc. Agric. Eng. 2017, 33, 80–92. [Google Scholar]
  12. Cross, J.V.; Walklate, P.J.; Murray, R.A.; Richardson, G.M. Spray deposits and losses in different sized apple trees from an axial fan orchard sprayer: 1. Effects of spray liquid flow rate. Crop Prot. 2001, 20, 13–30. [Google Scholar] [CrossRef]
  13. Cross, J.V.; Walklate, P.J.; Murray, R.A.; Richardson, G.M. Spray deposits and losses in different sized apple trees from an axial fan orchard sprayer: 2. Effects of spray quality. Crop Prot. 2001, 20, 333–343. [Google Scholar] [CrossRef]
  14. Cross, J.V.; Walklate, P.J.; Murray, R.A.; Richardson, G.M. Spray deposits and losses in different sized apple trees from an axial fan orchard sprayer: 3. Effects of air volumetric flow rate. Crop Prot. 2003, 22, 381–394. [Google Scholar] [CrossRef]
  15. Xue, X.; Song, S.; Chen, J.; Hong, T.; Li, Z.; Dai, Q. Experimental study on spraying effectiveness and droplet penetration of a wide spraying width wind-driven sprayer in fruit tree canopies. Guangdong Agric. Sci. 2014, 41, 155–158. [Google Scholar]
  16. Duga, A.T.; Ruysen, K.; Dekeyser, D.; Nuyttens, D.; Bylemans, D.; Nicolai, B.M.; Verboven, P. Spray deposition profiles in pome fruit trees: Effects of sprayer design, training system and tree canopy characteristics. Crop Prot. 2015, 67, 200–213. [Google Scholar] [CrossRef]
  17. Sun, C.; Qiu, W.; Ding, W.; Gu, J. Parameter optimization and experiment of air-assisted spraying on pear trees. Trans. Chin. Soc. Agric. Eng. 2015, 31, 30–38. [Google Scholar]
  18. Sun, C.; Liu, C. Construction and application of droplet canopy penetration model for air-assisted spraying pattern. Trans. Chin. Soc. Agric. Eng. 2019, 35, 25–32. [Google Scholar]
  19. Miranda-Fuentes, A.; Rodríguez-Lizana, A.; Gil, E.; Agüera-Vega, J.; Gil-Ribes, J.A. Influence of liquid-volume and airflow rates on spray application quality and homogeneity in super-intensive olive tree canopies. Sci. Total Environ. 2015, 537, 250–259. [Google Scholar] [CrossRef] [PubMed]
  20. Endalew, A.M.; Debaer, C.; Rutten, N.; Vercammen, J.; Delele, M.A.; Ramon, H.; Nicolaï, B.M.; Verboven, P. Modelling pesticide flow and deposition from air-assisted orchard spraying in orchards: A new integrated CFD approach. Agric. For. Meteorol. 2010, 150, 1383–1392. [Google Scholar] [CrossRef]
  21. Hong, S.-W.; Zhao, L.; Zhu, H. CFD simulation of airflow inside tree canopies discharged from air-assisted sprayers. Comput. Electron. Agric. 2018, 149, 121–132. [Google Scholar] [CrossRef]
  22. Chen, S.; Lan, Y.; Bradley, K.F.; Li, J.; Liu, A.; Mao, Y. Effect of Wind Field below Rotor on Distribution of Aerial Spraying Droplet Deposition by Using Multi-rotor UAV. Trans. Chin. Soc. Agric. Mach. 2017, 48, 105–113. [Google Scholar]
  23. Salcedo, R.; Granell, R.; Palau, G.; Vallet, A.; Garcerá, C.; Chueca, P.; Moltó, E. Design and validation of a 2D CFD model of the airflow produced by an airblast sprayer during pesticide treatments of citrus. Comput. Electron. Agric. 2015, 116, 150–161. [Google Scholar] [CrossRef]
  24. Wang, B. Study on Flow Field and Resistance Characteristics of Three-Dimensional Microscopic Canopy Structure. Master’s Thesis, Donghua University, Shanghai, China, 2016. [Google Scholar]
  25. Wu, S.; Pan, F. SPSS Statistical Analysis; Tsinghua University Press: Beijing, China, 2014. [Google Scholar]
  26. Wang, L. Multivariate Statistical Analysis: Model, Case and SPSS Application; Economic Science Press: Beijing, China, 2010. [Google Scholar]
Figure 1. Flowchart for calculating optical porosity.
Agriculture 13 00339 g001
Figure 2. The coordinate system in which the LIDAR data are collected.
Agriculture 13 00339 g002
Figure 3. Airflow field and spray deposition test systems in the wind tunnel.
Agriculture 13 00339 g003
Figure 4. The canopy airflow field and spray tests in the wind tunnel.
Agriculture 13 00339 g004
Figure 5. Trees with different densities.
Agriculture 13 00339 g005
Figure 6. Diagram of the measurement point locations.
Agriculture 13 00339 g006
Figure 7. Relative wind speed in front of and behind the trees at the centre of the canopy.
Agriculture 13 00339 g007
Figure 8. Relative wind speed at different canopy heights measured 0.1 m downwind of the canopy.
Agriculture 13 00339 g008
Figure 9. Relative wind speed in front of and behind the centre of the canopy of tree 5.
Agriculture 13 00339 g009
Figure 10. Variation of relative wind speed with height at 0.1 m downwind of canopy of experimental tree 5.
Agriculture 13 00339 g010
Figure 11. The effects of the incoming wind speed V, optical porosity α and collection point depth S on the droplet penetration ratio P.
Agriculture 13 00339 g011
Table 1. Canopy characteristics and optical porosity.
Canopy InformationTree Number
12345
Tree Height/m1.3911.3861.4191.4391.423
Canopy height/m0.9190.8870.8760.9080.893
Crown width/m0.9090.9060.9250.9350.928
Maximum canopy thickness/m0.8840.8720.8960.8880.884
Optical porosity0.405760.341380.232870.136370.06594
The optical porosity of trees 1, 2, 3, 4, and 5 were 0.40576, 0.34138, 0.23287, 0.13637, and 0.06594, respectively. Tree 1 had the highest optical porosity, indicating that it had the lowest density, whereas tree 5 had the densest canopy.
Table 2. Comparison of fitting results of different models.
Function TypeModel NumberExpressionsR2RMSE/%
First-order polynomial1 a 1 V + b 1 α c 1 S + d 1 0.788915.17
2 ( a 1 V + b 1 ) ( a 2 α + b 2 ) a 3 S + b 3 //
Quadratic polynomial3 a 1 V 2 + b 1 V + a 2 α 2 + b 2 α a 3 S 2 b 3 S + c 0.789815.14
First-order exponential4 A e 1 a 1 V + b 1 α c 1 S 0.91976.54
5 A e a 3 S + b 3 ( a 1 V + b 1 ) ( a 2 α + b 2 ) 0.94666.08
Second-order exponential6 A e 1 a 1 V 2 + b 1 V + a 2 α 2 + b 2 α a 3 S 2 b 3 S 0.92716.52
7 A e a 3 S 2 + b 3 S + c 3 ( a 1 V + b 1 ) ( a 2 α + b 2 ) 0.96725.56
Note: V is the outlet wind speed, m/s; S is the depth of the collection point, m; α is the optical porosity; R2 is the coefficient of determination; RMSE is the root mean square error, %; the other letters are coefficients.
Table 3. The coefficients of the optimal quadratic exponential model.
Aa1b1a2b2a3b3c3
30.8740.0579.6220.3513.2620.023113.03865.979
Disclaimer/Publisher’s Note: The statements, opinions and data contained in all publications are solely those of the individual author(s) and contributor(s) and not of MDPI and/or the editor(s). MDPI and/or the editor(s) disclaim responsibility for any injury to people or property resulting from any ideas, methods, instructions or products referred to in the content.

