Review

Rice Production Chain: Environmental and Social Impact Assessment—A Review

Department of Management, Sapienza University of Rome, Via del Castro Laurenziano 9, 00161 Rome, Italy
*
Author to whom correspondence should be addressed.
Agriculture 2023, 13(2), 340; https://doi.org/10.3390/agriculture13020340
Submission received: 23 December 2022 / Revised: 13 January 2023 / Accepted: 28 January 2023 / Published: 30 January 2023
(This article belongs to the Section Agricultural Systems and Management)

Abstract

:
Rice is the most widely used cereal for human consumption, attributing its production as one of the most important activities for the global population. Therefore, given its economic and nutritional value, assessing the sustainability of this production process could be worth noting. In this regard, this research aims to investigate the most recent literature related to Life Cycle Assessment (LCA) of rice primary production, to clarify the extent to which Life Cycle Thinking (LCT) and thus the three pillars of sustainability have been applied in the rice sector, as well as to highlight possible research gaps. Thus, 40 articles (2012–2022) were analyzed. The main research gaps that were found were, firstly, that there was a lesser tendency to consider multiple functional units, highlighting how little multifunctionality is considered. As to be expected, there was also a great difference in methodological choices, which often leads to a great variability of results, making evaluations and comparisons of impacts uncertain. These were also highly dependent on soil and climate conditions in the various countries, which could in turn affect input utilization, and results. The study of the impacts of primary rice production was then addressed by a few countries, among which some of the largest producers were absent, while the least considered aspects were related to the depletion of abiotic resources and the promotion of organic farming. Finally, sustainability assessments in rice production had little focus on the socio-economic dimension, showing how little LCT is considered. Therefore, based on this consideration, a Social Life Cycle Assessment was integrated into the study, the results of which show that the countries with medium to high social impacts could be India, Sri Lanka, Thailand, and Bangladesh.

1. Introduction

Recently, the United Nations declared that the world population has reached 8 billion and this figure will probably rise to 11 billion by 2100. Although this is a great achievement in terms of human development, this will also mean that food demand will probably have to increase by approximately +40% [1] to feed a growing population, by hugely exploiting natural resources. These pressures pose significant challenges to the agri-food sector, which contributes 35% of anthropogenic greenhouse gas (GHGs) emissions each year [2]. In this context, among plant-derived foods, cereals, which have been the main source of macro-nutrients for humans and animals for centuries, account for about 18% of emissions in the agri-food sector [3], and according to statistics from the Food and Agriculture Organization (FAO), their production is expected to increase by +1.3% each year until 2025 to meet the growing food demand [4]. Among the major cereals, along with maize and wheat, rice (Oryza sativa L. spp.) is one of the mainstays of human nutrition, since around 50% of the population depends on its cultivation. Its importance is evidenced by the fact that it is the second most produced and cultivated cereal in the world (25% of global cereal production) [4], as well as the most widely used cereal for human consumption, making rice cultivation one of the most important drivers of development for the economies, societies and cultural heritage of many countries. However, as well as the majority of agricultural crops, rice farming is mainly based on intensive cultivation techniques. Moreover, rice fields are also the main anthropogenic source of methane (CH4) (25–100 million tons per year), which is responsible for 20% of global warming [5,6]. These reasons make rice farming among the least sustainable activities in the agri-food sector and the focus on reducing the impacts on its production is a priority, also given the implementation of the Sustainable Development Goals (SDGs), in particular SDGs 1, 2, 12, 13, and 15. In this regard, due to the importance of rice to the food and economies of some countries and recognizing its relevance in promoting sustainability in the agri-food sector, this study aims to investigate the most recent literature on the application of Life Cycle Assessment (LCA) in the rice sector to assess sustainability issues at the country level, the main hotspots, the main differences in methodology, and any gaps in the research. Therefore, a literature review was conducted by selecting articles between 2012 and the first half of 2022 (because the literature before 2012 was irrelevant), in which an LCA was applied to study the impacts of only primary rice production (where the final output is rice and therefore excluding other secondary processes, including waste reuse for energy production, etc.). Forty articles were selected and thoroughly evaluated, considering the definition of the objectives and aims, functional units, system boundaries, life-cycle impact assessment (the main methodologies used and the most frequently used impact categories, the latter group in three macro-areas: environment, human health, and resources), interpretation, and whether the authors performed sensitivity analysis. For each study, it was then checked whether the authors had accompanied the LCA with Life Cycle Costing and Social LCA studies, in order to investigate to what extent the LCT approach was applied to the rice sector. The assessment of agriculture from a socioeconomic and environmental point of view could be particularly significant in a perspective of agricultural multifunctionality, thus aiding global sustainable development. Literature reviews on the application of LCA in the rice supply chain have been conducted to study the mitigation aspects of rice straw burning [7], the use of biomass for construction [8], the assessment of the energy potential of rice husk [9], and the production of bioethanol from lignocellulosic biomass [10]. To the authors’ knowledge, a review on the applications of LCA in the primary production of rice, which is present for the primary production of wheat [11] and maize [12], is still missing. Hence, the aim of this study was to enrich the currently available scientific literature related to the application of LCA in rice cultivation, as well as to create a knowledge base on the subject, considering the existing research gap related to the study of the sustainability of primary production in the rice sector. Thus, this would complete the study related to the sustainability of the three major cereals. A study on the sustainability of cereal production in different countries could be useful, especially in view of the transition towards more sustainable food production systems, as agriculture contributes to all four pillars of food security (availability, access, utilization, and stability) and to the three dimensions of sustainability (environmental, social and economic).

2. Materials and Methods

To conduct the literature review, the first reference database used was Scopus, after which the search was also completed on Google Scholar and Web of Science; these, however, returned the same articles as those selected by Scopus. Two parallel searches were conducted, in which the keywords “LCA AND Rice” (Search 1) and “Life Cycle Assessment AND Rice” (Search 2) were included as a matter of completeness of results, and in both cases considering “Title, Abstract, Keywords”. The inclusion and exclusion criteria are explained in Figure 1.
Only articles, conference papers, book chapters, reviews, and conference reviews between 2012 and the first half of 2022 were considered, which reduced the search from 273 and 457 initial articles to 252 (Search 1) and 413 (Search 2) results. After that, only previously published articles were considered (excluding a total of 8 articles in press, 4 for Search 1 and 4 for Search 2), and articles in languages other than English were excluded (7 articles in Chinese in Search 1; 20 articles, including 18 in Chinese, 1 in Spanish, and 1 in Italian for Search 2). For all remaining articles, the abstracts were read and all articles that did not deal with the primary rice production process were excluded (for example, energy generation from biomass or rice straw, the use of waste for construction, biofuel production, or anything else that did not relate to the topic of reference). The incorporation of rice husk for improving the mechanical strength of calcium aluminate cement concrete [13] is an example of the excluded articles. In the end, a total of 29 papers were selected from Search 1, and 37 papers were selected from Search 2. However, since LCA and Life Cycle Assessment are synonymous, 26 papers were common in both searches. In the end, the 26 common papers, plus 3 related only to Search 1 and 11 related only to Search 2 were selected, for a total of 40 papers, which were read in full and analyzed.

3. Results and Discussions

3.1. Goal and Scope Definition

Among the 40 articles, 37 were related to LCA, while 3 were related to S-LCA; these will be discussed in more detail in Section 3.6.
Regarding the first 37 articles, the results showed that the countries with the most scientific production were China and Iran, with 9 and 8 articles respectively (Figure 2). This was followed by Thailand, Italy, and Bangladesh (3 items each), Brazil, Japan, India, and Malaysia (2 items per country), and Senegal, Spain, and Sri Lanka (1 item per country).
Understanding the geographic distribution of studies could be important, as each country has different agronomic techniques, depending mainly on growing seasons, water availability, and various inputs used. Therefore, each author will define their own goal based on the typical cultivation techniques of their target country. In addition, it emerges that although the rice variety is often not specified, most studies focused on assessing hotspots in a specific rice production process only, whether conventional, organic, or integrated. The results show that most studies considered conventional cultivation and intensive agronomic techniques, such as studies in China [14], Iran [15,16,17,18,19,20], Japan [21], Bangladesh [22,23], Thailand [24,25], and Malaysia [26]. On the other hand, few studies [27,28,29,30,31,32,33] dwelled on the comparison between conventional and organic production. This shows that LCA in rice farming still fails to sufficiently capture the differences between organic and conventional production, and thus the impacts and benefits of organic farming. It should also be pointed out that studies on the Asian belt (China, Bangladesh, Malaysia, Thailand, and Japan), whose countries can take advantage of favorable climatic conditions, do not consider artificial water as an input, which therefore does not directly influence the results. The main focus of these studies is often on fertilizer and pesticide management, such as in the case of three studies [34,35,36] which consider rice and aquaculture, precisely to reduce fertilizer loads. In contrast, water management practices are only compared in two studies [37,38], and only one study [39] examines the difference between white and parboiled brown rice. Therefore, the results show how geographical difference has a particular influence on both the object of the study and the methodological framework. The inventory data are calibrated according to the needs and requirements of the soil and climate conditions of the reference country, thus influencing the final results differently.

Functional Unit

The most frequently used FUs were 1 ton of rice (17 studies), 1 ha of land (14 studies), and 1 kg of rice (10 studies) (Table S1). Other authors used more than one FU, such as 1 RMB yuan and 1 Nutrition Density Unit (NDU) [36], 1 hectare and 1,000 RMB yuan [35], 1 hectare and 1 ton [14,15,40] or 1 ton and 1 yuan [41]. Other FUs were also chosen, such as 1 kg of protein [39] or 6.8 tons of rice [42]. Thus, it can be seen that there is a particular preference for studying the production of 1 ton of product and the cultivation of 1 hectare of land, while less emphasis was given to other FUs such as nutritional or economic ones. Although no concrete recommendations are typically given on how to define FUs, it would be desirable to identify them so that they are suitable to capture a broad measure of the sustainability of agricultural production. One area of research that could be interesting in applying LCA in the rice sector, and in agriculture more generally, should be the use of multiple FUs instead, as this would better capture the meaning of agricultural multifunctionality. For example, using 1 kg or 1 ton as FU and contextually 1 hectare [37] could give an idea of the environmental impacts corresponding to both the primary function of pro-duction and land use, just as using a profit unit [35] or a nutritional unit [36] could indicate its financial and food function. Impacts should be calculated based on FUs that can reflect the services provided by the system since agricultural ones are multifunctional systems. This review shows that multifunctionality is rarely considered in LCA studies, which could pose a methodological challenge. Therefore, to complete the assessment studies should, when possible, consider other functions to study agricultural multifunctionality through the quantification of additional externalities.

3.2. System Boundaries

There is a particular preference for “cradle-to-farm” production (Table S2). Furthermore, it is not uncommon for authors to not clearly specify whether they consider the production process of the inputs or only their use, but often speak generically. Nevertheless, there is a generic heterogeneity in defining both the stages and the inputs involved and their production processes, with significant discordance among authors. Sometimes the processes involved in the production of various inputs such as seed production, pesticides, and fertilizers are included [14,29], while other authors do not consider seed production [35]. In general, mainly due to the limited availability of data and dwelling on the stages of the production process, there is a widespread tendency in LCA studies of rice production to consider the period from cradle to gate as reference boundaries. However, what is changing is that sometimes the production processes of machinery [27,28,31,38] and storage warehouses [17,38], transportation to the farm [36], rice milling [39], or even packaging [30,39] and distribution [37] are considered, effectively making the studies non-comparable with each other, as they include inputs such as machinery and packaging that could influence the results. Therefore, it emerges that although there is agreement on the choice of boundaries and most studies stop their analysis at paddy harvesting, there is also a certain share of authors investigating other additional production processes, as well as including other inputs involved (such as machinery) while not always clarifying the criteria for input confinement. In addition, because each author considers different steps and inputs (in turn considering entire production processes or use) or because of a lack of clarity on the part of the authors, it may sometimes be difficult to compare results, with the risk of overestimating or underestimating them and making them effectively non-comparable.

3.3. Life Cycle Impact Assessment (LCIA)

For LCIA, the most widely used methodology is ReCiPe 2016 MidPoint (Figure 3) (32% of papers considered). Arguably, considering its 18 impact categories and 3 harm categories, this might be more inclusive than other calculation methodologies, such as ILCD 2011 Midpoint+ (which has 16), IMPACT 2002+ (which has 15), and CML-IA baseline (which has 11), of which ReCiPe seems to be a more recent update [43]. The preference for LCIA calculation methods could therefore depend on the type of study, its objective, the impacts to be researched, the relevance and appropriateness to the individual country situation, or even the nationality of the authors and the accuracy of the results.
Often a mix of methods is used (Ecopoints, Cumulative Energy Demand, and IPCC) [17], but in general, the use of different methods could introduce an uncertainty factor for both the interpretation and comparability of the results of LCA studies. The impact categories most considered by the authors varied according to the method they used; based on that, they turned out to be more or less specific, and were sometimes named differently, even though they expressed the same concept. Therefore, wherever possible for this study the names of the impact categories were standardized and expressed based on a common name (Figure 4). Impact categories were expressed according to their numerosity, understood as the number of times they were used in the analyzed literature, i.e., the number of authors using them. Overall, among the 37 studies, 31 impact categories were used, which for greater understanding were divided into three macro-areas: Environmental, Human Health, and Resources.

3.3.1. Environmental

The results of the review showed that the two most considered categories were Global Warming Potential (GWP) (N = 32) and Terrestrial Acidification (TA) (N = 27), followed by Freshwater Ecotoxicity (FE) (N = 16), Eutrophication Potential (EP) (N = 15), and Water Consumption (WC) (N=13). The high consideration of GWP reflects the commitment of rice producers to seek solutions to limit methanogenesis and field emissions, such as using more environmentally friendly agronomic techniques. TA, on the other hand, is another of the main direct effects of agricultural activities. The volatilization of fertilizers causes the formation of ammonia (NH3), which triggers processes of soil acidification [44] and the reduction of soil fertility; this could further widen the gap between food supply and demand, contributing to increased food insecurity. Therefore, it is most likely for these reasons that researchers were particularly focused on keeping acidification processes under control. The other three most studied impact categories were freshwater ecotoxicity, eutrophication potential, and water consumption. The former is particularly considered because it is one of the direct impacts mainly attributed to the use of pesticides and the release of heavy metals into the water [45,46]. These can pass to aquatic fauna and be consumed by humans, as well as spread to drinking water sources and soils through irrigation, thus affecting food security. Therefore, controlling toxic impacts improves both food safety and human health. The study of eutrophication, on the other hand, reflects the researchers’ interest in studying the effects of nitrogen- or phosphorous-based fertilizers used in agriculture. These end up in water and cause algae to proliferate and make aquatic life inhospitable, and, once decomposed, take oxygen away from the water, killing or displacing fauna. Thus, the impact categories mentioned so far reflect a dual concern, which spills over not only into the protection of ecosystem quality but also into food security. Finally, the results show how land-use categories are poorly considered (16 total im-pacts), even though rice accounts for 11% of cultivated land globally [47]. This highlights that land-use concern does not seem to emerge in studies related to rice farming, even though growing concerns about natural habitat loss and land subtraction emphasize the importance of producing more rice on existing land, optimizing energy, water, and another input efficiency [48].

3.3.2. Human Health

The most considered impact category was human toxicity (HT) (N = 23), which was then followed by the effects on ozone, such as its depletion (SOD) (N = 14) and formation (OFHH) (N = 4), as well as particulate matter formation (FPMF) (N = 7) and ionizing radiation (IR) (N = 5). In general, there was special attention paid to human toxicity, which is caused by the emission of certain substances such as heavy metals present within insecticides, and this, therefore, testifies to the efforts in keeping these inputs under control. Regarding SOD, i.e., the conversion of ozone (O3) to oxygen (O2) in the stratosphere, in the rice sector it is most likely due to N2O emissions caused by the use of nitrogen fertilizers or methyl bromide used for pest control (the latter phased out after the Montreal Protocol, although decades will be needed before it disappears totally from the atmosphere). Thus, again, the choice of this impact category reflects the author’s commitment to fertilizer management. In contrast, excessive ozone formation in the atmosphere is mainly caused by the burning of fossil fuels and can have negative impacts on human health (respiratory problems) and on terrestrial ecosystems (reduction of plant biomass). Regarding FPMF, sources of air pollution may be related to a wide range of field operations, including farm machinery exhausts, combustion plants, agricultural processing, as well as pesticides [49]. The numerosity of this category implies a possible increase in sustainability awareness aimed at achieving soil and water conservation. The study related to ionizing radiation could imply a focus on the impacts of energy sources, as they come from a wide range of fields such as nuclear power generation, with results varying according to each country’s energy mix. However, the choice to select one or another impact category should not necessarily depend on a commitment to a particular issue, but rather because multiple authors have chosen a particular methodology that includes that category and thus returns certain results. Therefore, the numerosity of an impact category could be attributable simply to the fact that that method includes that category and has been used multiple times. Therefore, it can be seen that the main concern was mainly related to the impacts of chemical nitrogen fertilizers (including direct emissions and those caused by their production), whose effects cover most of the impact categories, as well as direct CH4 emissions due to methanogenesis, and impacts related to the mechanization phase (diesel production and consumption) and electricity management.

3.3.3. Resources

Regarding the resources macro area, the most studied impact categories were Fossil Resource Scarcity (FRS) (N = 13), Metal Depletion (MD) (N = 9), and Abiotic Depletion (AD) (N = 4), while the least considered was Mineral Resource Scarcity (N = 2). However, it should be noted that although named differently, these categories express more or less the same concept. For example, AD could be decomposed into FRS + MRS, just as MD is a less generic category than MRS. The literature review showed that the study of environmental impacts on abiotic resources appears to be the least considered area of research, showing little interest on the part of authors in avoiding their depletion. This is due to both a lower number of such categories within the methodologies, and also to less choice on the part of the authors. In general, it seems that the quantification of abiotic resource depletion in LCA is not well understood, and it seems that current LCA models do not recognize AD as a potential problem, as it is addressed rather marginally. However, given the recent energy crisis related to the Russia-Ukraine conflict, resource scarcity is becoming more and more imminent. In addition, the depletion of abiotic resources could cause non-negligible effects that actually should be investigated more thoroughly, such as the rising costs of energy, raw materials, and semi-finished products. Agriculture represents one of the sectors where these increases could have immediate effects, starting from fuel cost increases to fertilizer and pesticide costs, thus generating a loop of adverse environmental impacts that affect ecosystems and the economy.

3.4. Interpretation

The literature studies came from different countries and continents (Asia, Europe, Africa, and South America) and it was therefore possible to extrapolate the results for comparison. The reference value chosen from most of the studies was the GWP, expressed in kg CO2 eq (Table S3). However, as the various studies sometimes had different FUs, the various GWPs were all expressed in terms of 1 ton of product to make them comparable. When the FU was 1 kg, the GWP obtained was multiplied by 1000, while when the FU was 1 hectare, the yield per country was calculated [50] and the results were expressed accordingly. In the case of the study by Nunes et al. (2017) [39], where the FU is equal to 1 kg of protein, the GWP was calculated based on the protein contained in 1 kg of rice and then multiplied by 1000. Three studies [20,42,51] were excluded because their results were expressed as a percentage. For 1 ton of rice, in Iran, the GWP is about 298 kg CO2 eq [16], in Brazil 482 kg CO2 eq [37], in Italy 1301 kg CO2 eq [38] and in Malaysia 1390 kg CO2 eq [26]. It can be seen that Malaysia and Italy, although they have different cultivation techniques, have almost equal results. In this case, Italy’s production system is irrigated and therefore includes impacts related to electricity to run the pumps [38], while Malaysia relies almost exclusively on rainfall during the monsoon season [31] as well as its dense network of canals. Similar results are therefore most likely attributable to the increased use of fertilizers and pesticides in Malaysia, due to the need to increase yields to feed a population that relies almost exclusively on rice for its staple diet. Countries such as China and Japan, on the other hand, being water-rich as they receive abundant annual rainfall, also have sufficient water sources to meet the water requirements for rice cultivation. Therefore, the effects related to water pumping are not considered and the high impacts of their production (reaching a maximum of 3000 kg CO2 × 1 ton for China and 2160 kg CO2 eq for Japan) could be mainly related to the extensive use of fertilizers, as well as the divergent results due to the different boundaries and inputs considered within them. The environmental incompatibility of rice production, therefore, could diverge mainly due to the soil and climate conditions in the various countries, which then condition the choice of inputs. In Italy, for example, the impacts were conditioned above all by the excessive use of water, which causes direct impacts linked to methanogenesis and indirect impacts linked to the production process of the electricity mixture for its pumping. The Italian soil and climate conditions do not favor a type of cultivation comparable to those in Asia, where annual rainfall ensures a sufficient water supply, but instead require a continuous artificial water supply. In Asian countries, on the other hand, the greatest impacts were linked to the use of fertilizers and pesticides, the use of which has increased dramatically over the years thanks to their low cost and policies that favor their use. Fertilizers and pesticides are more or less commonly used for rice production in all countries, but in Europe, there is the Council Directive 91/676/EEC [52] that regulates them and establishes the maximum nitrogen loads allowed per hectare. However, different results are also influenced by other factors, such as different system boundaries, different phases, different input quantities, and different methodological structures (as each author examines specific techniques and each result must be contextualized according to the specific methodology and technique used). This may make the studies difficult to compare.

Sensitivity Analysis (SA)

SA was performed with different assumptions than those used in the primary analysis, to check the sensitivity of the study results if different assumptions were used and thus how they change when the assumptions of a model are changed [53]. Among the 40 studies analyzed, 10 authors [14,24,27,28,31,37,38,39,54,55] (i.e., 25%) performed a sensitivity analysis. This may be due to the fact that since it is not regulated by ISO it is an optional step, up to the willingness of the authors, who more or less create alternative scenarios to demonstrate possible examples of improvement. However, because SA measures how varying inventory data can affect results, it could be particularly useful in improving model prediction by qualitatively and quantitatively studying the response of the study as the input variables change. Moreover, while interpretation is voluntary, it remains a key step in LCA because, in addition to ensuring the reliability and robustness of the study, the transition to a more sustainable and circular economy model requires different hotspot improvement and management options, which can be examined precisely through an SA.

3.5. Life Cycle Costing

The second pillar of life cycle thinking is life cycle costing (LCC), which is defined by ISO 15686-5 as an “economic evaluation that considers all expected and agreed upon high and relevant cost streams throughout analysis expressed in monetary value” [56]. This procedure reveals the real costs of the output before it is produced. Among the studies analyzed, between 2012 and 2022, five authors [25,35,36,41,57] (i.e., 12%) accompany the LCA study with an economic evaluation. Notably, Chen et al. (2021) [35] and Escobar et al. (2017) [57] perform an average comprehensive LCC, while the other three authors perform a more generic cost-benefit analysis. Thus, the literature review results show a widespread tendency among authors not to consider the economic aspect in LCA studies. This tendency also confirms what happens more generally in LCA studies related to agri-food products: most likely due to difficulties on the part of the authors in adapting the LCC to the processes involved [58], although often the economic data of the inputs are known and easily calculable, therefore being less difficult to identify. Thus, there emerges a lack of consideration of the economic sustainability dimension in the rice sector, which appears to be not yet adequately studied, and this may also limit the use and application of additional analytical tools such as, for example, the Eco-Care Matrix [59].

3.6. Social Life Cycle Assessment

S-LCA is the third part of sustainability analysis, and it is used to assess the positive and negative socio-economic performance of different stakeholders along the product life cycle [60]. The literature review showed that there were only three studies investigating the social aspects of rice farming in 2012-2022, one in China [61] and two in Thailand [62,63]. Among these papers, only the study by Phantha et al. (2021) [63] considered the social sustainability of the rice production process, while the other two conducted comparative studies among multiple crops. Since there is still no reference standard for S-LCA nor a standardized method for S-LCIA, but only generic guidelines (ISO/AWI standard 14075 is under development), each author studied the social impacts based on different methodological frameworks, such as the calculation of semi-qualitative social indicators [61,63] or the calculation of normalized percentages [62]. Moreover, the first S-LCA study in the rice sector was carried out in 2019, 10 years after the release of the first UNEP guidelines. Therefore, even in the case of rice production, despite its potential, S-LCA is the least used. This is partly due to the lesser consideration of social sustainability in the agri-food sector [58], but also due to methodological issues, such as the lack of valid data and databases [64], the difficulty in defining system boundaries, cut-off criteria, and functional units [65,66], as well as the lack of shared criteria for the selection of stakeholders, indicators and sub-indicators [67]. However, the study of the social dimension in the rice sector could be important to provide a perspective on the multifunctionality of agriculture, based on the fact that it must not only satisfy food needs but also play a role in the development of the economy and society. This would mean going beyond the agricultural sphere, widening our gaze to the enhancement of the rice lands, the communities living there and their traditions, an interconnected system seen as an environmental, cultural, and human heritage. Hence, based on these considerations, an attempt was made to provide an initial general overview of the potential risks that rice farming could generate in various countries, considering the 12 countries found in the literature (Bangladesh, Brazil, China, India, Iran, Italy, Japan, Malaysia, Senegal, Spain, Sri Lanka, and Thailand). For the development of the analysis, the Product Social Impact Life Cycle Assessment (v3) (PSILCA) guidelines were followed [68], a professional database based on the UNEP framework, consisting of 87 indicators measuring social aspects in different stakeholder categories. For each indicator, the impacts were divided into social risk scales, ranging from no risk, very low, low, medium, high, and very high. A set of relevant indicators and impact sub-categories were therefore selected. Specifically, 2 stakeholder types (workers and local community) and 9 categories (Child Labor, Forced Labor, Fair Wages, Working Hours, Workers’ Rights, Discrimination, Health and Safety, Access to Material Resources, and Migration) were selected. In turn, the 9 categories were defined by 12 sub-categories, each defined by an indicator, as shown in Table 1. Indicators were selected based on data available within the database and in relation to the relevance between the rice sector and the various impact categories. Considering that there is still no reference standard for S-LCA and acknowledging the existence of only two databases (PSILCA and SHDB), some considerations need to be made. The first is that in most cases, PSILCA provides data at an aggregate level, a national level, or by sector. For example, for the impact category ‘Child Labor’, data were mostly available by geographic macro-area, such as Northern Europe, Southern Europe, etc., and not always by country; therefore, it is necessary to make broad statements. Otherwise, for example in the case of ‘Frequency of forced labor’, data were only available by country and not by individual sector, while in the case of ‘Hours of work per employee, per week’, only aggregated data were available for agriculture and animal husbandry, manufacturing, energy, etc. This includes the rice sector but is not specific to that sector. Therefore, risks were assessed according to the possibility that for example, rice production occurs according to a certain behavioral pattern typical of its sector. This is because if the information on social effects is not available at the product level, social effects cannot be attributed with certainty, and therefore risks are considered.
Indeed, it is not possible to know with certainty the social impact of the production of a specific good or service, but (at least for policy purposes), it is sufficient to know the probability with which a product is associated with an externality. From an analytical point of view, the use of the notion of risk has the advantage that risks thus conceived can easily be used as explanatory factors in policy analysis. Thus, social risks may undermine growth prospects or jeopardize other key policy objectives, so that perceived risks (rather than actual risk realizations) prompt actors to change their behavior [75]. Therefore, the risks defined by a social impact assessment, as also explained by the UNEP guidelines, are potential and not probable risks (which does not mean that they must necessarily occur), as well as the result of interpretations [67]. Finally, data for each indicator were not always available for all countries, so data quality is not always the best. Therefore, based on these considerations, an analysis of the various indicators was carried out for each country. Where possible, the main inputs that contribute to rice production were grouped into macro-areas, following the available data. In particular, ‘Agriculture’ (which includes livestock and animal husbandry, thus including seeds and organic fertilizers), ‘Industry’ (i.e., manufacturing, where chemical fertilizers, pesticides, and plastics are included), and ‘Energy sources and abiotic resources’ (i.e., mining and quarrying; electricity, gas, and water supply, where diesel, electricity and water are included). For the indicators ‘Hours of work per employee’, due to a greater disaggregation of data, energy sources and abiotic resources are broken down, with electricity falling under ‘electricity (gas, steam, and air conditioning supply)’ and diesel under ‘mining and quarrying’. Finally, in the category ‘International migrant workers in the sector’, data are only more generally expressed in ‘agriculture’ and ‘industry’. Sometimes, it was not possible to average the data between the various sectors. As these are separate sectors, there would have been a risk of over- or underestimating the results, so it was decided to analyze each sector individually. At this point, for each indicator at the local level, the results were normalized following the PSILCA guidelines, considering the five risk scales defined by the database: very low risk, low risk, medium risk, high risk, and very high risk. For example, in the case of ‘Number of children in employment’ expressed in %, the values can be in the ranges 0 < y < 2.5% (very low risk), 2.5% ≤ y < 5% (low risk), 5% ≤ y < 10% (medium risk), 10% ≤ y < 20% (high risk), and 20% ≤ y (very high risk), as well as no data [68]. So, if a value should be 3%, then it falls within the low-risk band, and so on for each indicator, for each country. Subsequently, each risk was given a numerical score from 1 to 5. Specifically: very low risk = 1; low risk = 2, medium risk = 3; high risk = 4, very high risk = 5. The final results of the evaluation were expressed in the form of a score, compared, and expressed graphically.

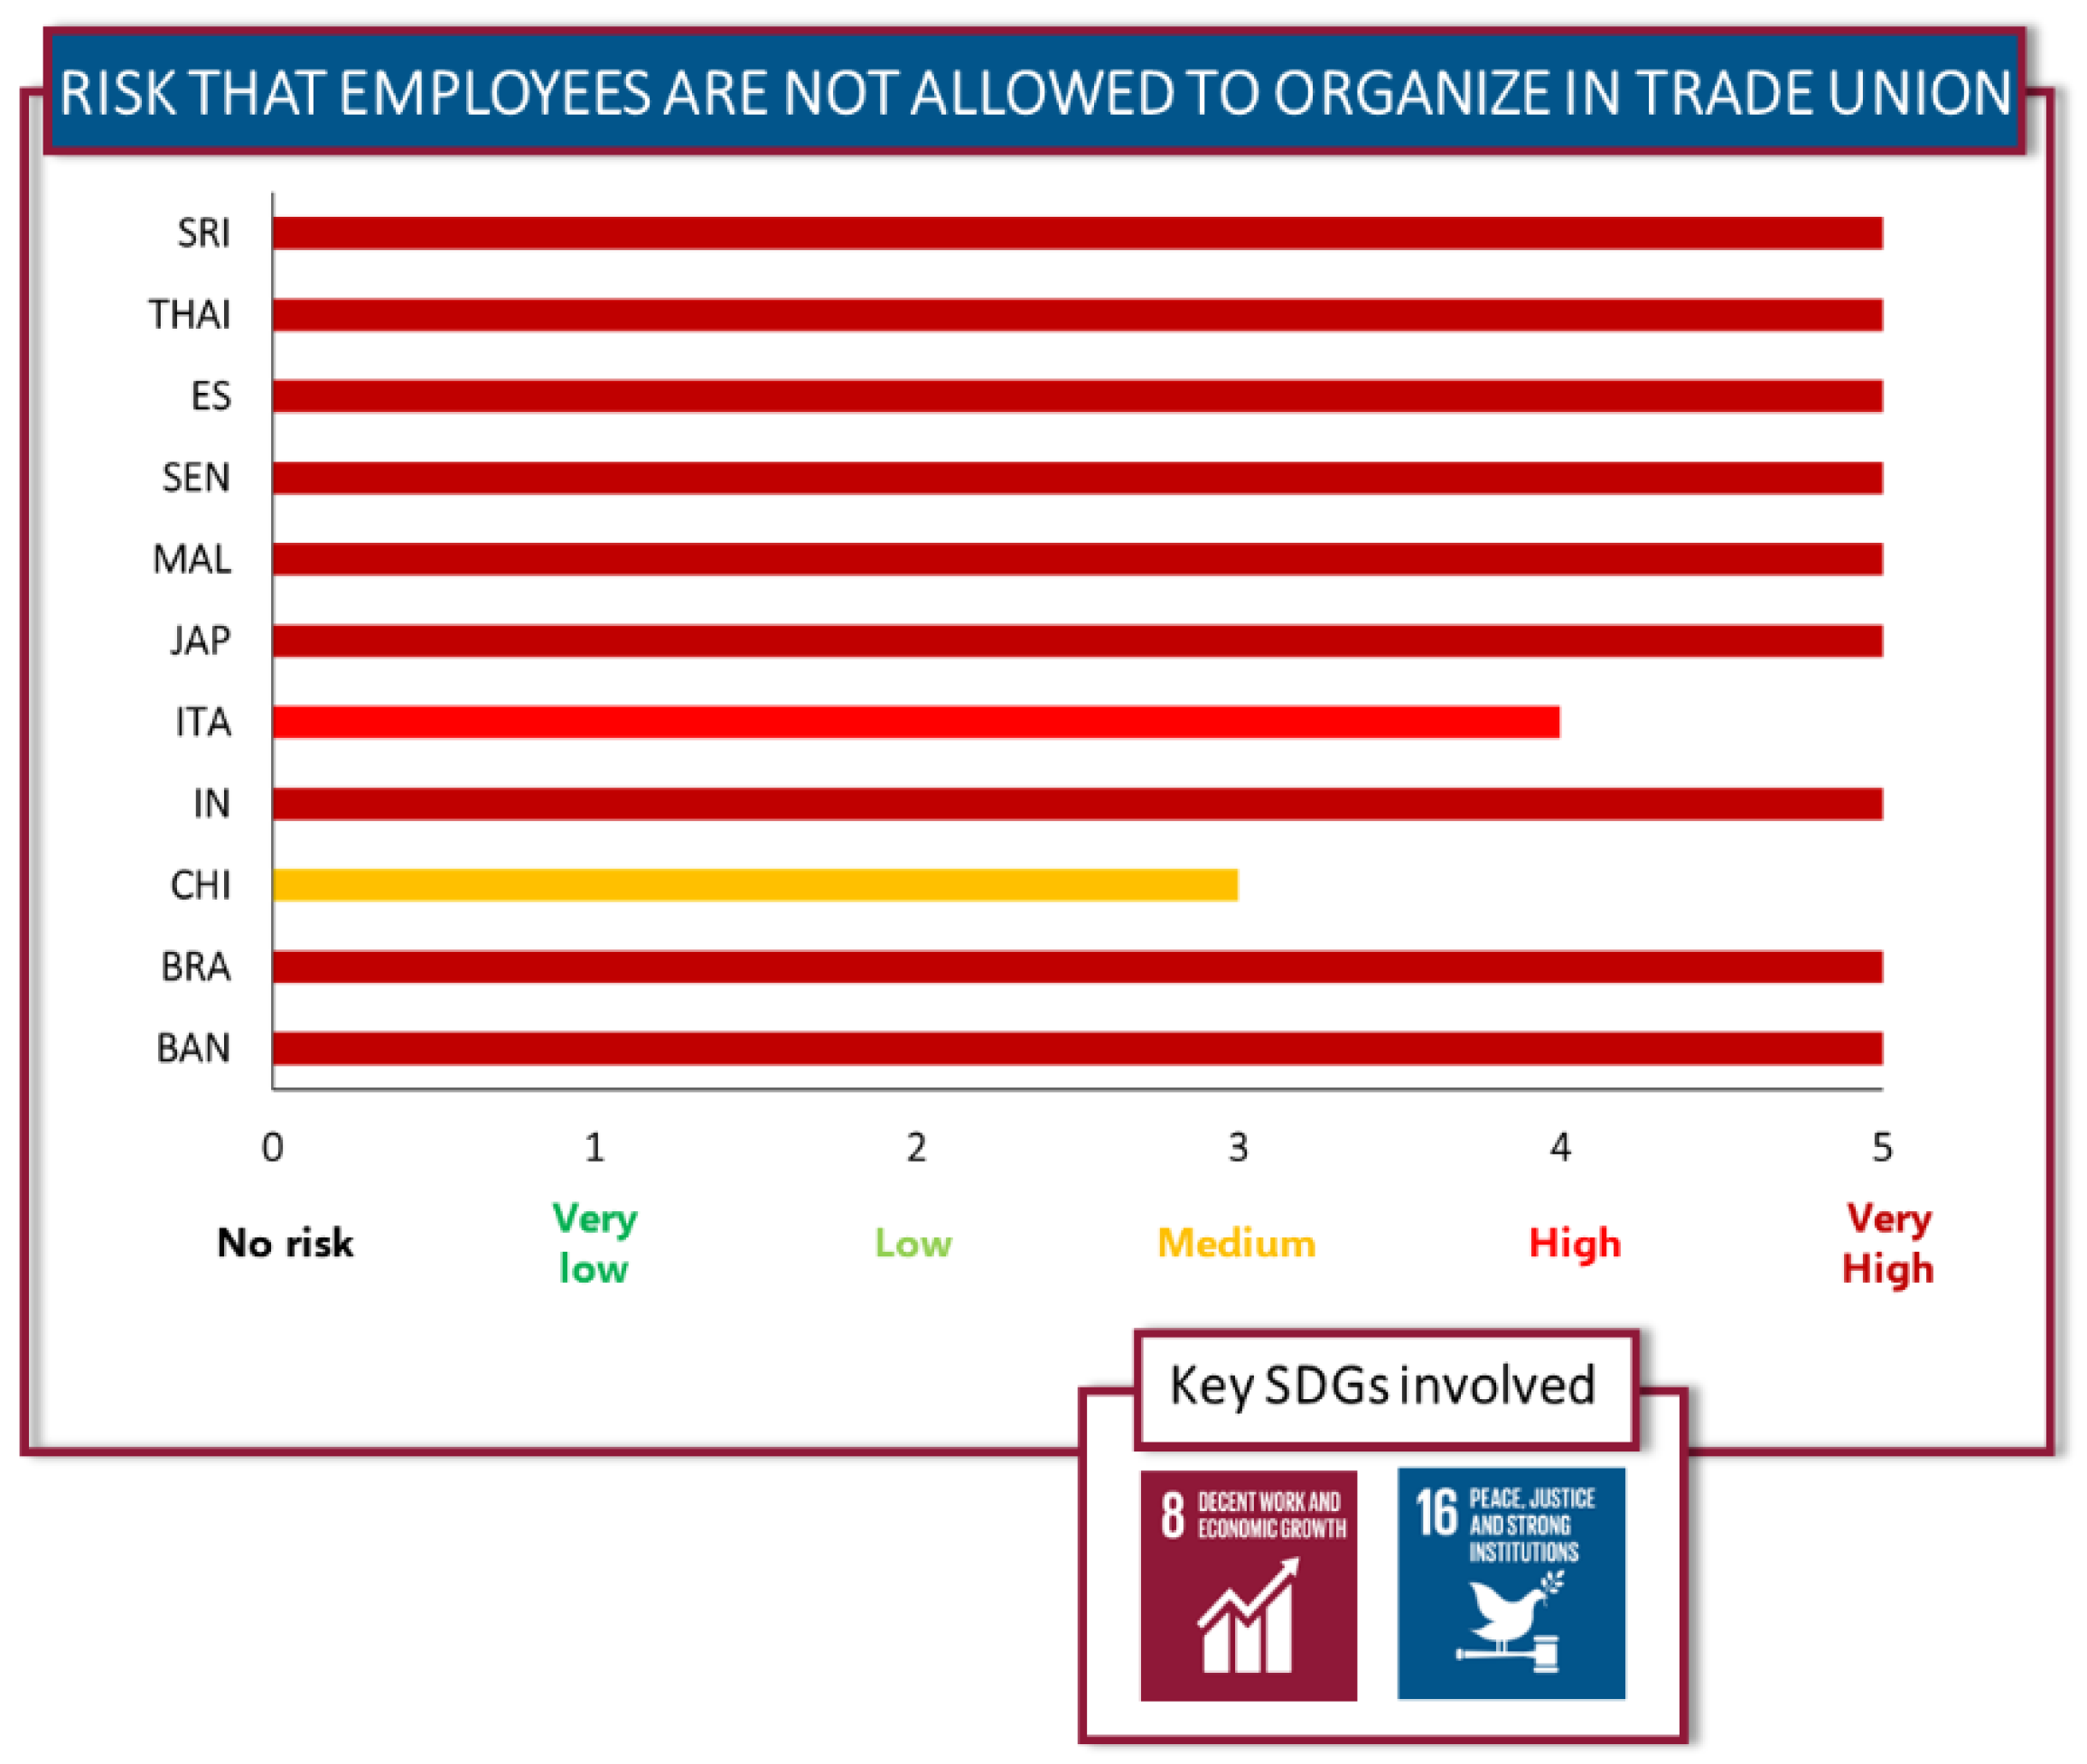
3.6.1. Stakeholders: Workers

The first impact category considered was ‘Child labor’, measured by the % of children workers aged between 5 and 17 in that sector [69]. In the agricultural sector, child labor is often linked to the performance of strenuous and dangerous tasks, which can lead to high rates of fatal and non-fatal accidents, as well as occupational diseases. Children are often forced to drive heavy agricultural machinery, use toxic pesticides, and perform dangerous activities with dynamite, exposing themselves; in the most extreme cases, even to the risk of severe amputations [76]. From the S-LCA results, the countries where there could be a significant risk in rice production were Senegal and India, with a score of 5/5 for both (very high risk), followed by Japan, China, and Bangladesh, with a score of 3/5 (medium risk) (Figure 5). In other countries, however, the risk was low or very low. This impact category is also accompanied by assessments of ‘forced labor’, expressed according to goods produced by forced labor (Number of goods in the sector) [70] (Figure 6A) and frequency of forced labor (Cases per 1000 inhabitants in the country) [71] (Figure 6B). The selection of two sub-categories is motivated by the fact that we wanted to strengthen the hypothesis concerning forced labor, by expanding the result to also consider the number of people involved and not only the number of goods.
In the first case, this indicator expresses the risk of forced labor in that country, and S-LCA shows that Brazil and India were the countries with the most significant risk, with a very high risk (5/5) and a medium risk (3/5) respectively (Figure 6A). Notably, in Brazil, both rice and livestock were produced with forced labor [70], and in the latter case, this could induce a very high potential risk that manure for organic production [39] is also from forced labor.
In India, rice is also produced with forced labor, and in most cases, such situations occur because of debts owed by farmers to the owners of land, mills, etc.; debts that in order to be repaid lead to a form of forced slavery to the owner himself [77]. Concerning the frequency of forced labor, an indicator expressed in cases × 1000 inhabitants, it emerges that the countries most involved in this phenomenon were Iran (very high risk) and Thailand (medium risk) (Figure 6B). In the case of Iran, forced labor mainly involves prisoners who have failed to pay their financial debts or have committed crimes due to sub-optimal economic conditions, and who are therefore forced into forced labor to pay bail, to settle their debts, or under the promise of leave and parole. Therefore, overall, regarding this impact category, there is a medium to high risk that the rice that ends up on our tables may come from contexts where basic labor rights are not respected, as in the case of Brazil, India, Iran and Thailand. The results of these first categories, therefore, show how rice production in these countries may not be sustainable from a social point of view; indeed, going in the opposite direction of the path towards the Sustainable Development Goals, especially SDG 8.7 and 16.2 regarding child labor, and SDG 5.2 and 8.7 regarding forced labor. Next, for the impact category ‘Fair wage’, the ‘Sector average wage per month’ was analyzed, which expresses the risk that wages are too low to allow for a decent living [72]. In this case, wages in the agricultural sector (which according to a broader definition of the term also includes animal husbandry), in the manufacturing sector (which also includes industries and enterprises) and in the energy and abiotic resources sector (including mining and quarrying, electricity, gas, and water supply) were considered for each country. In this impact category, data were available for all countries, with the exception of China, Iran, Italy, Japan and Malaysia, which were therefore not considered. The results of the analysis (Figure 7) show that in general, India and Sri Lanka were the countries where there are the greatest risks that the rice supply chain may lead to wages too low to enable a decent living. Specifically for the agricultural sector, India showed a very high risk (5 out of 5), and Brazil, Thailand and Sri Lanka a high risk (4 out of 5) (Figure 7A). Risk levels were defined with respect to the country’s subsistence wage by calculating the ratio of the subsistence wage to the minimum wage (for countries not shown in the Figure, data on their minimum wage or subsistence wage are not available).
In essence, the higher the ratio, the higher the risk of the minimum wage being too low, i.e., the living wage exceeding the minimum wage. Furthermore, the crude value of the minimum wage is considered on the basis of the assumption that a very low minimum wage aggravates living conditions in general (e.g., for the purchase of foreign products). With regard to fertilizers (Figure 7B) and energy sources/abiotic resources (Figure 7C), again India and Sri Lanka were the two countries in which there was a very high risk (5/5) that these may be produced by workers who are paid too little to allow them a decent living. Overall, therefore, with regard to this impact category, India and Sri Lanka were the countries where rice farming could induce the highest social risks. A decent living wage could make a decent living possible, and thus could affect key SDGs such as SDG 1.2, 8.5, 10.2, and then cascade to SDG 2, 3, and 5, especially in countries for which rice farming is an important source of income such as India. On the other hand, with regard to the ‘Working time’ impact category, expressed through the ‘Hours of work per employee, per week’ [69], it emerged that in relation to the four supply chains considered (Agriculture, Industry, Energy sources, Abiotic resources), Bangladesh was the country with the highest potential for improper working hour risks in rice farming (Table 2). In addition, for the agricultural sector, there is a medium risk of improper working hours occurring (3/5), while for both the industrial sector (pesticides, fertilizers, etc.) and the energy sources used for rice production, the risk could potentially be very high (5/5 in both cases). The risk assessment of this indicator is based on ILO Convention No. 1 and No. 47. The former limits working hours to 8 h per day and 48 h per week, while Convention No. 47 defines the standard working week as 40 h but is only ratified by 15 countries.
Therefore, both conventions have been taken into consideration. The higher the number of working hours per week, the higher the level of risk for the sector. In addition, even a very low number of working hours is considered improper, as they do not allow the employee to realize his or her professional goals or maintain sufficient professional social relations. In some countries such as Bangladesh and India, working hours in some sectors far exceed the average of 48 h per week, as in the case of manufacturing (55 h per week in Bangladesh and 54 in India) or mining and energy production (57 h per week in India). Thus, since fertilizers and pesticides, as well as energy sources, could come from sectors where there is an overabundance of hours in these countries, there could be a high risk that rice farming generates improper working hours, especially in Bangladesh and India. However, this risk could also potentially be medium in Italy and Spain (medium risk for manufacturing, energy, and diesel in both countries). Therefore, with regard to this impact category, there could be a medium to high risk that in countries such as Bangladesh, India, Spain, and Italy, rice cultivation could disadvantage the pathway towards SDGs 5.4, 8.8, 10.4, and 16.6. Next, the discrimination category was analyzed, expressed through the gender gap [69], i.e., the difference between women’s and men’s average earnings. These results are expressed in Table 3. In this case, the results are heavily influenced by the absence of data for some sectors and countries. However, from the available data, it is possible to understand that Sri Lanka, Senegal, and Bangladesh were the countries that could be most affected and for which there could be a risk of a gender gap. In particular, Sri Lanka and Senegal could potentially show a very high risk (5/5) that rice farming will induce an inequality of pay, especially due to differences in the agricultural sector and the sector related to fertilizers, pesticides, etc. The contribution of women to the agricultural economy is crucial, but progress is hampered by the serious inequalities in terms of access to resources and services that still characterize this sector.
Ensuring gender equality in agriculture is a priority and could lead to huge benefits in hunger eradication, children’s health, education, and climate change adaptation, as also emphasized by the FAO [78]. Again, for these countries, rice farming could therefore induce a slowdown toward SDGs 5.1, 5.5. but also 10.2. With regard to the health and safety category, it was expressed by two sub-categories: ‘Fatal accidents at workplaces’, measured by the number of fatal accidents that occurred in a given sector [69], and ‘Workers affected by natural disasters’, measured by the percentage of the population that lost their lives at work due to natural disasters [73]. The first subcategory expresses the potential risk of workers suffering fatal accidents. As with the Gender Wage Gap, this category is also characterized by the absence of data for many countries, and those available show that the countries in which rice farming could have a high risk of inducing fatal accidents at work were Thailand, Brazil, Japan, and Italy (Table 4).
In the case of Thailand, there was a very high risk of fatal accidents occurring in the rice sector (5/5), but also a medium risk (3/5) in the energy sector due to the electricity used. In this regard, it is useful to mention how in Thailand there is a habit of drying rice by the roadside, thus exposing farmers to a high risk of fatal accidents. Brazil, Italy and Japan, on the other hand, showed a medium risk in the energy sector, which could lead to the risk that rice is produced with inputs that could foresee fatal accidents for people. Concerning ‘Workers affected by natural disasters’, it emerged that Sri Lanka, Iran, India, China, and Bangladesh were the countries most potentially subject to natural disasters, with a medium risk for Sri Lanka, China, and Bangladesh, a high risk for India, and a very high risk for Iran (Figure 8). Indeed, these five countries have experienced significant deaths and injuries during outdoor work, including rice farming, in recent years [79,80]. Thus, there may be a greater risk in Iran, India, China, Bangladesh, and Sri Lanka than in other countries where rice workers will be involved in natural disasters during field operations. This is due to global warming, which in turn induces a higher frequency of natural disasters, which could end up severely affecting rice farmers’ livelihoods [81]. This further exacerbates the relative poverty of countries already in dire straits such as Iran, India, and Bangladesh, undermining the path towards the pursuit of SDGs 1.5, 3.9, 8.8, 11.5, 13.1 and 16.6. Finally, with regard to the last category related to stakeholder workers, trade union density was considered [69], which serves to assess how liberal and vivid trade union culture is and to what degree the right to organize freely is assured in the rice sector. Higher-density raters were basically considered as an indicator for better or more liberal association conditions.
From the S-LCA, a rather disturbing scenario emerged in which, in all countries considered (with the exception of China) the risk of workers not being able to organize in trade unions was high (4/5) and very high (5/5) (Figure 9). This means, therefore, that in the rice sector of the various countries, there could be a very significant risk that organizations bringing together agricultural workers are not directly represented in national social dialogue institutions, thus affecting SDGs 8.8, 16.3, and 16.5.

3.6.2. Stakeholders: Local Community

The first impact categories related to this stakeholder grouping were expressed by industrial water use [74], which includes the production of nitrogen fertilizers, pesticides, and other inputs for rice production. The analysis results show that industrial production could generate very low and low potential risks for all the countries considered, except for Malaysia, Italy, and China, for which there was medium risk (Figure 10).
In this context, pesticides, fertilizers, and plant protection products—even though not necessarily produced in the countries where they are consumed—could be part of the industrial production of the countries considered. Thus, there could be an average risk that these inputs negatively affect the use of water for industrial purposes. Concerning China, it should also be mentioned how in recent years, because of the massive use of chemical fertilizers, it has managed to feed more than 20% of the global population with less than 10% of the arable land [82], reaching levels of 446 kg of nutrients per hectare [83], about 3.5 times the global average. According to van Wesenbeeck et al. (2021) [84] excessive fertilizer use, especially in China, is probably due to small land sizes, poor education, and lack of confidence in science. It is also due to a lack of vision on the part of the Chinese government, which has for years conducted an inactive policy in reducing excessive fertilizer use. The other impact category considered was the level of agricultural use [74], for which it emerged that for all the countries analyzed, the level of risk was very high. However, it should be considered that in some countries, mostly in South-East Asia, such as China [35], Japan [21], and Malaysia [31], rice cultivation is able to take advantage of favorable soil and climate conditions and does not require artificial irrigation, but only annual rainfall; this is not the case in other countries where continuous water pumping is required. Thus, rice farming could exacerbate water stress levels, but only in countries with artificial irrigation and irrigation systems, such as Italy [28] and Spain [27]. Finally, the last impact category considered was ‘international migrant workers in the sector’ [69]. This category also suffers heavily from the absence of data, which were missing for Malaysia, Japan, Iran, India, and China in the agricultural sector, and Senegal, Malaysia, Japan, Italy, Iran, India, and China in the industrial sector (Table 5).
Based on the limited data available, it is possible to understand how the countries most at risk were Italy and Spain; in the former, a very high risk of conflict and discrimination could occur in the agricultural sector, and thus in rice farming. This is similar in the case of Spain, in the industrial production sector, and thus potentially in the fertilizer sector. Importantly, migration flows occur from countries in difficulty to more advanced countries, such as Spain and Italy. Therefore, a low and very low risk of conflict and discrimination in some countries in the table is very often counterbalanced by unfavorable economic situations.

3.6.3. Main observations

At this point, based on the risks and scores analyzed so far, a final score was identified across countries, calculated as the number of times a country presents medium, high, and very high risk across all impact categories. What we found was that the country that most frequently presented medium-high risks, and where rice farming could therefore induce the greatest social risks, was India, followed by Sri Lanka, Thailand, and Bangladesh (Figure 11), especially for social risks associated with workers’ conditions. In fact, India is the world’s second-largest rice producer after China, and the largest rice exporter globally along with Thailand. Specifically, India has a market share of more than 40 percent of the world rice trade, selling more than 20 varieties (including brown rice, basmati rice, jasmine rice, and Mogra rice), and its exports touched 21.5 million tons in 2021, reaching more than 150 countries globally.
It is worth noting that there may be a very high risk that some of the rice consumed globally may have been produced through child labor or forced labor, as well as sacrificing human lives. Clearly, as already widely expressed by these authors, the analysis was heavily biased by the absence of data. Furthermore, it is not possible to know with certainty the social impact of producing a specific good or service, but it might be useful to know the potential for rice production to be associated with a specific externality. In this way, the perception of risk rather than its actual realization could help stakeholders, policymakers, and other actors modify their behavior. In this regard, further studies on the social impacts of rice farming will be needed, and this study could provide a starting point.

4. Conclusions, Limitations and Future Recommendations

The 40 studies found in the literature were considered to be sufficiently in line with the objectives of this review, as they allowed the possibility of clarifying the extent to which Life Cycle Thinking has been applied in the rice sector, as well as highlighting the main research gaps and methodological aspects associated with the application of LCA. In particular, the main findings observed are:
  • Most studies used units of mass, preferring the production of 1 ton of product (in the case where impacts are directly related to the product) and the cultivation of 1 hectare of land (in the case of comparisons between several cultivation techniques). There was little tendency to consider multiple FUs, thus highlighting how little multifunctionality is considered in the rice sector. Therefore, the authors recommend the use of multiple functional units, so as to precisely highlight the multifunctional role of agriculture, and thus not only the production of basic necessities, but expanding it through the performance of other functions such as environmental, social, landscape, historical-cultural, etc. This could be particularly important in rice growing, since multifunctionality could represent an effective way of organizing production factors such as resources, and of interacting with external resources, such as the territory, thus becoming a fundamental strategic line in the development process of the rural world and territories.
  • As might be expected, there was great variation and variability in methodological choices. Although almost all of the studies examined adopted a cradle-to-farm-gate approach, the authors consider different phases and inputs, different farming practices and management, and different yields. Similarly, divergences were also noted in the choice of methodologies, depending on the publication date of the study, the nationality of the author, and the accuracy of the results. Therefore, due to different assumptions, system boundaries, and methodological choices, studies often lead to a large variability of results, sometimes making it difficult or uncertain to make conclusive evaluations and comparisons of impacts, which would inevitably be over- or underestimated, or not reflecting true value, as they might incorporate impacts from the production process of other goods. Therefore, the authors of this paper suggest for future studies to incorporate a greater alignment with past ones, in order to make the comparison as similar as possible and thus assess environmental impacts more clearly.
  • Also, environmental impacts between countries were highly dependent on their soil and climate conditions, which could greatly affect the use of inputs such as water. Based on these considerations, what we found was that Asian authors focus more on fertilizer management, while in Italy there was a strong focus on water management.
  • The scientific literature related to LCA in rice farming concerned only 12 countries globally, within which there were few studies related to specific regions or production areas, thus showing a research gap on the part of those countries that are some of the world’s largest producers, including India, Vietnam, Myanmar, and the USA. From this point of view, therefore, the authors emphasize the need for more LCA studies by these countries, and it is surprising that there are none, considering the high environmental impacts of rice farming.
  • Uncertainty analysis was only performed by a limited number of studies, even considering the fact that it is not a mandatory step. However, the authors of this study consider this phase to be particularly critical, as it could highlight how results could change based on possible improvements in certain inputs. This phase, on the other hand, was carried out by a few studies, and therefore, the authors of this study recommend a higher frequency of SA.
  • The authors’ major concern in rice farming was mainly related to the direct impacts of agricultural activities (mainly related to chemical nitrogen fertilizers) on the atmosphere and the environment. This highlights a research gap in which the least considered aspects are those related to the depletion of abiotic resources, probably because current LCA methodologies do not recognize this as an important issue. However, even considering the current period of crisis between Russia and Ukraine and the energy commodity crisis, the authors of this study also suggest that this aspect should be considered in LCA assessments, especially to address the challenge of reducing dependence on fossil fuels.
  • There was a research gap where few articles focus on organic rice farming and the promotion of organic agriculture.
  • Most of the sustainability assessments in agriculture focused on the environmental dimension, while there were few on the economic and social dimensions, thus showing how Life Cycle Thinking in agriculture is little considered, consistent with the initial objective of the study. However, precisely because the multifunctionality of agriculture is not limited to satisfying the population’s food needs, but also plays a role at an economic, social, and cultural level, a three-pillar approach to sustainable development, based on a broader LCT perspective that also considers economic and social variables, should be considered in evaluations of rice production (and agricultural production in general).
  • Based on the aforementioned research gap and on the basis of the latter consideration, a social LCA on the rice sector was conducted for countries found in the literature, the results of which show the countries for which rice farming could potentially induce medium to high social risks to be India, Sri Lanka, Thailand and Bangladesh. However, methodological shortcomings and data reliability call for further studies.
The results of the review and the findings could be of interest to rice researchers and LCA scholars as a knowledge base for future studies. In this regard, the authors of this study intend to focus especially on the multifunctionality of agriculture and rice farming, so that it can be emphasized in future research. They, therefore, recommend using holistic assessments considering not only environmental sustainability but also economic and where possible social sustainability, in a broader Life Cycle Thinking assessment, as well as, for example, the use of multiple functional units.

Supplementary Materials

The following are available online at https://www.mdpi.com/article/10.3390/agriculture13020340/s1, Table S1: FUs chosen in the studies analyzed, Table S2: System boundaries overview of the studies from different authors, Table S3: GWP of the different studies.

Author Contributions

Conceptualization, G.V.; methodology, G.V.; software, G.V.; validation, R.R.; formal analysis, R.R.; investigation, R.R.; resources, R.R.; data curation, M.R.; writing—original draft preparation, M.R.; writing—review and editing, M.R. and S.A.P.; visualization, S.A.P.; supervision, G.V.; project administration, G.V.; funding acquisition, R.R. All authors have read and agreed to the published version of the manuscript.

Funding

This research received no external funding.

Institutional Review Board Statement

Not applicable.

Data Availability Statement

All data in this paper are public records and cited within the text.

Conflicts of Interest

The authors declare no conflict of interest.

References

  1. Gouel, C.; Guimbard, H. Nutrition transition and the structure of global food demand. Am. J. Agric. Econ. 2019, 101, 383–403. [Google Scholar] [CrossRef] [Green Version]
  2. Xu, X.; Sharma, P.; Shu, S.; Lin, T.S.; Ciais, P.; Tubiello, F.N.; Smith, P.; Campbell, N.; Jain, A.K. Global greenhouse gas emissions from animal-based foods are twice those of plant-based foods. Nat. Food 2021, 2, 724–732. [Google Scholar] [CrossRef]
  3. Gani, A. Greenhouse gas emissions from the production of cereals and livestock across high-, middle- and low-income Countries. Renew. Agric. Food Syst. 2021, 37, 36–48. [Google Scholar] [CrossRef]
  4. FAO. Crop Prospects and Food Situation—Quarterly Global Report No. 4, December 2021; FAO: Rome, Italy, 2021. [Google Scholar] [CrossRef]
  5. Kirschke, S.; Bousquet, P.; Ciais, P.; Saunois, M.; Canadell, J.G.; Dlugokencky, E.J.; Bergamaschi, P.; Bergmann, D.; Blake, D.R.; Bruhwiler, L.; et al. Three decades of global methane sources and sinks. Nat. Geosci. 2013, 6, 813–823. [Google Scholar] [CrossRef] [Green Version]
  6. Su, J.; Hu, C.; Yan, X.; Jin, Y.; Chen, Z.; Guan, Q.; Wang, Y.; Zhong, D.; Jansson, C.; Wang, F.; et al. Expression of barley SUSIBA2 transcription factor yields high-starch low-Methane Rice. Nature 2015, 523, 602–606. [Google Scholar] [CrossRef] [PubMed]
  7. Singh, G.; Gupta, M.K.; Chaurasiya, S.; Sharma, V.S.; Pimenov, D.Y. Rice straw burning: A review on its global prevalence and the sustainable alternatives for its effective mitigation. Environ. Sci. Pollut. Res. 2021, 28, 32125–32155. [Google Scholar] [CrossRef] [PubMed]
  8. Ukrainczyk, N.; Koenders, E.A.B. Sustainability aspects in mass concrete. In RILEM State-of-the-Art Reports; Springer: Berlin/Heidelberg, Germany, 2019. [Google Scholar] [CrossRef]
  9. Quispe, I.; Navia, R.; Kahhat, R. Energy potential from rice husk through direct combustion and fast pyrolysis: A review. Waste Manag. 2017, 59, 200–210. [Google Scholar] [CrossRef]
  10. Roy, P.; Tokuyasu, K.; Orikasa, T.; Nakamura, N.; Shiina, T. A review of life cycle assessment (LCA) of bio-ethanol from lignocellulosic biomass. Jpn. Agric. Res. Q. 2012, 46, 41–57. [Google Scholar] [CrossRef] [Green Version]
  11. Zingale, S.; Guarnaccia, P.; Matarazzo, A.; Lagioia, G.; Ingrao, C. A systematic literature review of life cycle assessments in the durum wheat sector. Sci. Total Environ. 2022, 844, 157230. [Google Scholar] [CrossRef] [PubMed]
  12. Ding, J.Y.; Dong, L.M.; Liu, Y.F.; Sun, D.X. Application of life cycle assessment in maize planting and deep processing products. Zhongguo Huanjing Kexue/China Environ. Sci. 2021, 41, 5405–5415. [Google Scholar]
  13. Abolhasani, A.; Samali, B.; Aslani, F. Rice husk ash incorporation in calcium aluminate cement concrete: Life cycle assessment, hydration and strength development. Sustainability 2022, 14, 1012. [Google Scholar] [CrossRef]
  14. Shen, X.; Zhang, L.; Zhang, J. Ratoon rice production in central China: Environmental sustainability and food production. Sci. Total Environ. 2021, 764, 142850. [Google Scholar] [CrossRef] [PubMed]
  15. Khoshnevisan, B.; Rajaeifar, M.A.; Clark, S.; Shamahirband, S.; Anuar, N.B.; Mohd Shuib, N.L.; Gani, A. Evaluation of traditional and consolidated rice farms in Guilan Province, Iran, using life cycle assessment and fuzzy modeling. Sci. Total Environ. 2014, 481, 242–251. [Google Scholar] [CrossRef] [PubMed]
  16. Habibi, E.; Niknejad, Y.; Fallah, H.; Dastan, S.; Tari, D.B. Life cycle assessment of rice production systems in different paddy field size levels in north of Iran. Environ. Monit. Assess. 2019, 191, 202. [Google Scholar] [CrossRef] [PubMed]
  17. Dastan, S.; Ghareyazie, B.; Teixeira da Silva, J.A.; Pishgar-Komleh, S.H. Assessment of the life cycle of genetically modified and non-genetically modified rice cultivars. Arab. J. Geosci. 2020, 13, 362. [Google Scholar] [CrossRef]
  18. Rezaei, M.; Soheilifard, F.; Keshvari, A. Impact of agrochemical emission models on the environmental assessment of paddy rice production using life cycle assessment approach. Energy Sources Part A Recovery Util. Environ. Eff. 2021. [Google Scholar] [CrossRef]
  19. Morandini, N.P.; Petroudi, E.R.; Mobasser, H.R.; Dastan, S. Life Cycle Assessment of Crop Rotation Systems on Rice Cultivars in Northern Iran. Int. J. Plant Prod. 2020, 14, 531–548. [Google Scholar] [CrossRef]
  20. Houshyar, E.; Chen, B.; Chen, G.Q. Environmental impacts of rice production analyzed via social capital development: An Iranian case study with a life cycle assessment/data envelopment analysis approach. Ecol. Indic. 2019, 105, 675–687. [Google Scholar] [CrossRef]
  21. Masuda, K. Eco-efficiency assessment of intensive rice production in Japan: Joint application of life cycle assessment and data envelopment analysis. Sustainability 2019, 11, 5368. [Google Scholar] [CrossRef] [Green Version]
  22. Jimmy, A.N.; Khan, N.A.; Hossain, M.N.; Sujauddin, M. Evaluation of the environmental impacts of rice paddy production using life cycle assessment: Case study in Bangladesh. Model. Earth Syst. Environ. 2017, 3, 1691–1705. [Google Scholar] [CrossRef]
  23. Shew, A.M.; Durand-Morat, A.; Putman, B.; Nalley, L.L.; Ghosh, A. Rice intensification in Bangladesh improves economic and environmental welfare. Environ. Sci. Policy 2019, 95, 46–57. [Google Scholar] [CrossRef]
  24. Yodkhum, S.; Sampattagul, S.; Gheewala, S.H. Energy and environmental impact analysis of rice cultivation and straw management in northern Thailand. Environ. Sci. Pollut. Res. 2018, 25, 17654–17664. [Google Scholar] [CrossRef]
  25. Arunrat, N.; Wang, C.; Pumijumnong, N. Reprint of Alternative cropping systems for greenhouse gases mitigation in rice field: A case study in Phichit province of Thailand. J. Clean. Prod. 2016, 134, 547–562. [Google Scholar] [CrossRef]
  26. Abdul Rahman, M.H.; Chen, S.S.; Abdul Razak, P.R.; Abu Bakar, N.A.; Shahrun, M.S.; Zin Zawawi, N.; Muhamad Mujab, A.A.; Abdullah, F.; Jumat, F.; Kamaruzaman, R.; et al. Life cycle assessment in conventional rice farming system: Estimation of greenhouse gas emissions using cradle-to-gate approach. J. Clean. Prod. 2019, 212, 1526–1535. [Google Scholar] [CrossRef]
  27. Aguilera, E.; Guzmán, G.; Alonso, A. Greenhouse gas emissions from conventional and organic cropping systems in Spain. I. Herbaceous crops. Agron. Sustain. Dev. 2014, 35, 713–724. [Google Scholar] [CrossRef] [Green Version]
  28. Bacenetti, J.; Fusi, A.; Negri, M.; Bocchi, S.; Fiala, M. Organic production systems: Sustainability assessment of rice in Italy. Agric. Ecosyst. Environ. 2016, 225, 33–44. [Google Scholar] [CrossRef]
  29. He, X.; Qiao, Y.; Liang, L.; Knudsen, M.T.; Martin, F. Environmental life cycle assessment of long-term organic rice production in subtropical China. J. Clean. Prod. 2018, 176, 880–888. [Google Scholar] [CrossRef]
  30. Mungkung, R.; Pengthamkeerati, P.; Chaichana, R.; Watcharothai, S.; Kitpakornsanti, K.; Tapananont, S. Life Cycle Assessment of Thai organic Hom Mali rice to evaluate the climate change, water use and biodiversity impacts. J. Clean. Prod. 2018, 211, 687–694. [Google Scholar] [CrossRef]
  31. Harun, S.N.; Hanafiah, M.M.; Aziz, N.I.H.A. An LCA-Based Environmental Performance of Rice Production for Developing a Sustainable Agri-Food System in Malaysia. Environ. Manag. 2021, 67, 146–161. [Google Scholar] [CrossRef] [PubMed]
  32. Hishinuma, T.; Ono, S.; Ikeguchi, A. Scenario Analysis of Environmental Impact of Paddy Rice Farming Systems Utilizing Different Fertilizer Materials. In EcoDesign and Sustainability II: Social Perspectives and Sustainability Assessment; Springer Nature: Berlin/Heidelberg, Germany, 2021. [Google Scholar] [CrossRef]
  33. Yu, L.; Qiao, X.; Duan, H.; Zhang, Z.; Gong, L.; Li, X.; Lu, J.; Li, X. Life cycle assessment of liquid digestate application strategies for rice agri-food chain in “Zero-waste City”. Biomass-Convers. Biorefinery 2022, 12, 4389–4401. [Google Scholar] [CrossRef]
  34. Hu, N.; Liu, C.; Chen, Q.; Zhu, L. Life cycle environmental impact assessment of rice-crayfish integrated system: A case study. J. Clean. Prod. 2021, 280, 12444. [Google Scholar] [CrossRef]
  35. Chen, Y.; Liu, C.; Chen, J.; Hu, N.; Zhu, L. Evaluation on environmental consequences and sustainability of three rice-based rotation systems in Quanjiao, China by an integrated analysis of life cycle, emergy and economic assessment. J. Clean. Prod. 2021, 310, 127493. [Google Scholar] [CrossRef]
  36. Xu, Q.; Dai, L.; Gao, P.; Dou, Z. The environmental, nutritional, and economic benefits of rice-aquaculture animal coculture in China. Energy 2022, 249, 123723. [Google Scholar] [CrossRef]
  37. Coltro, L.; Marton, L.F.M.; Pilecco, F.P.; Pilecco, A.C.; Mattei, L.F. Environmental profile of rice production in Southern Brazil: A comparison between irrigated and subsurface drip irrigated cropping systems. J. Clean. Prod. 2017, 153, 491–505. [Google Scholar] [CrossRef]
  38. Zoli, M.; Paleari, L.; Confalonieri, R.; Bacenetti, J. Setting-up of different water managements as mitigation strategy of the environmental impact of paddy rice. Sci. Total Environ. 2021, 799, 149365. [Google Scholar] [CrossRef]
  39. Nunes, F.A.; Seferin, M.; Maciel, V.G.; Ayub, M.A.Z. Life Cycle Assessment comparison between brow parboiled rice produced under organic and minimal tillage cultivation systems. J. Clean. Prod. 2017, 161, 95–104. [Google Scholar] [CrossRef]
  40. Li, F.; Xiang, M.; Liu, S.; Lei, K.; Shi, Z.; Yang, J.; Li, Y. Life cycle assessment and fertilization scheme optimization of paddy field crops in South China. J. Clean. Prod. 2021, 325, 129339. [Google Scholar] [CrossRef]
  41. Lin, L.; Yanju, S.; Ying, X.; Zhisheng, Z.; Bin, W.; You, L.; Zichuan, S.; Haoran, Z.; Ming, Z.; Chengfang, L.; et al. Comparing rice production systems in China: Economic output and carbon footprint. Sci. Total. Environ. 2021, 791, 147890. [Google Scholar] [CrossRef]
  42. Ariyarathna, S.; Siriwardhana, H.; Danthurebandara, M. Life cycle assessment of rice processing in Sri Lanka: Modern and conventional processing. In Proceedings of the 2nd International Moratuwa Engineering Research Conference, MERCon, Moratuwa, Sri Lanka, 5–6 April 2016. [Google Scholar] [CrossRef]
  43. Huijbregts, M.A.J.; Steinmann, Z.J.N.; Elshout, P.M.F.; Stam, G.; Verones, F.; Vieira, M.; Zijp, M.; Hollander, A.; van Zelm, R. ReCiPe2016: A harmonised life cycle impact assessment method at midpoint and endpoint level. Int. J. Life Cycle Assess. 2017, 22, 138–147. [Google Scholar] [CrossRef]
  44. Lükewille, A.; Alewell, C. Acidification. Encycl. Ecol. 2008, 2, 233–241. [Google Scholar] [CrossRef]
  45. Borrion, A.L.; Khraisheh, M.; Benyahia, F. Environmental life cycle impact assessment of Gas-to-Liquid processes. In Proceedings of the 3rd Gas Processing Symposium; Elsevier: Amsterdam, The Netherlands, 2012; pp. 71–77. [Google Scholar] [CrossRef]
  46. Yang, Y. Life cycle freshwater ecotoxicity, human health cancer, and noncancer impacts of corn ethanol and gasoline in the U.S. J. Clean. Prod. 2013, 53, 149–157. [Google Scholar] [CrossRef]
  47. Food and Agriculture Organization Corporate Statistical Database (Faostat). Crops and Livestock Products, Rice, Paddy. Global Production. Available online: https://www.fao.org/faostat/en/#data/QCL (accessed on 14 December 2022).
  48. Yuan, S.; Linquist, B.A.; Wilson, L.T.; Cassman, K.G.; Stuart, A.M.; Pede, V.; Miro, B.; Saito, K.; Agustiani, N.; Aristya, V.E.; et al. Sustainable intensification for a larger global rice bowl. Nat. Commun. 2021, 12, 7163. [Google Scholar] [CrossRef]
  49. Arslan, S.; Aybek, A. Particulate Matter Exposure in Agriculture. In Air Pollution—A Comprehensive Perspective; BoD—Books on Demand: Norderstedt, Germany, 2012. [Google Scholar] [CrossRef] [Green Version]
  50. U.S. Department of Agriculture (USDA). Available online: https://ipad.fas.usda.gov/Countrysummary/Default.aspx?id=IR&crop=Rice (accessed on 28 July 2022).
  51. Selvaraj, M.G.; Vergara, A.; Ruiz, H.; Safari, N.; Elayabalan, S.; Ocimati, W.; Blomme, G. AI-powered banana diseases and pest detection. Plant Methods 2019, 15, 92. [Google Scholar] [CrossRef] [Green Version]
  52. Council Directive 91/676/EEC of 12 December 1991 Concerning the Protection of Waters against Pollution Caused by Nitrates from Agricultural Sources. Available online: https://eur-lex.europa.eu/legal-content/IT/TXT/?uri=celex:31991L0676 (accessed on 25 May 2022).
  53. Pichery, C. Sensitivity Analysis. In Encyclopedia of Toxicology: Third Edition; Academic Press: Cambridge, MA, USA, 2014; pp. 236–237. [Google Scholar] [CrossRef]
  54. Shafie, S.M.; Masjuki, H.H.; Mahlia, T.M.I. Life cycle assessment of rice straw-based power generation in Malaysia. Energy 2014, 70, 401–410. [Google Scholar] [CrossRef]
  55. Fusi, A.; Bacenetti, J.; González-García, S.; Vercesi, A.; Bocchi, S.; Fiala, M. Environmental profile of paddy rice cultivation with different straw management. Sci. Total. Environ. 2014, 494–495, 119–128. [Google Scholar] [CrossRef]
  56. ISO 15686-5; Buildings and Constructed Assets—Service Life Planning—Part 5: Life-Cycle Costing. International Organization for Standardization (ISO): Geneva, Switzerland, 2017.
  57. Escobar, N.; Bautista, I.; Peña, N.; Fenollosa, M.; Osca, J.; Sanjuán, N. Life Cycle Thinking for the environmental and financial assessment of rice management systems in the Senegal River Valley. J. Environ. Manag. 2022, 310, 114722. [Google Scholar] [CrossRef]
  58. Tragnone, B.M.; D’Eusanio, M.; Petti, L. The count of what counts in the agri-food Social Life Cycle Assessment. J. Clean. Prod. 2022, 354, 131624. [Google Scholar] [CrossRef]
  59. Wegener, D.; Finkbeiner, M.; Holst, J.; Olsen, S.I.; Walachowicz, F. Improving Energy Efficiency in Industrial Solutions—Walk the Talk. In Proceedings of the Risø International Energy Conference, Roskilde, Denmark, 10–12 May 2011; Volume 1. [Google Scholar]
  60. UNEP/SETAC. Guidelines for Social Life Cycle Assessment of Products; UNEP/SETAC: Nairobi, Kenya, 2009; pp. 1–104. ISBN 978-92-807-3021-0. Available online: https://wedocs.unep.org/bitstream/handle/20.500.11822/7912/-Guidelines%20for%20Social%20Life%20Cycle%20Assessment%20of%20Products-20094102.pdf?sequence=3&amp%3BisAllowed= (accessed on 12 January 2023).
  61. Wei, J.; Cui, J.; Xu, Y.; Li, J.; Lei, X.; Gao, W.; Chen, Y. Social Life Cycle Assessment of Major Staple Grain Crops in China. Agriculture 2022, 12, 535. [Google Scholar] [CrossRef]
  62. Prasara-A, J.; Gheewala, S.H. Social Life Cycle Assessment of Agricultural Products: Experiences on Rice, Sugarcane and Cassava in Thailand. In Environmental Footprints and Eco-Design of Products and Processes; Springer: Berlin/Heidelberg, Germany, 2019. [Google Scholar] [CrossRef]
  63. Phantha, C.; Jittima Prasara, A.; Boonkum, P.; Gheewala, S.H. Social sustainability of conventional and organic rice farming in north-eastern Thailand. Int. J. Glob. Environ. Issues 2021, 20, 42. [Google Scholar] [CrossRef]
  64. Petti, L.; Serreli, M.; Di Cesare, S. Systematic literature review in social life cycle assessment. Int. J. Life Cycle Assess. 2018, 23, 422–431. [Google Scholar] [CrossRef]
  65. Dubois-Iorgulescu, A.-M.; Karin, A.; Bernstad Saraiva, E.; Valle, R.; Rodrigues, L.M. How to define the system in social life cycle assessments? A critical review of the state of the art and identification of needed developments. Int. J. Life Cycle Assess. 2018, 23, 507–518. [Google Scholar] [CrossRef]
  66. Macombe, C.; Loeillet, D.; Gillet, C. Extended community of peers and robustness of social LCA. Int. J. Life Cycle Assess. 2018, 23, 492–506. [Google Scholar] [CrossRef] [Green Version]
  67. Huertas-Valdivia, I.; Ferrari, A.M.; Settembre-Blundo, D.; García-Muiña, F.E. Social Life-Cycle Assessment: A Review by Bibliometric Analysis. Sustainability 2020, 12, 6211. [Google Scholar] [CrossRef]
  68. Eisfeldt, F.; Ciroth, A. PSILCA—A Product Social Impact Life Cycle Assessment Database. Documentation. 2020. Available online: https://psilca.net/wp-content/uploads/2020/06/PSILCA_documentation_v3.pdf (accessed on 13 December 2022).
  69. International Labour Organization (ILO). Global Estimates of Child Labour: Results and Trends, 2012–2016, Geneva, 11. 2017. Available online: https://www.ilo.org/wcmsp5/groups/public/---dgreports/---dcomm/documents/publication/wcms_575499.pdf (accessed on 8 November 2022).
  70. U.S. Department of Labor’s (USDOL). 2020 List of Goods Produced by Child Labor or Forced Labor. 2020. Available online: https://www.dol.gov/sites/dolgov/files/ILAB/child_labor_reports/tda2019/2020_TVPRA_List_Online_Final.pdf (accessed on 1 December 2022).
  71. Global Slavery Index (GSI). 2018. Available online: https://www.globalslaveryindex.org/2018/data/maps/#prevalence (accessed on 1 December 2022).
  72. Wageindicator.org. 2022. Available online: https://wageindicator.org/salary/minimum-wage/minimum-wages-per-country (accessed on 1 December 2022).
  73. EM-DAT, the International Disaster Database. 2022. Available online: https://public.emdat.be/mapping (accessed on 5 December 2022).
  74. AQUASTAT—FAO’s Global Information System on Water and Agriculture. 2021. Available online: https://www.fao.org/aquastat/en/ (accessed on 5 December 2022).
  75. Sala, S.; Vasta, A.; Mancini, L.; Dewulf, J.; Rosenbaum, E. Social Life Cycle Assessment: State of the Art and Challenges for Supporting Product Policies; EUR 27624; JRC99101; Publications Office of the European Union: Luxembourg, 2015. [Google Scholar]
  76. Chica Arellano, F. Lavoro minorile in agricoltura. Comunità internazionale e Santa Sede in favore dello slancio gioioso della speranza. Isidorianum 2020, 29, 127–144. [Google Scholar] [CrossRef]
  77. India Committee of the Netherlands (ICN). 2016, Fabric of Slavery, ICN, p. 3. Available online: http://www.indianet.nl/pdf/FabricOfSlavery.pdf (accessed on 15 December 2022).
  78. FAO. FAO Policy on Gender Equality 2020–2030. Rome. 2020. Available online: https://www.fao.org/3/cb1583en/cb1583en.pdf (accessed on 10 December 2022).
  79. Asamani, L. Work-Related Health and Safety Challenges of Rice Irrigation Farmworkers. Eur. J. Bus. Manag. Res. 2022, 7, 292–299. [Google Scholar] [CrossRef]
  80. Yuen, K.W.; Switzer, A.D.; Teng, P.P.S.; Lee, J.S.H. Assessing the impacts of tropical cyclones on rice production in Bangladesh, Myanmar, Philippines, and Vietnam. Nat. Hazards Earth Syst. Sci. 2022. [Google Scholar] [CrossRef]
  81. Li, X.; Zheng, J.; Lu, H. A Study on the Impact of Natural Disasters on Farmers’ Relative Poverty. Front. Environ. Sci. 2022, 10, 744. [Google Scholar] [CrossRef]
  82. Sun, Y.; Hu, R.; Zhang, C. Does the adoption of complex fertilizers contribute to fertilizer overuse? Evidence from rice production in China. J. Clean. Prod. 2019, 219, 677–685. [Google Scholar] [CrossRef]
  83. NBSC. China Statistical Yearbook; National Bureau of Statistics of China: Beijing, China, 2016.
  84. van Wesenbeeck, C.F.A.; Keyzer, M.A.; van Veen, W.C.M.; Qiu, H. Can China’s overuse of fertilizer be reduced without threatening food security and farm incomes? Agric. Syst. 2021, 190, 103093. [Google Scholar] [CrossRef]
Figure 1. Stages of selecting articles for the literature review (* November 2022).
Agriculture 13 00340 g001
Figure 2. Distribution of scientific production on the applications of LCA in the rice sector.
Agriculture 13 00340 g002
Figure 3. Most used impact categories by authors.
Agriculture 13 00340 g003
Figure 4. Most used impact categories in LCA studies–Rice.
Agriculture 13 00340 g004
Figure 5. Risk of child labor in the rice sector [69].
Agriculture 13 00340 g005
Figure 6. Risk of forced labor in rice production in that country [70,71]. (A) expressed according to goods produced by forced labor (Number of goods in the sector). (B) expressed according to frequency of forced labor (Cases per 1000 inhabitants in the country).
Agriculture 13 00340 g006
Figure 7. Risk that the minimum wage is too low to permit a dignified life [72].
Agriculture 13 00340 g007
Figure 8. Health and safety: Risk for workers to be affected by natural disasters [73].
Agriculture 13 00340 g008
Figure 9. Workers right: Risk that employees are not allowed to organize in trade unions [69].
Agriculture 13 00340 g009
Figure 10. Risk that agriculture and industry account for a large share of water withdrawal [74].
Agriculture 13 00340 g010
Figure 11. Countries with the highest risk of social impacts in rice production chain.
Agriculture 13 00340 g011
Table 1. S-LCA results for rice production in the countries considered. BAN = Bangladesh; BRA = Brazil; CHI = China; IN = India; IRAN = Iran; ITA = Italy; JAP = Japan; MAL = Malaysia; SEN = Senegal; ES = Spain; THA = Thailand; SRI = Sri Lanka. (Sectors: A = Agriculture, I = Industry, ES = Energy sources, ABR = Abiotic Resource).
CATEGORIESSUBCATEGORIESSECTORSCOUNTRIESSOURCE
BANBRACHIINIRANITAJAPMALSENESTHASRI
WorkersChild Labor% of children in employment ages 1–17-7%1%8%20%3%1%3%3%21%1%1%0.4%[69]
Forced LaborNumber of goods produced by forced labor-221110000000[70]
Cases × 1000 inhabitants in the country-3.71.792.776.116.22.430.296.912.872.278.82.12[71]
Fair
salary
Minimum wage, per month ($ and score) $11$192$316$125n.a.n.a.n.a.$270$65$1000$250$34[72]
-4.671.281.410.6n.a.n.a.n.a.1.211.640.861.591.87
Sector average wage, per month (score)A6.521.28n.a.0.8n.a.n.a.n.a.n.a.2.241.61.181.14
I9.582.35n.a.1.27n.a.n.a.n.a.n.a.1.982.992.851.31
ES+
ABR
14.63.3n.a.1.3n.a.n.a.n.a.n.a.2.7n.a.4.20.8
Working timeHours of work per employee, per weekA3838394541413540294134n.a.[69]
I5539485445383945433845n.a.
AS4943435747383944n.a.n.a.39n.a.
ABRn.a.41465448384246483945n.a.
DiscriminationGender wage gap (%)A8%4%n.a.51%n.a.26%n.a.n.a.33%5%n.a.38%
I18%1%n.a.32%n.a.25%n.a.n.a.35%5%n.a.38%
ES10%10%n.a.31%n.a.n.a.n.a.n.a.n.a.n.a.n.a.n.a.
ABRn.a.10%n.a.n.a.n.a.n.a.n.a.n.a.20%n.a.n.a.9%
Health and
Safety
Fatal accidents at the workplace (Cases per 100,000 employees in the sector)An.a.12n.a.n.a.n.a.11.311.16.7n.a.8.446.80.1
In.a.8.5n.a.n.a.n.a.2.31.23.3n.a.3.230.9
ESn.a.27.2n.a.n.a.n.a.6.2n.a.1.9n.a.n.a.15.214
ABRn.a.21.2n.a.n.a.n.a.22.440n.a.n.a.18.67.310.4
Workers affected by natural disasters (%)-4%0.8%4%6%18%0.03%0.3%0.7%0.2%0.01%4%3%[73]
Workers RightTrade union density (%)-12%13%44%20%n.a.33%17%9%7%13%3%10%[69]
Local communityAccess to material resourcesLevel of industrial
water use (%)
-2.5%14.0%22.3%2.2%1.1%22.5%13.8%29%0.1%19.4%4.9%6.4%[74]
Lever of agriculture
water use (%)
-87%61%64.4%90%92%49.7%67.7%45%91%65.3%90%87%
MigrationInternational migrant workers in the sector (%)A0.13%0.15%n.a.n.a.n.a.21.6%n.a.n.a.0.9%0.53%1.21%n.a.[69]
I0.05%0.55%n.a.n.a.n.a.15.2%n.a.n.a.0.9%14.5%6.66%n.a.
Table 2. Working hours: Risk of improper working hours (score 1 = very low risk, 5 = very high risk, n.a. = not available) [69].
BANBRACHIINIRANITAJAPMALSENESTHAISRI
Agriculture33322232423n.a.
Industry52232332232n.a.
Energy sources52242332n.a.33n.a.
Abiotic
resources
52232322232n.a.
Table 3. Discrimination: risk of inequal wage (score 1 = very low risk, 5 = very high risk, n.a. = not available) [69].
BANBRACHIINIRANITAJAPMALSENESTHAISRI
Agriculture21n.a.5n.a.45152n.a.5
Manufacturing31n.a.n.a.n.a.n.a.n.a.n.a.54n.a.5
Energy sources21n.a.n.a.n.a.n.a.n.a.n.a.4n.a.n.a.n.a.
Abiotic resourcesn.a.3n.a.n.a.n.a.n.a.n.a.n.a.n.a.n.a.n.a.n.a.
Table 4. Health and safety: risk for workers to be affected by fatal accidents (in cells the score, 1 = very low risk, 5 = very high risk, n.a. = not available) [69].
BANBRACHIINIRANITAJAPMALSENESTHASRI
Agriculturen.a.2n.a.n.a.n.a.221n.a.151
Industryn.a.1n.a.n.a.n.a.111n.a.111
Energyn.a.3n.a.n.a.n.a.2n.a.1n.a.131
Dieseln.a.3n.a.n.a.n.a.35n.a.n.a.312
Table 5. Risk of discrimination due to the large share of migrant workers in the rice sector [69].
BANBRACHIINIRANITAJAPMALSENESTHASRI
Agriculture12n.a.n.a.n.a.5n.a.n.a.222n.a.
Manufacturing12n.a.n.a.n.a.n.a.n.a.n.a.n.a.53n.a.
Disclaimer/Publisher’s Note: The statements, opinions and data contained in all publications are solely those of the individual author(s) and contributor(s) and not of MDPI and/or the editor(s). MDPI and/or the editor(s) disclaim responsibility for any injury to people or property resulting from any ideas, methods, instructions or products referred to in the content.

