Article

Modelling the Geographical Distribution Pattern of Apple Trees on the Loess Plateau, China

1
School of Humanities and Social Sciences, Jiangsu University of Science and Technology, Zhenjiang 212000, China
2
Institute of Soil and Water Conservation, Chinese Academy of Sciences and Ministry of Water Resources, Xianyang 712100, China
3
College of Grassland Agriculture, Northwest Agriculture and Forestry University, Xianyang 712100, China
4
School of Surveying and Land Information Engineering, Henan Polytechnic University, Jiaozuo 454000, China
5
Institute of Soil and Water Conservation, Northwest Agriculture and Forestry University, Xianyang 712100, China
*
Author to whom correspondence should be addressed.
Agriculture 2023, 13(2), 291; https://doi.org/10.3390/agriculture13020291
Submission received: 23 October 2022 / Revised: 18 January 2023 / Accepted: 23 January 2023 / Published: 25 January 2023
(This article belongs to the Special Issue Modeling the Adaptations of Agricultural Production to Climate Change)

Abstract

:
The Loess Plateau, known for its fragile ecosystems, is one of the traditional apple-producing regions in China. Although some management measures are needed to enhance sustainable agriculture in response to the rising pressure of climate change, the geographic distribution of apple trees considering multiple variables has not been considered. In this study, we used three software (the maximum entropy model, IDRISI, and ArcGIS) to simulate the potential distribution of suitable habitats and range shifts of apple trees in the near present and near future (i.e., the 2030s and the 2050s) under two climate scenarios (the Shared Socioeconomic Pathways (SSP)1-26 and SSP5-85), while taking a variety of environmental factors into account (e.g., temperature, precipitation, and terrain). After optimization, the class unsuitable habitat (CUH) changed the potential distribution pattern of apple trees on the Loess Plateau. Currently, the areas of lowly suitable habitat (LSH), moderately suitable habitat (MSH), highly suitable habitat (HSH), and CUH were 7.66 × 10⁴, 2.80 × 10⁴, 0.23 × 10⁴, and 18.05 × 10⁴ km2, respectively. Compared to the centroid estimated under the climate of 1970–2000, the suitability range of apple trees was displaced to the northwest in both the 2030s and the 2050s in SSP5-85 (i.e., 63.88~81.30 km), causing a larger displacement in distance than SSP1-26 (i.e., 40.05~50.32 km). This study demonstrates the possible changes in the spatial distribution of apple trees on the Loess Plateau in the near future and may provide a strong basis for future policy making.

1. Introduction

The Loess Plateau is located in the arid and semi-arid regions of Northwest China. Its world-famous loess deposition, soil erosion, and huge spatial heterogeneity in precipitation have resulted in a unique and fragile plateau ecosystem [1]. In the 20th century, soil degradation and dust storms were further aggravated by the unsustainable land use practices of local farmers and herdsmen (overgrazing and farmland reclamation, etc.) as a result of their intense struggle to survive [2,3,4]. Additionally, since the 1970s, after the implementation of several ecological improvement projects (e.g., the Grain for Green Project, the Natural Forest Project [5]), soil erosion in this region has been significantly reduced [6], and a large amount of farmland has been transformed into forests and grasslands [7]. Thus, the ecological environment has been significantly improved, and the economic forestry and fruit industries have rapidly developed [8,9]. The primary responsibilities of the Chinese government in this century are gradually turning to maintaining the work of soil and water conservation [10], increasing ecosystem biodiversity [11], raising incomes of local inhabitants [12], and developing sustainable ecological agriculture [6]. Global apple consumption is increasing annually [13], and the Loess Plateau has become the largest apple production area in China and even in the world [14]. As the main income-generating economic fruit in the region, the development of the apple industry is of great significance to reduce poverty [14,15]. The rational planning of cultivation patterns, as the cornerstone of realizing the healthy and stable development of the apple industry [16], plays an important role in achieving the long-term goal of sustainable development in the Loess Plateau. However, few studies have focused on the suitable habitats (SH) of this economic tree in this region, particularly in the context of climate change [17].
The continuous pressure of climate change and rapid social development affect the structure and function of global ecosystems [18], and are changing the distribution range of species to a great extent [19]. Throughout the past 100 years, the global average temperature has risen by about 0.85 °C [20], and is expected to rise by 1.5–2.1 °C by 2050 [21]. Until now, CO2 concentrations have increased from 280 parts per million (ppm, the pre-industrial level) to around 408 ppm, and may reach 560 ppm (double pre-industrial levels) by 2060 without actions to reduce emissions [22]. Due to the adaption of the natural environment to human activities, the land use and cover change (LUCC) has become the most obvious alteration in natural ecological environments [23,24], especially in fragile ecosystems close to the range of human activities [25,26]. However, the LUCC may exacerbate climate change, limit human activities [18], and threaten global biodiversity [21].
Plant pathogens are generally ignored in the research and planning of the SH of economic trees [27] despite the fact that they have a powerful effect on the distribution of their host plants [28]. Valsa mali, a necrotrophic fungus belonging to ascomycete [29], causes the apple valsa canker (AVC). AVC is a serious disease affecting the quality and yields of apples [30,31], and seriously restricts the sustainable development of the apple industry in the Loess Plateau [32,33]. At the same time, relevant policies [34] and other biological factors [29] also have important impacts on the apple cultivation areas [18,19]. However, to the best of our knowledge, studies mainly focus on the geographic distribution of apple trees relying on environmental factors only (e.g., temperature, precipitation, terrain), while no attempts have been performed for coupling this with land use types and plant pathogens. Without considering these multiple related factors, the persuasiveness and accuracy of simulation results may be seriously affected.
The development of computer technology has promoted a variety of species distribution models (SDMs) [35,36]. These SDMs mainly model and calculate the distribution of species with georeferenced presence/absence data and their interrelated environmental layers (e.g., meteorological data, terrain data, and social data) [37,38]. The maximum entropy model (MaxEnt), a program that relies on continuous/classified environmental variables and associated occurrence data, produces highly precise predictions [38,39,40,41,42]. It should be noted that many environmental factors that are difficult to collect and quantify (e.g., impacts from the related biological species and policies such as land-use planning) are not easily taken into account by MaxEnt [29]. Hence, in order to better mimic the distribution of species, it required a technique to discern the effects of interactions between species and variables that are difficult to quantify.
In this study, we simulate the SH of apple trees while taking relevant policies and plant pathogens into account in the context of climate change. To reach this goal, we: (1) independently simulated the distribution pattern of an economically important plant species (i.e., Malus pumila Mill.) and its pathogen (i.e., V. mali); (2) evaluated and selected the limits of ranges of abiotic factors (i.e., LUCC) and biographic factors (i.e., V. mali) that influence the distribution pattern of an economically important plant species; (3) optimized the SH of apple trees by integrating the effects of those abiotic and biotic factors. The purpose of this study was to better understand how apple trees on the Loess Plateau will respond to climate change in the near future, and to offer a theoretical foundation for apple cultivation, structural adjustment, and policy-making in the connected businesses in this region.

2. Materials and Methods

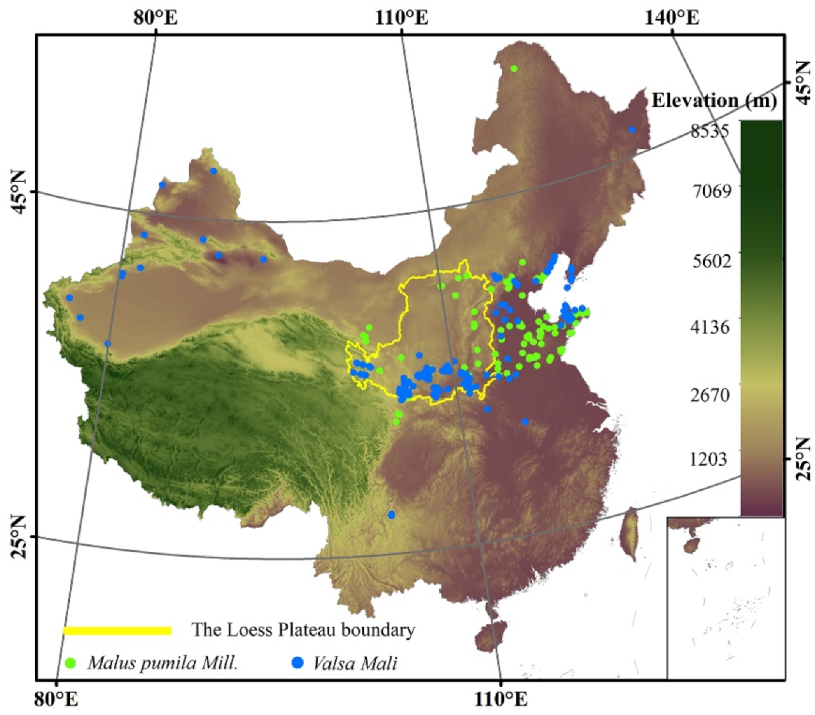
2.1. Collection of Occurrence Data of Species and Environmental Variables

In this study, the occurrence data of apple trees and its plant pathogen (V. mali) in the northern area of the Yangtze River (China) were collected with field surveys, published articles, and online databases (for details see: [17,29]). In total, we collected 260 georeferenced present-only records on apple trees and 211 georeferenced present-only records on V. mali.
In the Coupled Model Intercomparison Projects phase 6 (CMIP6), 49 different modelling groups from different countries contributed around 100 unique climate models to represent the change in the future climate. In this initiative, the Representative Concentration Pathways used in phase 5 have been replaced by the new Shared Socioeconomic Pathways (SSP) that have approaches to different radiative forcing levels that depend on the emissions of greenhouse gases (SSP1-26: 2.6 wm−2, SSP2-45: 4.5 wm−2, SSP3-70: 7.0 wm−2, and SSP5-85: 8.5 wm−2), which in turn lead to increasing warming [43,44]. In terms of intergovernmental energy conservation and emissions reduction, SSP1-26 offers the most optimistic scenario for achieving the goal of limiting the temperature rise to 2 °C by 2100 [43], whereas SSP5-85 represents the worst case. In this study, two extreme SSPs (i.e., SSP1-26 and SSP5-85) were chosen to depict the future distribution pattern of M. pumila on the Loess Plateau. We chose the climate system model of the Beijing Climate Center (BCC-CSM2-MR) as the source data for this study as it has been widely utilized in previous studies [45,46] in East Asia. We downloaded nineteen bioclimate layers (i.e., bio1-bio19) with a spatial resolution of 2.5 arc-min from the WorldClim (www.worldclim.org/, accessed on 18 May 2020) [47]. These geodatabases include the climatic conditions of the near to present period (period 1970–2000) and climatic conditions estimated for the near future (results of simulations for period 2021–2040 and period 2041–2060). In this article, we use the 2030s and the 2050s for referring to the time periods 2021–2040 and 2041–2060 respectively. Moreover, we downloaded one elevation datum (1 km) from the RESDC (http://www.resdc.cn/, accessed on 19 May 2020), three soil texture data (clay, sand, and silt, 1 km), and one soil type datum (1 km) from the FAO (www.fao.org/soils-portal/, accessed on 11 May 2020). Including the bioclimatic layers, we prepared a total of 27 variables for MaxEnt: bioclimatic layers (19: bio1–bio19), terrain data (4: one elevation datum and its three derived terrain variables: aspect, curvature, and slope), and soil data (4: three soil texture data and one soil type datum) to MaxEnt (Table 1).

2.2. The Screening and Pre-Processing of Data

Model overfitting can be decreased by variable screening [48,49]. We first removed duplicated records [21] from the occurrence data of the species. The occurrence data were then evaluated in compliance with the requirements of the subsequent study simulations. Considering the geographic location of the Loess Plateau, we transformed the environmental layers with a resolution of 2.5 arc-min into the Asia North Albers Equal Area Conic (ANAEAC) with the resolution of ~4857 m. We then filtered the species occurrence data with a boundary distance of 5000 m to ensure that each grid involved in the model simulation at most covers a single species occurrence point. We obtained 158 points for V. mali and 107 points for apple trees (Figure 1) after filtering species occurrence data using the SDMs toolbox (version 2.4) of ArcGIS 10.2 (ESRI, Redlands, CA, USA) (more details see [17,29]). By using the toolbox of ArcGIS to further analyse the elevation layer, we obtained three more terrain factors: aspect, curvature, and slope. To avoid multicollinearity [50,51], we conducted a correlation analysis [48] on 27 variables of bioclimatic layers, terrain data, and soil data. We retained the Annual Mean Temperature (bio1) and Annual Mean Precipitation (bio12), and eliminated other bioclimatic variables with a correlation coefficient value greater than 0.8 (Table 1, see details in [29]). Based on the physiological growth requirements of apple trees [50] and the incidence rate trends of V. mali [32], we added six extra bioclimatic variables and finally obtained eight bioclimatic variables for MaxEnt (Table 1). This study also made the assumption that these terrain variables will not change in the near future due to the long-term stability of the terrain [48]. We then resampled the environmental variables (i.e., terrain data and soil data) into a spatial resolution of 2.5 arc-min and converted all the layers used in this study into WGS1984 (the geographic coordinate system) and ANAEAC (the projection coordinate system) to ensure that all software did not need to consider coordinate system transformation.

2.3. Model Processing

2.3.1. Processing with the Binary Maps of MaxEnt and Land Use Data

The self-evaluation capability facilites of MaxEnt [18,52] were used to assess the accuracy of the resulting models, including receiver operating characteristic (ROC) curves and the area under these curves (AUC). The AUC values range between 0 and 1, with higher AUC values indicating more accurate simulation results [53,54]. When the AUC value is more than 0.8, the result is good; when it is higher than 0.9, the result is excellent [38]. In this study, we selected the automatic mode, setting 10,000 as the maximum number of background points, and choosing a random seed for MaxEnt simulation. For the occurrence data of V. mali and M. pumila, we randomly selected 30% of them as test data to assess the accuracy of the model, while the remaining 70% were used to calibrate it. Five bootstrap replications (exported in ASCII) were performed and the simulation results were exported in ArcGIS for further analysis.
The selection of threshold values could improve the stability of the MaxEnt model [55]. In this study, we initially averaged the floating-point values of the acquired simulation results in order to discern between the presence and absence of species in the distribution maps. Then, the species floating matrix was divided into two types: the unsuitable part and the suitable part. For apple trees, M. pumila, the maximized sensitivity and specificity value (maxss, 0.2385) was set as the threshold [16,20,56]. The part with a floating value greater than the threshold was the suitable portion, and the remainder was the unsuitable portion. The suitable portion was then divided into three classes by occurrence probability values of 0.4 and 0.6 in lowly suitable, moderately suitable, and highly suitable habitats. For V. mali, the major plant pathogen of the AVC, the threshold was changed from its maxss value (0.160) to a new threshold (i.e., 80% of the floating value of the grid map) in order to establish the high-risk habitat of pathogen (HRHP). In other words, the HRHP only included values larger than 80% of the floating value. Additionally, the centroid of habitats was used as an essential metric to measure the range variations of the SH [57]. Hence, in this study, we also measured the centroids of apple trees in different climate conditions and drew their distribution maps with the help of the ArcGIS toolbox.
Land use data from various sources often have varying resolutions and translation criteria. Based on the land resources categorization method of the Chinese Academy of Sciences, this study reclassified the land use data from the European Aeronautics and Space Administration (given in Table S1) into seven categories (i.e., cropland, forest, grassland, mosaic area, bare area, built-up area, and water area). To create the plausible land use distribution maps for the near future, we first estimated the land use transfer matrix and transfer probability using the Markov model of IDRISI 17.0 (Clark Labs, Clark University, Worcester, MA, USA) between 2000 and 2010. The CA-Markov model of IDRISI was then utilized to complete the prediction of land use in 2030 and 2050 with a 10-year intermittent iteration, using the land use map of the starting period (years 2000 and 2010) and the newly established land use transfer and probability matrix.

2.3.2. Build the Mask Layer and Optimize the Suitable Habitats of Apple Trees

Unreasonable fruit tree management (e.g., pruning, [58]) and precipitation are major transmission pathways of V. mali [29]. In light of the size of orchards and the effect distance of V. mali, experts recommended establishing a buffer space for the HRHP with a distance of 300 m in order to avoid the AVC. With the help of the ArcGIS toolbox, we resampled the floating-point maps into about 323 m and screened the HRHP. We then added a high-risk buffer for the HRHP by setting the grids adjacent to the HRHP to be HRHP. We reclassified all values inside the high-risk buffer range in the ArcGIS toolbox, regardless of whether their attributes had previously been classified as high-risk (Figure S2).
In order to optimize the layout of urban and rural structures and promote the verification and rectification of permanent basic farmland (PBF), the Chinese government conducted their third national land survey (from 2017 to 2021) and designated 1.28 × 10⁶ km2 of national cultivated land (including 1.03 × 10⁶ km2 of actual PBF; see http://www.gov.cn/, accessed on 27 March 2021). Lacking current accurate digital distribution maps of PBF, this study initially used the land use map of 2015 as its research object and made the assumption that all farmland on the Loess Plateau was PBF. After that, the PBF of 2015 was transformed into a mask layer with a permanent transfer barrier. We finally produced the digital PBF maps for 2030 and 2050 (Figure S3) by overlapping the mask map with the predicted land use maps of the near future. Due to their unsuitability for the large-scale development of apple orchards, in this study, the built-up areas, water areas, and PBF were all reclassified as unsuitable land use types (ULUT, Figure S3).
To optimize the distribution pattern of apple trees under the two near future climate scenarios, we overlaid the ULUT mask, the HRHP mask, and the distribution map of apple trees. If the region matched at least one ULUT and HRHP, we defined it as an unsuitable habitat (CUH) for the cultivation of apple trees. Thereafter, the optimized maps were divided into the following five classes: unsuitable habitat (USH), lowly suitable habitat (LSH), moderately suitable habitat (MSH), highly suitable habitat (HSH), and CUH. Despite the fact that neither the USH nor the CUH were suitable for growing apple trees, there were important differences: the USHs were divided based on the outputs of the original model simulation, while the CUHs were split according to the distribution of the ULUT and HRHP.

3. Results

3.1. Model Robustness and the Independent Distribution Patterns of Apple Trees, ULUT and HRHP

Throughout the simulations, MaxEnt provided excellent predictions, with average AUC values of the apple trees (i.e., M. pumila) and their vital pathogen (i.e., V. mali) of 0.946 ± 0.02 and 0.965 ± 0.013 (mean ± SD), respectively. Without considering the effects of the ULUT and HRHP, the spatial distribution patterns of apple trees indicated that the MSH and HSH were mainly distributed in the south and southeast of the Loess Plateau, and the HSH increased in the west under both SSP1-26 and SSP5-85 in the 2030s and the 2050s (Figure S1). In all time periods (i.e., 1970–2000, the 2030s, and the 2050s), V. mali was mostly located in the central and southern Loess Plateau (Figure S2). The most noticeable changes in the modelling of future land use were the decrease in forests and the increase in built-up areas from the 1970–2000 period to the 2030s and the 2050s (Figure S3a–c). For apple trees, the ULUT was mainly dispersed in the south and southeast of the Loess Plateau in the three periods, and increased in the north from the 1970–2000 period to both the 2030s and the 2050s (Figure S3d,e).

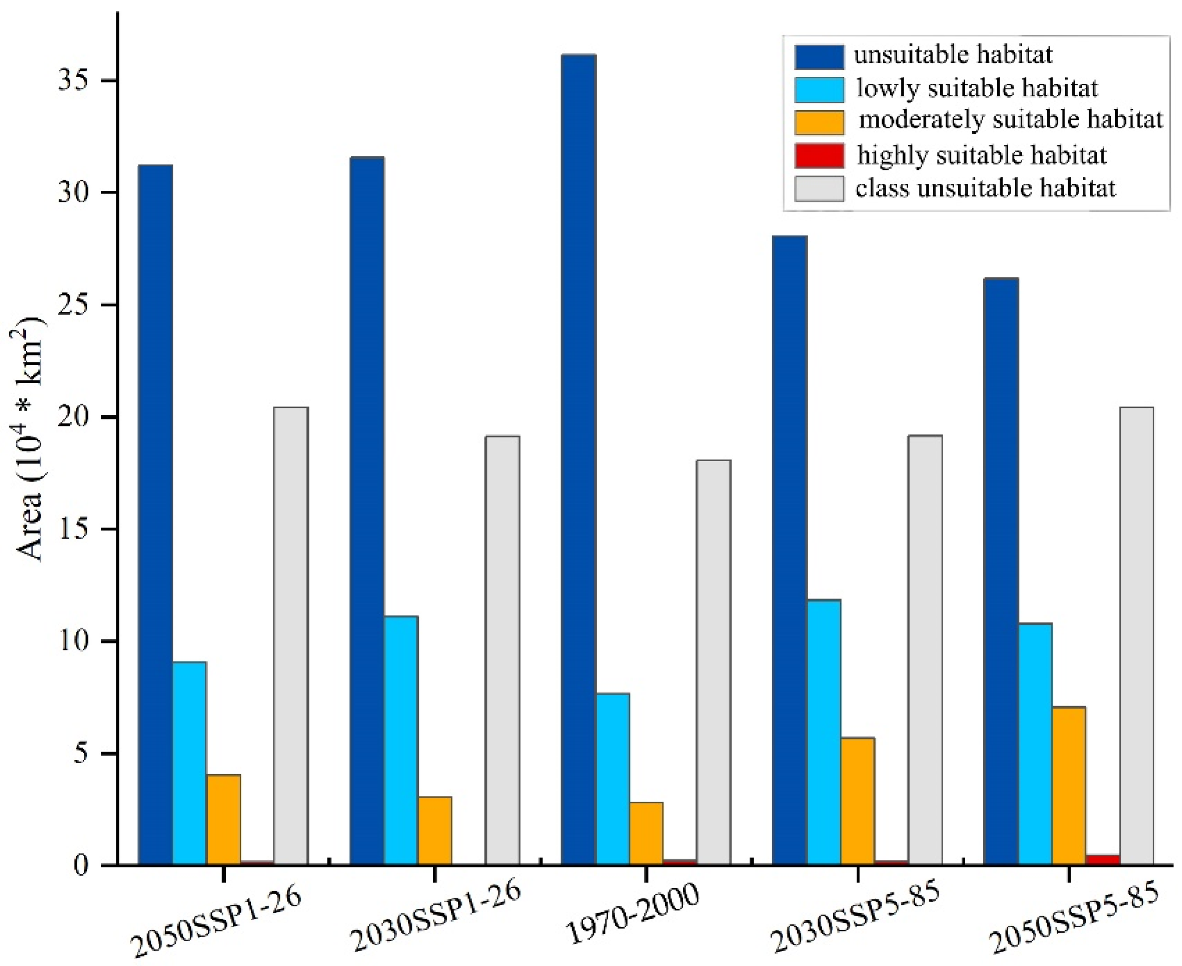
3.2. Suitable Habitats under the Effects of Multiple Environmental Factors

The optimized results showed that, in the 1970–2000 period, the areas of USH, LSH, MSH, HSH, and CUH were 36.15 × 10⁴, 7.66 × 10⁴, 2.80 × 10⁴, 0.23 × 10⁴, and 18.05 × 10⁴ km2, respectively. In the south and southeast of the Loess Plateau, the CUH led to a significant decline in MSH (−5.14 × 10⁴ km2, ~−64.74%) and HSH (−0.63 × 10⁴ km2, ~−74.12%) (Figure 2). Under SSP1-26 and SSP5-85, the inclusion of the CUH resulted in an area decline of the SH in various degrees in the 2030s and the 2050s (Figure 2). In the near future, under SSP1-26, the USH, LSH, MSH, and HSH decreased by 8.75~10.58 × 10⁴, 6.20~7.28 × 10⁴, 3.06~3.40 × 10⁴, and 0.04~0.25 × 10⁴ km2, respectively (Figure 2a,b). In the 2030s and the 2050s, the reduction in the MSH was 50.00% and 45.76%, respectively, whereas it was 50.00% and 59.52% for the HSH. Compared to the MSH and HSH, the LSH was less affected by the CUH, as the proportion of habitat decline in the near future was 39.61% (the 2030s) and 40.68% (the 2050s). Under SSP5-85, the USH, LSH, MSH, and HSH decreased by 8.65~11.07 × 10⁴, 5.73~6.18 × 10⁴ (−34.30%~−34.71%), 3.37~4.11 × 10⁴ (−32.31%~−42.02%) and 0.21~0.26 × 10⁴ km2 (−36.62%~−53.85%), respectively (Figure 2d,e and Figure 3).
According to the optimized results of the distribution of apple trees, the CUH mainly spread in the east, south, southeast, southwest, west, north, and northwest of the Loess Plateau (Figure 2 and Figure S3). Currently, the CUH, within 1.81 × 10⁵ km2 (Figure 3), is predominantly contiguously distributed in the south, southeast, and southwest of the Loess Plateau, is sporadic in the central area, and is patchy in the west, northwest, north, and northeast; the MSH and HSH were mainly scattered in the southeast, and the LSH was mainly located in the central area (Figure 2). Compared with the 1970–2000 period, the area of the CUH expanded in different degrees in the 2030s and the 2050s under both SSP1-26 (1.07~2.37 × 10⁴ km2) and SSP5-85 (1.10~2.38 × 10⁴ km2, Figure 3). The CUH mostly extended in the east, north, and northeast of the Loess Plateau, while the changes in the south, southeast, southwest, and west were relatively slight (Figure S3). In contrast, under the two SSPs, the distribution range of the LSH and MSH were expanded to different degrees in the south, central, and southwest areas in the near future (Figure 2, Table S2). The HSH area change trend showed a V-shaped curve from the 1970–2000 period to the 2030s and the 2050s, while its area under SSP1-26 was still lower than it was under near present climatic conditions (Table S2).

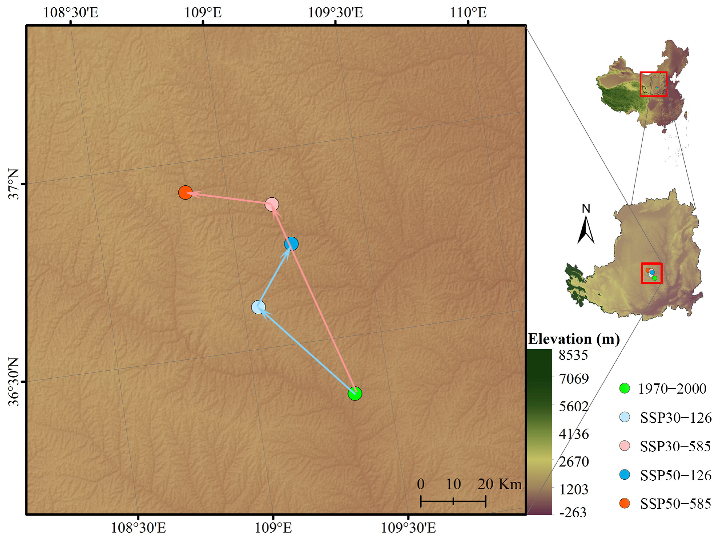
3.3. Shifts of Centroids in the near Future under Two Climate Scenarios

The changes in the distribution patterns of SHs resulted in shifts of their centroids. Currently, the suitability centroid of apple trees is located at 109°22′11.79″ E, 36°21′11.92″ N (Figure 4). Under SSP1-26, the shift distances for the suitability centroid in the 2030s and the 2050s were 40.05 km and 50.32 km, respectively. Under SSP5-85, the shift distances were 63.88 km and 81.30 km, respectively (Figure 4). In particular, we noticed that, under both SSP1-26 and SSP5-85, all suitability centroids of apple trees displaced towards the northwest.

4. Discussion

4.1. Effects of the USH and Range Shifts in Suitable Habitats of Apple Trees

In this study, the geographic distribution patterns of one economically important tree (i.e., M. pumila) and one of its vital pathogens (i.e., V. mali) under SSP1-26 and SSP5-85, as well as the corresponding land use patterns, were simulated using MaxEnt and the CA–Markov model. Based on this, more detailed maps of the geographic distribution of apple trees were produced. After considering the CUH (i.e., ULUT and HRHP), the distribution patterns of apple trees on the Loess Plateau became more fragmented as a result of the increase in the classification criteria from four SHs to five. Compared with its 1970–2000 range, the SH (i.e., the LSH, MSH, and part of the HSH in the 2050s period under SSP5-85) expanded to different degrees in the south and southwest of the Loess Plateau. This is consistent with the impact of the southeast monsoon on the direction of precipitation inside the Loess Plateau range [59]. Moreover, the geographical distribution of the Qinling Mountains (on the south and spanning from west to east, [1]) may have some impact on this. Furthermore, while not negligible, the influence of regional topography on regional climate change (i.e., temperature and precipitation, [59]) is often difficult to measure precisely.
Global climate change has brought challenges for the cultivation of apple trees on the Loess Plateau. From the 1970–2000 period to the 2030s and the 2050s, the area of the SH under SSP5-85 increased more than under SSP1-26. Under SSP1-26 and SSP5-85, the ideal cultivation habitat of apple trees on the Loess Plateau will shift northwest in the near future compared to their near present distribution. In addition, because the Loess Plateau is one of the most important apple-producing regions in China [14], a series of adaptation measures will be required to maintain the size and yield of the apple industry. In recent decades, the average elevation of apple orchards in Northern India has displaced upward by about 800 m [15], and it has moved northward and westward in China [17]. Across the period from the 2030s to the 2050s, the shift distances of suitability centroids increased between SSP1-26 and SSP5-85. We hypothesize that this may be related to the temperature influence on the growth and development of apple trees: similar to how temperature thresholds influence the development activities of particular pest species [60], an appropriate temperature increase will enhance the distribution of apple trees on the Loess Plateau, but when the temperature change exceeds a certain threshold, the promoting effect of temperature increase is likely to shift from the positive to negative. This is contrary to the practical experience of economically important forest trees seeking the most environmentally similar habitats when facing climate change [15,45].

4.2. Effects of Abiotic and Biological Factors on the CUH

Compared with the distribution patterns of the CUH in the 1970–2000 period, it will expand in different degrees in the near future. Furthermore, its expansion trends were mainly concentrated in the east, northeast, and north of the Loess Plateau, while the changes occurring in the south, southeast, southwest, west, and northwest directions were minimal. However, considering the delineation of the CUH, there were two potential causes for uncertainty in the simulations. On the one hand, the simulation uncertainty of the ULST may lead to the uncertainty in the CUH. Both natural controlling factors (i.e., temperature, precipitation, terrain, etc.) and socio-economic driving factors have impacts on the LUCC [61], and their effects vary depending on the land use type [62]. This is partly because some land use types (e.g., orchards) have more economic benefits than those with more ecological functions (e.g., forests and grasslands). This study assumed that the terrain factors would remain stable in the near future, and on this basis, the climatic factors, such as temperature and precipitation, could be the dominant natural factors impacting the Loess Plateau ecosystem. Meanwhile, given the significant impacts of socio-economic factors (i.e., policies, regulations, and systems, [63]) on the LUCC, it cannot be ignored. National ecological projects have significantly changed the land use patterns in the north, northwest, and northeast of China during the last 50 years [7], as well as the creation of nature reserves [64]. These are significant examples of how socio-economic factors have influenced the LUCC [61,63]. Hence, limited by land use policy, predicting future land use changes based on current regulations, although essential and indispensable at this point, cannot overlook the tremendous uncertainty caused by itself. On the other hand, the simulation uncertainty of the HRHP may lead to extra uncertainty in the range of the CUH. In the 2030s and the 2050s, the CUH range differs slightly between SSP1-26 and SSP5-85 (Figure 2). To lessen the computational burden of the simulation, the impact of the two SSPs on land use change was not considered separately in this study (i.e., the same land use simulations were used in both SSP1-26 and SSP5-85). Therefore, the difference in the range of the CUH under similar SSPs was caused by their HRHP range (Figure S2). For the plant pathogen V. mali, details about its host (i.e., apple trees, plum trees, etc.), biological factors (such as insect behaviour), and its potential transmission routes (such as seeds and stocks with the pathogen [58]) need to be considered in future studies to obtain more convincing simulation results. In addition, further research is required on the reaction of V. mali to temperature and precipitation. An essential factor in the prevention and treatment of the AVC is setting an adequate buffer distance for V. mali. Hence, future research should also pay more attention to how many relevant environmental factors such as land types, terrain, and other geographic barriers (e.g., seasonal wind, river, etc.) affect the buffer distance of V. mali.

4.3. Strategies to Improve the Accuracy of Simulations

This study produced an excellent simulation of the potential geographic distribution of apple trees in the near present and near future on the Loess Plateau. However, to increase its accuracy, three uncertainties should be overcome in follow-up studies. First, there are uncertainties within the MaxEnt model itself. Species occurrence data and environmental variables are the fundamental inputs of MaxEnt. Before building the model, we screened the species occurrence data (based on environmental data resolution) and environmental data (i.e., principal component analysis and correlation coefficient) separately [65]. However, it is still necessary to make sure that this is the best strategy to utilize these occurrence data. Additionally, merely considering the correlation and overlap between environmental factors may neglect crucial factors [57] that might have potential impacts on the distribution patterns of species. In order to reasonably filter environmental variables and enhance the stability and precision of the simulation of species distribution, future studies may need more extensive assessment strategies (e.g., evaluate the weight of environmental variables in the model, [66,67]). Second, there are uncertainties in dividing SHs. Though maxss has been commonly applied in SDM studies to distinguish between the potential of presence and absence of species [56], its stability in various hydrothermal environments remains uncertain. Future studies should focus more on improving and enhancing the indicators used to assess the presence and absence situation of species. Third, there are uncertainties in the mask maps. Some natural, inevitable uncertainties existed in the simulation of climate scenarios by the climate prediction organisations, resulting in the uncertainty in the mask maps of the HRHP. Human activities, policies, and climate change all have an impact on the LUCC [19,61]. However, their effects vary from ecosystem to ecosystem, especially in those that are regularly impacted by human activities [26]. The Loess Plateau ecosystem is particularly sensitive due to its peculiar climatic conditions [6,12]. It should be noted that the modelling estimates of land use in the near future in this study did not sufficiently account for relevant environmental factors. In order to increase the accuracy of modelling in this region, future studies may need to perform more in-depth related research on the driving forces [62]. At the moment, the LUCC predictions of the Loess Plateau under different climate change scenarios are still lacking, and hence their potential impacts are overlooked in this work.

5. Conclusions

In this study, we developed a model that took multiple environmental factors into account, such as temperature, precipitation, terrain, soil, climate change, and human activities, to simulate the distribution pattern of apple trees on the Loess Plateau in the near present and near future under two Shared Socioeconomic Pathways (i.e., SSP1-26 and SSP5-85). The increase in the SH in SSP5-85 was larger than in SSP1-26. In the near future, the CUH increased in different degrees in the east, northeast, and north of the Loess Plateau. The LSH, MSH, and HSH shrunk to varied degrees after optimization, taking the CUH into consideration, and their decrease in percentage was larger than that of the USH. Under the two SSPs, all suitability centroids shifted to the northwest in the near future relative to the 1970–2000 centroid. As the pressures of climate change increased from SSP1-26 to SSP5-85, the shift distances of centroids increased in both the 2030s and the 2050s. Under the same climate change pressures, the shift distance increased more in the 2050s than it did in the 2030s.

Supplementary Materials

The following supporting information can be downloaded at: https://www.mdpi.com/article/10.3390/agriculture13020291/s1. Figure S1. The spatial distribution patterns of suitable habitats of apple trees on the Loess Plateau in three periods under two climate scenarios (SSP1-26: (a,b); SSP5-85: (d,e)); Figure S2. The spatial patterns of high-risk habitat of Valsa Mali in the 1970–2000 and near future (the 2030s and 2050s) under two climate scenarios (SSP1-26: (a,b); SSP5-85: (d,e)); Figure S3. The land use patterns (a–c) and the unsuitable land use type for the cultivation of apple trees (d–f) on the Loess Plateau in the 1970–2000 and near future (the 2030s and 2050s); Table S1: The correspondence of the reclassification of the land use and cover changes; Table S2: The area of suitable habitats (before and after optimization) of apple trees on the Loess Plateau (104 × km2). The CUH represents the class unsuitable habitat.

Author Contributions

W.X. designed the study, collected occurrence data, drew the map, tables, and figures, and wrote the main body of the manuscript; Y.M. and S.Z. improved the manuscript in many parts and calculated the corresponding area of suitable habitats; J.J. and J.C. acquired the funding and revised the manuscript. All authors have read and agreed to the published version of the manuscript.

Funding

This study was financially supported by the Key Research and Development Program of Shaanxi Province (2021NY-006), Natural Science Foundation of China (31601987), China Agriculture Research System (CARS-34), Deployment Program of the Chinese Academy of Sciences (KJZD-EW-TZ-G10) and Doctoral Fund of Henan Polytechnic University (B2019-4).

Institutional Review Board Statement

Not application.

Acknowledgments

We thank the corresponding organisations that provided data and software to support this work. Importantly, we would like to thank Runzhi Mao for his spiritual support of our life and this work. We also thank the anonymous reviewers for their suggestions and contributions in improving this manuscript.

Conflicts of Interest

The authors declare no conflict of interest.

References

  1. Fu, B.; Wang, S.; Liu, Y.; Liu, J.; Liang, W.; Miao, C. Hydrogeomorphic Ecosystem Responses to Natural and Anthropogenic Changes in the Loess Plateau of China. Annu. Rev. Earth Planet. Sci. 2017, 45, 223–243. [Google Scholar] [CrossRef]
  2. Akiyama, T.; Kawamura, K. Grassland degradation in China: Methods of monitoring, management and restoration. Grassl. Sci. 2010, 53, 1–17. [Google Scholar] [CrossRef]
  3. Zhou, W.; Gang, C.; Chen, Y.; Mu, S.; Sun, Z.; Li, J. Grassland coverage inter-annual variation and its coupling relation with hydrothermal factors in China during 1982–2010. J. Geogr. Sci. 2014, 24, 593–611. [Google Scholar] [CrossRef] [Green Version]
  4. He, X.; Zhou, J.; Zhang, X.; Tang, K. Soil erosion response to climatic change and human activity during the Quaternary on the Loess Plateau, China. Reg. Environ. Change 2006, 6, 62–70. [Google Scholar] [CrossRef]
  5. Yin, R.; Yin, G.; Li, L. Assessing China’s Ecological Restoration Programs: What’s Been Done and What Remains to Be Done? Environ. Manag. 2010, 45, 442–453. [Google Scholar] [CrossRef]
  6. Liu, G.B. Soil conservation and sustainable agriculture on the Loess Plateau: Challenges and prospects. Ambio 1999, 28, 663–668. [Google Scholar]
  7. Liu, Y.Y.; Wang, Q.; Zhang, Z.Y.; Tong, L.J.; Wang, Z.Q.; Li, J.L. Grassland dynamics in responses to climate variation and human activities in China from 2000 to 2013. Sci. Total Environ. 2019, 690, 27–39. [Google Scholar] [CrossRef]
  8. Chen, H.; Marter-Kenyon, J.; Lopez-Carr, D.; Liang, X.-Y. Land cover and landscape changes in Shaanxi Province during China’s Grain for Green Program (2000–2010). Environ. Monit. Assess. 2015, 187, 644. [Google Scholar] [CrossRef]
  9. Treacy, P.; Jagger, P.; Song, C.; Zhang, Q.; Bilsborrow, R.E. Impacts of China’s Grain for Green Program on Migration and Household Income. Environ. Manag. 2018, 62, 489–499. [Google Scholar] [CrossRef]
  10. Yang, M.; Wang, S.F.; Zhao, X.N.; Gao, X.D.; Liu, S. Soil properties of apple orchards on China’s Loess Plateau. Sci. Total Environ. 2020, 723, 15. [Google Scholar] [CrossRef]
  11. Xu, Z.; Peng, J.; Qiu, S.; Liu, Y.; Dong, J.; Zhang, H. Responses of spatial relationships between ecosystem services and the Sustainable Development Goals to urbanization. Sci. Total Environ. 2022, 850, 157868. [Google Scholar] [CrossRef]
  12. Zhao, H.F.; He, H.M.; Wang, J.J.; Bai, C.Y.; Zhang, C.J. Vegetation Restoration and Its Environmental Effects on the Loess Plateau. Sustainability 2018, 10, 4676. [Google Scholar] [CrossRef] [Green Version]
  13. Li, Z.; Liu, G.; Zhang, X. Review of reaearches on the Valsa canker of apple trees. North. Fruits 2013, 4, 13. [Google Scholar]
  14. Peng, X.X.; Guo, Z.; Zhang, Y.J.; Li, J. Simulation of Long-term Yield and Soil Water Consumption in Apple Orchards on the Loess Plateau, China, in Response to Fertilization. Sci. Rep. 2017, 7, 11. [Google Scholar] [CrossRef] [Green Version]
  15. Sahu, N.; Saini, A.; Behera, S.K.; Sayama, T.; Sahu, L.; Van-Thanh-Van, N.; Takara, K. Why apple orchards are shifting to the higher altitudes of the Himalayas? PLoS ONE 2020, 15, e0235041. [Google Scholar] [CrossRef]
  16. Liu, C.; White, M.; Newell, G. Selecting thresholds for the prediction of species occurrence with presence-only data. J. Biogeogr. 2013, 40, 778–789. [Google Scholar] [CrossRef]
  17. Xu, W.; Jin, J.; Cheng, J. Predicting the Potential Geographic Distribution and Habitat Suitability of Two Economic Forest Trees on the Loess Plateau, China. Forests 2021, 12, 747. [Google Scholar] [CrossRef]
  18. Li, J.J.; Fan, G.; He, Y. Predicting the current and future distribution of three Coptis herbs in China under climate change conditions, using the MaxEnt model and chemical analysis. Sci. Total Environ. 2020, 698, 8. [Google Scholar] [CrossRef]
  19. Zhang, Y.H.; Liu, X.P.; Chen, G.L.; Hu, G.H. Simulation of urban expansion based on cellular automata and maximum entropy model. Sci. China-Earth Sci. 2020, 63, 701–712. [Google Scholar] [CrossRef]
  20. Xu, X.; Zhang, H.; Yue, J.; Xie, T.; Xu, Y.; Tian, Y. Predicting Shifts in the Suitable Climatic Distribution of Walnut (Juglans regia L.) in China: Maximum Entropy Model Paves the Way to Forest Management. Forests 2018, 9, 103. [Google Scholar] [CrossRef] [Green Version]
  21. Naeem, M.; Liu, M.; Huang, J.; Ding, G.; Potapov, G.; Jung, C.; An, J. Vulnerability of East Asian bumblebee species to future climate and land cover changes. Agric. Ecosyst. Environ. 2019, 277, 11–20. [Google Scholar] [CrossRef]
  22. Lang-Yona, N.; Levin, Y.; Dannemiller, K.C.; Yarden, O.; Peccia, J.; Rudich, Y. Changes in atmospheric CO2 influence the allergenicity of Aspergillus fumigatus. Glob. Change Biol. 2013, 19, 2381–2388. [Google Scholar] [CrossRef]
  23. Grimm, N.B.; Faeth, S.H.; Golubiewski, N.E.; Redman, C.L.; Wu, J.G.; Bai, X.M.; Briggs, J.M. Global change and the ecology of cities. Science 2008, 319, 756–760. [Google Scholar] [CrossRef] [Green Version]
  24. Li, J.; Wang, Z.L.; Lai, C.G.; Wu, X.Q.; Zeng, Z.Y.; Chen, X.H.; Lian, Y.Q. Response of net primary production to land use and land cover change in mainland China since the late 1980s. Sci. Total Environ. 2018, 639, 237–247. [Google Scholar] [CrossRef]
  25. Tong, S.Q.; Bao, G.; Rong, A.; Huang, X.J.; Bao, Y.B.; Bao, Y.H. Comparison of the Spatiotemporal Dynamics of Land Use Changes in Four Municipalities of China Based on Intensity Analysis. Sustainability 2020, 12, 3687. [Google Scholar] [CrossRef]
  26. Zhou, W.; Yang, H.; Huang, L.; Chen, C.; Lin, X.S.; Hu, Z.J.; Li, J.L. Grassland degradation remote sensing monitoring and driving factors quantitative assessment in China from 1982 to 2010. Ecol. Indic. 2017, 83, 303–313. [Google Scholar] [CrossRef]
  27. Wang, C.; Wang, X.; Jin, Z.; Müller, C.; Pugh, T.A.M.; Chen, A.; Wang, T.; Huang, L.; Zhang, Y.; Li, X.Z.; et al. Occurrence of crop pests and diseases has largely increased in China since 1970. Nat. Food 2021, 3, 57–65. [Google Scholar] [CrossRef]
  28. Narouei-Khandan, H.A.; Worner, S.P.; Viljanen, S.L.H.; van Bruggen, A.H.C.; Jones, E.E. Projecting the suitability of global and local habitats for myrtle rust (Austropuccinia psidii) using model consensus. Plant Pathol. 2020, 69, 17–27. [Google Scholar] [CrossRef]
  29. Xu, W.; Sun, H.; Jin, J.; Cheng, J. Predicting the Potential Distribution of Apple Canker Pathogen (Valsa mali) in China under Climate Change. Forests 2020, 11, 1126. [Google Scholar] [CrossRef]
  30. Bessho, H.; Tsuchiya, S.; Soejima, J. Screening methode of apple-trees for resistance to Valsa canker. Euphytica 1994, 77, 15–18. [Google Scholar] [CrossRef]
  31. Wang, C.; Guan, X.; Wang, H.; Li, G.; Dong, X.; Wang, G.; Li, B. Agrobacterium tumefaciens-Mediated Transformation of Valsa mali: An Efficient Tool for Random Insertion Mutagenesis. Sci. World J. 2013, 2013, 968432. [Google Scholar] [CrossRef] [Green Version]
  32. Chen, C.; Li, B.-H.; Dong, X.-L.; Wang, C.-X.; Lian, S.; Liang, W.-X. Effects of Temperature, Humidity, and Wound Age on Valsa mali Infection of Apple Shoot Pruning Wounds. Plant Dis. 2016, 100, 2394–2401. [Google Scholar] [CrossRef] [Green Version]
  33. Wang, S.T.; Hu, T.L.; Wang, Y.A.; Luo, Y.; Michailides, T.J.; Cao, K.Q. New understanding on infection processes of Valsa canker of apple in China. Eur. J. Plant Pathol. 2016, 146, 531–540. [Google Scholar] [CrossRef]
  34. Li, K.M.; Feng, M.M.; Biswas, A.; Su, H.H.; Niu, Y.L.; Cao, J.J. Driving Factors and Future Prediction of Land Use and Cover Change Based on Satellite Remote Sensing Data by the LCM Model: A Case Study from Gansu Province, China. Sensors 2020, 20, 2757. [Google Scholar] [CrossRef]
  35. Halvorsen, R.; Mazzoni, S.; Dirksen, J.W.; Næsset, E.; Gobakken, T.; Ohlson, M. How important are choice of model selection method and spatial autocorrelation of presence data for distribution modelling by MaxEnt? Ecol. Model. 2016, 328, 108–118. [Google Scholar] [CrossRef]
  36. Zhang, K.; Yao, L.; Meng, J.; Tao, J. Maxent modeling for predicting the potential geographical distribution of two peony species under climate change. Sci. Total Environ. 2018, 634, 1326–1334. [Google Scholar] [CrossRef]
  37. Abolmaali, S.M.-R.; Tarkesh, M.; Bashari, H. MaxEnt modeling for predicting suitable habitats and identifying the effects of climate change on a threatened species, Daphne mucronata, in central Iran. Ecol. Inform. 2018, 43, 116–123. [Google Scholar] [CrossRef]
  38. Phillips, S.J.; Anderson, R.P.; Schapire, R.E. Maximum entropy modeling of species geographic distributions. Ecol. Model. 2006, 190, 231–259. [Google Scholar] [CrossRef] [Green Version]
  39. Araujo, M.B.; Pearson, R.G.; Thuiller, W.; Erhard, M. Validation of species-climate impact models under climate change. Glob. Change Biol. 2005, 11, 1504–1513. [Google Scholar] [CrossRef] [Green Version]
  40. Peterson, A.T. Uses and Requirements of Ecological Niche Models and Related Distributional Models. Biodivers. Inform. 2006, 3, 59–72. [Google Scholar] [CrossRef] [Green Version]
  41. Guisan, A.; Zimmermann, N.E. Predictive habitat distribution models in ecology. Ecol. Model. 2000, 135, 147–186. [Google Scholar] [CrossRef]
  42. Elith, J.; Graham, C.H.; Anderson, R.P.; Dudik, M.; Ferrier, S.; Guisan, A.; Hijmans, R.J.; Huettmann, F.; Leathwick, J.R.; Lehmann, A.; et al. Novel methods improve prediction of species’ distributions from occurrence data. Ecography 2006, 29, 129–151. [Google Scholar] [CrossRef] [Green Version]
  43. Phillips, S.J.; Dudik, M. Modeling of species distributions with Maxent: New extensions and a comprehensive evaluation. Ecography 2008, 31, 161–175. [Google Scholar] [CrossRef]
  44. Riahi, K.; van Vuuren, D.P.; Kriegler, E.; Edmonds, J.; O’Neill, B.C.; Fujimori, S.; Bauer, N.; Calvin, K.; Dellink, R.; Fricko, O.; et al. The Shared Socioeconomic Pathways and their energy, land use, and greenhouse gas emissions implications: An overview. Glob. Environ. Change-Hum. Policy Dimens. 2017, 42, 153–168. [Google Scholar] [CrossRef] [Green Version]
  45. O’Neill, B.C.; Tebaldi, C.; van Vuuren, D.P.; Eyring, V.; Friedlingstein, P.; Hurtt, G.; Knutti, R.; Kriegler, E.; Lamarque, J.F.; Lowe, J.; et al. The Scenario Model Intercomparison Project (ScenarioMIP) for CMIP6. Geosci. Model Dev. 2016, 9, 3461–3482. [Google Scholar] [CrossRef] [Green Version]
  46. Rana, S.K.; Rana, H.K.; Ghimire, S.K.; Shrestha, K.K.; Ranjitkar, S. Predicting the impact of climate change on the distribution of two threatened Himalayan medicinal plants of Liliaceae in Nepal. J. Mt. Sci. 2017, 14, 558–570. [Google Scholar] [CrossRef]
  47. Xin, X.G.; Zhang, L.; Zhang, J.; Wu, T.W.; Fang, Y.J. Climate Change Projections over East Asia with BCC_CSM1.1 Climate Model under RCP Scenarios. J. Meteorol. Soc. Jpn. 2013, 91, 413–429. [Google Scholar] [CrossRef] [Green Version]
  48. Fick, S.E.; Hijmans, R.J. WorldClim 2: New 1-km spatial resolution climate surfaces for global land areas. Int. J. Climatol. 2017, 37, 4302–4315. [Google Scholar] [CrossRef]
  49. Zhang, Q.; Wei, H.; Zhao, Z.; Liu, J.; Ran, Q.; Yu, J.; Gu, W. Optimization of the Fuzzy Matter Element Method for Predicting Species Suitability Distribution Based on Environmental Data. Sustainability 2018, 10, 3444. [Google Scholar] [CrossRef] [Green Version]
  50. Vaughan, I.P.; Ormerod, S.J. The Continuing Challenges of Testing Species Distribution Models. J. Appl. Ecol. 2005, 42, 720–730. [Google Scholar] [CrossRef]
  51. Yu, F.Y.; Wang, T.J.; Groen, T.A.; Skidmore, A.K.; Yang, X.F.; Ma, K.P.; Wu, Z.F. Climate and land use changes will degrade the distribution of Rhododendrons in China. Sci. Total Environ. 2019, 659, 515–528. [Google Scholar] [CrossRef]
  52. Touré, D.; Ge, J. The Response of Plant Species Diversity to the Interrelationships between Soil and Environmental Factors in the Limestone Forests of Southwest China. J. Environ. Earth Sci. 2014, 4, 105–122. [Google Scholar]
  53. Ma, B.; Sun, J. Predicting the distribution of Stipa purpurea across the Tibetan Plateau via the MaxEnt model. BMC Ecol. 2018, 18, 10. [Google Scholar] [CrossRef] [Green Version]
  54. Fielding, A.H.; Bell, J.F. A review of methods for the assessment of prediction errors in conservation presence/absence models. Environ. Conserv. 1997, 24, 38–49. [Google Scholar] [CrossRef]
  55. Qin, A.; Liu, B.; Guo, Q.; Bussmann, R.W.; Ma, F.; Jian, Z.; Xu, G.; Pei, S. Maxent modeling for predicting impacts of climate change on the potential distribution of Thuja sutchuenensis Franch., an extremely endangered conifer from southwestern China. Glob. Ecol. Conserv. 2017, 10, 139–146. [Google Scholar] [CrossRef]
  56. Liu, C.; Newell, G.; White, M. On the selection of thresholds for predicting species occurrence with presence-only data. Ecol. Evol. 2016, 6, 337–348. [Google Scholar] [CrossRef] [Green Version]
  57. Wang, S.; Xu, X.; Shrestha, N.; Zimmermann, N.E.; Wang, Z. Response of spatial vegetation distribution in China to climate changes since the Last Glacial Maximum (LGM). PLoS ONE 2017, 12, e0175742. [Google Scholar] [CrossRef] [Green Version]
  58. Xiang-Long, M.; Xing-Hua, Q.; Ze-Yuan, H.; Yong-Bin, G.; Ya-Nan, W.; Tong-le, H.; Li-Ming, W.; Ke-Qiang, C.; Shu-Tong, W. Latent Infection of Valsa mali in the Seeds, Seedlings and Twigs of Crabapple and Apple Trees is a Potential Inoculum Source of Valsa Canker. Sci. Rep. 2019, 9, 7738. [Google Scholar] [CrossRef] [Green Version]
  59. Loo, Y.Y.; Billa, L.; Singh, A. Effect of climate change on seasonal monsoon in Asia and its impact on the variability of monsoon rainfall in Southeast Asia. Geosci. Front. 2015, 6, 817–823. [Google Scholar] [CrossRef] [Green Version]
  60. Stejskal, V.; Vendl, T.; Li, Z.; Aulicky, R. Minimal Thermal Requirements for Development and Activity of Stored Product and Food Industry Pests (Acari, Coleoptera, Lepidoptera, Psocoptera, Diptera and Blattodea): A Review. Insects 2019, 10, 149. [Google Scholar] [CrossRef] [Green Version]
  61. Shi, S.; Yu, J.; Wang, F.; Wang, P.; Zhang, Y.; Jin, K. Quantitative contributions of climate change and human activities to vegetation changes over multiple time scales on the Loess Plateau. Sci. Total Environ. 2021, 755 Pt 2, 142419. [Google Scholar] [CrossRef] [PubMed]
  62. Gao, C.; Zhou, P.; Jia, P.; Liu, Z.; Wei, L.; Tian, H. Spatial driving forces of dominant land use/land cover transformations in the Dongjiang River watershed, Southern China. Environ. Monit. Assess. 2016, 188, 84. [Google Scholar] [CrossRef] [PubMed]
  63. Wu, X.; Shen, Z.; Liu, R.; Ding, X. Land Use/Cover Dynamics in Response to Changes in Environmental and Socio-Political Forces in the Upper Reaches of the Yangtze River, China. Sensors 2008, 8, 8104–8122. [Google Scholar] [CrossRef] [PubMed]
  64. Hu, W.; Wang, Y.; Dong, P.; Zhang, D.; Yu, W.; Ma, Z.; Chen, G.; Liu, Z.; Du, J.; Chen, B.; et al. Predicting potential mangrove distributions at the global northern distribution margin using an ecological niche model: Determining conservation and reforestation involvement. For. Ecol. Manag. 2020, 478, 118517. [Google Scholar] [CrossRef]
  65. Bruelheide, H.; Jimenez-Alfaro, B.; Jandt, U.; Sabatini, F.M. Deriving site-specific species pools from large databases. Ecography 2020, 43, 1215–1228. [Google Scholar] [CrossRef]
  66. Mas, J.F.; Kolb, M.; Paegelow, M.; Olmedo, M.T.C.; Houet, T. Inductive pattern-based land use/cover change models: A comparison of four software packages. Environ. Modell. Softw. 2014, 51, 94–111. [Google Scholar] [CrossRef] [Green Version]
  67. Liu, X.P.; Liang, X.; Li, X.; Xu, X.C.; Ou, J.P.; Chen, Y.M.; Li, S.Y.; Wang, S.J.; Pei, F.S. A future land use simulation model (FLUS) for simulating multiple land use scenarios by coupling human and natural effects. Landsc. Urban Plan. 2017, 168, 94–116. [Google Scholar] [CrossRef]
Figure 1. The occurrence data of Malus pumila Mill. and Valsa mali in China.
Agriculture 13 00291 g001
Figure 2. The spatial patterns of apple trees in the 1970–2000 (c) and near future under two scenarios ((a,b) SSP1-26, (d,e) SSP5-85).
Agriculture 13 00291 g002
Figure 3. The habitat area of apple trees in three periods (1970–2000, the 2030s, and the 2050s) under two climate scenarios (SSP1-26 and SSP5-85).
Agriculture 13 00291 g003
Figure 4. The suitability centroids of apple trees on the Loess Plateau.
Agriculture 13 00291 g004
Table 1. The environmental factors used in the corresponding simulation (variables with labels of “+” for Valsa mali, “−” for Malus pumila Mill., and “*” for land use).
FactorVariablesDescriptionUnitResolutionLabelsSources
Bioclimatic layersbio1Annual Mean Temperature°C2.5 arc-min±www.worldclim.org/, accessed on 18 May 2020
bio5Max Temperature of Warmest Month°C2.5 arc-min
bio6Min Temperature of Coldest Month°C2.5 arc-min±
bio11Mean Temperature of Coldest Quarter°C2.5 arc-min+
bio12Annual Mean Precipitationmm2.5 arc-min±
bio15Precipitation Seasonality 2.5 arc-min+
bio16Precipitation of Wettest Quartermm2.5 arc-min
bio17Precipitation of Driest Quartermm2.5 arc-min
Terrain dataaspectAspect ±www.resdc.cn/, accessed on 19 May 2020
curvatureCurvature ±
elevationElevationm1 km±
slopeSlope° ±
Soil datasandSoil Texture 1 km±www.fao.org/soils-portal/, accessed on 11 May 2020
soilSoil Type 1 km±
Land use dataland useLand Use and Cover Change 300 m*www.climate.copernicus.eu/, accessed on 8 August 2020
Disclaimer/Publisher’s Note: The statements, opinions and data contained in all publications are solely those of the individual author(s) and contributor(s) and not of MDPI and/or the editor(s). MDPI and/or the editor(s) disclaim responsibility for any injury to people or property resulting from any ideas, methods, instructions or products referred to in the content.

