Article

Multi-Index Grading Method for Pear Appearance Quality Based on Machine Vision

1
School of Mechanical Engineering, Hebei University of Technology, Tianjin 300401, China
2
State Key Laboratory of Reliability and Intelligence Electrical Equipment, Hebei University of Technology, Tianjin 300130, China
3
Key Laboratory of Hebei Province on Scale-Span Intelligent Equipment Technology, Hebei University of Technology, Tianjin 300401, China
*
Author to whom correspondence should be addressed.
Agriculture 2023, 13(2), 290; https://doi.org/10.3390/agriculture13020290
Submission received: 8 November 2022 / Accepted: 17 January 2023 / Published: 25 January 2023
(This article belongs to the Special Issue Sensory Analysis and Evaluation of Agricultural Products)

Abstract

:
The appearance quality of fruits affects consumers’ judgment of their value, and grading the quality of fruits is an effective means to improve their added value. The purpose of this study is to transform the grading of pear appearance quality into the classification of the categories under several quality indexes based on industry standards and design effective distinguishing features for training the classifier. The grading of pear appearance quality is transformed into the classification of pear shapes, surface colors and defects. The symmetry feature and quasi-rectangle feature were designed and the back propagation (BP) neural network was trained to distinguish standard shape, apical shape and eccentric shape. The mean and variance features of R and G channels were used to train support vector machine (SVM) to distinguish standard color and deviant color. The surface defect area was used to participate in pear appearance quality classification and the gray level co-occurrence matrix (GLCM) features of defect area were extracted to train BP neural network to distinguish four common defect categories: tabbed defects, bruised defects, abraded defects and rusty defects. The accuracy rates of the above three classifiers reached 83.3%, 91.0% and 76.6% respectively, and the accuracy rate of pear appearance quality grading based on grading rules was 80.5%. In addition, the hardware system prototype for experimental purpose was designed, which have certain reference significance for the further construction of the pear appearance quality grading pipeline.

1. Introduction

Manual fruit sorting has the disadvantages of low efficiency, high labor intensity and strong subjectivity in grading. It is of great significance to study the technology of fruit appearance quality detection and automatic grading to overcome the above disadvantages.
At present, fruit quality detection mainly focuses on fruit appearance (such as fruit shape, color, bruises, ripeness, etc.), internal defects (such as browning, cork, etc.) and internal components (such as soluble solids, brix, etc.), and the classification of fruits is carried out according to specific standards. Fruit quality detection techniques mainly include machine vision technology [1,2], spectral detection technology [3,4], X-ray detection technology [5,6], electronic nose detection technology [7], and nuclear magnetic resonance detection technology [8]. A comparison of the advantages and disadvantages of various detection techniques and the applicable occasions are shown in Table 1. For fruit appearance quality detection, machine vision technology is the most direct, feasible and economical way.
Shi et al., used an image-based approach to classify the quality of apple appearance, and proposed a new multi-view spatial network to distinguish the size of apples and the presence of defects. The low-level features were extracted from the top-view, front-view and back-view images of apples which were obtained from each of the three cameras using three lightweight networks. The information related to multiple views was fused by the spatial feature aggregation module and the final classification accuracy rate reached 99.23% [9]. Sun et al., used the class balance loss to improve the MobileNet V2 model for jujube maturity classification, and used the transfer learning strategy to train the model. After the training, the model was fine-tuned using an imbalance data set. Compared with other networks, the classification accuracy of this model was higher, reaching 99.294% [10]. Nandi et al., extracted global Fourier descriptors of mango fruit shape for mango quality discrimination and used SVM to achieve the classification of mango fruit shape in good, medium and poor grades [11]. In addition, the overall or local color of some fruits can reflect their ripeness and defects. Rafeal et al. used color features to predict olive ripeness and defect recognition. This scheme was feasible when olives were less ripe, but olives with higher ripeness show black-purple color, which caused low accuracy of olive surface defect recognition [12]. And then other features need to be integrated for olive surface defect recognition. Kumar et al. used wavelet transform method to segment tomato defect areas and identified black spots, rotten spots and melanistic spots based on color and geometric features, with an accuracy of 98% [13]. Gu et al., combined the features extracted by the deep convolutional neural network (DCNN) with the k-nearest neighbor to distinguish the surface defect categories of pears and apples. They used ImageNet to pre-train the DCNN, and used the fruit surface defect data set for network fine-tuning to extract features. The extracted features were used to identify fruit surface defects by k-nearest neighbor, with an accuracy rate of 99.78% [14]. In aspect of fruit appearance quality detection, the relatively single grading index in the current study had insufficient responsiveness to overall fruit appearance quality. The fruit industry standard described the quality requirements of all aspects of fruit in a more comprehensive way, which can be referred to in the fruit classification. The fruit grading indexes in the industry standard mainly revolve around the fruit shape, fruit surface color and the size of the defects. In this paper, these three grading indexes were also used in the grading process of pear appearance quality. The final appearance quality of the pear is determined comprehensively according to the results of the above three grading indexes, which can reflect the appearance quality of the fruit in a more comprehensive way.
Sofu et al. designed an apple visual inspection and grading system, which can detect surface color spots, defects, crusts, stalks and calyxes of apples. In addition, apple size and weight were also used to grade apples, thus achieving high sorting efficiency [15]. Mon et al. proposed an algorithm for mango volume estimation based on machine vision technology. The length and width of the mango were obtained from the 2D mango image, and the thickness was estimated from the correlation between the light intensity distribution and the maximum width-thickness in the top view of the mango, so as to estimate the volume of mango, with an accuracy of 96.8% [16]. In the field of agricultural fruit grading and sorting, it is a trend to comprehensively grade fruits by integrating various evaluation indexes, which has richer grading connotation. Machine vision-based automatic fruit grading systems generally include a controller, an image acquisition device, a transfer device, a grading device and a human-machine interaction module [17]. The controller is responsible for the overall device operation control. The image acquisition device is usually installed with charge-coupled device (CCD) and light source system components to acquire the fruit appearance images. The conveyor and grading device are used to transport the fruits and sort them correctly, and the human-machine interaction module is used to realize the functions of setting equipment parameters and control command input.
In this paper, pears are employed as grading objects, whose variety is Xinjiang Kulle balsam pear. The shape, color and surface defects of the pear were used as grading indexes to visually detect the appearance quality of the pear. The content of this paper is organized as follows: Section 2 illustrates the pear appearance feature extraction and grading method with pear shape, color and surface defects as grading indexes. Section 3 is the experimental section, which introduces the designed hardware device and grading software, explains the involved image processing methods, followed by demonstrating the feasibility of the extracted features, and finally explains and evaluates the classification results. At last, a summary as well as an outlook is presented in Section 4.

2. Methods

Pear appearance quality grading refers to the national grading standard of fresh pears in China. The pear appearance quality indexes involved in the grading standard mainly include pear shape, surface color and defects. Abnormal pear shapes such as apical shape and eccentric shape, which are common in pear shapes, reduce the appearance quality of pears. The poor surface color and defects directly affect consumer behavior. The following will introduce the designed features corresponding to each appearance quality index and the pear appearance quality grading method.

2.1. Pear Feature Extraction

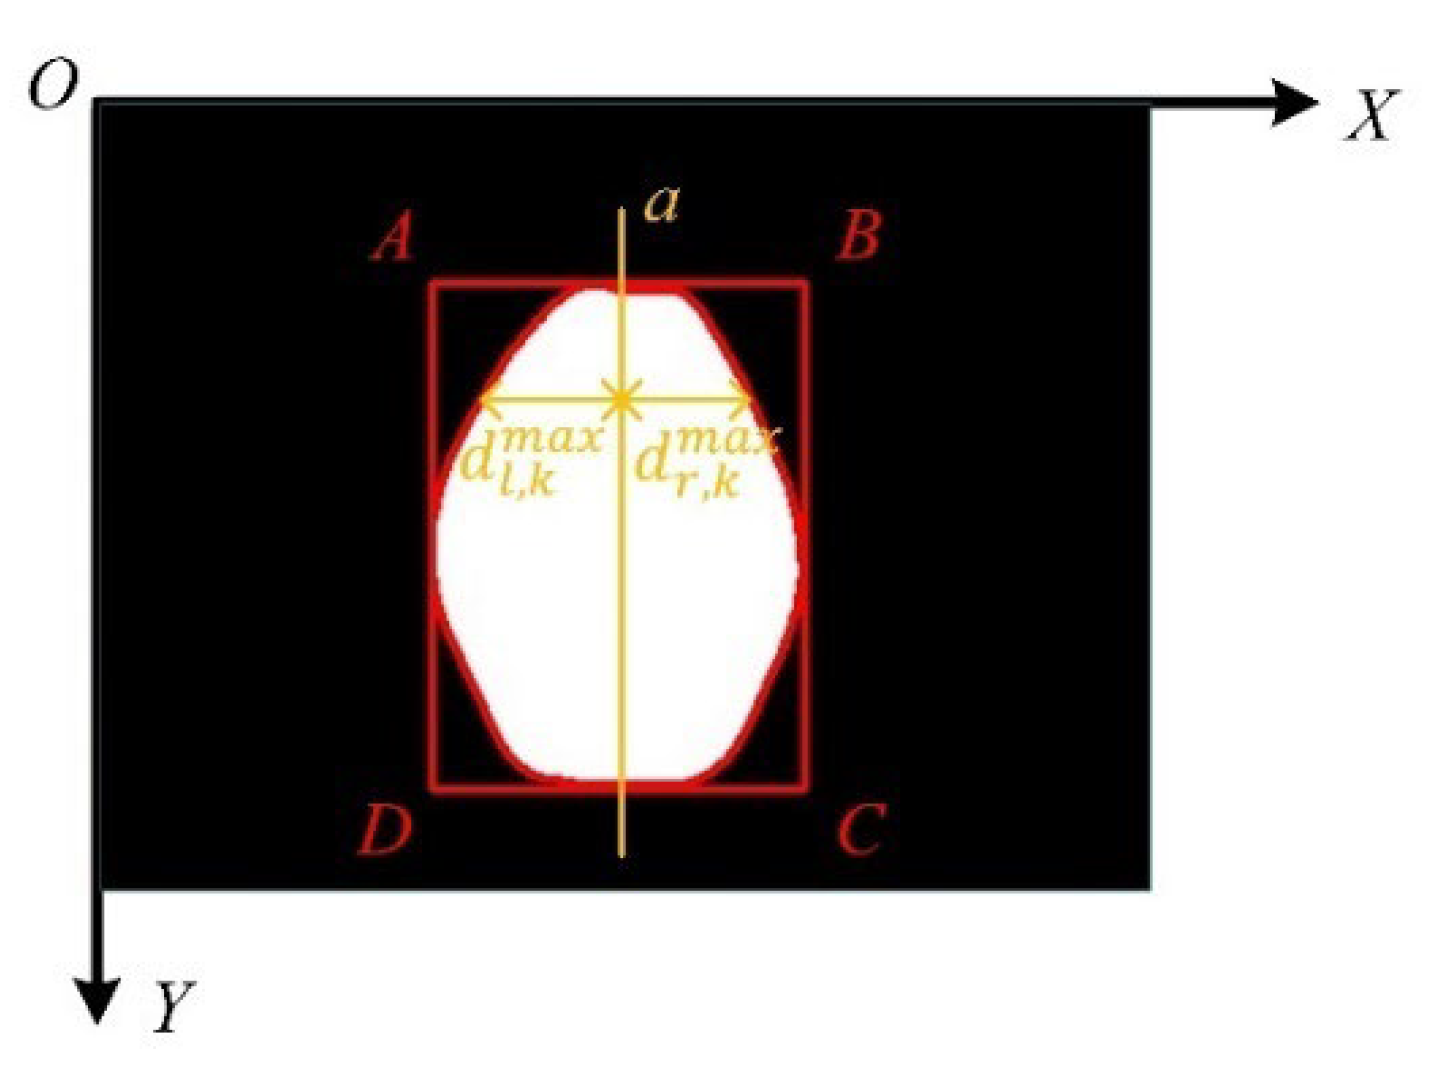
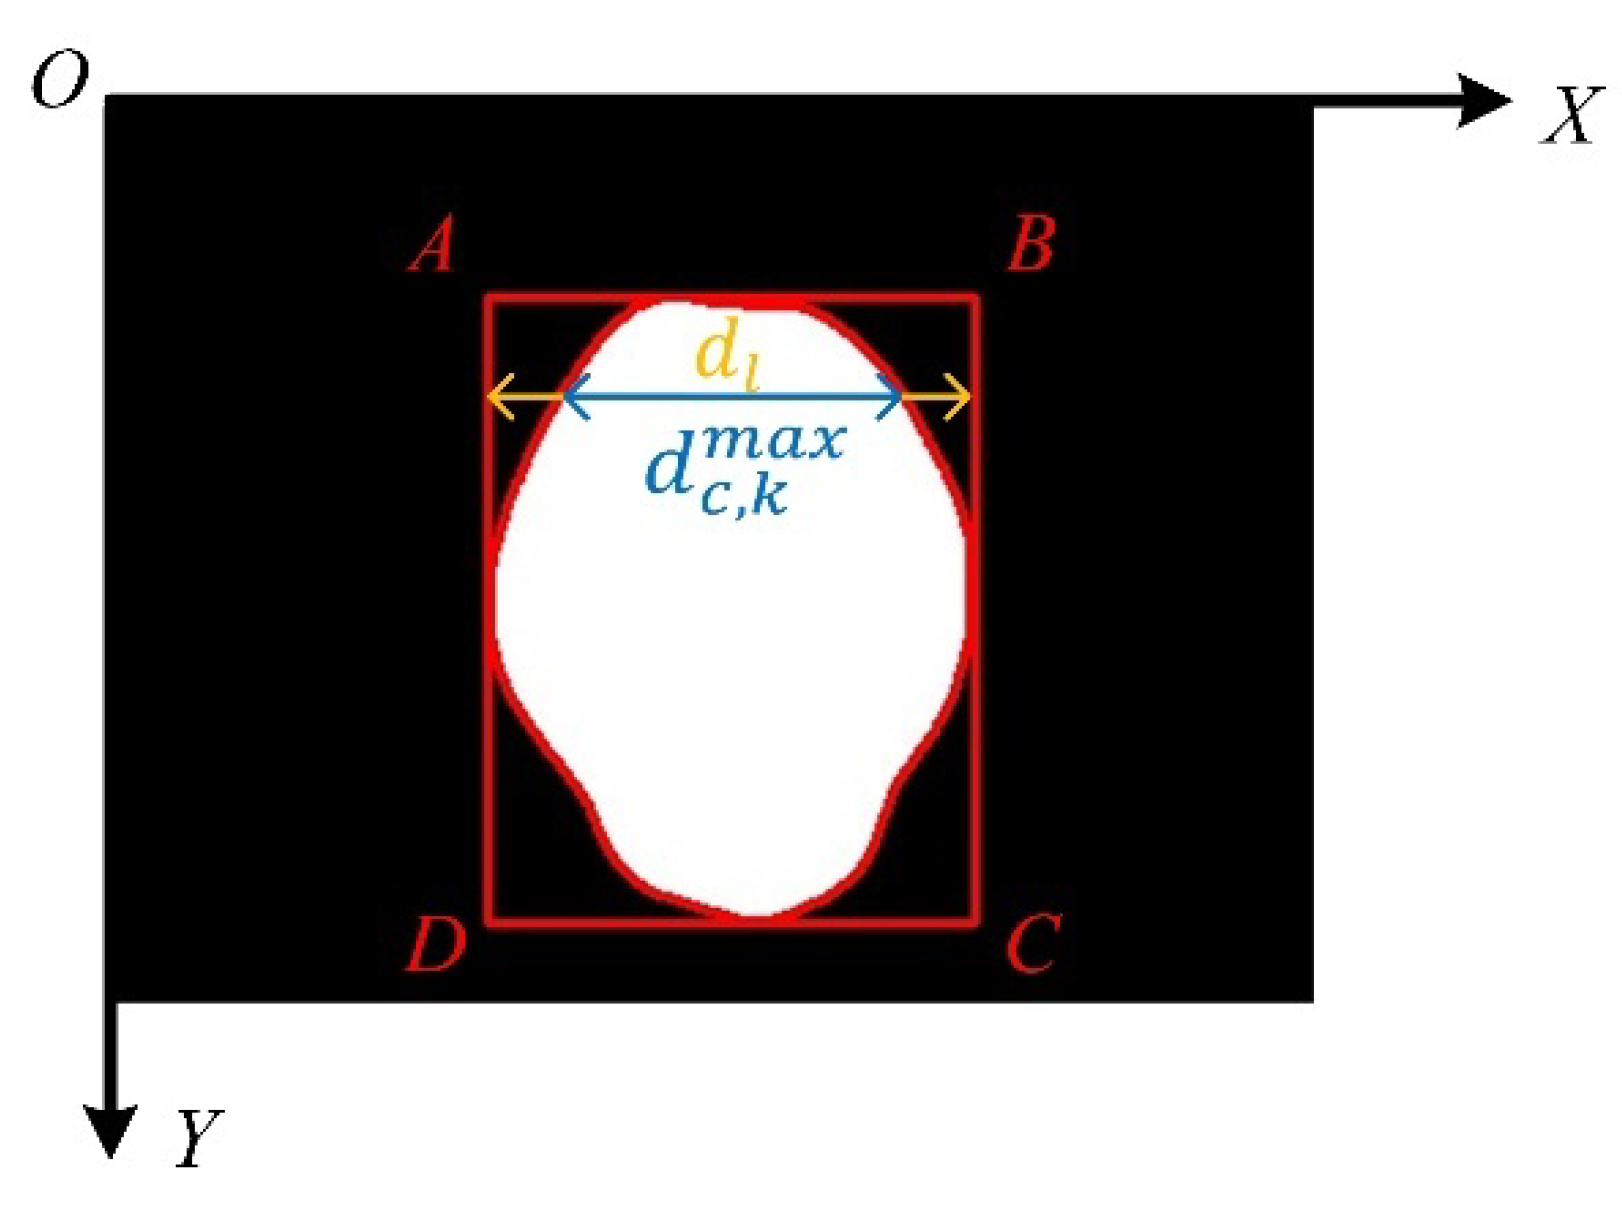
2.1.1. Pear Shape Feature Extraction

The proposed pear shape categories are standard shape, apical shape and eccentric shape, and the corresponding pear fruit shape images are shown in Figure 1. The symmetry feature and the quasi-rectangularity feature can distinguish the above three pear shapes. In Figure 2, the pear contour and the geometric outer rectangle A B C D have been drawn with red lines, and the straight line a is the midline of A B side. In the image coordinate system O X Y , the absolute value of the deviation of the pair of pixel points with the same vertical coordinate on the left and right half of the pear contour from the distance of the straight line a can reflect the symmetry of the pear contour, if there are more pixel points with the same vertical coordinate on the left and right half of pear contour, we take the pixel points with the largest distance from the straight line a for the calculation of the deviation, and the calculation is shown in Formula (1). In Figure 3, O X Y is the image coordinate system. The pear contour as well as the geometric outer rectangle A B C D have been drawn with red lines. The ratio between the distance between the horizontal coordinates of the pair of pixel points with the same vertical coordinates on the left and right half of pear contour and the wide side of the geometric outer rectangle of the pear contour can reflect the quasi-rectangularity of the pear contour, which is calculated as shown in Formula (2). Similarly, if there are more pixel points with the same vertical coordinate on the left and right half of pear contour, we take the pair of pixel points with the largest difference in horizontal coordinates to calculate.
C k = d l , k m a x d r , k m a x ,
R k = d c , k m a x d l ,
In the above formulas, k is the vertical coordinate of the point on the pear contour, d l , k m a x is the maximum distance between the pixel point with vertical coordinate k on the left half of pear contour and the line a . d r , k m a x is the maximum distance between the pixel point with vertical coordinate k on the right half of pear contour and the line a . d l is the length of the wide side of the geometric outer rectangle of the pear contour. d c , k m a x is the maximum value of the absolute value of the difference between the horizontal coordinates of a pair of pixels with the same vertical coordinate on the pear contour.

2.1.2. Pear Surface Color Feature Extraction

The surface color of a pear affects the consumer’s judgment of its taste and sweetness. The normal color of a mature Kulle balsam pear is cyan, slightly reddish, with black round fine spots on the skin. The pear color categories proposed are standard color and deviation color, as shown in Figure 4. As shown in Figure 4a, the peels of standard-colored pears are mainly cyan and slightly red, while the peels of off-colored pears are all cyan, as shown in Figure 4b. It can be seen that there are differences in color distribution between the standard color pear and deviant color pear. The acquired pear image has BGR three channels, in which the combination feature of the mean and variance of the pixel points in R channel and G channel can distinguish the pear surface color. The means values N R , N G and variances S R , S G of the R and G channels corresponding to the pear surface area are calculated as shown in Formulas (3)–(6).
N R = R N ,
N G = G N ,
S R = R 2 N N R 2
S G = G 2 N N G 2
In the above formulas, N is the total number of pixel points in the pear surface area, R and G are the values of each pixel point on the corresponding channels.

2.1.3. Pear Surface Defect Feature Extraction

The skin of pears is often damaged by external natural environment and mechanical friction, which reduces the commercial value of pears. The area of surface defects is an important factor affecting the appearance quality of the pear, which can correspond to the number of pixel points in the defective area of the pear image. The number of pixel points in the defective parts of the pear surface image are calculated as shown in Formula (7). It is stipulated that the area of mild defects is not more than 0.5   c m 2 . The area of moderate defects is not more than 1   c m 2 , and the area of serious defects is larger than 1   c m 2 .
S d e f e c t = m n f x , y ,
In the above formula, f x , y is the binary image of the pear surface defect. m and n are the number of pixels in the defect area along the coordinate axes of the image coordinate system.
In order to further investigate the categories of pear surface defects, it is proposed to classify the categories of pear surface defects into stabbed defects, bruised defects, abraded defects and rusty defects. The appearance of defects is shown in Figure 5. Pear species can be distinguished according to the texture features of surface defects. Here, the angular second-order moment (ASM), contrast, inverse difference matrix (IDM) and entropy in the GLCM features of the defect area are selected and calculated as shown in Formulas (8)–(11).
i j P i , j 2 ,
i j i j 2 P i , j
i j P i , j 1 + i j 2
i j P i , j log P i , j
In the above formulas, i , j is the pixel point that deviates from the pixel point x , y in the grayscale image g x , y of the pear surface defect by a certain distance, and P i , j is the probability of occurrence of the corresponding grayscale value of the pixel point i , j in the whole grayscale image.

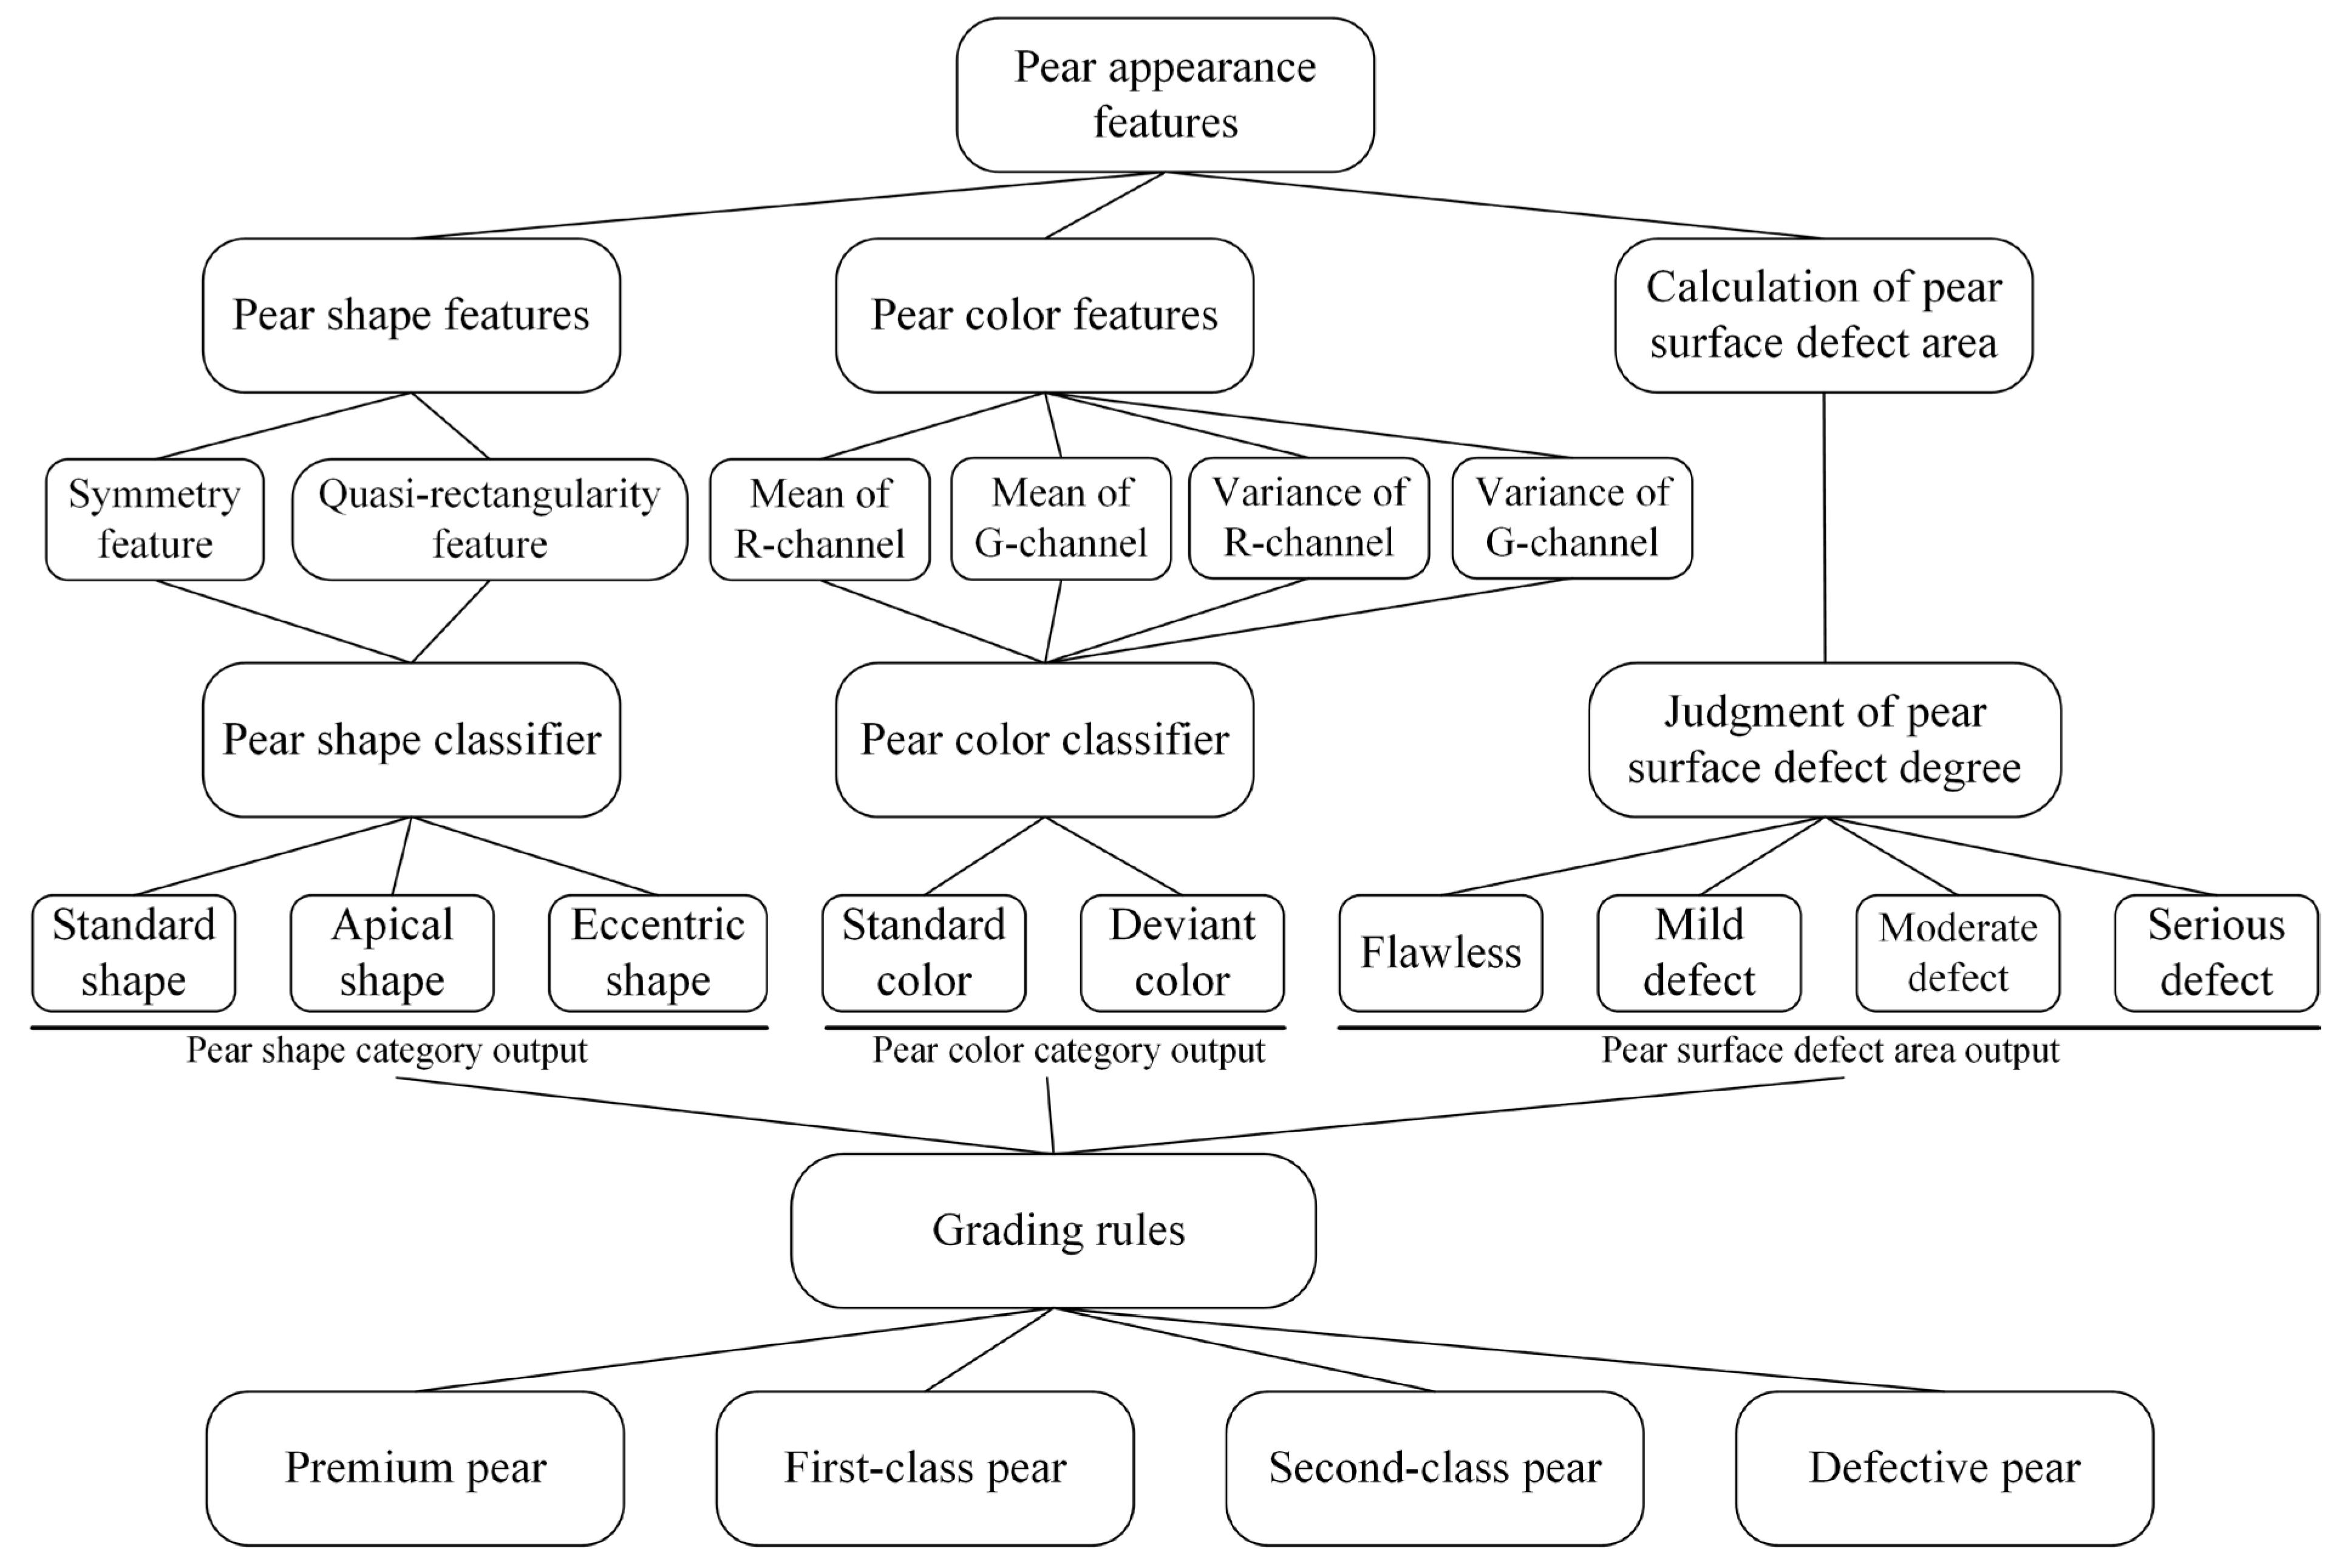
2.2. Pear Grading Method

Referring to the national standard for pear appearance quality grading GBT10650-2008, an intelligent grading method for pear appearance is proposed based on pear shape, surface color and defect information. The pears are divided into four categories: “premium pear”, “first-class pear”, “second-class pear” and “defective pear”. As shown in Figure 6, the main difference between “premium pear” and “first-class pear” is whether the pear shape is standard, the main difference between “first-class pear” and “second-class pear” is whether the pear surface color is standard, and the “second-class pear” and “defective pear” are mainly distinguished by the area of pear surface defects. In fact, this grading rule can be changed according to the requirements of users to achieve more standard grading of pears.
The specific implementation steps of pear appearance quality grading method are as follows:
Step 1:
Obtain pear shape features and train classifier;
Step 2:
Obtain pear surface color features and train classifier;
Step 3:
Input the test set of pear shape features and color features into the trained classifier to predict the pear shape category and color category;
Step 4:
Obtain the pear defect area, and judge the pear defect degree;
Step 5:
Judge the pear appearance quality category according to the output results of each classifier and the grading rules.
In this study, the relatively simple and effective classifiers were used to test the effectiveness of the above features for correct classification. In view of the advantages of BP neural network, such as strong nonlinear mapping ability, generalization ability, clustering analysis ability, parallel information processing ability and flexible network structure, BP neural network was used to identify the categories of pear shape and surface defect. Due to the good generalization performance of SVM and the binary classification of pear color, it is proposed to use SVM to classify the surface color of pears.

2.2.1. Classification Method of Pear Shape and Surface Defect

The neural network is a system that mimics the structure and function of the human brain and processes information through mathematical methods. The nodes in the neural network are called neurons. Each neuron has n inputs X i with weight W i . All the inputs received by the neuron i = 1 n X i W i will be linearly combined with the neuron threshold term θ . Then the linear combination is mapped by the activation function f , and the final output of each neuron is O = f i = 1 n X i W i + θ . Currently, the feedforward neural networks trained by back propagation algorithms are often used. In the feedforward neural network, there is no interconnection between the neuron nodes in each layer except for the neuron nodes between layers. The feedforward neural network model is shown in Figure 7, and the BP neural network consists of an input layer, a hidden layer, and an output layer [18]. The training process includes forward and backward phases. In the forward training phase, the feature vectors are input into the neural network and the loss function is calculated, and in the backward training phase, the deviation between the prediction result and the correct result is compared, and the weights of the network are updated based on this until the training process is completed.
For the pear shape BP neural network classifier, the model structure is shown in Figure 7. The algorithm steps are as follows.
Step 1:
Preprocess the collected pear appearance images to obtain the pear contour binary image.
Step 2:
Set the number of sampling points and then extract the symmetry feature and quasi-rectangularity feature of the pear shape contour.
Step 3:
Set the BP neural network hyperparameters and input the training set to complete the training of the pear shape classifier.
Step 4:
Input the test set into the trained model to test the classification performance.
For the pear surface defect BP neural network classifier, the model structure is shown in Figure 8, and the algorithm steps are as follows.
Step 1:
Preprocess the collected pear appearance images and segment the pear surface defect area images.
Step 2:
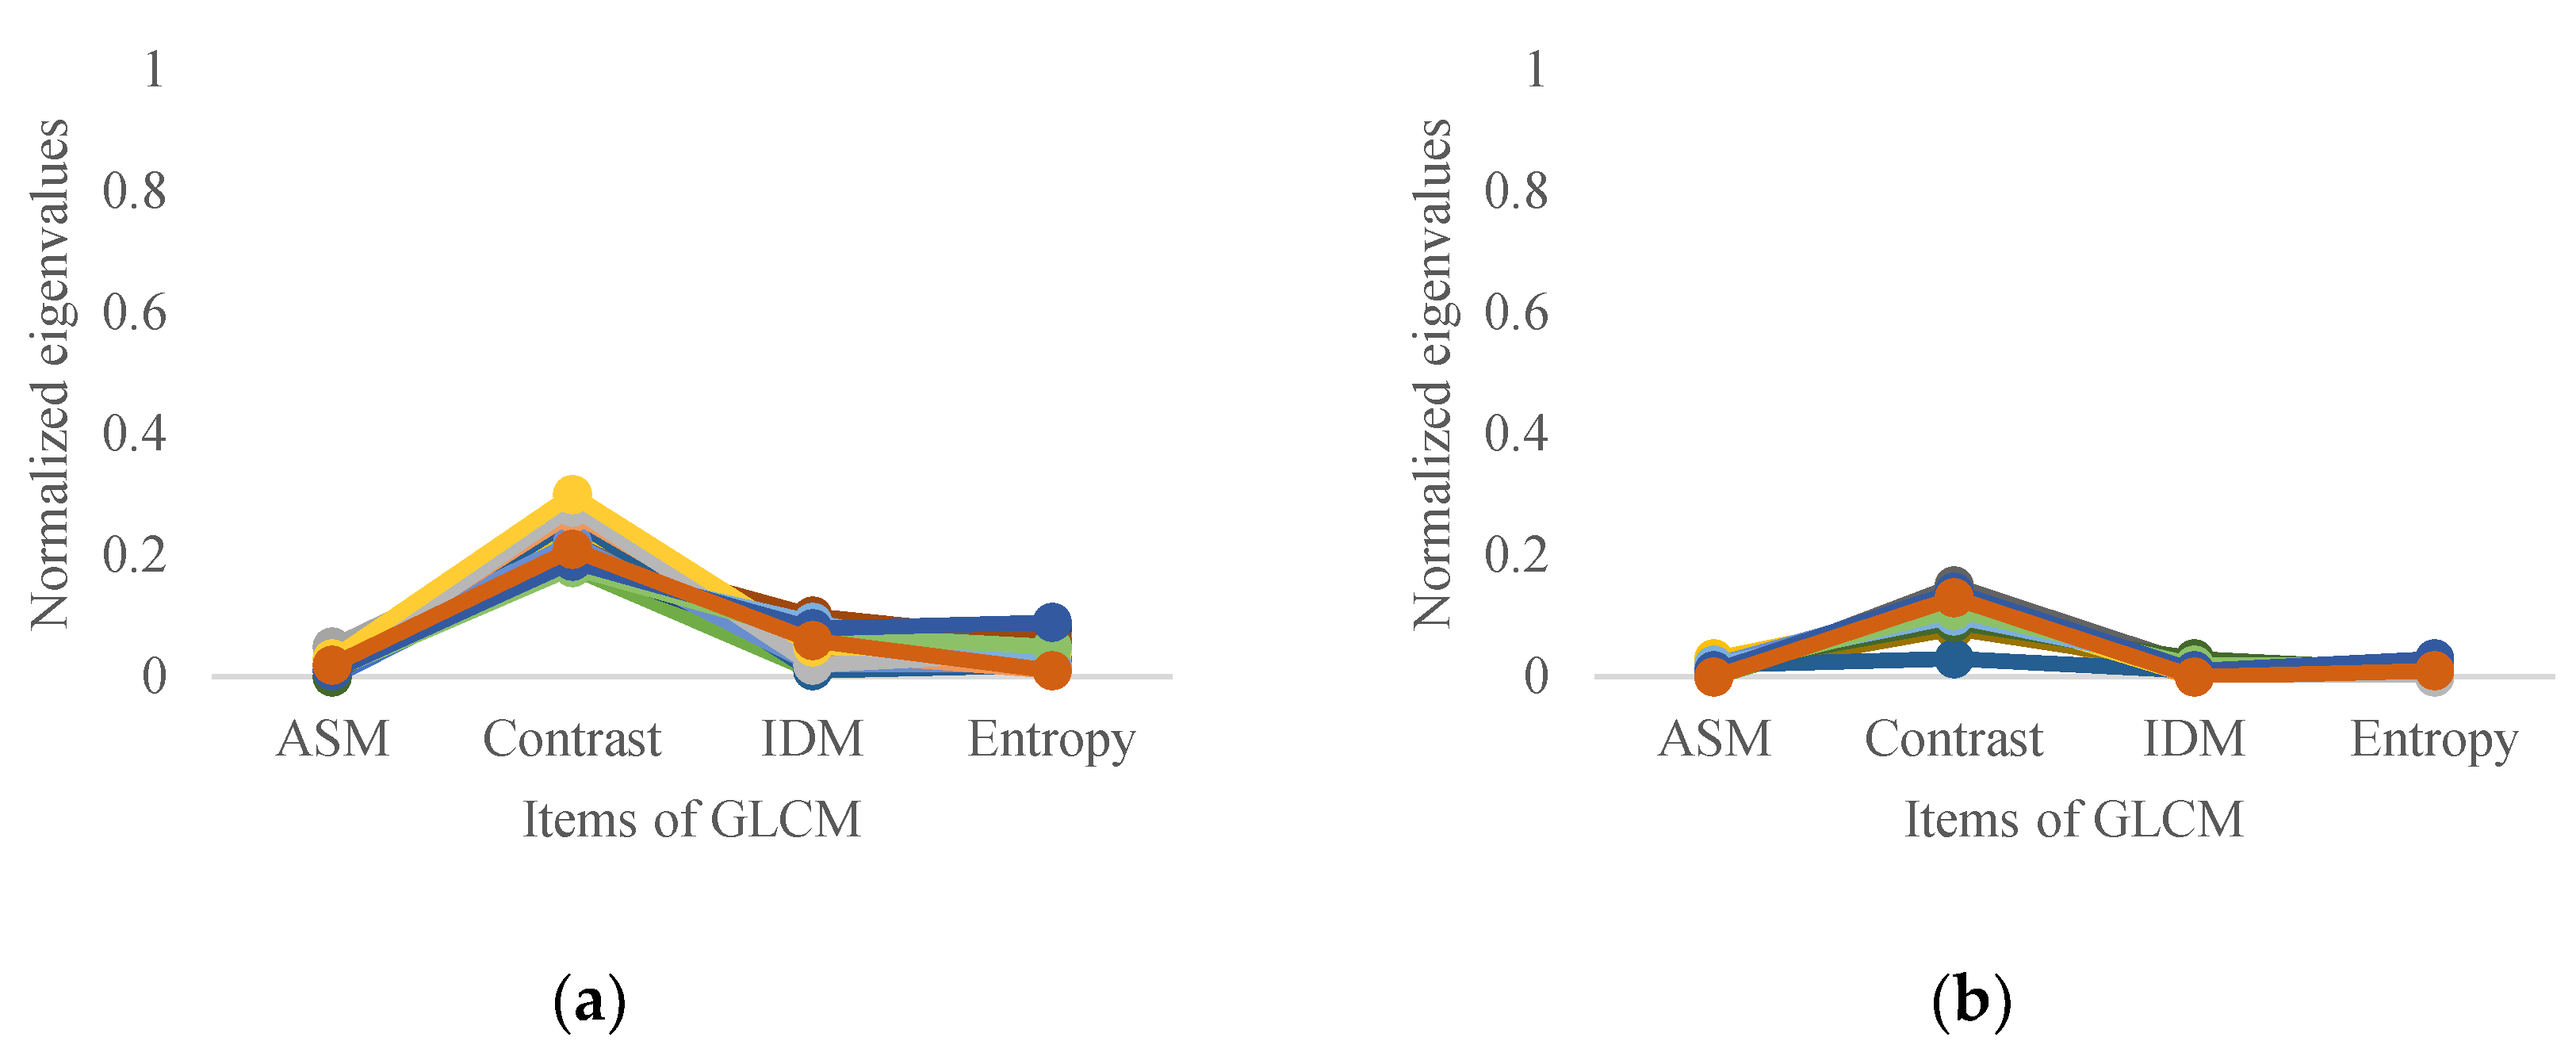
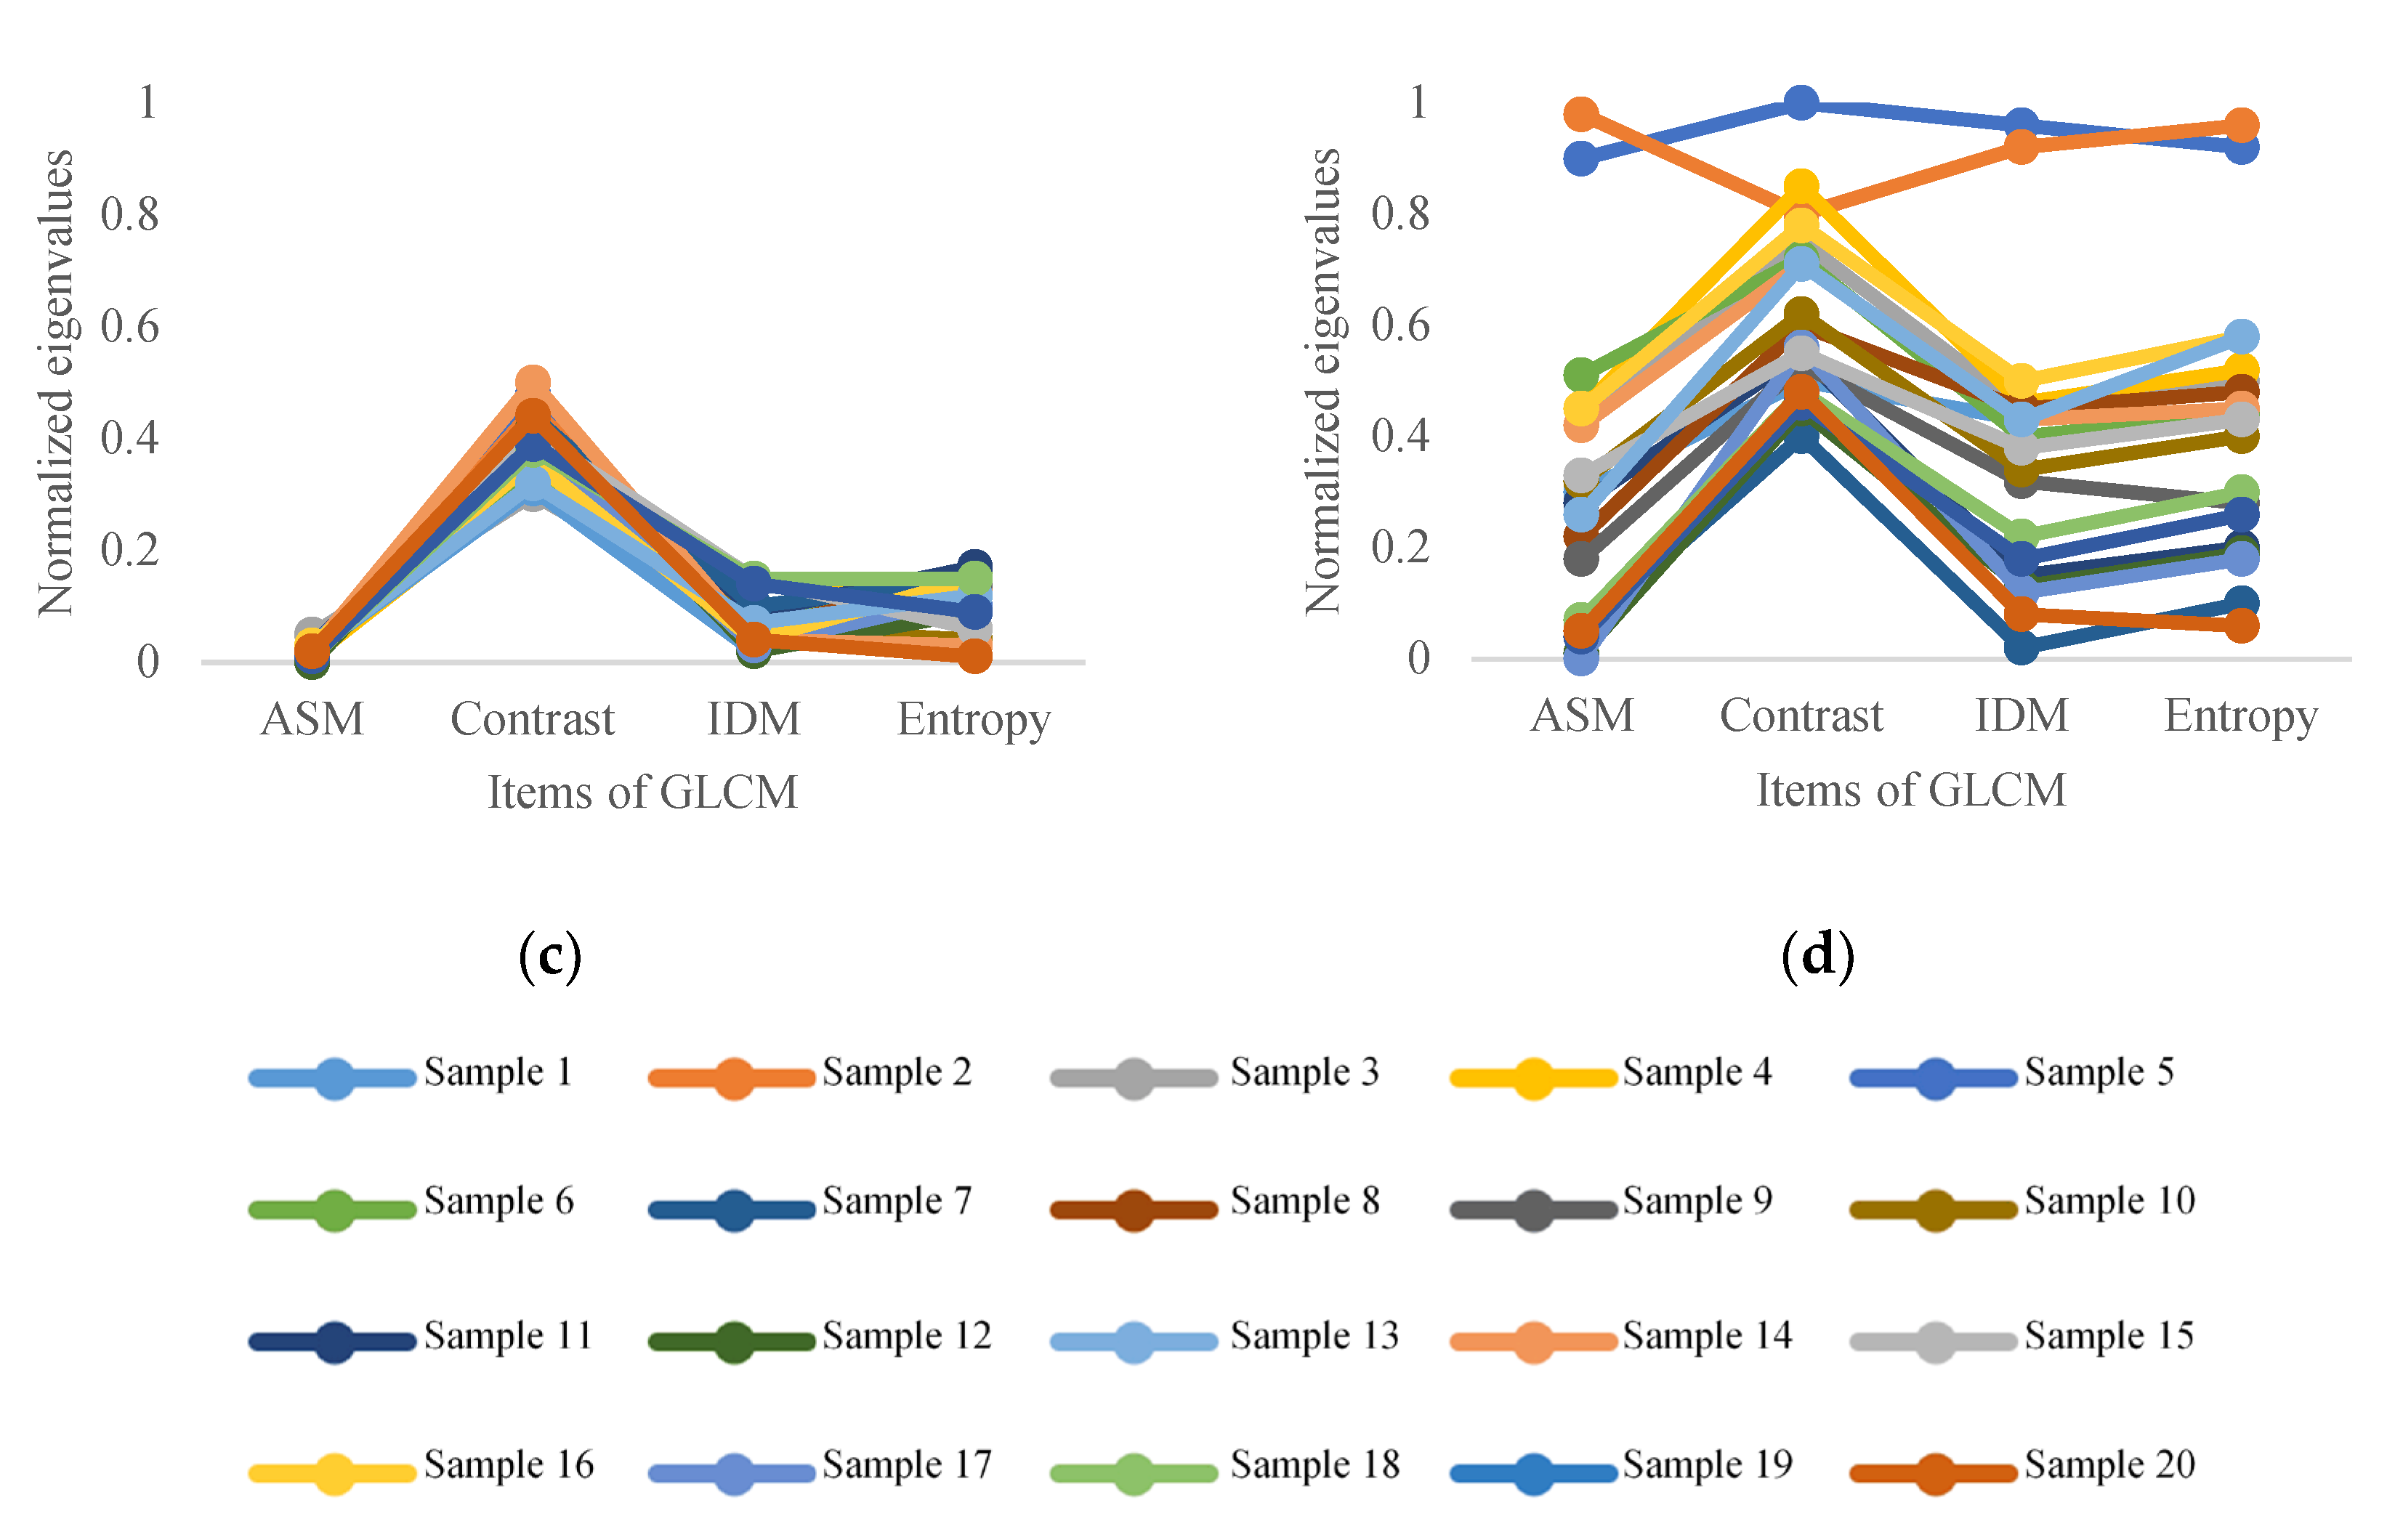
Extract the ASM, contrast, IDM and entropy features of the pear surface defect region.
Step 3:
Set the BP neural network hyperparameters, and input the training set to complete the training of the pear surface defect classifier;
Step 4:
Input the test set into the trained model to test the classification performance.

2.2.2. Classification Method of Pear Surface Color

SVM is a binary classification model trained on the basic idea of solving a separating hyperplane that can correctly distinguish data categories and with maximum geometric spacing. Due to the use of kernel skill, SVM can be used not only for linear classification, but also for nonlinear classification [19,20]. The process of using this algorithm is divided into two phases: training and testing. The training process of SVM is essentially to find the appropriate penalty factor C and parameter g a m m a . The role of penalty factor C is to balance the classification interval and the number of misclassified samples. The parameter g a m m a is the coefficient of the kernel function. These two hyperparameters are determined by the grid search method. The algorithm steps are as follows.
Step 1:
Preprocess the collected pear appearance images and segment the pear surface image.
Step 2:
Extract the R and G channel means and variance features of the pear surface images.
Step 3:
Set the parameter range of the grid search method and train the SVM using the training set.
Step 4:
Input the test set into the trained SVM to test the classification performance.

2.2.3. Grading Rules

After the pear shape and surface color classifier models are trained, the pear shape and surface color category can be predicted according to the input features. The pear surface defect degree can be judged according to the area size of the pear surface defects. The grading rules are as follows.
Rule 1:
If the pear shape classifier outputs the standard shape category, the pear surface color classifier outputs the standard color category, and the pear surface is judged to be free of defects, then the final output of pear appearance quality category is “premium pear”.
Rule 2:
If the pear shape classifier outputs any shape category, the pear surface color classifier outputs the standard color category, and the judgment of the pear surface defect degree is mild or below, then the final output of pear appearance quality category is “first-class pear”.
Rule 3:
If the pear shape classifier outputs any fruit shape category, the pear surface color classifier outputs any color category, and the degree of pear surface defects is judged to be medium or below, then the final output of pear appearance quality category is “second-class pear”.
Rule 4:
If the pear shape classifier outputs any shape category, the pear surface color classifier outputs any color category, and the judgment of the pear surface defect degree is serious, then the final output of pear appearance quality category is “defective pear”.

3. Experiments and Results

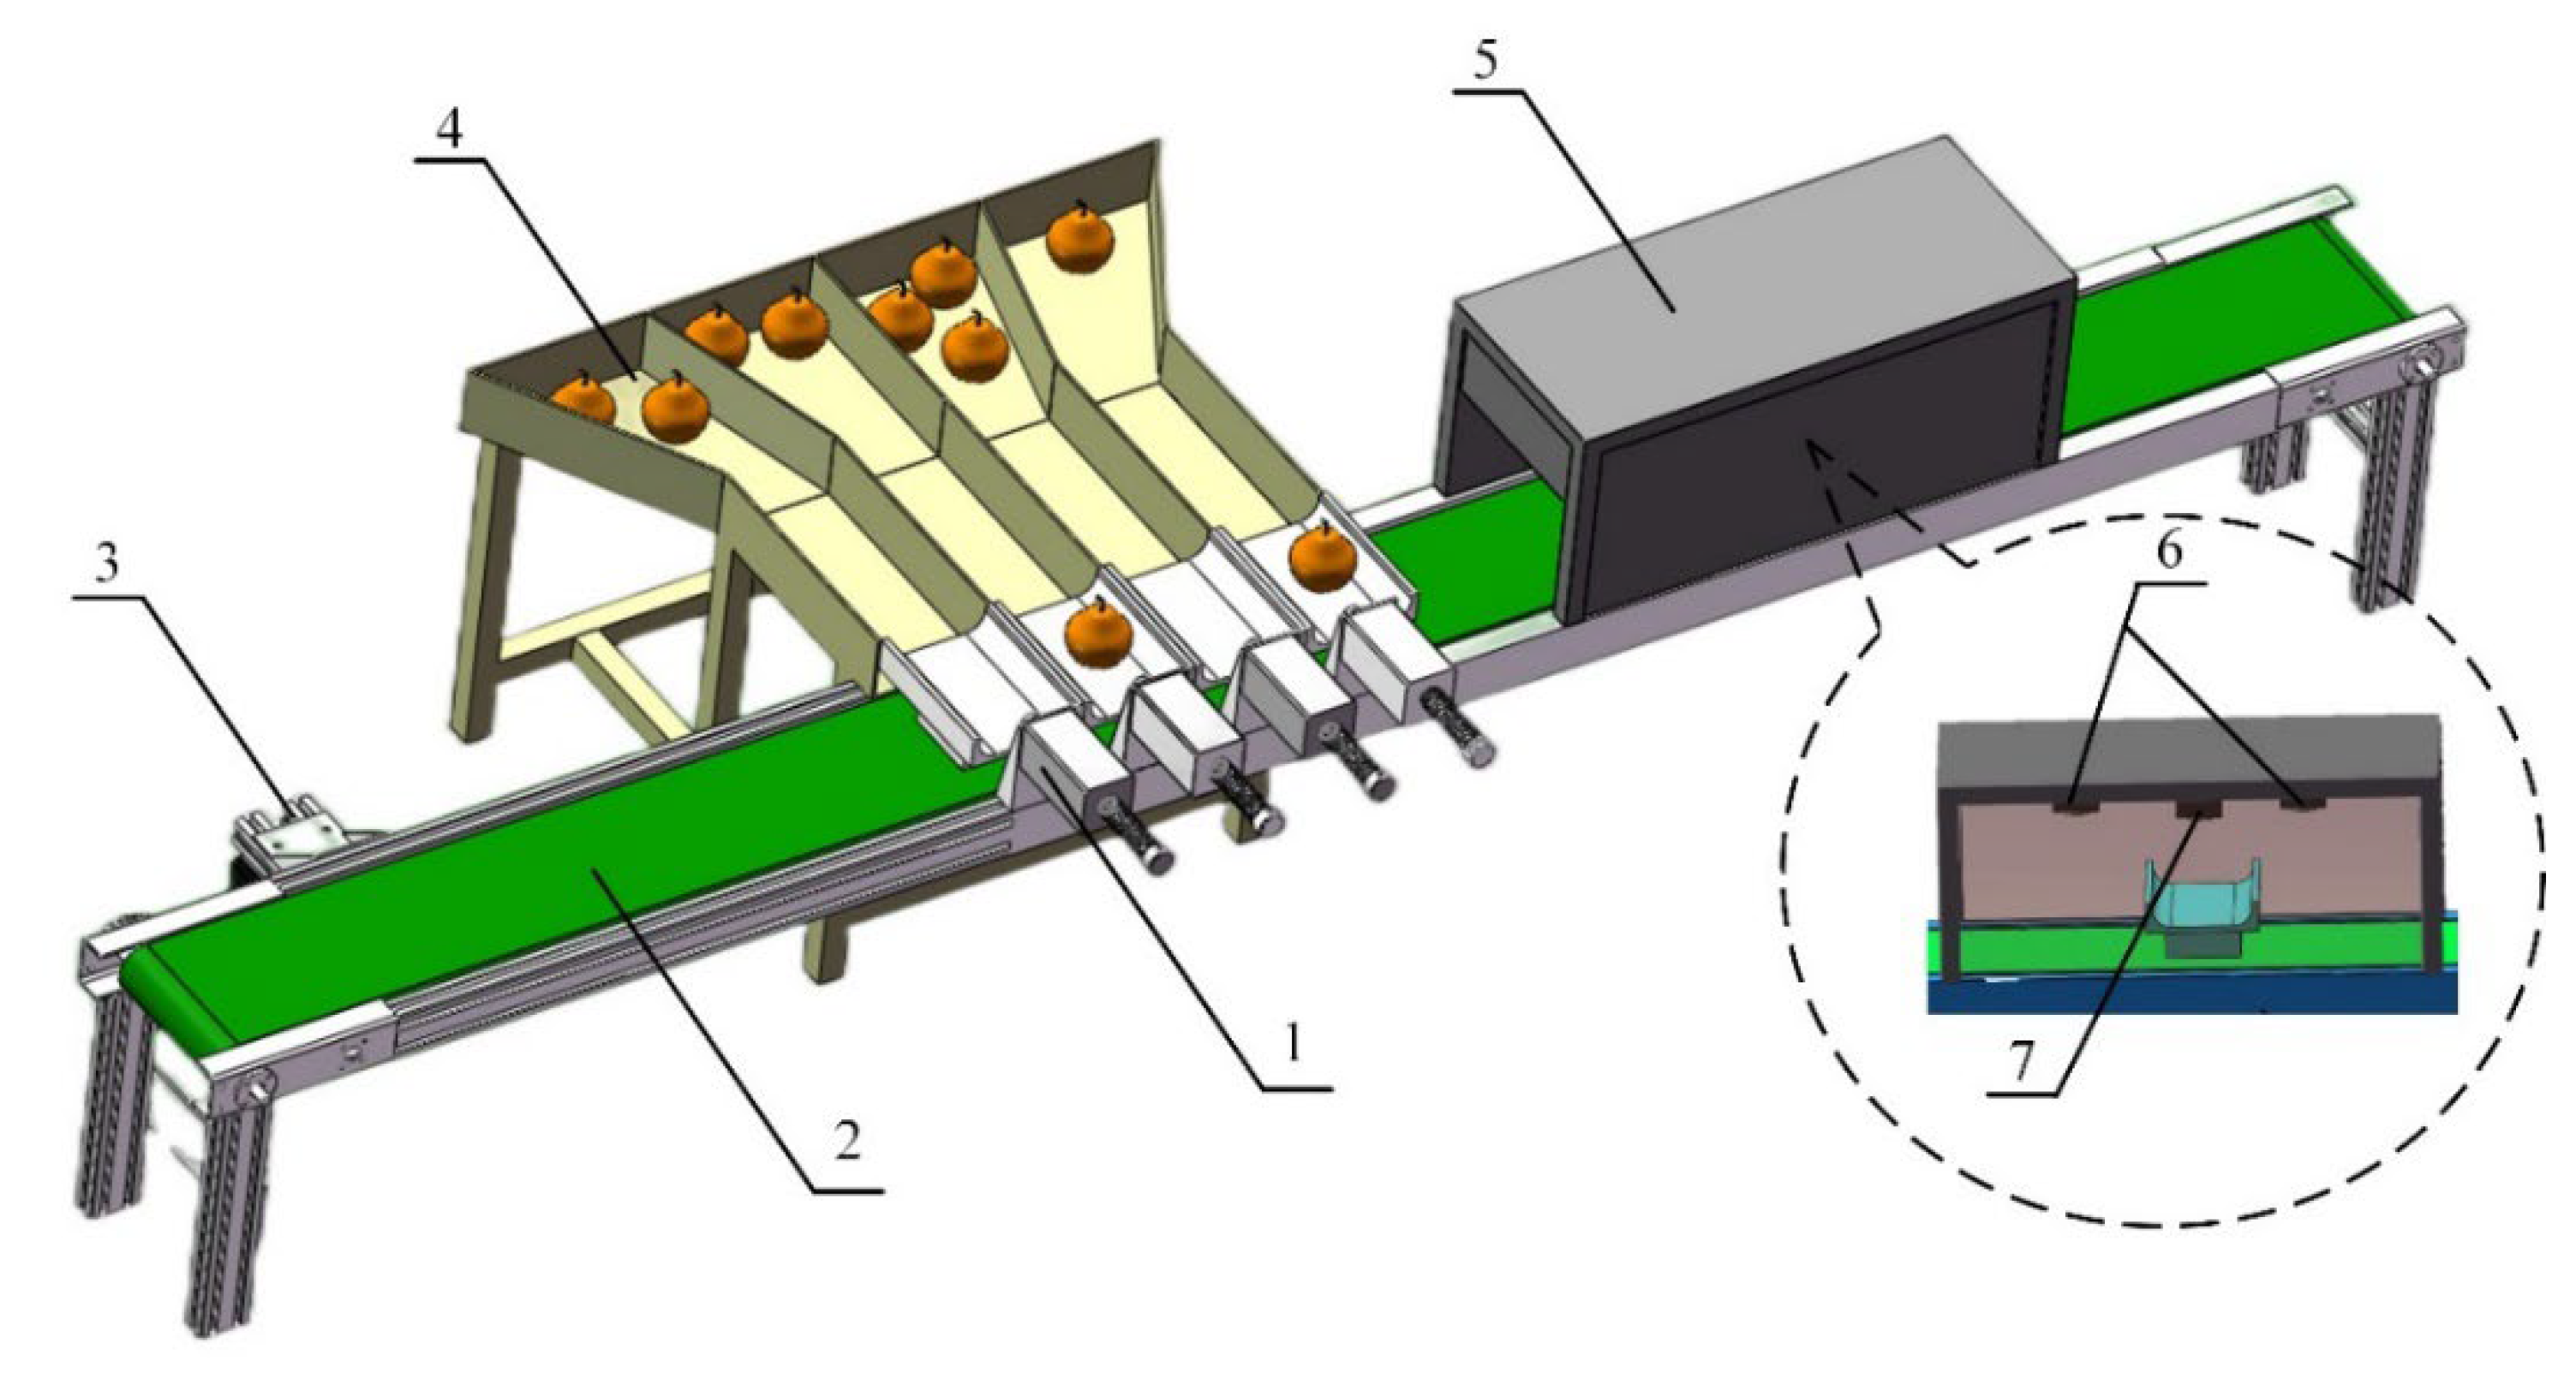
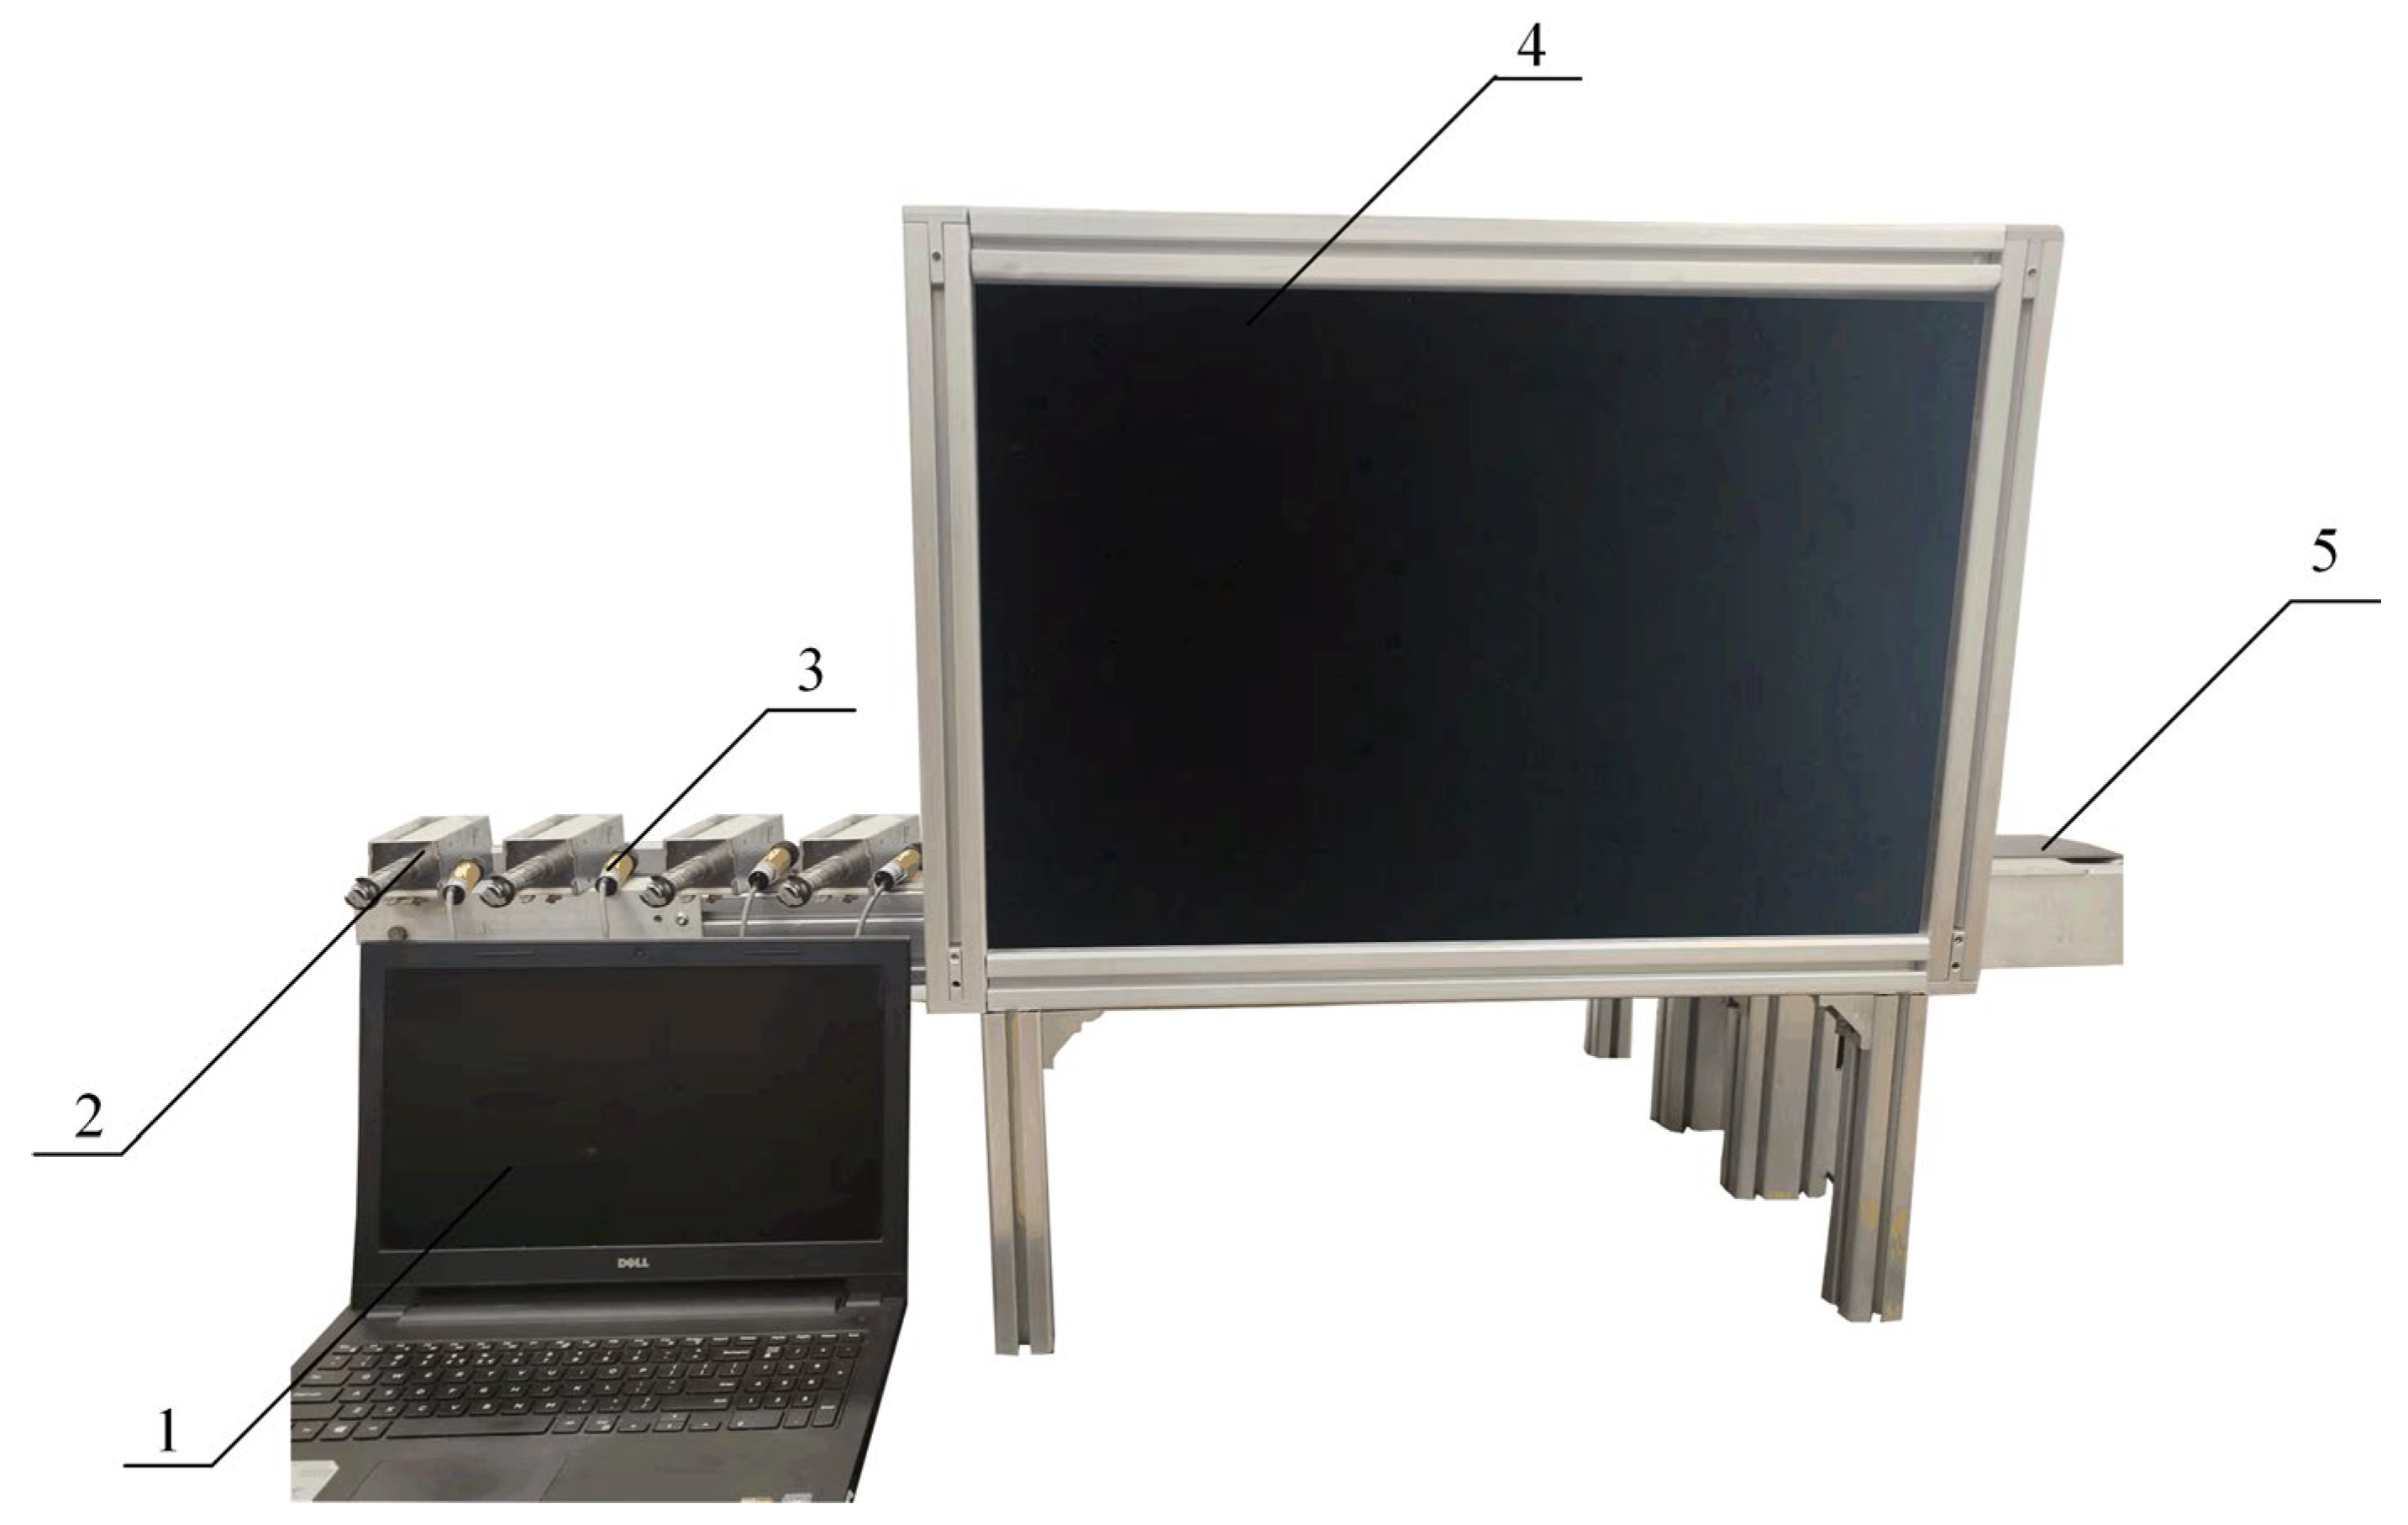
3.1. Image Acquisition and Grading System

In general, the implementation of fruit grading algorithm needs to build an image acquisition system firstly [21]. This simple image acquisition system can only realize the image acquisition function but it cannot grade fruits according to the results of the classification algorithm. In this study, the designed experimental hardware system can simultaneously realize image acquisition and subsequent sorting functions.
The appearance of the designed pear appearance quality detection and grading system is shown in Figure 9. The step motor drives the conveyor, and the pears reach the image acquisition place to complete the appearance image acquisition. The sorting function of the device is realized by the push-pull electromagnets, which can push the pears into the corresponding pear storage boxes.
The composition of the whole hardware system is shown in Figure 10, which contains the transfer unit, the position detection unit, the image detection unit, the sorting unit, the control input unit and the power supply module. The image acquisition unit is a dark box made of black Arthur acrylic board, which can avoid the interference of external light. The LED light source and CCD camera are arranged inside the dark box to obtain pear images. The sorting unit adopts push-pull electromagnets. The schematic diagram of push-pull electromagnet sorting is shown in Figure 11. When the pear reaches the position sensor at the corresponding categories in the sorting area, the normally open (NO) contact of the relay in the control circuit of the push-pull electromagnet is closed, and the action of the push-pull electromagnet will push the pear into the corresponding storage box. The working flow of the designed device during the grading of the pear is shown in Figure 12.
An experimental prototype as shown in Figure 13 was built. The relevant hardware parameters are shown in Table 2.
The pear appearance quality grading software was developed for the designed hardware system. The flow of the grading software is shown in Figure 14.

3.2. Image Acquisition and Preprocessing

Using the built hardware device for pear appearance image acquisition. The number of images in different categories under the three grading indexes of pear shape, color and surface defects are shown in Table 3. The images are labeled by professionals. The labels of each pear image include shape label, color label, surface defect label and appearance quality label. The obtained data set is divided into training set and test set according to the ratio of 8:2. As can be seen from the number of samples in different categories reflected in Table 3, the samples of this classification task are roughly balanced.
The obtained images need to be preprocessed. For the analysis of pear shape features and color features, the complete pear surface image needs to be obtained. For the analysis of pear surface defect features, it is necessary to obtain the image of surface defects. The preprocessing process is shown in Figure 15. The original image (Figure 15a) is grayed to obtain the grayed image (Figure 15b). The Ostu threshold segmentation technique is used to segment the pear contour to obtain Figure 15c. The segmented pear contour image is morphologically processed to remove noise and stem parts, and the pear surface area mask (Figure 15d) is finally obtained. The pear surface area mask and the original image are Boolean operated to obtain the pear surface area (Figure 15e). The pear surface area image is grayed to obtain Figure 15f. The pear surface defect contour image (Figure 15g) with noise is obtained by threshold segmentation again. After morphological operation and contour screening, the pear surface defect mask (Figure 15h) is obtained. The pear defect area is obtained by Boolean operation between the mask image and the original image (Figure 15i).
In the above image preprocessing process, the pear surface area image obtained by the first threshold segmentation can be used to analyze the pear shape and color features. The pear defect area image obtained by the second threshold segmentation can further analyze the pear surface defect features.

3.3. Feature Analysis

The symmetry and quasi-rectangularity features of pear shape grading index were extracted. The R and G channel mean and variance features were extracted for the color grading index, and the ASM, contrast, IDM and entropy in the GLCM features were extracted for the pear surface defect grading index. If the extracted features perform well, they can produce a good distinction between different categories under the grading indexes.
For pear shape features, the symmetry feature comparison of the standard shape as well as the eccentric shape and the quasi-rectangularity feature comparison of the standard shape as well as the apical shape are shown in Figure 16. Comparing Figure 16a,b, it can be seen that the pair of pixel points with the same vertical coordinate in the left and right half of pear contour of the standard shape have approximately the same distance from the center line, so the two curves have a high degree of overlap. While the opposite is true for the eccentric shape, where the pair of pixel points with the same vertical coordinates in the left and right half of pear contour of the eccentric shape have a certain difference from the center line, so the two curves have a poor overlap. Comparing Figure 16c,d, the parts of the red curves framed by the green boxes are the significant distinction between the standard shape and the apical shape. The reason why the curves change so much is that the apical shape contour suddenly shrinks near the calyx. Moreover, there is also a difference between the two pictures in the red curve framed by the yellow boxes. The slope of the curve framed by the yellow box representing the apical shape is larger than that of the standard shape, because the apical shape contour expands faster closer to the pear stalk. Therefore, the designed symmetry feature and quasi-rectangularity feature can theoretically distinguish the standard shape, apical shape and eccentric shape.
In terms of pear grading with color, the BGR three-channel color histograms of the standard color and deviant color pear images are shown in Figure 17, which shows that the distribution range of the green component pixel values of the standard color pear image is narrower and the mean of pixel value is smaller than that of the deviant color pear image. However, the distribution range of the red component pixel value of the standard color pear image is wider than that of the deviant one. This is consistent with the human eye’s judgment of pear color.
Through the image preprocessing operation in Section 3.2, it can be concluded whether the pear has surface defects. However, the types of defects still cannot be distinguished. The GLCM feature of the pear surface defects were extracted, and 20 samples were randomly selected from the feature vectors of each category, which were reflected in Figure 18. The ASM, contrast, IDM and entropy eigenvalues of the rusty defect are larger than those of the stabbed defect, bruised defect and abraded defect, and they are more widely distributed in the [0,1] interval. The contrast eigenvalue of the abraded defect is larger than that of the stabbed defect and bruised defect, and the contrast eigenvalue of the stabbed defect is larger than that of bruised defect. In summary, the GLCM features of the defective region of pear surface can be used to distinguish the defect types well in theory.

3.4. Classification and Performance Evaluation

3.4.1. Classification Implementation and Hyperparameter Setting

The BP neural network was used to classify the categories of pear shapes and surface defects, and the SVM was employed to classify the categories of pear surface colors. The hyperparameters are shown in Table 4. When classifying the categories of pear shapes, 50 sampling points were taken for calculating the symmetry and quasi-rectangularity features respectively. The grid search method was used to find the optimal hyperparameters for pear surface color classification. The above training process was performed on a computer with Intel Core i7-6700HQ CPU, 8GB of memory, NVIDIA GeForce GTX960 video card, and Python 3.6 development platform with Keras and scikit-learn.

3.4.2. Classification Performance Evaluation

The accuracy, weighted average recall, weighted average precision and weighted average F1-score were calculated to evaluate the classification performance of each classifier. The above four classification performance evaluation indicators were calculated from the confusion matrix of each classifier. The recall, precision and F1-score of each category are calculated as shown in Formula (12)–(14).
r e c a l l i = T P i T P i + F N i
p r e c i s i o n i = T P i T P i + F P i
F 1 - s c o r e i = 2 × p r e c i s i o n i × r e c a l l i p r e c i s i o n i + r e c a l l i
In the above formulas, T P i denotes the number of samples that actually belong to category i and are predicted to be category i . F N i represents the number of samples that actually belong to category i but are not predicted to be category i , and F P i denotes the number of samples that actually do not belong to category i but are predicted to be category i .
The accuracy is calculated as shown in Formula (15). The weighted average recall, weighted average precision and weighted average F1-score are the average of the recall, precision and F1-score of each category. The calculation method is shown in Formula (16)–(18), where I is the number of categories and A is the total number of samples in the test set.
a c c u r a c y = i = 1 I T P i A
r e c a l l = i = 1 I r e c a l l i I
p r e c i s i o n = i = 1 I p r e c i s i o n i I
F 1 - score = i = 1 I F 1 - s c o r e i I
Table 5 shows the values of each classification performance evaluation indicator of the pear shape, color, and surface defect classifiers. The running times of each classifier are also illustrated in Table 5. To further track the misclassified samples, the confusion matrixes of the three classifiers were drawn, as shown in Figure 19a–c. According to the grading rules, the pear appearance quality grading was carried out, and the pear shape, color and surface defects were integrated. The confusion matrix of grading results is shown in Figure 19d.

3.4.3. Discussion

By analyzing the features extracted from the three grading indexes of pear shape, color and surface defect in Section 3.3. It can be seen that the extracted features can distinguish the categories under the three grading indexes. In order to further verify the classification performance, the design of the classifier and the evaluation of the classification performance were carried out. As can be seen from Table 5, the accuracy of three classifiers is above 75%, among which the pear surface color classifier has the best classification performance. And the performance of the surface defect classifier needs to be improved compared with the remaining two. The confusion matrix is used to track the misclassified samples. According to Figure 19a, some pear shapes are incorrectly classified. The reason may be that the image labeling is based on the actual overall shape of the pear, while the classification is based on a certain surface image of the pear, and the two may not be consistent. The misclassification of color categories may also be caused by the inconsistency between the overall color of the pear and the color of a surface of the pear (Figure 19b). In addition, the misclassification of pear shape and color may also be the result of insufficient discrimination of the designed features. For the misclassification of pear surface defect categories (Figure 19c), according to the analysis of the defect features in Section 3.3, the discrimination of some defect feature values is insufficient, which may be the reason for the misclassification of defect types. The pear appearance quality classification (Figure 19d) is finally determined by the output results of pear shape classifier, surface color classifier and the calculation of the defect area.

4. Conclusions

In this study, according to the classification standard of pear appearance quality, the corresponding features were designed and analyzed. Based on the three classification indexes of pear shape, surface color and surface defect, the features of distinguishing different categories were used for classifier training. In terms of pear shape, pear contour symmetry and quasi-rectangularity features were proposed to distinguish pear standard shape, apical shape and eccentric shape. The BP neural network classifier was trained and the classification accuracy reached 83.3%. In terms of pear surface color, the categories of pear color were divided into standard color and deviant color according to the color distribution when the pear was mature. The means and variances of G and R channel pixel values were extracted as features to train the SVM classifier and the classification accuracy reached 91.0%. In the aspect of pear surface defects, the size of defect area was used as the reference index of quality grading. In order to further distinguish the types of defects, the GLCM feature of pear surface defects was extracted and used for the training of the BP neural network, and the accuracy reached 80.5%. For the quality grading of pear appearance based on the three indexes of pear shape, surface color and defects, the accuracy reached 80.5% according to the grading rules. In this study, pear appearance quality grading was divided into several grading indexes. For the grading object of pears, the grading connotation is more abundant and comprehensive, which has certain positive significance for improving the grading efficiency of pear appearance quality and overcoming the shortcomings of strong subjectivity of manual grading. However, there are also some problems in the grading algorithm designed in this paper, such as the use of multiple classifiers in the classification process, which leads to the efficiency and accuracy to be further improved. In the future work, it is proposed to extract the features of the image set according to the pear shape, color and surface defects, make the category label of pear appearance image according to the factor analysis method, and use deep learning technology to grading pear appearance quality to overcome the shortcomings of low efficiency of multiple classifiers.
Moreover, the designed pear appearance quality grading system can realize the collection of pear appearance images, the grading of pear appearance quality, and can be used to verify the pear appearance quality grading algorithm in this paper. The designed system includes the transfer unit, the position detection unit, the image detection unit, the sorting unit, the control input unit and a power supply module. The sorting unit uses the push-pull electromagnets to perform the sorting function simply and reliably, which can basically meet the requirements of pear appearance quality detection and grading. It has certain reference significance for the future development of pear detection pipeline. However, there is still the disadvantage of not being able to obtain the full surface image of the pear. In the future work, more ingenious mechanical structures can be designed or multi-camera and image synthesis technology can be used as further improvement measures.

Author Contributions

Z.Y.: conceptualization, investigation, formal analysis, writing—review and editing, project administration. Z.L.: investigation, methodology, software, validation, writing—original draft preparation. N.H.: supervision, project administration, funding acquisition. M.Z.: background research, hardware construction, software. W.Z.: background research and hardware construction. L.G.: writing—review and editing. X.D.: investigation, writing—review and editing. Z.Q.: investigation, writing—review and editing. S.D.: investigation, writing—review and editing. All authors have read and agreed to the published version of the manuscript.

Funding

This research was funded by National Natural Science Foundation of China (Project No: 52175461), The Key Research and Development Project in Hebei Province (Project No: 20327215D), and The Intelligent Manufacturing Project in Tianjin (Project No:20201199).

Institutional Review Board Statement

Not applicable.

Informed Consent Statement

Not applicable.

Data Availability Statement

Data are contained within the article.

Conflicts of Interest

The authors declare no conflict of interest.

References

  1. Gurubelli, Y.; Ramanathan, M.; Ponnusamy, P. Fractional fuzzy 2DLDA approach for pomegranate fruit grade classification. Comput. Electron. Agric. 2019, 162, 95–105. [Google Scholar] [CrossRef]
  2. Wang, F.; Zheng, J.; Tian, X.; Wang, J.; Niu, L.; Feng, W. An automatic sorting system for fresh white button mushrooms based on image processing. Comput. Electron. Agric. 2018, 151, 416–425. [Google Scholar] [CrossRef]
  3. Huang, W.; Li, J.; Wang, Q.; Chen, L. Development of a multispectral imaging system for online detection of bruises on apples. J. Food Eng. 2014, 146, 62–71. [Google Scholar] [CrossRef]
  4. Rajkumar, P.; Wang, N.; Elmasry, G.; Raghavan, G.S.V.; Gariepy, Y. Studies on banana fruit quality and maturity stages using hyperspectral imaging. J. Food Eng. 2011, 108, 194–200. [Google Scholar] [CrossRef]
  5. Thomas, P.; Kannan, A.; Degwekar, V.H.; Ramamurthy, M.S. Non-destructive detection of seed weevil-infested mango fruits by X-ray imaging. Postharvest Biol. Technol. 1995, 5, 161–165. [Google Scholar] [CrossRef]
  6. Van, D.M.; Lebotsa, S.; Herremans, E.; Verboven, P.; Sijbers, J.; Opara, U.L.; Cronje, P.J.; Nicolaï, B.M. A segmentation and classification algorithm for online detection of internal disorders in citrus using X-ray radiographs. Postharvest Biol. Technol. 2016, 112, 205–214. [Google Scholar]
  7. Diego, M.M.G.; Javier, G.G.; Andrea, B.; Fabio, M.; Juan, G.O. Fast tool based on electronic nose to predict olive fruit quality after harvest. Postharvest Biol. Technol. 2020, 160, 111058. [Google Scholar]
  8. Suchanek, M.; Kordulska, M.; Olejniczak, Z.; Figiel, H.; Turek, K. Application of low-field MRI for quality assessment of ‘Conference’ pears stored under controlled atmosphere conditions. Postharvest Biol. Technol. 2016, 124, 100–106. [Google Scholar] [CrossRef]
  9. Shi, X.; Chai, X.; Yang, C.; Xia, X.; Sun, T. Vision-based apple quality grading with multi-view spatial network. Comput. Electron. Agric. 2022, 195, 106793. [Google Scholar] [CrossRef]
  10. Sun, H.; Zhang, S.; Ren, R.; Su, L. Maturity classification of “Hupingzao” jujubes with an imbalanced dataset based on improved MobileNet V2. Agriculture 2022, 12, 1305. [Google Scholar] [CrossRef]
  11. Nandi, C.S.; Tudu, B.; Koley, C. A machine vision technique for grading of harvested mangoes based on maturity and quality. IEEE Sens. J. 2016, 16, 6387–6396. [Google Scholar] [CrossRef]
  12. Rafael, R.S.; Sergio, B.; Fernando, A.; Bruno, B.; Souraya, B.; Sergio, C. A smart system for the automatic evaluation of green olives visual quality in the field. Comput. Electron. Agric. 2020, 179, 105858. [Google Scholar]
  13. Kumar, S.D.; Esakkirajan, S.; Bama, S.; Keerthiveena, B. A microcontroller based machine vision approach for tomato grading and sorting using SVM classifier. Microprocess. Microsyst. 2020, 76, 103090. [Google Scholar] [CrossRef]
  14. Gu, Y.H.; Yin, H.; Jin, D.; Zheng, R.; Yoo, S.J. Improved multi-plant disease recognition method using deep convolutional neural networks in six diseases of apples and pears. Agriculture 2022, 12, 300. [Google Scholar] [CrossRef]
  15. Sofu, M.M.; Er, O.; Kayacan, M.C.; Cetisli, B. Design of an automatic apple sorting system using machine vision. Comput. Electron. Agric. 2016, 127, 395–405. [Google Scholar] [CrossRef]
  16. Mon, T.; ZarAung, N. Vision based volume estimation method for automatic mango grading system. Biosyst. Eng. 2020, 198, 338–349. [Google Scholar] [CrossRef]
  17. Zhang, Z.; Lu, Y.; Lu, R. Development and evaluation of an apple infield grading and sorting system. Postharvest Biol. Technol. 2021, 180, 111588. [Google Scholar] [CrossRef]
  18. Fadilah, N.; Saleh, J.M.; Ibrahim, H.; Halim, Z.A. Oil palm fresh fruit bunch ripeness classification using artificial neural network. In Proceedings of the 4th International Conference on Intelligent and Advanced Systems (ICIAS) and a Conference of World Engineering, Science and Technology Congress (ESTCON), Kuala Lumpur, Malaysia, 12–14 June 2012. [Google Scholar]
  19. Pan, Z.; Wei, X. Computer vision based orange grading using SVM. In Proceedings of the International Conference on Sensors, Measurement and Intelligent Materials (ICSMIM 2012), Guilin, China, 26–27 December 2012. [Google Scholar]
  20. Azarmdel, H.; Jahanbakhshi, A.; Mohtasebi, S.S.; Munoz, A.R. Evaluation of image processing technique as an expert system in mulberry fruit grading based on ripeness level using artificial neural networks (ANNs) and support vector machine (SVM). Postharvest Biol. Technol. 2020, 166, 111201. [Google Scholar] [CrossRef]
  21. Bhargava, A.; Bansal, A. Fruits and vegetables quality evaluation using computer vision: A review. J. King Saud Univ.-Comput. Inf. Sci. 2021, 33, 243–257. [Google Scholar] [CrossRef]
Figure 1. Pear shape. (a) Standard shape. (b) Apical shape. (c) Eccentric shape.
Agriculture 13 00290 g001
Figure 2. Schematic diagram of symmetry feature calculation.
Agriculture 13 00290 g002
Figure 3. Schematic diagram of the calculation of the quasi-rectangularity feature.
Agriculture 13 00290 g003
Figure 4. Surface color of pears. (a) Standard color. (b) Deviant color.
Agriculture 13 00290 g004
Figure 5. Schematic diagram of surface defects of pears. (a) Stabbed defect. (b) Bruised defect. (c) Abraded defect. (d) Rusty defect.
Agriculture 13 00290 g005
Figure 6. Grading method.
Agriculture 13 00290 g006
Figure 7. Pear shape BP neural network classifier.
Agriculture 13 00290 g007
Figure 8. Pear surface defect BP neural network classifier.
Agriculture 13 00290 g008
Figure 9. Design appearance of pear appearance quality inspection and grading system. 1–Push-pull electromagnet, 2–Conveyor, 3–Motor, 4–Storage box, 5–Image acquisition cabin, 6–Light source, 7–CCD color camera.
Agriculture 13 00290 g009
Figure 10. The composition of the hardware system.
Agriculture 13 00290 g010
Figure 11. Schematic diagram of push-pull electromagnet sorting control.
Agriculture 13 00290 g011
Figure 12. System work flow chart.
Agriculture 13 00290 g012
Figure 13. Experimental prototype. 1–Computer, 2–Push-pull electromagnet, 3–Photoelectric sensor, 4–Image acquisition cabin, 5–Conveyor.
Agriculture 13 00290 g013
Figure 14. Detection flow chart.
Agriculture 13 00290 g014
Figure 15. Image preprocessing process. (a) The original image. (b) Grayscale image of original image. (c) Pear contour image after threshold segmentation. (d) Pear contour image after morphological processing. (e) Segmented pear surface image. (f) Grayscale image of pear surface image. (g) Pear surface defect contour image after threshold segmentation. (h) Pear surface defect contour image after morphological processing and contour screening. (i) Pear surface defect image obtained after segmentation (contour indicated by red line).
Agriculture 13 00290 g015
Figure 16. Comparison of pear shape features: (a) Symmetry feature of standard shape. (b) Symmetry feature of eccentric shape. (c) Quasi-rectangularity feature of standard shape. (d) Quasi-rectangularity feature of apical shape.
Agriculture 13 00290 g016
Figure 17. Color histogram of pear surface image. (a) Color histogram of standard color. (b) Color histogram of deviant color.
Agriculture 13 00290 g017
Figure 18. GLCM feature of pear surface defects. (a) Stabbed defect. (b) Bruised defect. (c) Abraded defect. (d) Rusty defect.
Agriculture 13 00290 g018aAgriculture 13 00290 g018b
Figure 19. Confusion matrix for each classifier. (a) Classifier of pear shape. (b) Classifier of pear surface color. (c) Classifier of pear surface defect. (d) Classifier of pear appearance quality.
Agriculture 13 00290 g019aAgriculture 13 00290 g019b
Table 1. Comparison of fruit quality detection technology.
Detection TechnologyDetection ObjectAdvantageDisadvantage
Machine vision technologyFruit size, shape, external damage, surface defectsLow cost, online inspection of production lineIt is difficult to detect the entire surface of the fruit, and it is impossible to identify internal defects and components.
SpectroscopySurface and internal defects, compositionDetection information is richer than machine visionThe multi band spectral information needs to be screened, the data volume is large, and the processing time is long.
X-ray imaging technologyInternal defects, compositionSensitive to bulk defects, can detect internal defects and components at the same time, especially distinguish between different densitiesIt is not sensitive to surface defects, the radiation source is expensive, and there is radiation risk.
Electronic nose technologyInternal composition, maturityEvaluate the quality of fruit by its odor signal, easy to handle and fast to detectIt is easily affected by the environment, and the detection accuracy depends on the parameters of the gas sensor.
Nuclear Magnetic Resonance TechnologySurface and internal defects, compositionStrong penetrating power, not limited by peel thickness, safe and non-radiationNMR instruments are expensive and time consuming to process.
Table 2. Hardware parameters.
Device NameDevice Parameters
CCD color cameraFirm: Microvision, Camera model: EM-200C, Connection: RJ-45, Resolution: 1600 × 1200, Frame rate: 40, Lens model: BT-23C0828MP10, Focal length: 8 mm, Lens mount: C, Lens field of view: 67.6° × 57.6° × 44°, Adjustment range of aperture: 1:1.28~16
IPCNetwork interface card: Gigabit NIC supporting jumbo frame, Communication interface: serial port
ControllerFirm: Siemens, Model: S7-200 smart, Communication protocols: RS485
Photoelectric sensorFirm: OMCH, Model: E3F-DS10C4, Output model: NPN NO, Detection distance: 20~100 mm
Push-pull electromagnetStroke: 60 mm, Attraction: 20 N
MotorFirm: PERFECT, Model: 57BYG250B, Motor driver: TB6600, Torque: 2.3 NM
Power supply220 V AC power supply, 24 V DC power supply
Table 3. The number of samples in the corresponding categories of grading indicators.
ShapeSurface ColorSurface DefectNumber of Images
Standard ShapeApical ShapeEccentric ShapeStandard ColorDeviant ColorFlawlessStabbed DefectBruised DefectAbraded DefectRusty Defect
1331291362041948278857479398
Table 4. Classifier hyperparameter settings.
ClassifierHyperparameters
BP neural network classifier of pear shapeNumber of input layer nodes: 100, Number of hidden layer nodes: 50, Number of output layer nodes: 3, Learning rate: 0.3, Number of iterations: 300
SVM classifier of pear surface colorPenalty factor C :5, G a m m a = 1, Kernel: Gaussian kernel
BP neural network classifier of pear surface defectNumber of input layer nodes: 4, Number of hidden layer nodes: 85, Number of output layer nodes: 4, Learning rate: 0.23, Number of iterations: 300
Table 5. Classification performance of the four classifiers.
A c c u r a c y R e c a l l P r e c i s i o n F 1 - Score Running Time
Shape classifier83.3%83.3%83.5%83.4%2.02 s
Surface color classifier91.0%91.1%91.0%91.9%1.06 s
Surface defect classifier76.6%76.9%81.5%77.9%2.34 s
Appearance quality classifier80.5%80.6%81.3%80.9%
Disclaimer/Publisher’s Note: The statements, opinions and data contained in all publications are solely those of the individual author(s) and contributor(s) and not of MDPI and/or the editor(s). MDPI and/or the editor(s) disclaim responsibility for any injury to people or property resulting from any ideas, methods, instructions or products referred to in the content.

