1. Introduction
Animal muscle is one of the main sources of human protein, and its basic unit is muscle fiber. In recent years, beef quality has become a hot and difficult issue for cattle genetics and breeding researchers. It is very important to study the molecular genetic mechanisms of meat quality traits [
1]. The composition and structure of muscle, as well as the histological properties of muscle fibers, are tightly correlated with meat quality traits. Actin is the main component of muscle cells and cytoskeleton and participates in a series of important physiological activities in organisms, such as muscle contraction, cell movement, cytokinesis, and so on. These processes require not only actin but also regulatory proteins bound to actin. Cofilin is one of the 21 kD actin-binding proteins widely distributed in organisms from yeast to mammals [
2]. Cofilin was originally identified in pig brain extracts [
3]; its basic function is to bind and depolymerize F-actin in cells, inhibit the polymerization of G-actin, and synergistically participate in a series of important physiological activities in the organism.
The cofilin family is essential in eukaryotes, known to play critical roles in normal muscle function and regeneration, and has highly complex and interesting regulatory patterns. In mammals, the ADF/cofilin protein family has three members: ADF (Actin Depolymerizing Factor), CFL1 (non-muscle-type cofilin, NM-type cofilin, cofilin-1), and CFL2 (muscle-type cofilin, M-type cofilin, cofilin-2), Although they overlap in function, their distribution and expression in tissues vary. ADF is mainly expressed in neurons and epithelial cells, CFL1 is expressed in non-muscle cells of various tissues, and CFL2 is mainly found in muscle cells. In addition, some cells can express the above three members at the same time [
4,
5]. In terms of function, ADF is more effective in the segmentation of actin monomers, while CFL1/CFL2 mainly acts on the nucleation and cleavage of actin filaments [
6]. Activated CFL1 can cleave actin fibers (Fibrous action, F-actin) to form short actin fragments with more nucleation and aggregation activities, thereby regulating the dynamic balance between actin depolymerization and promoting polymerization and maintaining cytoskeleton function [
7]. In addition to directly cleaving actin, CFL1 also affects gene expression, cell proliferation, and apoptosis and plays an important role in maintaining cell homeostasis. The CFL2 gene is highly expressed in the muscle tissue of domestic animals, which may be closely related to its major part in muscle growth and development [
8,
9]. Studies have found that the precursor proteins encoded by the mammalian CFL2 gene all contain ADF domains, and ADF deletion can lead to mouse corneal developmental diseases, such as actin cytoskeleton disorder, epithelial hyperplasia, and even blindness [
10,
11]. Deletion of the CFL2 gene kills 8-day-old mice due to severe muscle defects and abnormal actin accumulation, indicating that the CFL2 gene plays an important role in muscle development and maintenance of normal muscle morphology [
12].
CFL1 can achieve actin movement by promoting actin depolymerization and severing myofilaments. It is expressed in various non-muscle tissues and is more expressed in the brain and liver, while CFL2 is mainly expressed in the mammalian heart and muscle. It is expressed in tissues and is considered to be an actin assembler in muscle tissue and has an irreplaceable role in myofiber formation and muscle regeneration [
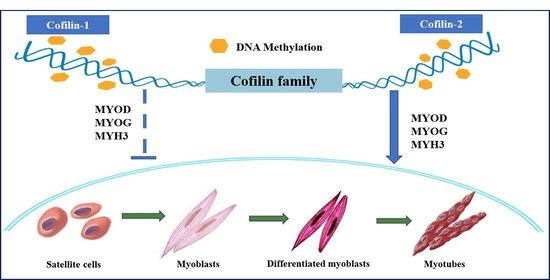
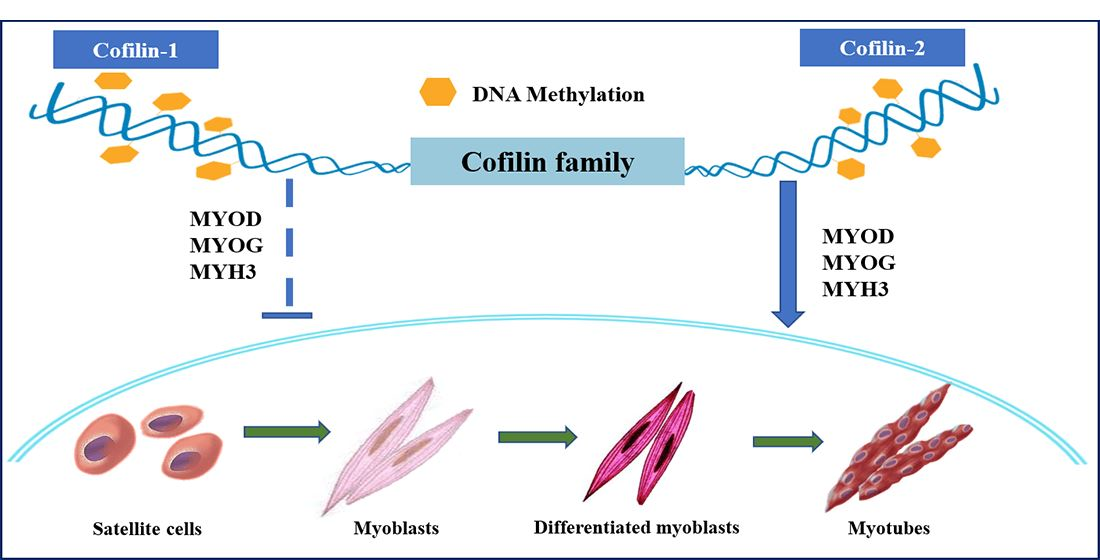
13]. During myogenesis in healthy mice, a cofilin transition occurs from non-muscle type CFL1 to muscle type CFL2 [
9]. Both CFL1 and CFL2 are expressed in embryonic skeletal muscle. With the progress of muscle development, CFL1 gene expression decreases, and CFL1 expression disappears in terminally differentiated myoblasts, while CFL2 gene expression increases. Therefore, CFL1 is almost undetectable in adult skeletal muscle, which mainly expresses CFL2, of which 30–50% is in the phosphorylated form [
11]. The existing form of the cofilin family is usually closely related to function and shows different molecular subtypes in cells and tissues according to functional needs.
This study attempted to understand further the role of CFL1 and CFL2 in the growth and development of skeletal muscle cells and to explore the interaction between CFL1 and CFL2 by studying the expression rules of CFL1 and CFL1 genes in Qinchuan (QC) cattle muscle tissue and their function on muscle cell differentiation in order to provide a theoretical basis for the subsequent molecular genetic breeding of cattle; it may also provide some new ideas for mammalian genetic breeding.
2. Materials and Methods
All experimental animal procedures were approved by the Institutional Animal Care and Use Committee of Yangzhou University (License number: SYXK [Su] 2017-0044).
2.1. Collection of Tissue Samples
The tissue samples of the cattle were sampled immediately after slaughter, frozen in liquid nitrogen, brought back to the laboratory, and stored in a −80 °C refrigerator for future use. Tissue samples were collected from female cattle at three key stages of muscle formation and maturation: fetal bovine (FB, embryonic day 90), calf (1 month postnatal), and adult cattle (AC, 24 months). Heart tissues, liver tissues, spleen tissues, lung tissues, kidney tissues, fat tissues, and muscle tissues were collected from three QC cattle for RNA extraction. Fresh longissimus dorsi muscle tissue of fetal bovine was sampled, stored in PBS containing 1% streptomycin and penicillin, and brought back to the laboratory for isolation and culture of primary bovine myoblasts (PBMs).
All cattle were obtained from the reserved farm of Qinchuan cattle (Fufeng country, Shaanxi Province, P.R. China) and the fineness breeding center of Qinchuan cattle (Yangling, Shaanxi province, P.R. China). They were raised at the same level.
2.2. RNA Extraction and cDNA Synthesis
Total RNA from tissues and cellular were obtained using TRIzol reagent (TaKaRa, Dalian, China) following the manufacturer’s protocol, cDNA was synthesized from an equal amount RNA (500 ng) using PrimeScript RT reagent Kit (TaKaRa, Dalian, China) according to manufacturer’s instruction.
2.3. Cell Culture
PBMs were isolated and cultured using collagenase I digestion. First, the muscle tissue samples were washed three times with sterile PBS with 1% double antibody, and then the epidermal tissue was cut along the fetal bovine dorsal spine. In a 6 cm petri dish of PBS, scissors were used to cut the muscle mass as much as possible, and then it was collected into a 50 mL centrifuge tube; collagenase I was added to a water bath at 37 °C to digest for 1.5 h, it was filtered and centrifuged at 1000 r/min for 10 min, and the precipitated cells were collected. The cells were resuspended in DMEM/F12 complete medium supplemented with 15% FBS and 1% double-antibody. After counting the cells, the cell suspension was inoculated in a 6 cm culture dish in proportion, then cultured in a 37 °C, 5% CO2 incubator for 2 h, and the upper layer was aspirated. The culture medium continued to be cultured in a new 6 cm culture dish until the cell density reached about 80–90%, and the cells were passaged or frozen for subsequent experiments. HEK293 and C2C12 cell lines were provided by our laboratory. All cells were cultured at 37 °C containing 5% CO2.
2.4. Induce Cell Differentiation and Transfection
To investigate myocyte differentiation, the growth medium (GM) was changed to differentiation medium (DM, 2% horse serum) after cell confluence reached approximately 80%. Meanwhile, CFL1-CMV, CFL2-CMV, pAdTrack-CMV vector (control group), shCFL1-2, shCFL2-1, and siRNA negative control (NC) was transfected into PBMs using Lipofectamine
TM 2000 (Invitrogen, Carlsbad, CA, USA) to confirm the regulatory mechanism of the CFL1 and CFL2 genes on myoblast differentiation. C2C12 cells were cultured for 1, 2, 4, 6, and 8 days, and PBMs were harvested for RNA extraction at 1, 3, 5, and 7 days. Recombinant vectors (overexpression vector CFL1-CMV and CFL2-CMV, interference vector shCFL1-1, shCFL1-2, shCFL2-1, and shCFL2-2) are detailed in the
Supplementary Material. Four interference vectors were transfected into HEK293 cells, and shCFL1-2 and shCFL2-1 were found to have a better interference effect (
Figure S1). The entire process for adenovirus generation and proliferation was performed as previously described [
14].
2.5. Quantitative Real-Time PCR (qRT-PCR) and Western Blot
Total RNA was extracted from tissues and cells using TRIzol reagent (TaKaRa, Dalian, China), and then 500 ng RNA was transcribed to cDNA using the PrimeScript RT reagent kit (TaKaRa, Dalian, China) for use in qRT-PCR with SYBR Green Master Mix reagent kit (GenStar, Beijing, China). Gene-specific primers for the CFL1 gene (CFL1-F/R) and CFL2 (CFL2-F/R) gene were designed based on published mRNA sequences using Primer Premier 5.0 software (PREMIER Biosoft International, USA). Transcription levels were normalized to the levels of the housekeeping genes GAPDH (GAPDH-F/R). The primers are listed in
Table 1. The total protein extracted from HEK293 cells is listed in the
Supplementary Material. Western blot results are shown in
Figure S1. In previous work, we selected GAPDH as the housekeeping gene [
15,
16], the stability data expression of GAPDH is shown in
Table S2.
2.6. Bisulfite Sequencing Polymerase Chain Reaction (BSP)
Longissimus dorsi DNA from fetal bovine (FB, 90-day embryo, 4 male individuals) and adult bovine (AB, 24 months old, 4 male individuals) was converted using the methylSEQr Bisulfite Conversion Kit (Applied Biosystems, Foster City, CA, USA) following the manufacturer’s protocol. The BSP primers of CFL2 DMR (differentially methylated region) were synthesized by the online software MethPrimer [
17]. BSP sequencing was analyzed by the online software QUMA. The nucleotide sequences of CFL1 DMR and CFL2 DMR (DMR, differentially methylated region) are shown in
Table 1. We performed three independent replicates and sequenced five clones from each independent amplification and cloning set.
2.7. Statistical Analysis
All statistics are rendered as means ± SE (standard error) of three replications, each replication experiment in triplicate. The results were determined using the 2
−ΔΔCt method [
18] and analyzed by SPSS software (version 18.0).
p-values < 0.05 or <0.01 were considered as statistically significant differences.
3. Results
3.1. Spatiotemporal Expression Analysis of CFL2 Gene Compared to CFL1 Gene
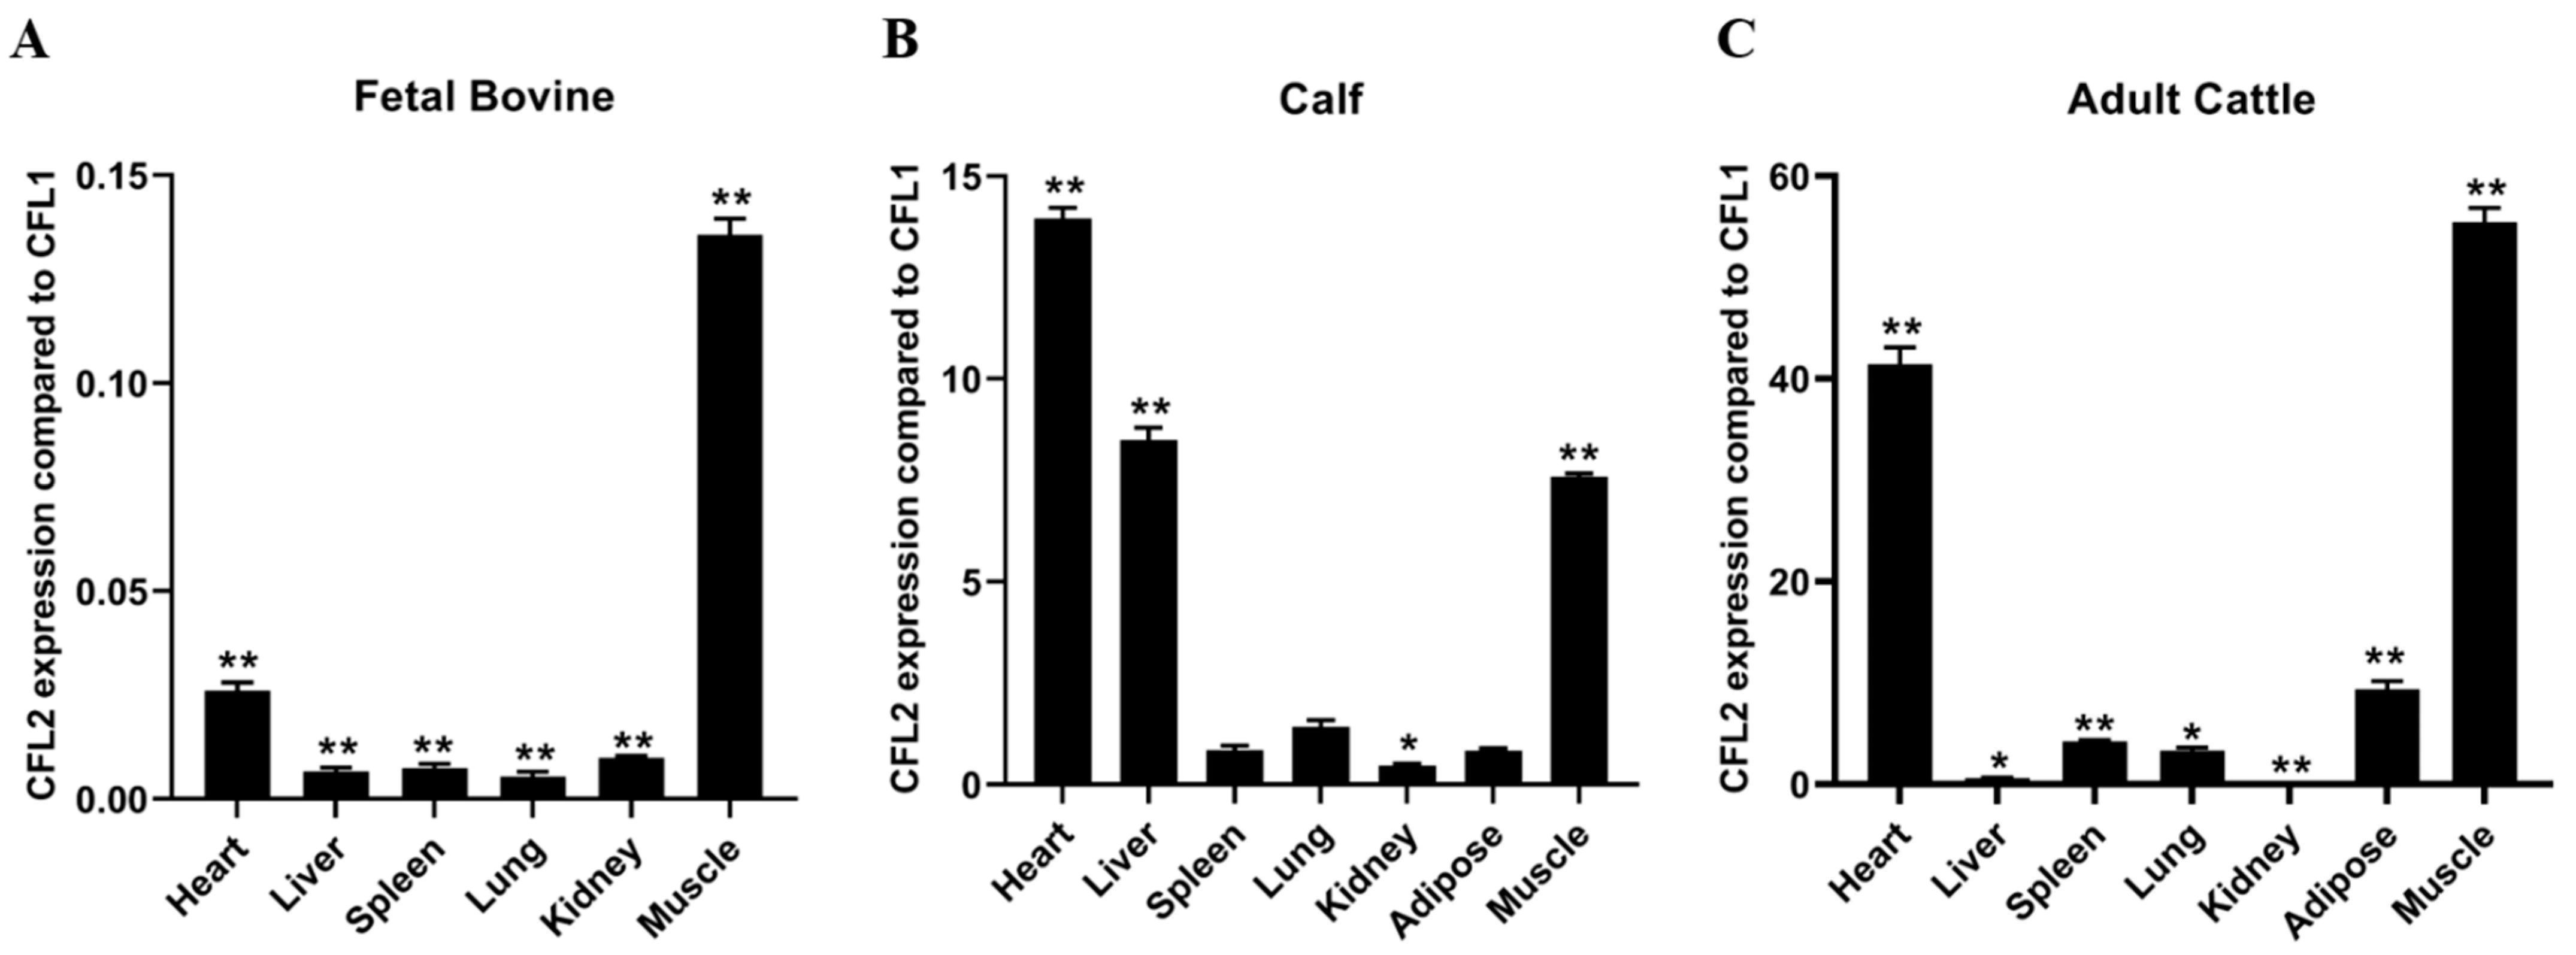
In order to understand the expression regulation between CFL1and CFL2, we examined the expression patterns of CFL1 and CFL2 in fetal bovine, calf, and adult bovine tissue using RT-PCR experiments. We calculated the relative mRNA levels of CFL1 and CFL2 genes in different tissues of QC cattle at three developmental stages. The expression level of the CFL1 gene is a benchmark.
In fetal bovine tissue, the expression level of CFL2 in seven tissue samples, including heart, liver, spleen, lung, kidney, adipose, and muscle, was significantly lower than that of CFL1 (
p < 0.01) (
Figure 1A). In calf tissue, the expression level of CFL2 in the heart, liver, lung, and muscle was higher than that of CFL1. The expression level of CFL2 was the highest in heart tissue compared to CFL1, and the expression of CFL2 in liver and muscle tissues was also significantly higher than that of CFL1. There was no significant difference in expression in the spleen, lung, and adipose tissue (
p > 0.05) (
Figure 1B). In adult cattle tissue, the expression level of CFL2 in seven tissues, including heart, liver, spleen, lung, kidney, fat, and muscle, was significantly higher than that of CFL1 (
p < 0.01). The expression level of CFL2 was extremely high in muscle and heart tissue compared with CFL1 expression (
p < 0.01). The fold difference in relative expression level in heart tissue was nearly 40-fold and in muscle tissue was more than 40-fold. In addition, the expression levels of CFL2 and CFL1 in liver, spleen, lung, kidney, and adipose tissue were also significantly different, and the expression of CFL2 was significantly higher than that of CFL1 (
p < 0.01) (
Figure 1C).
The expression of CFL1 was significantly higher than that of CFL2 in embryonic cattle tissue, while the expression in calf and adult cattle tissue was significantly lower than that of CFL2, especially in the heart and muscle tissue of adult cattle. This may reveal that in muscle tissues, the expression level of the CFL1 gene is the highest in fetal bovines and lowest in adult bovines, and the expression level decreases significantly with age; while the expression level of the CFL2 gene increases with bovine age, showing a very significant upward trend.
3.2. Spatiotemporal Expression of CFL1 and CFL2 in Cattle of Different Ages
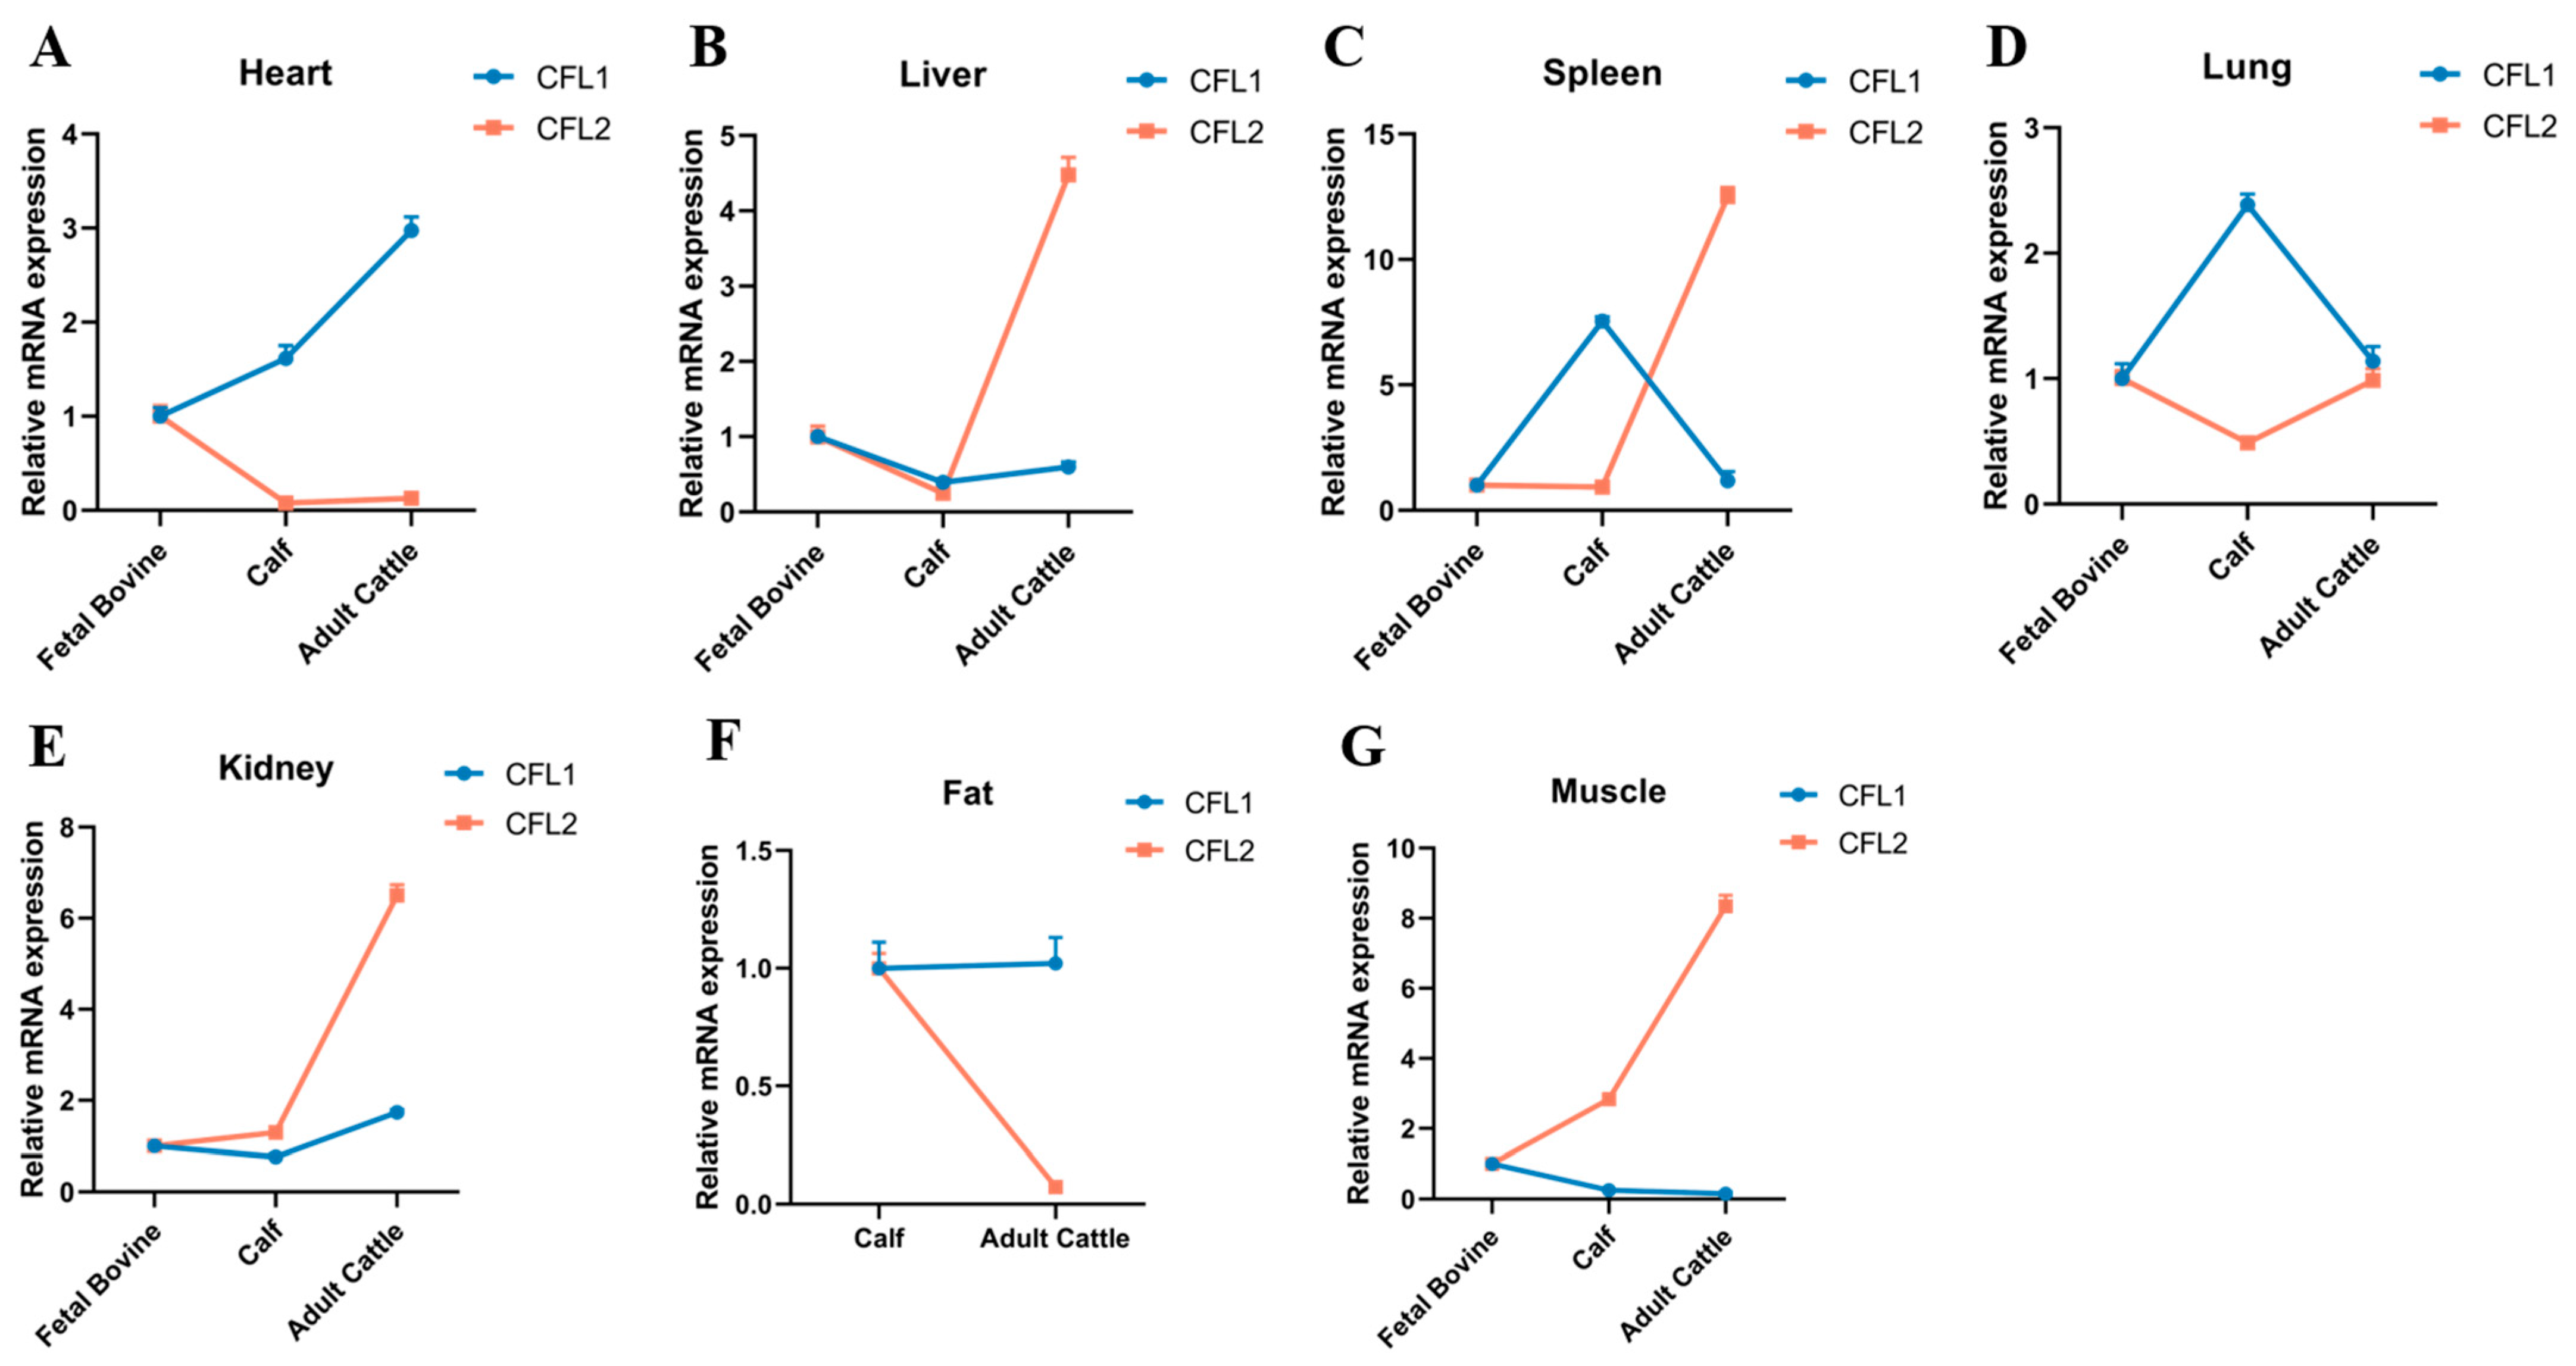
In the heart and kidney, the expression of CFL1 in cattle of different ages showed an upward trend (
Figure 2A–E). In the liver, the expression of CFL1 in cattle of different ages showed a trend of first decreasing and then increasing, and the overall expression level was highest in fetal cattle (
Figure 2B). In the spleen and lung, the expression of CFL1 in cattle of different ages first increased and then decreased, and the expression level in calves was higher than that in fetal and adult cattle (
Figure 2C,D).
Due to the lack of fat deposition ability in fetal bovines, there was basically no CFL1 or CFL2 detected in fetal bovine fat, and there was no statistical change in the expression of CFL1 in calves and adult cattle. In muscle tissue, the expression of CFL1 showed a gradual downward trend with the increase in cattle age, and the expression in adult cattle was the lowest, close to zero (
Figure 2G).
In heart and fat tissues, the expression of CFL2 in cattle of different ages showed a downward trend, and the presence of CFL2 was not detected in the adipose tissue of fetal cattle (
Figure 2A–F). In lung tissues, the expression trend of CFL2 first decreased and then increased, and the expression level of CFL2 in the lung did not change significantly (
Figure 2D). In the liver, spleen, kidney, and muscle, the expression of CFL2 showed an overall upward trend in cattle of different ages (
Figure 2B,C), and the expression change in muscle tissue was especially obvious (
Figure 2G).
In addition, it is worth noting that the expression level of CFL1 is higher than that of CFL2 in calf heart, spleen, and lung tissues; in adult cattle liver, spleen, kidney, and muscle, the expression level of CFL1 is lower than that of CFL2. Interestingly, we can clearly find that in muscle tissue, the expression level of CFL1 gradually decreases with the increase in cattle age, and the expression level of CFL2 gradually increases with the increase in cattle age and CFL2 expression level in calves and adults. The expression level in cattle was significantly higher than that of CFL1.
3.3. Study on DNA Methylation Level of CFL1 and CFL2 Gene Promoters
To further testify the effects of CFL1 and CFL2 genes on muscle tissues, we performed a DNA methylation study on myogenesis and muscle maturation stages.
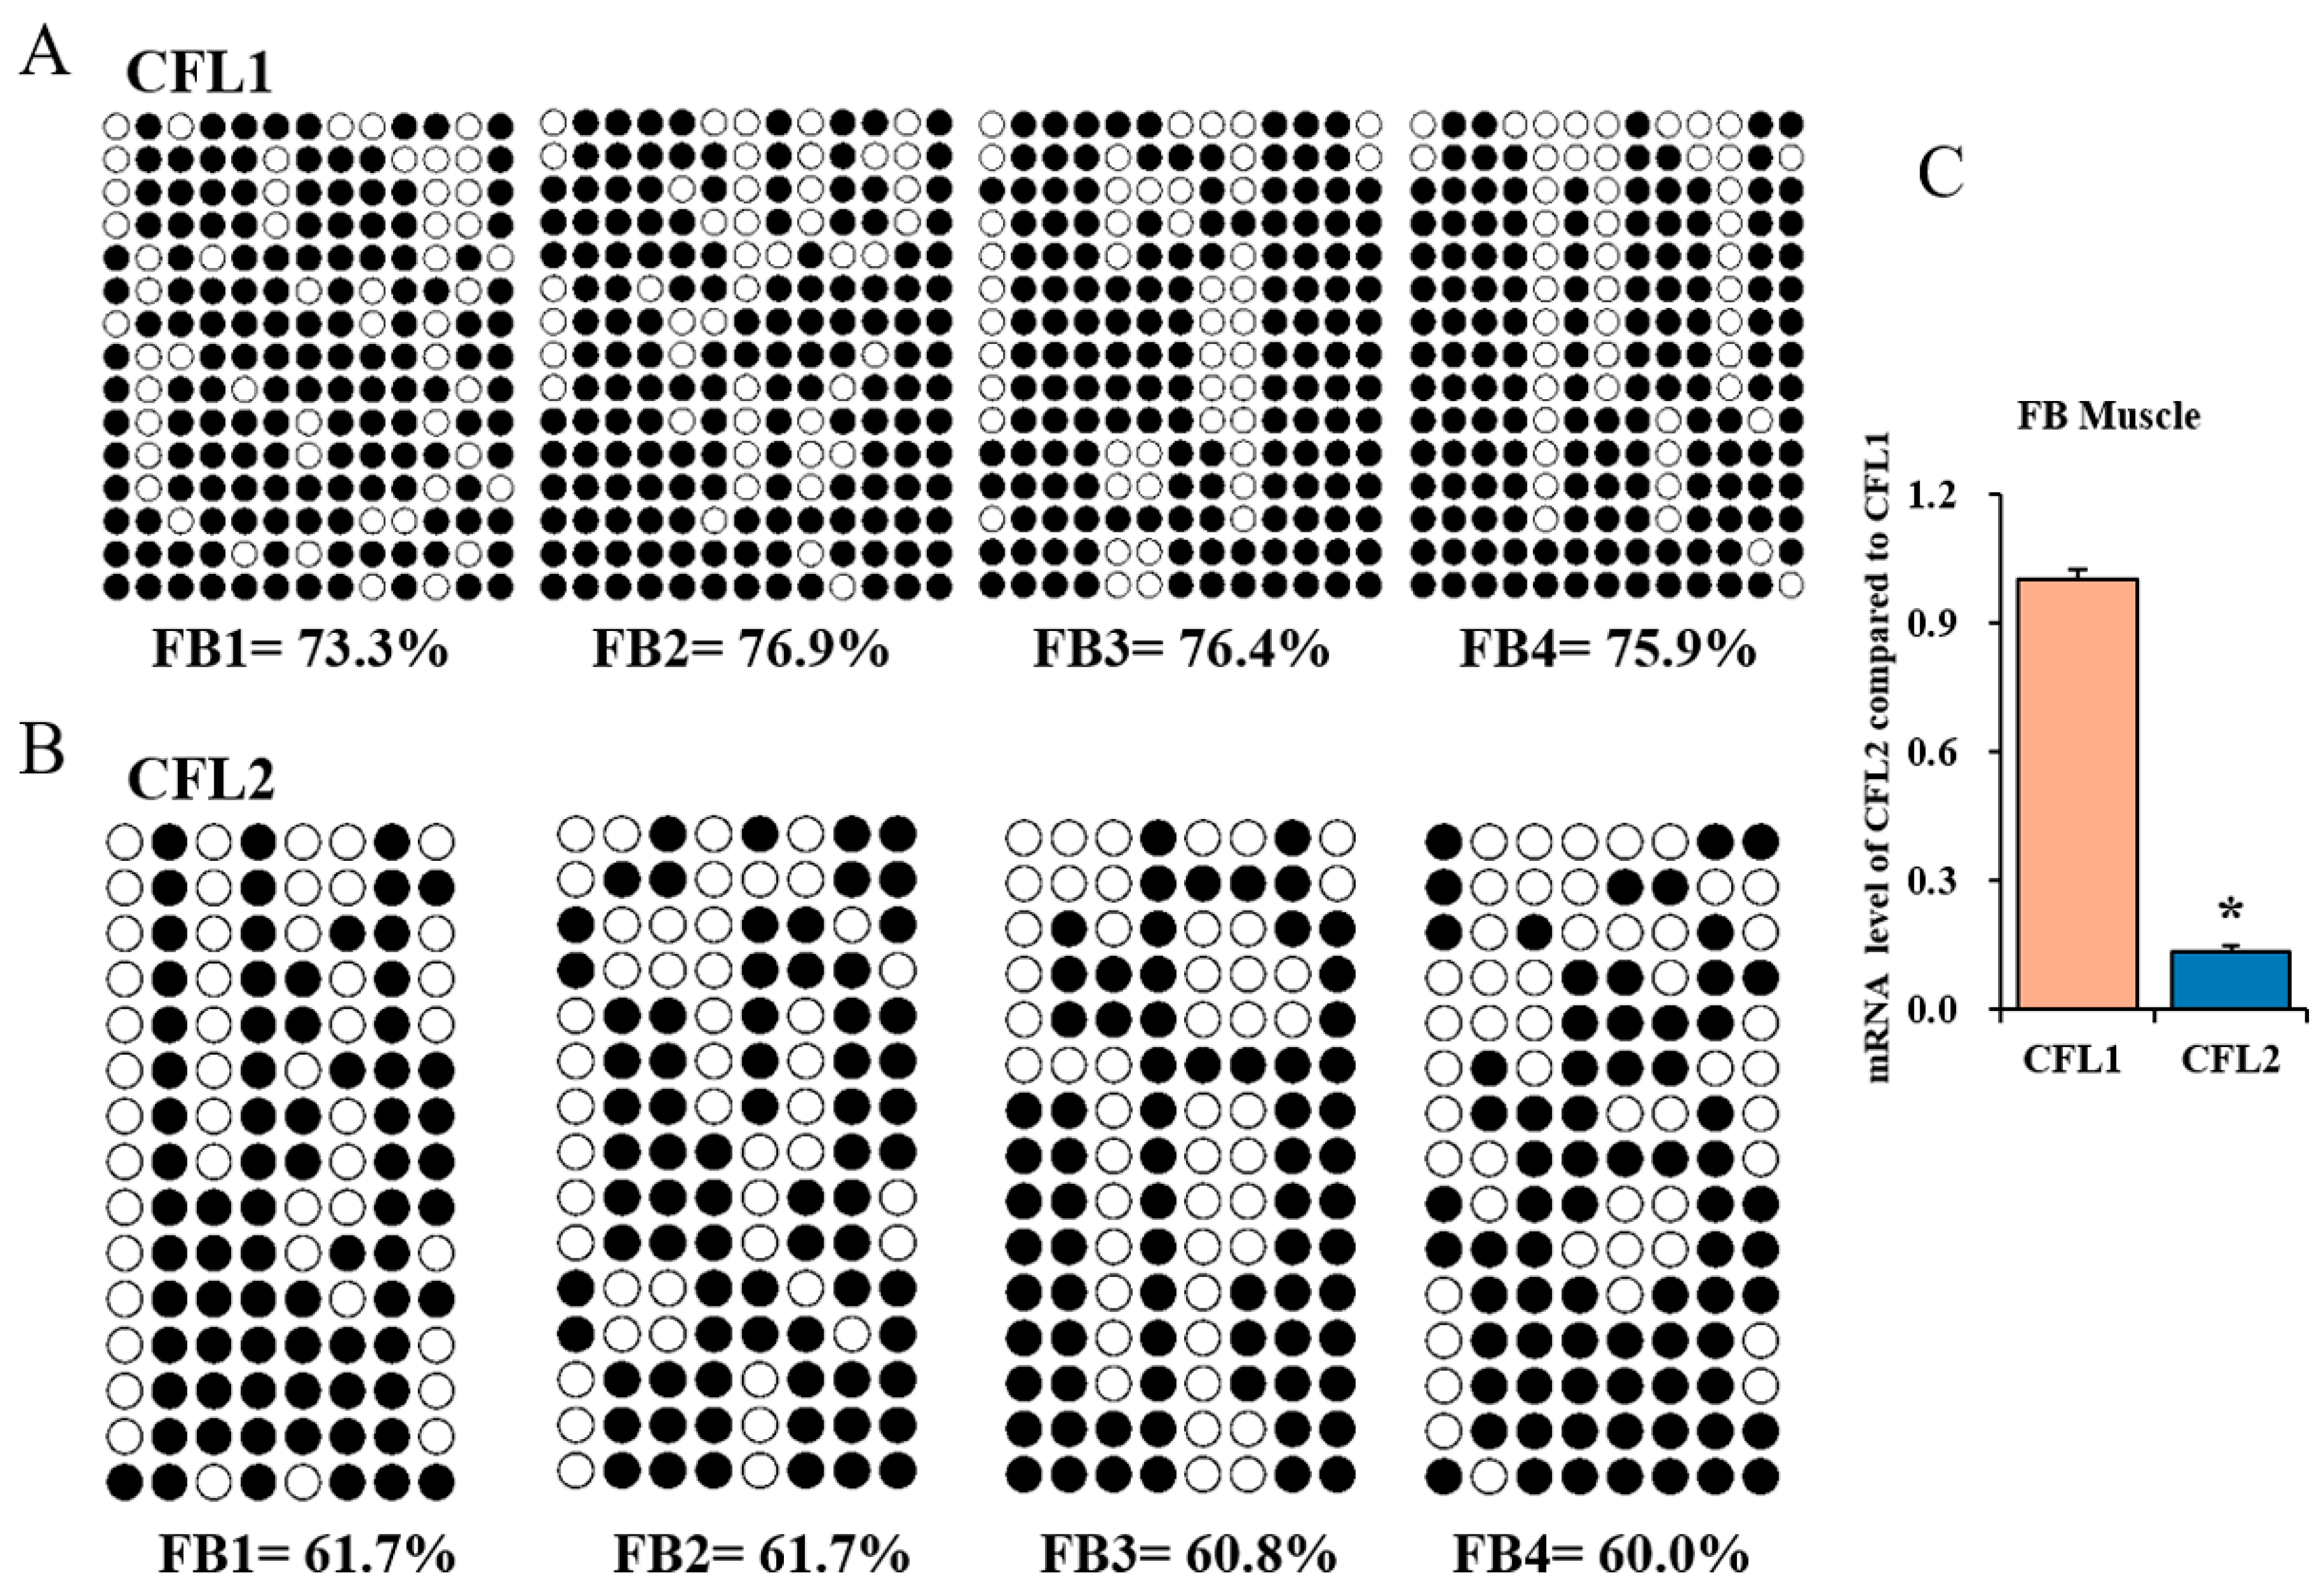
CFL1 promoter DMR (185 bp) has thirteen CpGs, and CFL2 promoter DMR (177 bp) has eight CpGs; we sequenced fifteen clones in each muscle sample, then we obtained 195 CpGs of CFL1 DMR and 120 CpGs of CFL2 DMR. The methylated CpGs percentages of the CFL1 gene were 73.3%, 76.9%, 76.4%, and 75.9% in the FB group. There were 61.7%, 61.7%, 60.8%, and 60.0% of the CFL1 gene. Statistical results showed high DNA methylation levels of CFL1 promotor (mean 75.6%) and CFL2 promotor (mean 61.1%) in the FB group (
Figure 3A,B).
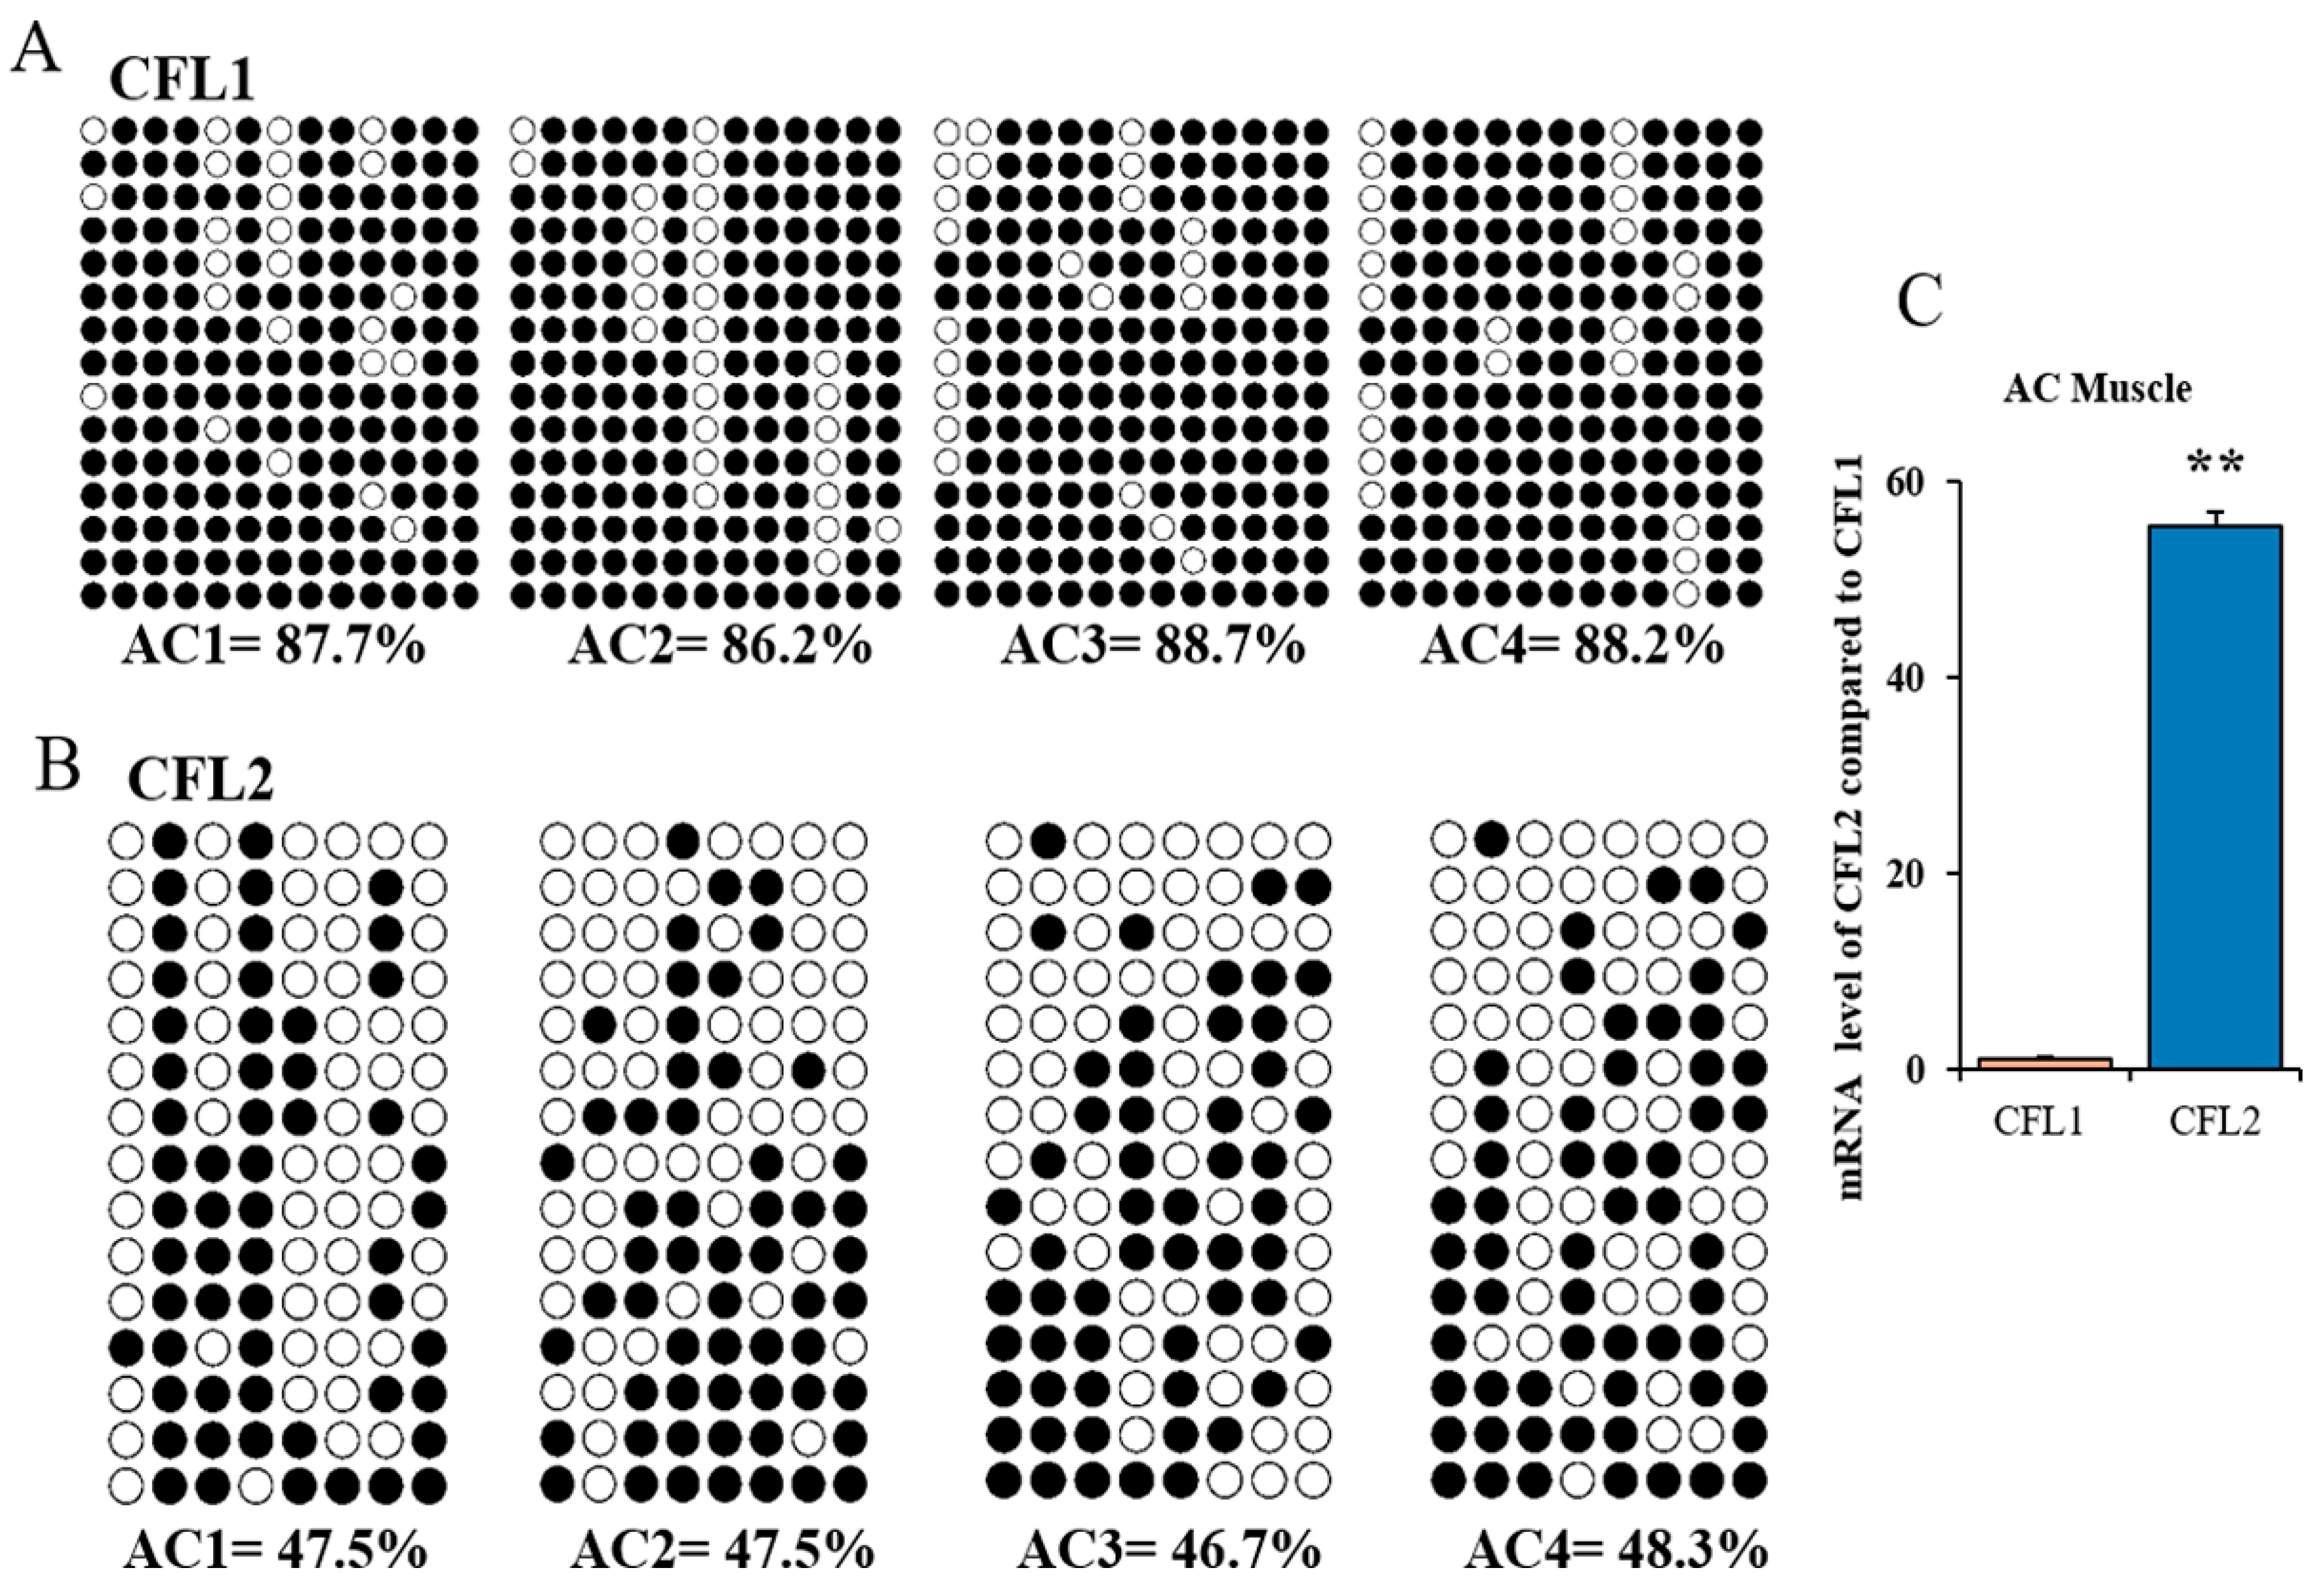
In the AC group, the DNA methylation level values of CFL1 promotor were 87.7%, 86.2%, 88.7%, and 88.2%, CFL2 promotor values were 47.5%, 47.5%, 46.7%, and 48.3%. Statistical results presented significantly higher DNA methylation levels CFL1 promotor region (mean 87.7%) compared to CFL2 (mean 47.5%) (
Figure 4A,B).
To further demonstrate whether the methylation levels of CFL1 and CFL2 affect their expression level in muscle tissues, we compared the mRNA level of CFL1 and CFL2 genes in the FB group and AC group. Contrasted with CFL1, the expression level of the CFL2 gene was significantly lower in the FB group (
p < 0.01) (
Figure 3C). In the AC group, the CFL2 gene had remarkably higher expression than CFL1, and the fold difference in relative expression level was about 55-fold (
Figure 4C). Combined with the above results, there is a fairly straightforward correlation for tissue-specific CFL2 gene between expression and DNA methylation.
3.4. Expression of CFL1 and CFL2 Genes during Differentiation of C2C12 Myoblasts
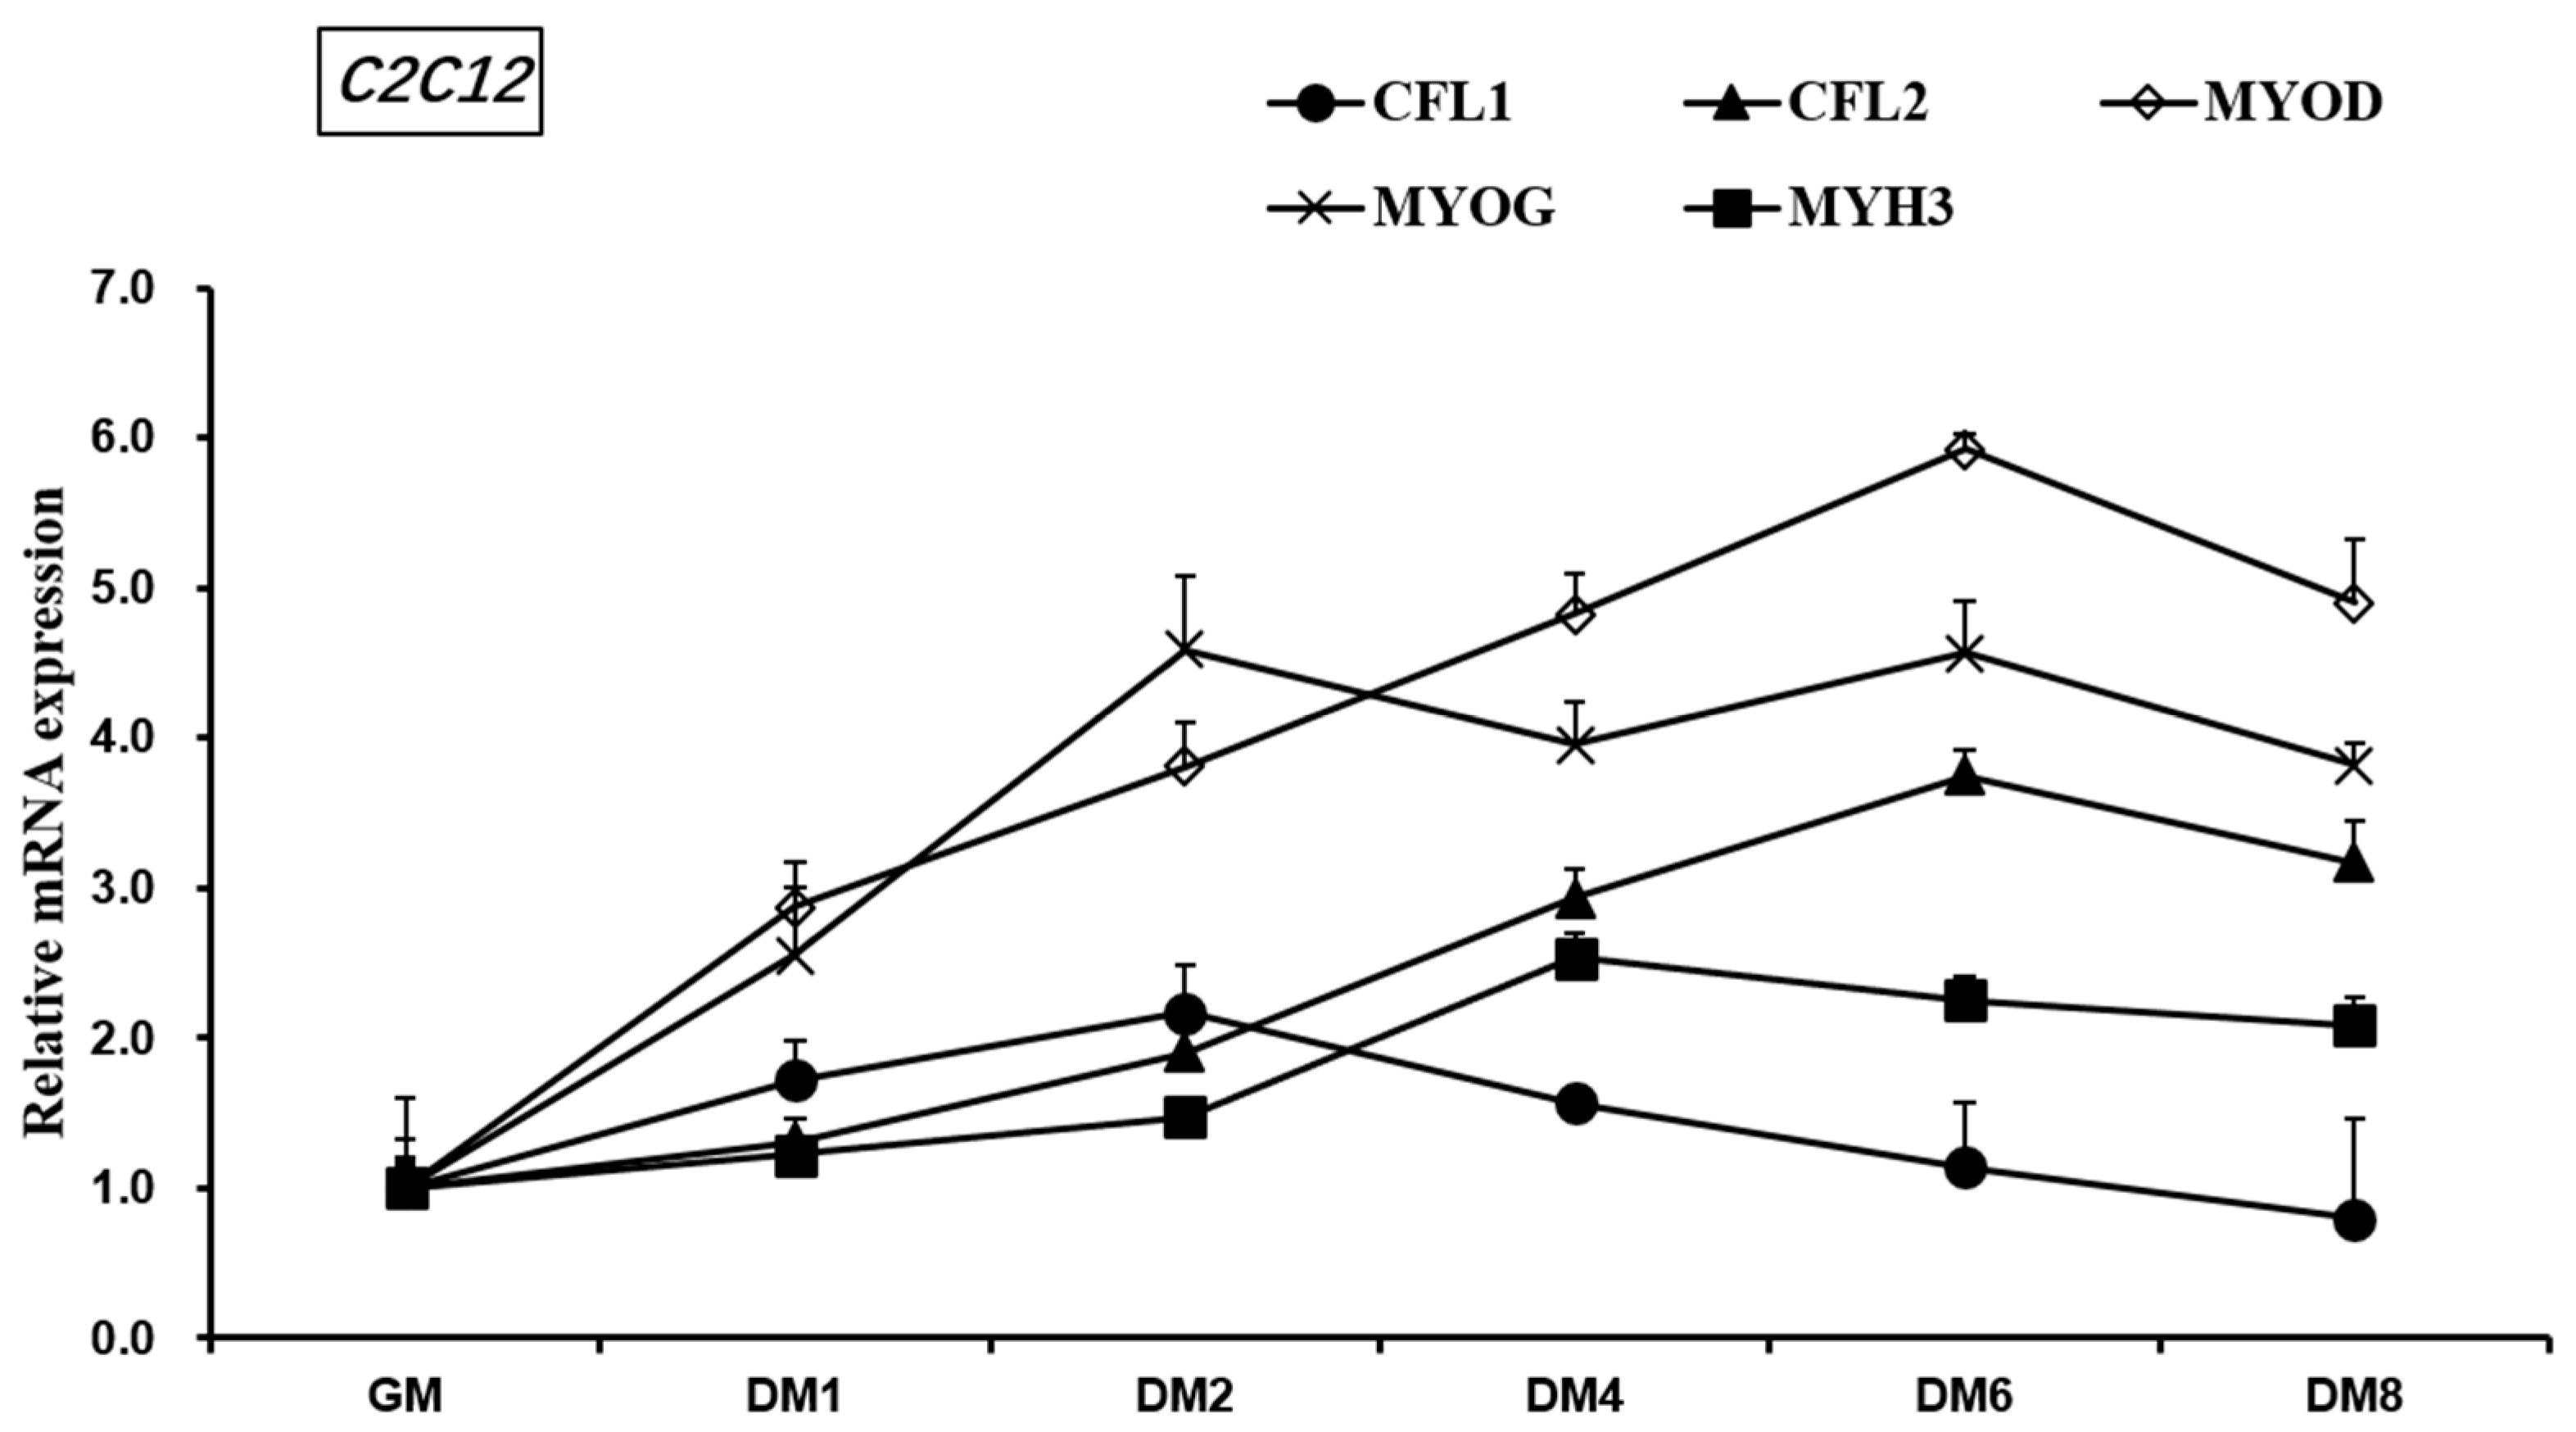
The mouse myoblast C2C12 differentiates rapidly, forms retractable myotubes, and produces characteristic myoproteins. It is a widely used cell line to study myoblast proliferation and differentiation. During the growth and differentiation of C2C12, we detected the relative expression levels of myogenesis marker factors MYOD, MYOG, MYH3, and CFL1 and CFL2 (
Figure 5) in order to initially understand the expression patterns of CFL1 and CFL2 in C2C12 muscle cells and the expression patterns of CFL1 and CFL2 in myoblasts, the regulatory relationship in the differentiation process, and its effect on the myogenic differentiation process.
During 1–8 days after induction of C2C12 differentiation (DM1-8), the overall expression trend of myoblast marker factors MYOD, MYOG, MYH3, and CFL2 gene was higher than that of C2C12 during growth and proliferation (GM), while the final expression level of CFL1 (DM8) was lower than that of C2C12 during growth (GM). The expression of MYOD increased from 0 to 6 days (GM-DM6) and then decreased from 6 to 8 days (GM6-8). The expression level of MYOD was higher than that of MYOG, MYH3, CFL1, and CFL2 in the late 6–8 days (GM6-8) of differentiation. The expression of MYOG increased from 0 to 2 days (GM-DM2), decreased from 2 to 4 days (DM2-4), increased from 4 to 6 days (DM4-6), and decreased from 6 to 8 days, and the expression level of MYOG was the highest on 2 days (DM2). MYH3 has an upward trend in 0–4 days (GM-DM4) and a larger upward trend in 2–4 days (DM2-4), and a downward trend in 4–8 days (DM4-8). However, the expression level of CFL1 showed an upward trend in the early 1–2 days (DM1-2) of differentiation and gradually decreased in the 4–8 days (DM4-8) after differentiation. On the eighth day of differentiation, the expression level of CFL1 was lower than that in the growth period of C2C12; CFL2 showed an upward trend in 0–6 days and a larger increase in 2–6 days (DM2-6), and CFL2 showed a downward trend in 6–8 days (DM6-8) in the late differentiation stage. The expression level of CFL1 was higher than that of CFL2 in the early stage of differentiation 0–2 days (GM-DM2), while the expression level of CFL2 was higher than that of CFL1 in the 2–6 days differentiation stage, and the expression level of CFL2 always increased in the 0–6 days (GM-DM6), and the expression level of CFL1 was decreased.
3.5. Regulation of CFL1 and CFL2 Genes on Myoblast Differentiation
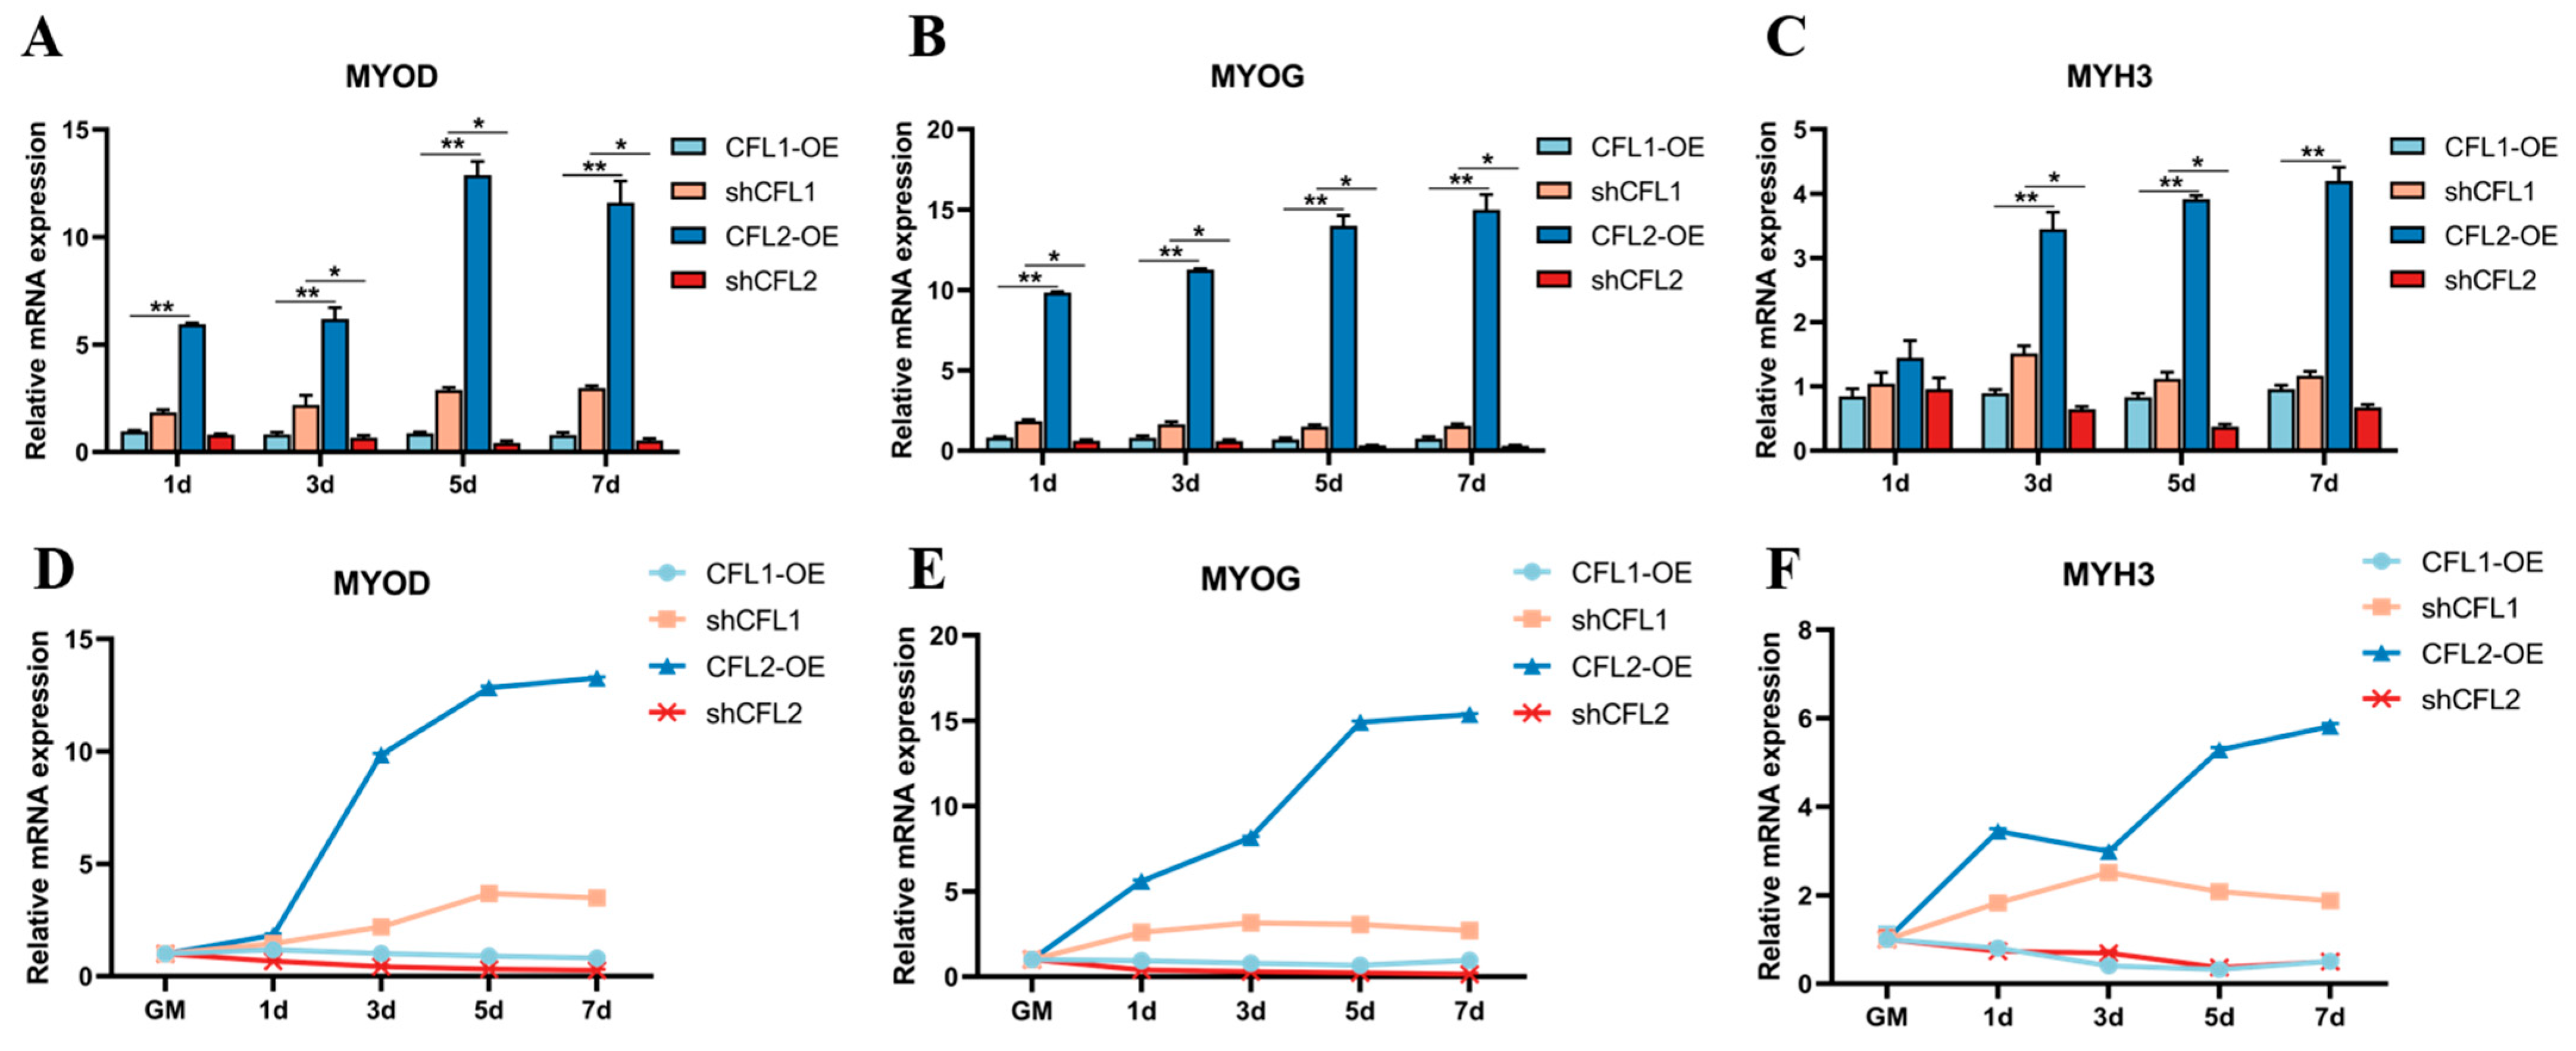
In order to determine the involvement of CFL1 and CFL2 in myogenic differentiation and to explore the roles of CFL1 and CFL2 in the process of myogenic differentiation and their relationship, we constructed adenovirus overexpression vectors and adenovirus interference vectors of CFL1 and CFL2. HEK293 cells packaged adenovirus and collected adenovirus venom, and then the adenovirus venom of CFL1, CFL2 interference, and overexpression vectors were transfected into PBMs and cell differentiation was induced. qRT-PCR detection showed that after transfection of pAd CMV-CFL1 (CFL1-OE), pAd CMV-CFL2 (CFL2-OE), pAd-shRNA-CFL1 (shCFL1), and pAd-shRNA-CFL2 (shCFL2), the expression of muscle marker factors MYOD, MYOG, and MYHC were significantly up-regulated or down-regulated (
p < 0.01) (
Figure 6).
After culturing PBMs and transfecting adenovirus overexpression vector CFL2-OE, the expression levels of MYOD and MYOG were significantly up-regulated at 1–7 d of differentiation (
p < 0.01) (
Figure 6A,B), and the expression level MYH3 at 3–7 d was significantly up-regulated (
Figure 6C). Transfected with adenovirus overexpression vector CFL1-OE, the expression levels of MYOD, MYOG, and MYH3 did not change significantly (
p > 0.01), while transfected adenovirus interference vector shCFL1, the expression levels of MYOD, MYOG, MYH3 at 1–7 d of differentiation were significantly trending upwards (
p < 0.01) (
Figure 6D–F).
When CFL2 was overexpressed, the expression levels of MYOD and MYOG at differentiation 1–7 d were significantly higher than those at overexpression CFL1 (
p < 0.01) (
Figure 6A,B), and the expression level of MYH3 at differentiation 3–7 d was significantly higher than that at overexpression CFL1 (
Figure 6C). When CFL2 was interfered, the expression levels of MYOD and MYH3 at 3–7 d of differentiation were significantly lower than those when CFL1 was interfered (
p < 0.01) (
Figure 6A–C), and the expression levels of MYOG at 1–7 d of differentiation were significantly lower than those when CFL1 was interfered expression level (
p < 0.01) (
Figure 6B). Interestingly, the expression levels of MYOD, MYOG, and MYH3 were higher when CFL1 was overexpressed.
When CFL2 was overexpressed and CFL1 was interfered, the expression levels of MYOD, MYOG, and MYH3 were increased at the differentiation stage and had a large increase in the differentiation period. When CFL2 was overexpressed, the expression levels of MYOD, MYOG, and MYH3 were always higher than those when CFL1 was interfered during 1–7 d differentiation. When CFL2 was interfered and CFL1 was overexpressed, the expression levels of MYOD, MYOG, and MYH3 decreased at the differentiation stage. When CFL2 was interfered, the expression levels of MYOD and MYOG at 1–7 d differentiation were always lower than those when CFL1 was overexpressed (
Figure 6D–F). In summary, during the differentiation stage of PBMs, a high expression level of CFL2 can promote differentiation, while a high expression level of CFL1 can inhibit differentiation.
4. Discussion
Muscle is an important factor affecting the growth and development of animals and one of the essential indicators to gauge meat quality. For cattle, the tenderness of beef refers to the freshness and tenderness of the meat when it is eaten and the quality of the meat. It is determined by the structural characteristics of the protein in the muscle. Meat quality is also a central quantitative trait regulated by a series of genes, and its phenotype has a special regulatory mechanism and a complicated genetic basis. At the transcription or translation level, gene expression regulation could affect the expression level of mRNA or protein [
19]. Muscle fiber is the basic unit of muscle, muscle fiber type composition is an important factor of variation of meat quality, muscle fiber type composition has medium to upper heritability, and is tightly bound to meat quality traits [
20]. Muscle cell differentiation plays a major role in accelerating muscle fiber formation. PBMs serve as an excellent model system for studying muscle cell differentiation in vitro, and serum supplements can be altered to stimulate myoblasts to differentiate into myocytes or to form myotubes. MRFs (muscle regulatory factors) modulate the occurrence and development of muscle, produce a marked effect on myoblast differentiation, and serve as marker genes during myoblast differentiation. MYOD, MYOG, and MYH3 are myogenic regulators of the MRF family that activate muscle gene transcription and drive non-muscle cells to transform into muscle cells. It is especially essential to expound on the genetic regulatory network of genes that is related to muscle growth and development from the viewpoint of genetics.
The actin-binding protein family, ADF/cofilin, is a major actin depolymerization factor and is ubiquitous in eukaryotes. It regulates actin dynamics by promoting the cleavage of F-actin and the depolymerization of actin monomers (G-actin) [
1,
21,
22]. Cofilin family proteins include non-muscle adseverin cofilin-1 (n-cofilin, CFL1) and muscle adseverin cofilin-2 (m-cofilin, CFL2) [
23]. The amino acid coincidence rate of the two proteins was as high as 80%. In addition, due to the high sequence conservation, antibodies often do not distinguish between subtype CFL1 and CFL2. In the chicken genome, only one cofilin protein (CFL2) was expressed, and xenopus could express two cofilin proteins (CFL1/CFL2) [
24]. However, invertebrates (drosophila melanogaster, nematode, and the eggs of Echinococcus multilocularis) and eukaryotic microorganisms (acanthamoeba and Saccharomyces cerevisiae, etc.) only expressed one protein of the ADF/cofilin family. In toxoplasma gondii and coccidia, two ADF/cofilin family proteins could be expressed [
25,
26]. A previous study has revealed that cofilin genes regulate normal muscle function and regeneration. Therefore, as two subtypes of cofilin, CFL1 and CFL2 genes produce a marked effect on muscle growth and development. In healthy mice, the expression type of cofilin changes with the growth and development of muscle cells. In embryonic skeletal muscle, both non-muscle-type CFL1 and muscle type CFL2 were expressed simultaneously, and both of them can promote the recombination of actin filaments in the early stage of myofibrillary formation. However, with muscle growth and development, the expression of the CFL2 gene substitutes the CFL1 gene at the late stage of myocyte differentiation, and cofilin-2 is the only isoform in mature skeletal muscle [
24]. The CFL2 gene is mainly expressed in the end stage of muscle development and may produce a marked effect on muscle physiology or development [
27].
The cDNA sequence analysis of CFL1 and CFL2 genes showed that both CFL1 and CFL2 have a broad tissue expression profile. This observation implies that CFL1 and CFL2 genes may have different biological functions in different tissues of the organism. CFL1 not only participates in the regulation of cytoskeleton structure but also participates in the regulation of various cell functions. Studies have shown that CFL1 is involved in regulating the contractile response mechanism of vascular smooth muscle [
28]. The phosphorylation and dephosphorylation of CFL1 can cause changes in tumor extracellular matrix adhesion, degree of metastasis, cell motility, and vascular invasion, and inhibition of CFL1 activity can reduce tumor cell motility and migration [
29]. Phosphorylated CFL1 also directly activates phospholipase D1(PLD1) and regulates cell chemotaxis and phospholipid metabolism [
30]. CFL1 is also involved in the regulation of mitochondrial function and structure [
31]. The entry of CFL1 into mitochondria helps to open the mitochondrial permeability transition pore and promote the release of pigment C, thereby causing apoptosis [
32]. CFL2 has the ability to bind G- and F-actin in a 1:1 ratio of cofilin to actin. It is the major component of intranuclear and cytoplasmic actin rods. CFL2 plays an important role in regulating the dynamics of striated muscle and fine muscle filaments [
12,
33,
34]. CFL2 is the sixth gene found to be associated with NM disease in humans, and several cases of familial NM caused by mutations in the CFL2 gene have been reported [
13,
35,
36]. Studies have shown that lack of CFL2 leads to cell cycle arrest and blocks the differentiation of satellite cells, leading to failure of skeletal muscle repair [
34]. In mice, CFL2 gene knockout does not affect skeletal muscle development but shows progressive musculoskeletal muscle destruction and accumulation of F-actin [
37,
38]. It has also been shown that CFL2 regulates the length of filaments by participating in the regulation of actin dynamics of filaments in myocytes [
12,
39].
In conclusion, with the development of molecular biology techniques, many pieces of evidence show that CFL1 and CFL2 are related to a variety of effects, and the activities of CFL1 and CFL2 affect intracellular signal transduction and cytoskeletal actin recombination. The complex kinase signaling pathways of the actin family and cytoskeletal proteins are affected by CFL1. The inactivation and reactivation of CFL1 determine the formation and disassembly of F-actin, and CFL1 also allows the aggregation of actin (G-actin), resulting in gene mutations that determine the direction of cell migration. Currently, studies on the CFL2 gene are mainly focused on the proliferation and differentiation of muscle cells and the development, repair, and myopathy of skeletal muscle, with relatively few studies on the growth and development of domestic animals and its specific mechanism of action still needs to be further explored. Growth traits are important indicators of livestock production performance, and growth rate is one of the main target traits in livestock breeding. The bovine CFL1 gene (NC_037356.1) has 5 exons located on chromosome 29, with a full length of 3426bp; the bovine CFL2 gene (NC_037348.1) has four exons located on chromosome 21, with a full length 2653bp. Sun [
40,
41] et al. analyzed the correlation between the nucleotide polymorphisms (SNPs) of CFL1 and CFL2 and the body size traits of 488 QC cattle, and found that SNP T 2052C was significantly related to body length, chest width, chest depth, and body weight (
p < 0.05), G 2107C was significantly related to hip length (
p < 0.05), T 2169C was significantly related to chest width and chest depth (
p < 0.05), G1500A was significantly correlated with hip width (
p < 0.05), and T1694A was significantly correlated with chest circumference, chest depth, waist width, and body weight (
p < 0.05). These results suggest that the CFL1 gene may be a strong candidate gene for influencing growth traits in QC cattle breeding programs. The CFL2 gene is not only closely related to muscle development and maintenance in mammals but also plays an important role in growth traits. Exploring and clarifying the effects of CFL1 and CFL2 genes on the growth and development of domestic animals will provide a new idea for molecular breeding and improvement of domestic animal economic traits.
Our study showed that the overexpression of the CFL1 gene had no significant effect on the expression of MYOD, MYOG, and MYH3, while the overexpression of the CFL2 gene significantly increased the expression of MYOD, MYOG, and MYH3. Down-regulated CFL2 expression significantly reduced the expression of MYOD, MYOG, and MYH3 during the differentiation of PBMs, indicating that increased CFL1 expression had no significant effect on the differentiation of PBMs, but increased CFL2 expression could promote the differentiation of PBMs. This fact may be related to the myogenic regulation of the CFL2 gene in myoblasts. We intend to search for a new mechanism of myogenic differentiation regulated by CFL2 from the viewpoint of genetics and epigenetics. CFL2 depletion inactivates the cellular differentiation process and suppresses the expression of myogenic transcription factors, ultimately resulting in impaired myogenic differentiation in myoblasts [
33,
42]. However, the knockdown CFL1 gene increased the expression of MYOD, MYOG, and MYH3 during PBMs differentiation, suggesting that CFL1 could suppress myoblast differentiation. This may be associated with the gradual disappearance of CFL1 at the end of myofiber differentiation.


