Article

Effects of Tillage Methods on Crop Root Growth Trend Based on 3D Modeling Technology

1
Nanjing Institute of Agricultural Mechanization Ministry of Agriculture and Rural Affairs, Nanjing 210031, China
2
Suzhou Polytechnic Institute of Agriculture, Suzhou 215000, China
3
Graduate School of Chinese Academy of Agricultural Sciences, Beijing 100083, China
4
College of Engineering, Nanjing Agricultural University, Nanjing 210031, China
*
Authors to whom correspondence should be addressed.
Agriculture 2022, 12(9), 1411; https://doi.org/10.3390/agriculture12091411
Submission received: 2 August 2022 / Revised: 1 September 2022 / Accepted: 5 September 2022 / Published: 7 September 2022

Abstract

:
Strip rotary tillage seeding technology has been widely used in rice–wheat rotation system, benefiting the economy greatly. The purpose of farming is to create a comfortable seedbed environment for crop growth. Therefore, it is necessary to consider the effects of tillage methods on wheat root configuration and growth trend in the research of strip tillage, instead of just focusing on optimizing the shape of tillage tools, sowing methods, and soil fragmentation. To clarify the effects of different tillage methods on crop root growth trends, a two-year wheat planting experiment was carried out. Strip tillage (ST1 and ST2) and full width tillage treatment (FT) were designed, 3D models of root structure and soil on the surface of the seedbed wall were established, and four quantitative indexes were proposed: soil surface roughness of seedbed wall (SR), difference coefficient of root soil space occupation (P), difference coefficient of root angle expansion trend (PA), and difference coefficient of root length expansion trend (PL). The results showed that the cultivation method directly affects the growth trend of wheat roots. The wheat roots tended to grow along the inter-specific direction under ST treatment on the 14th day, and the average P, PA, and PL were as high as 38, 43, and 55, respectively. The SR produced by ST1 treatment was 70% lower than that of ST2 treatment, suggesting ST1 treatment had more serious restrictions on root growth. P, PA, and PL in ST1 treatment were 38.5%, 14%, and 43% higher than those in ST2 treatment within 14 days, respectively. This paper briefly explains the effects of tillage methods on the growth trend of wheat roots, provides new methods and technologies for the rapid and effective acquisition of soil surface information, solved the problem of the trend of root expansion being difficult to quantify, and provided a new direction for the optimization of tillage methods.

1. Introduction

With a planting area of 24 million hectares, rice–wheat cropping systems is one of the leading cropping systems in Asia, which is a high-intensity land use system with, typically, a heavy soil texture and poor tillage [1,2,3]. To protect the ecological environment of the farmland and upgrade the farming quality, the strip rotary tillage and sowing technology characterized by less and no tillage, good soil crushing performance, and small soil disturbance range has been introduced into the rice–wheat rotation system, and good economic benefits have been achieved in practice [4].
With continuous popularization and application of strip rotary tillage sowing technology, the optimization research of sowing methods, tillage tools, and tillage quality is also advancing. Matin showed that under the condition of sandy loam, the straight blade has high tillage efficiency, and the seedbed created is more conducive to the growth of crops [5,6]. Lee found that the number of blades directly affects the tillage energy consumption and soil disturbance area, and suggested using four blades as strip tillage components [7]. Celik point out that the width of strip tillage and the disturbed area of soil directly affected the changes of soil temperature and water after tillage, and then affected the ratio of seedling emergence [8]. Hossain showed that the seedbed boundary shape created by strip tillage has a significant impact on seed germination, root growth, and the preservation of soil moisture [9]. Previous studies mostly mention the impact of strip tillage quality on crop growth and development, but no quantitative mechanism is proposed. Matin found that the rotary blade squeezes and smears the soil on the surface of the seedbed wall during farming [10]. When the paddy soil alternates between wetting and drying, the coating layer being cut by cutting tools leads to poor soil aeration, reduced saturated hydraulic conductivity, and increased soil penetration resistance, which then affects the growth, distribution, and functional development of roots [4]. The configuration and topology of a root system can most intuitively reflect the growth, penetration, and occupation of soil space of the root system [11]. Therefore, determining a way in which to describe the characteristics of the soil structure of seedbed wall and quantify the growth trend of crop roots under complex field conditions is the key to analyzing the influence mechanism of strip tillage quality on crop growth and development.
The roughness of soil surface is an important indicator of describing the contour of soil surface [12,13,14], and it is also the most direct indicator of quantifying the characteristics of soil structure on the surface of seedbed wall. At present, the methods to obtain the surface roughness of cultivated soil mainly include the inserting of the plate method [15], probe method and rod ruler method [16], laser measurement technology [17,18], and microwave remote sensing technology [19]. Nowadays, the research methods of root configuration include soil profile method [20], stone method [21], nail plate method [20], and ditch method [22]. In view of the uncontrollability of field landform, and light and climate conditions, the traditional methods to obtain soil surface roughness and root configuration cannot meet the measurement requirements under complex field conditions.
The way in which to obtain the quantitative indexes and models of cultivated soil surface structures and crop root systems under complex field conditions is the key to simplifying the mechanism of the effect of strip tillage quality on crop root growth trend. In view of this key issue, this paper used three-dimensional modeling technology to build a three-dimensional digital model of the seedbed wall and the in situ root system configuration in the field, which realizes the visualization and quantification of the geometric information of the soil surface and the root growth trend after tillage. Through the statistics and analysis of the quantitative indicators, the mechanism of the effect of the soil structure of the seed ditch wall on the growth trend of the crop root system is revealed, which provides a new direction for the optimization of the strip rotary tillage and no-tillage seeding technology.

2. Materials and Methods

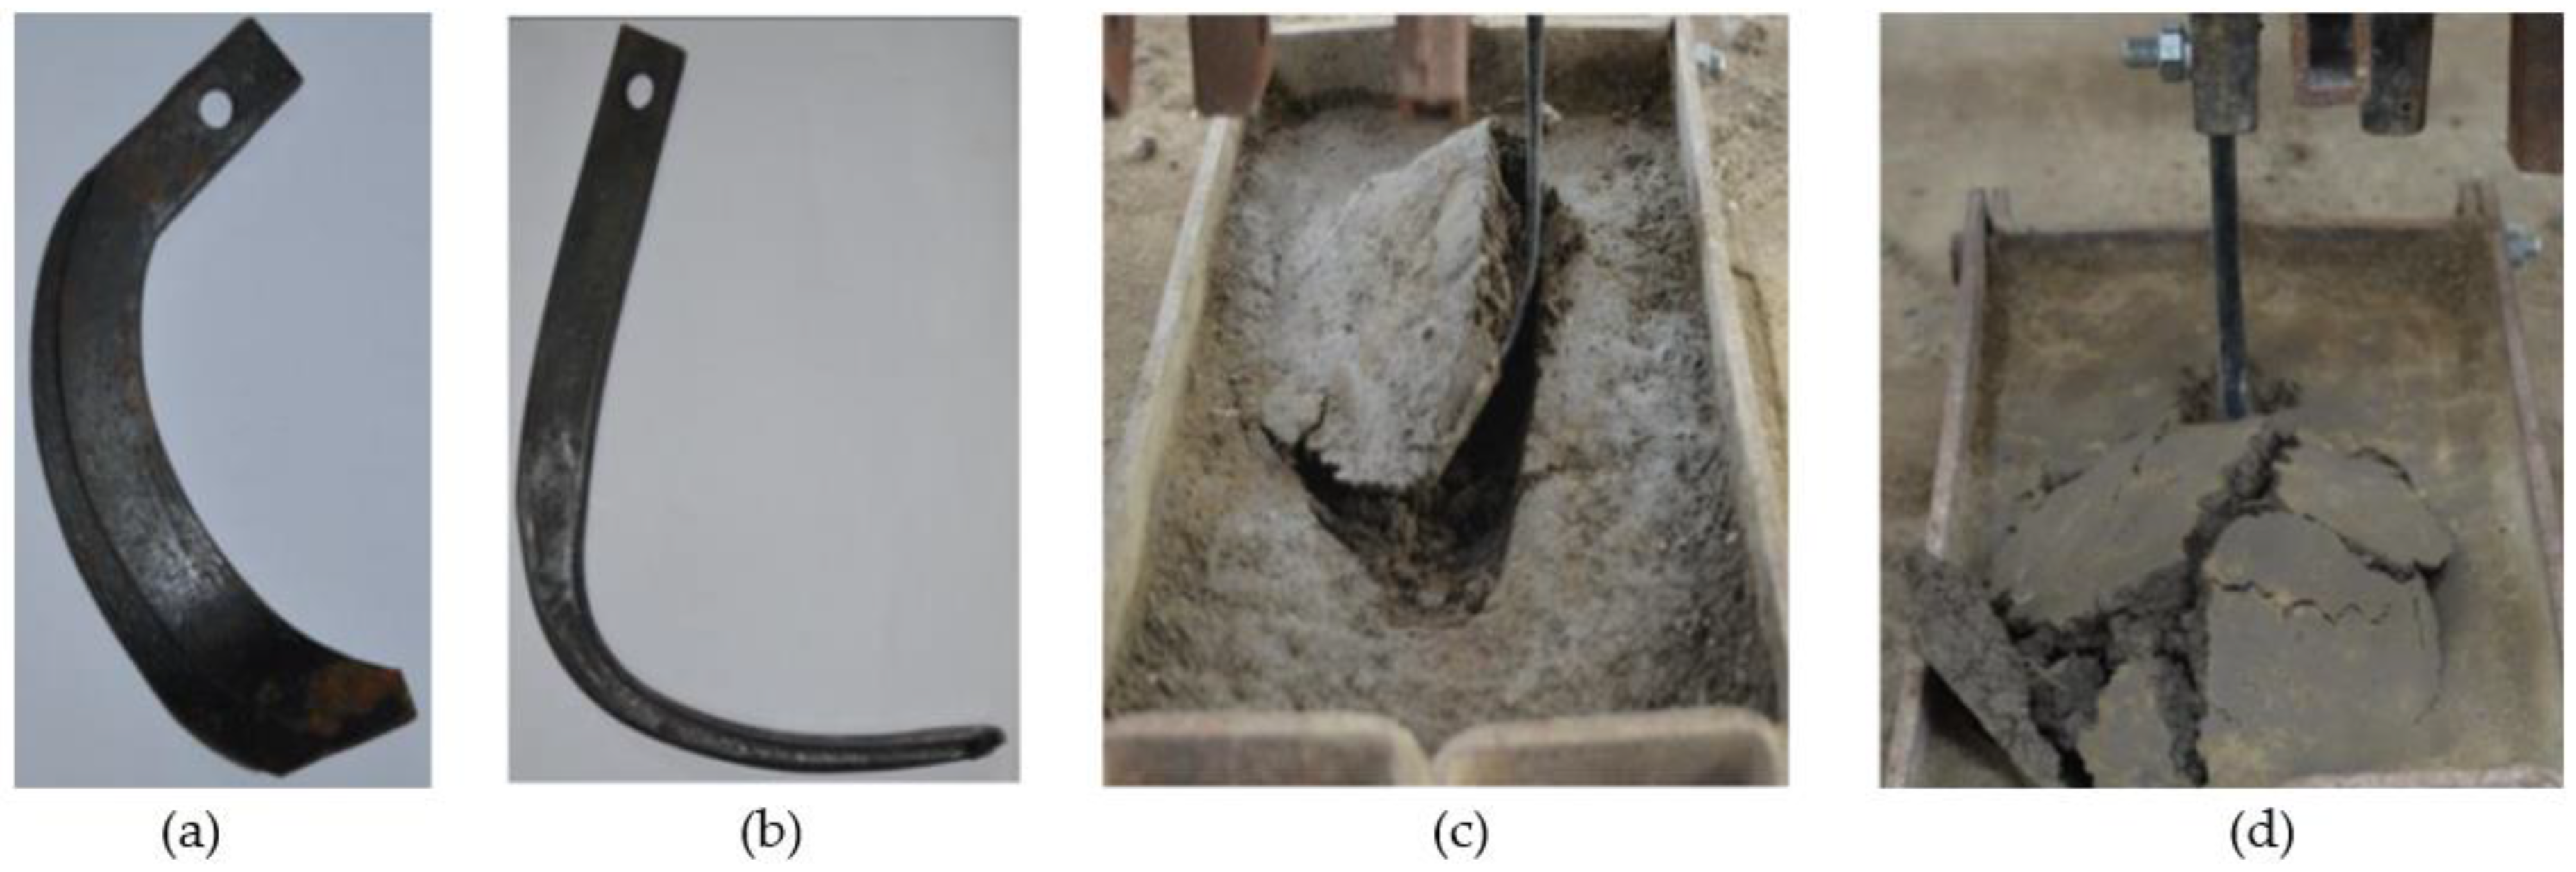
2.1. Test Site and Planting Treatment

The test site is located in the experimental field of Dongshan campus of Suzhou Polytechnic Institute of Agricultural. The soil type is cohesive paddy soil, in which sand, soil, and clay account for 24.1%, 40.4%, and 35.6%, respectively. The contents of soil organic matter, nitrogen and potassium were 8.24 g/kg, 12 mg/kg, 12.67 mg/kg, and 11.05 mg/kg, respectively. The soil bulk density, 0–10 cm cone penetration resistance, and water content of the experimental field are 1.25 g/cm3, 348 kPa, and 31.8% respectively. Two strip tillage treatments (ST1 and ST2) were realized using two tillage tools that are widely used in rice–wheat rotation system in China without returning the previous rice straw to the field. In ST1 and ST2, the bent C blade (Figure 1a) and hoe blade (Figure 1b) are used as farming parts respectively. The dimensional parameters of these two blades refer to the research of Yang Yanshan [4]. According to the practice of rotary tillage and wheat planting in China, the rotating speed of the rotary tillage blade shaft was set at 320 r/min, and the seedbed was 6.5 cm wide, 6 cm deep, and 20 cm apart. The working principles of the two blade are shown in Figure 1c,d. Full-width tillage (FT) was set as the control test. The above three farming methods all adopt the sowing method of manual drill sowing. The two-season experimental planting time was 3 November 2020 and 20 November 2021, respectively. The planting variety was Ningmai 13, and the planting density was 0.73 kg per ha. The field management of wheat is the same as others, natural rain feeding and no irrigation.

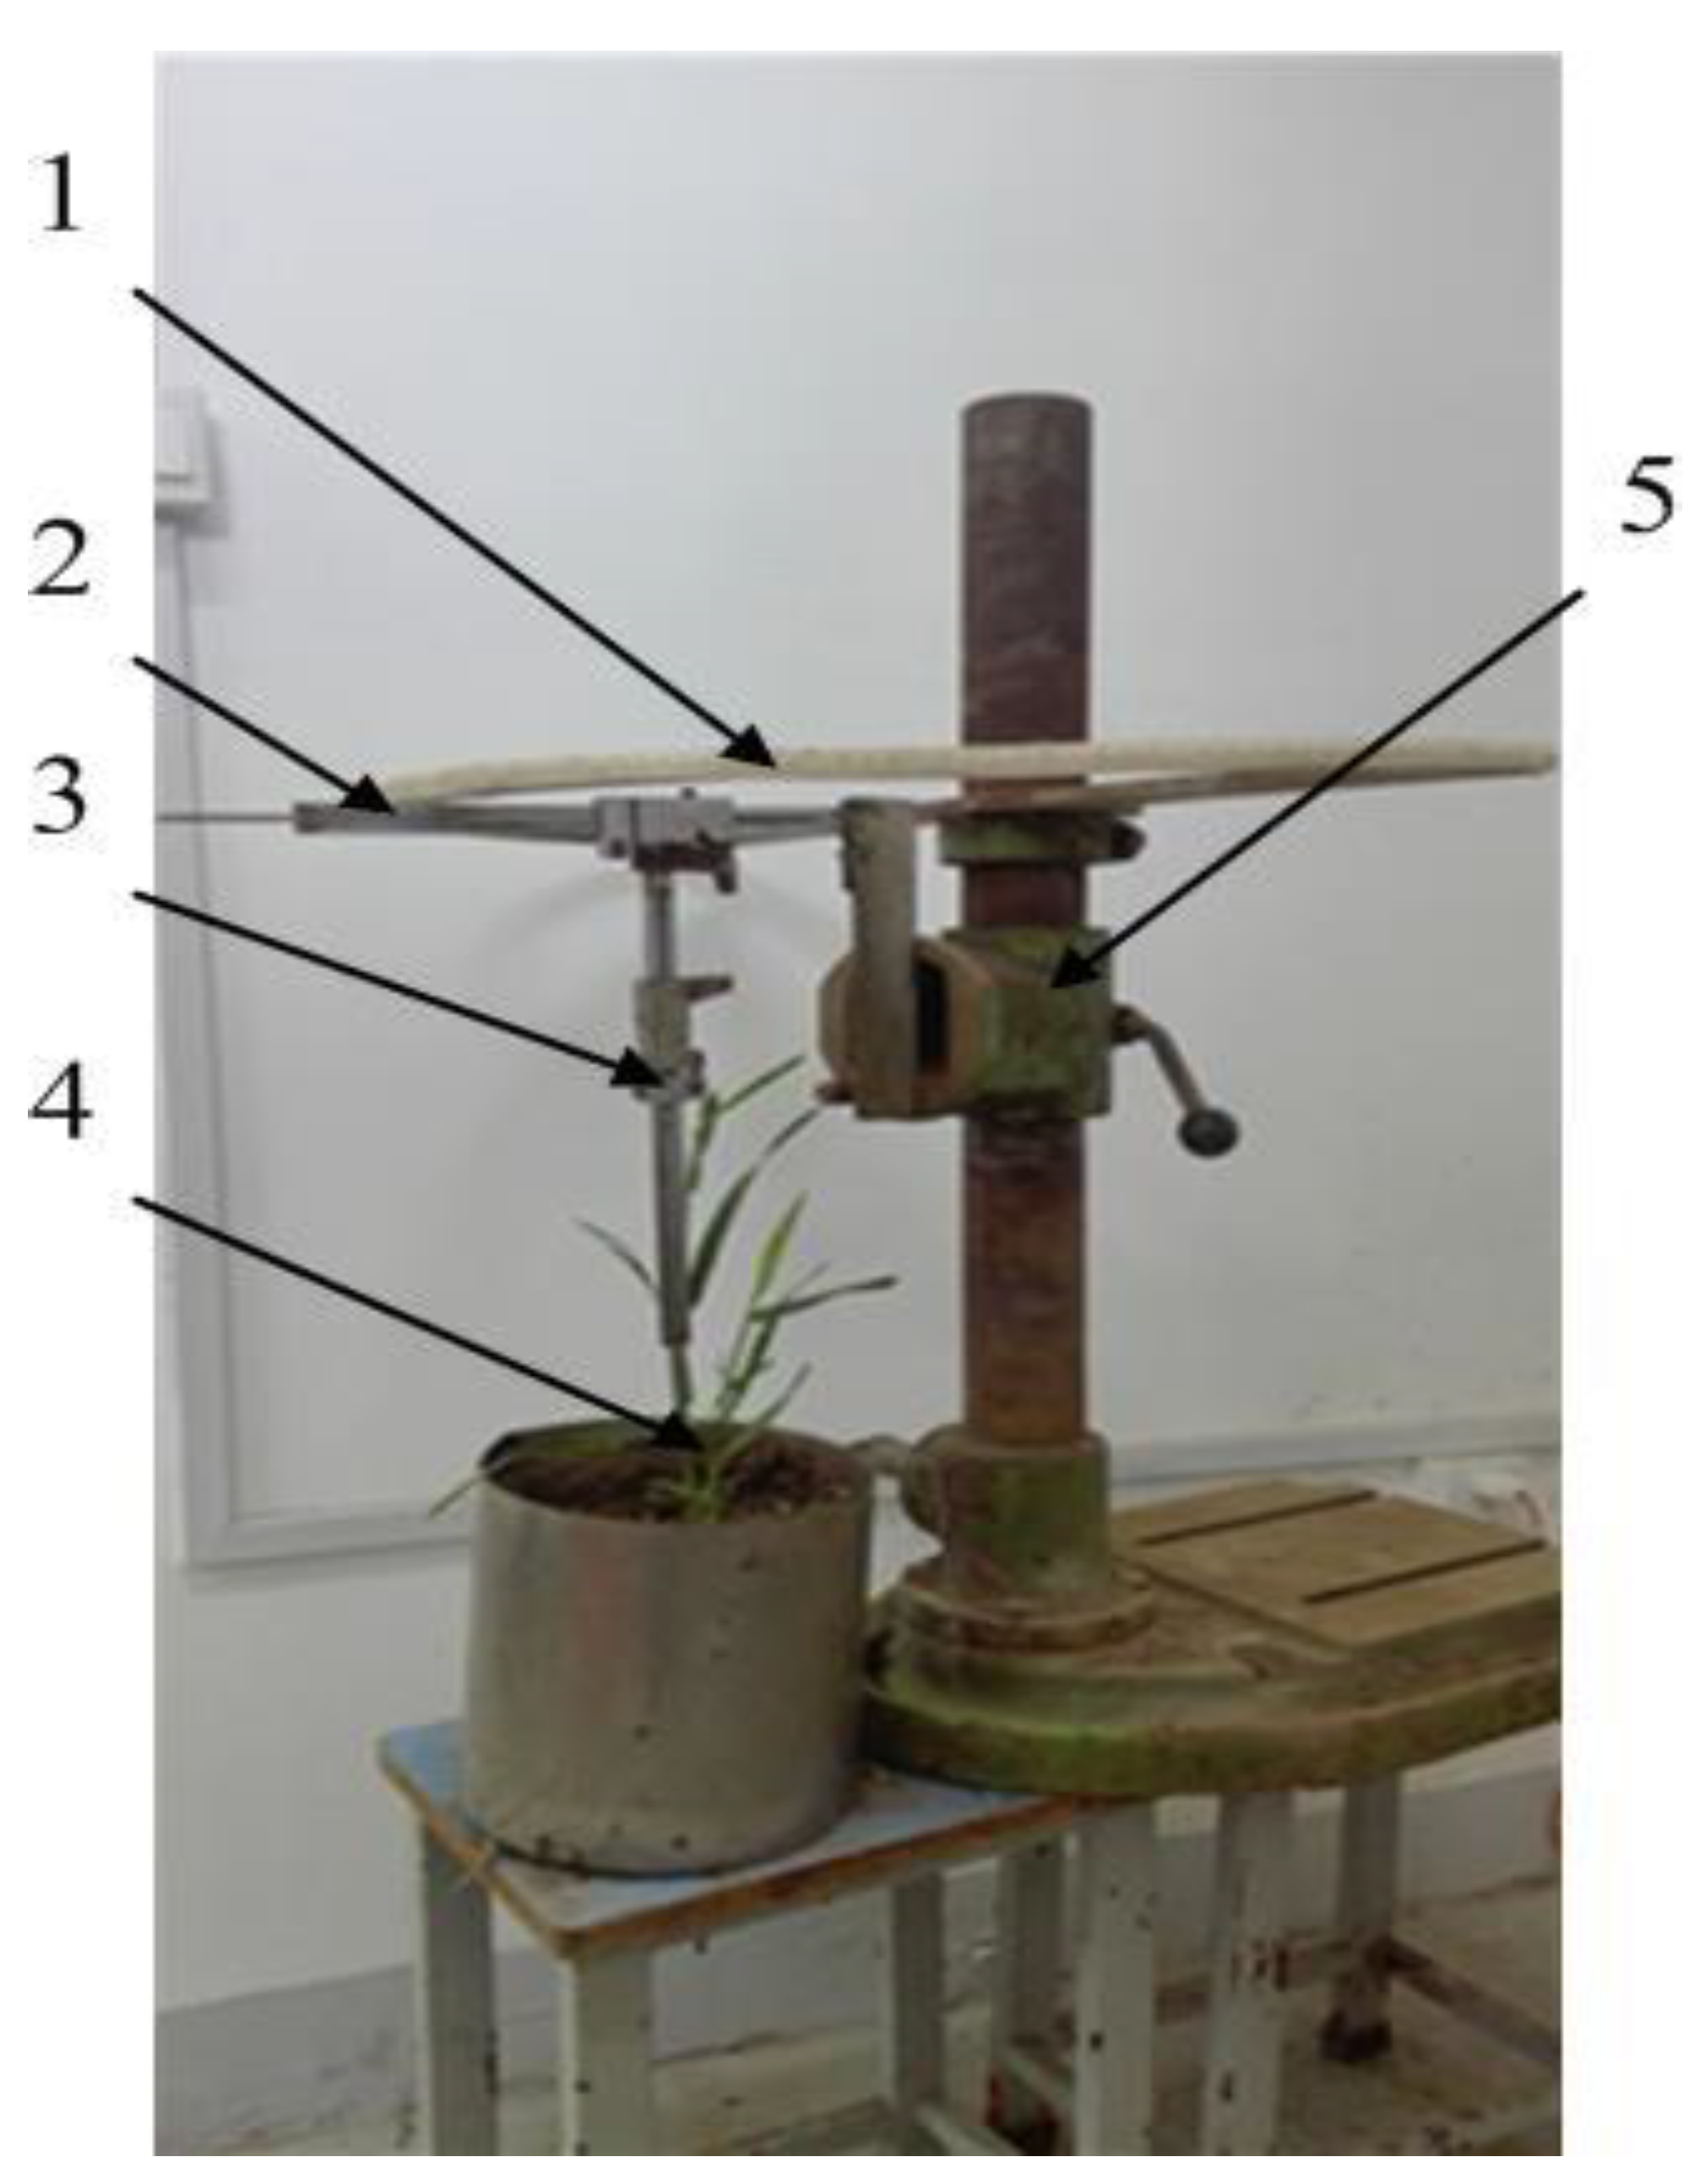
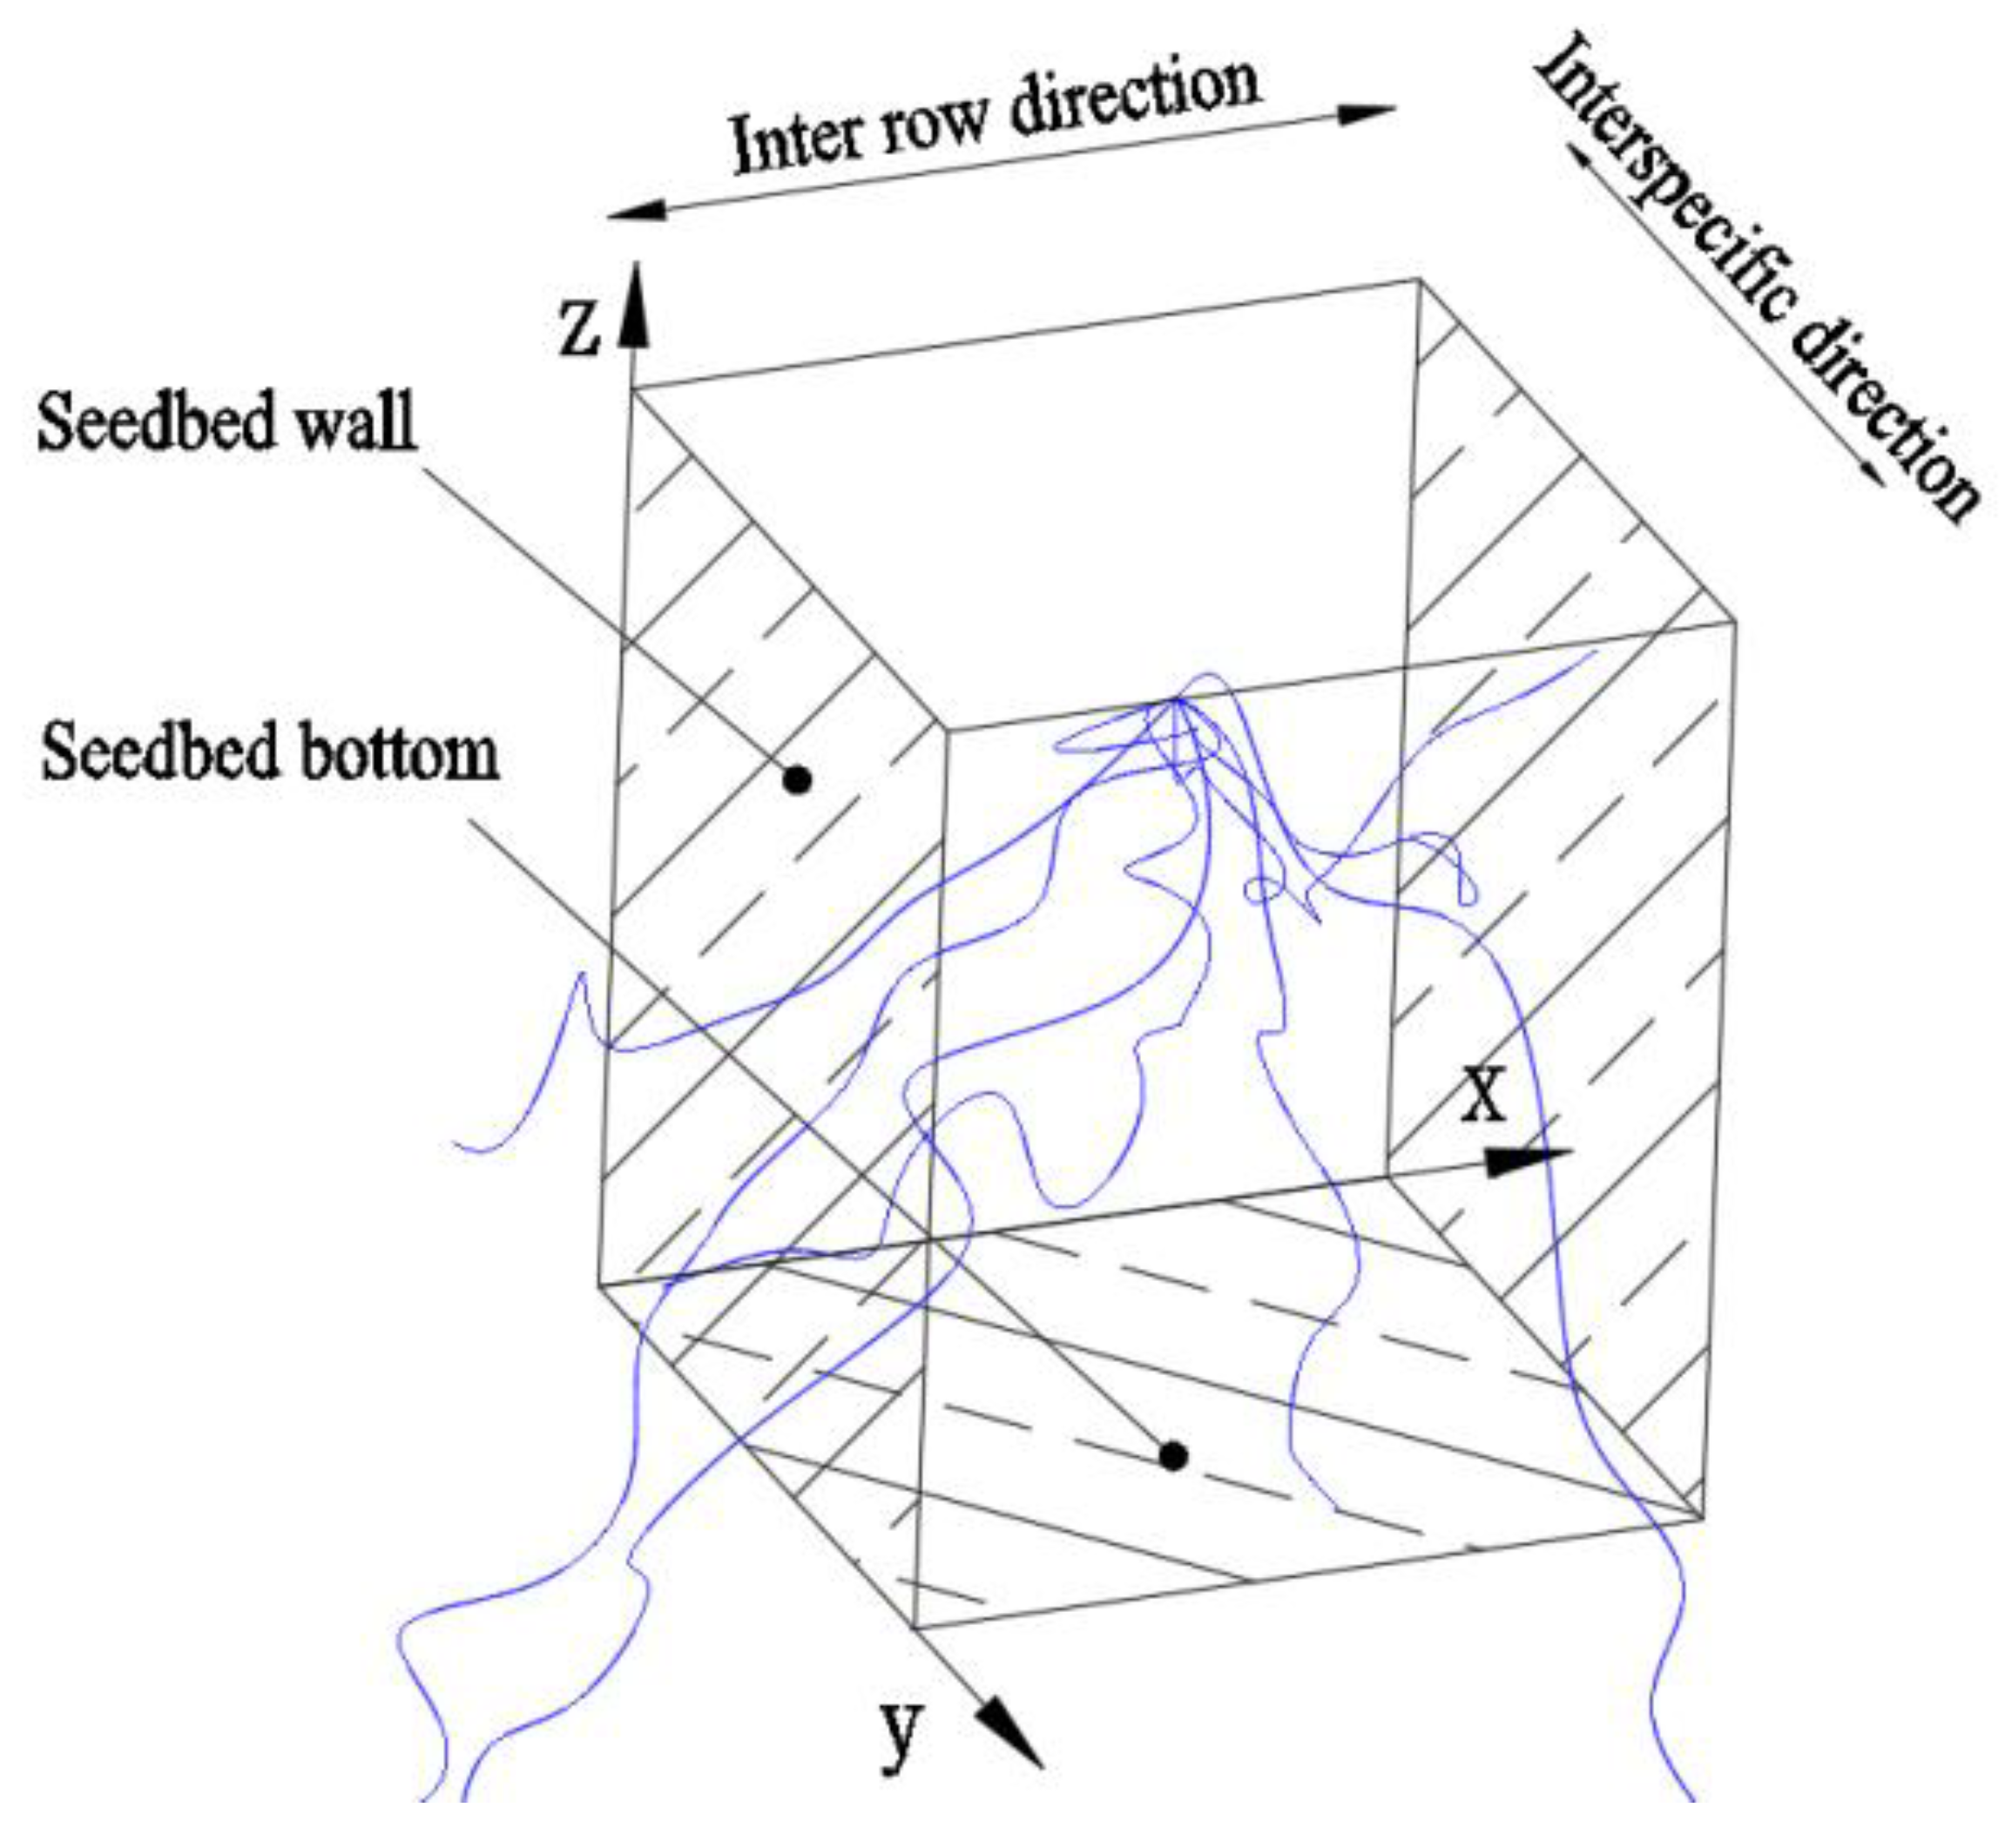
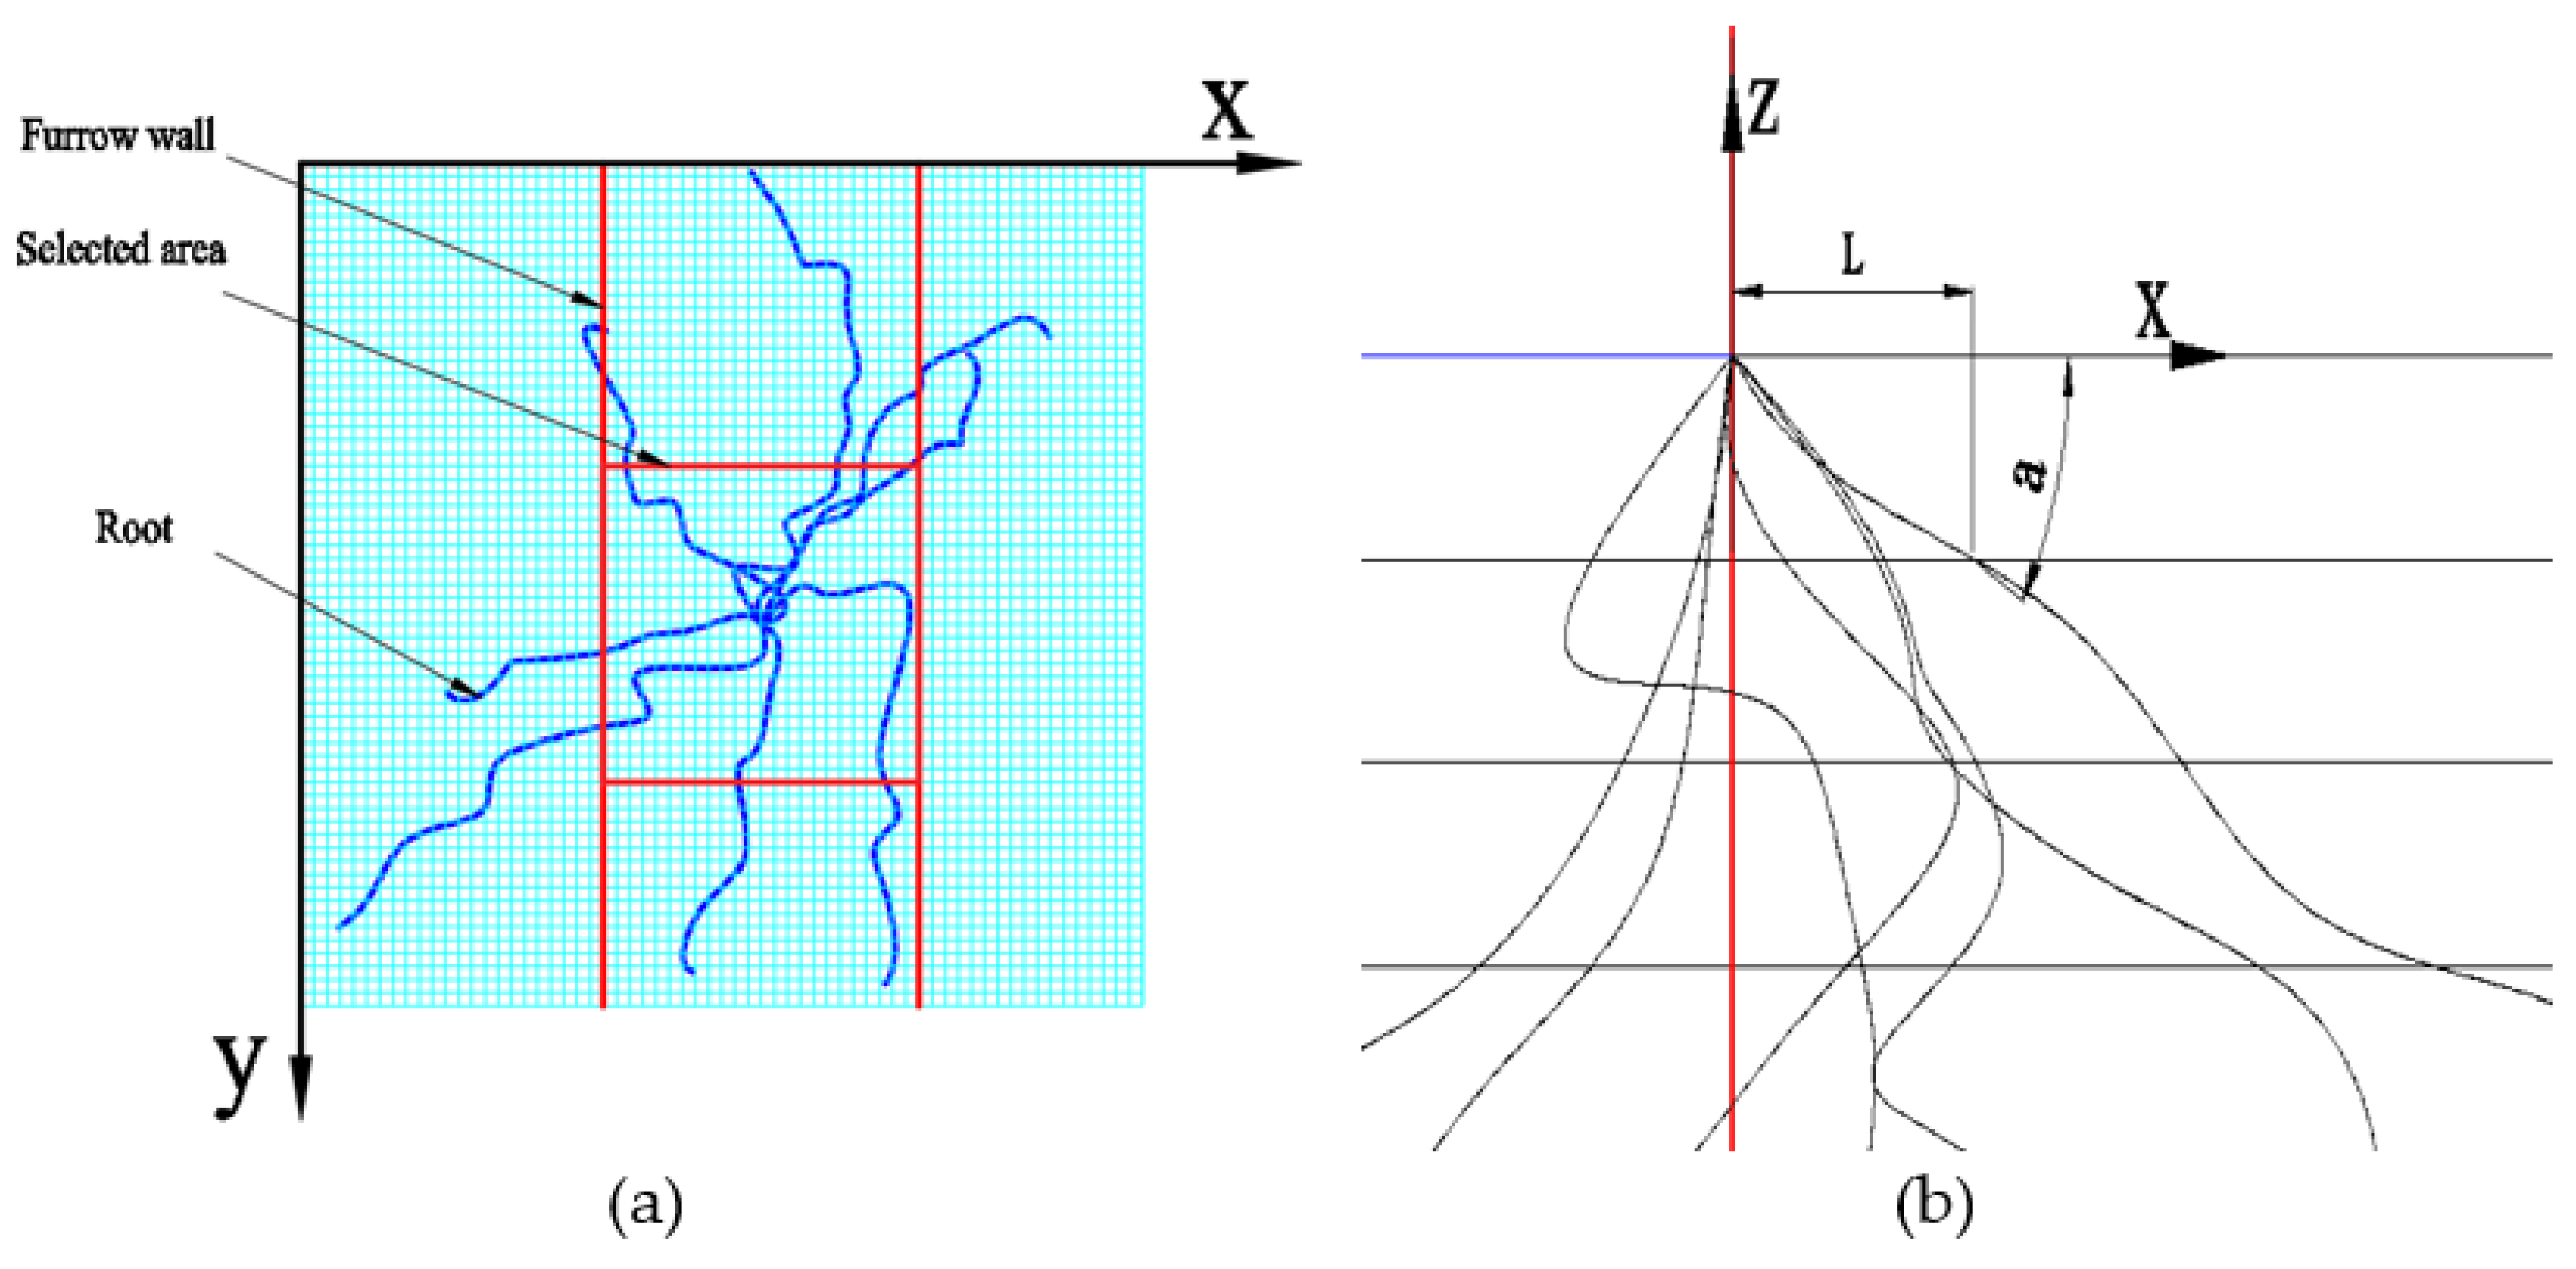
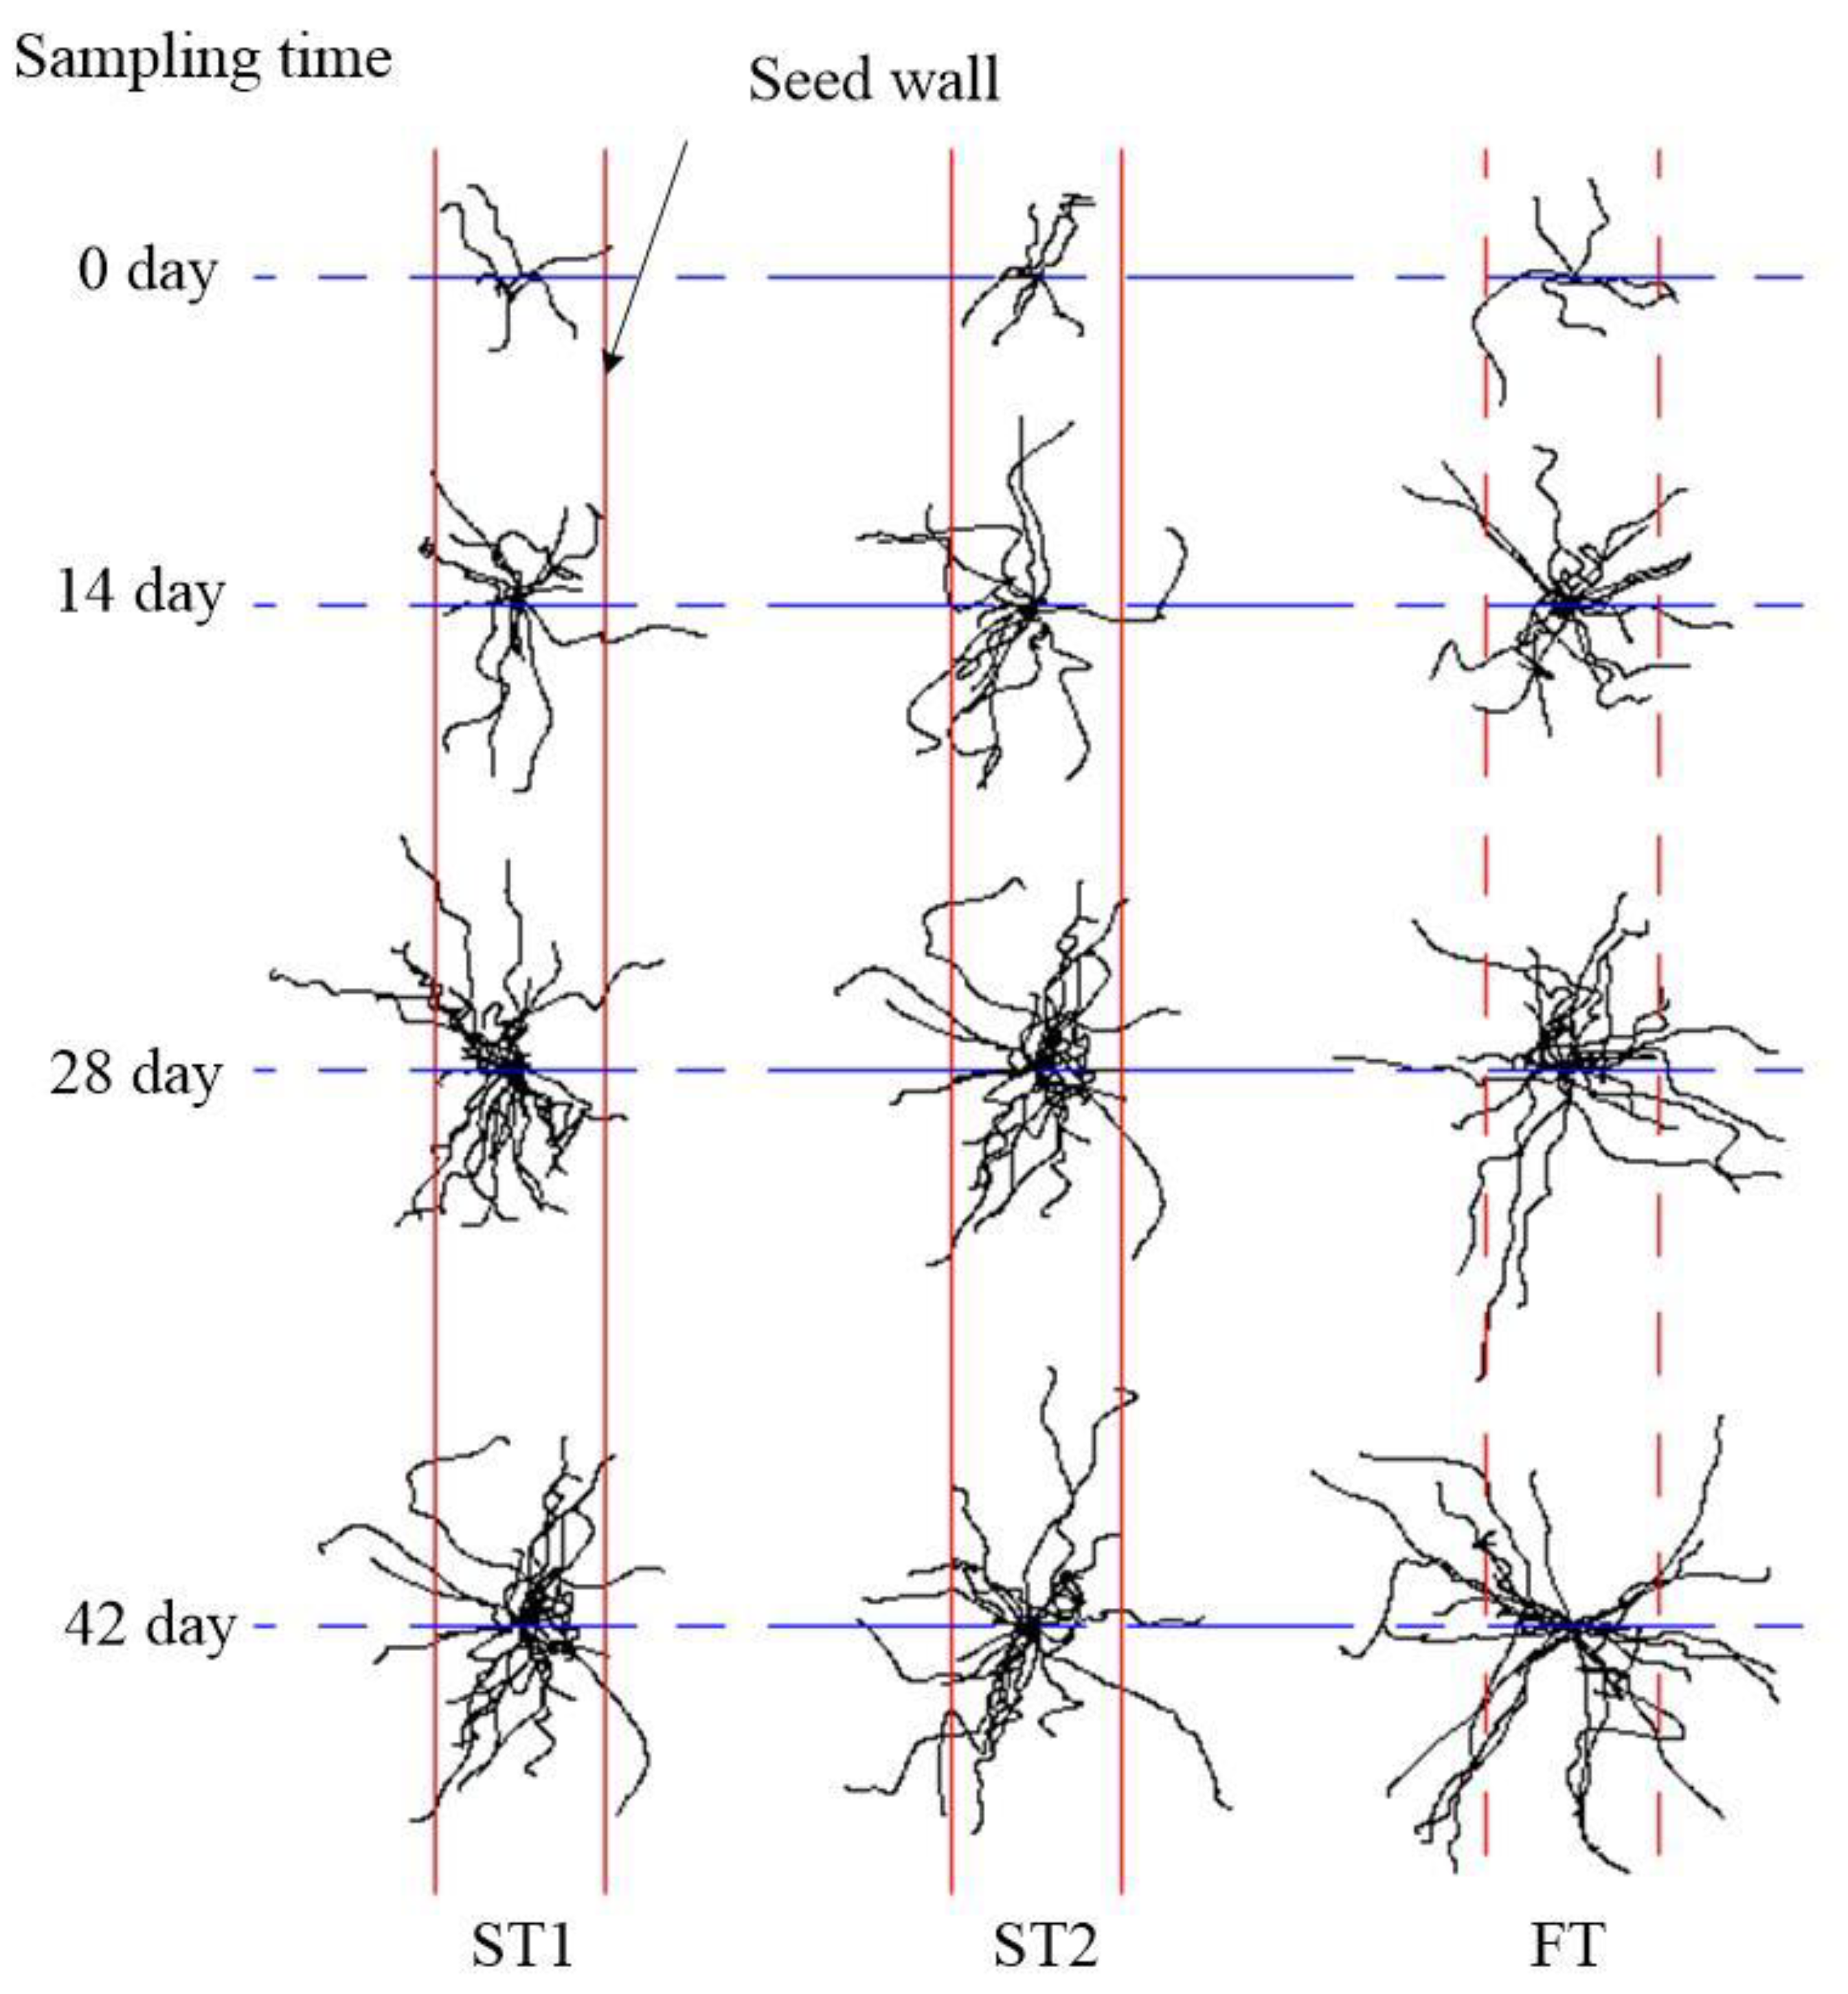
2.2. Collection of Root Configuration Data and 3D Modeling

Taking into overall consideration the growth cycle, distribution characteristics, soil recovery time, and sampling workload of wheat roots, the sampling time started when the wheat plants had 2~3 leaves, and the sampling period was set as 14 d, with a total of 4 times, and the root samples were marked as 0, 14, 28, and 42 d, respectively. During sampling, four wheat plants that grew evenly above ground of each tillage treatment were randomly selected, and a sampling cylinder with a diameter of 20 cm and a height of 20 cm was used to obtain a complete sampling of wheat roots [23].
The root configuration digitizer (Figure 2) was used to obtain the spatial topology data of the root system. During the test, according to the growth condition of the wheat root system, the soil was stripped with a needle tip with a thickness of 3–5 mm, and the soil was removed layer by layer from top to bottom. After the root system was exposed, the horizontal scale and the vertical scale were moved to make the probe tip contact the system, and the values of the curved scale, level scale, and vertical scale were read in sequence; θ, x0 and z0 are original coordinate data. After all the roots in the soil layer were measured in sequence, the data test of the next soil layer was conducted again until all the tests of one root system were completed.
We took the first point of the original coordinates (the first row of the original coordinates in Table 1) as the base point, converted the original coordinates into relative coordinates, used Formulas (1)–(3) to convert the measured relative coordinate data into space coordinate data that can be recognized by the computer, and imported it into SolidWorks software to generate a three-dimensional model of the root system [23] (Figure 3).
x = x 1 cos θ 1
y = x 1 sin θ 1
z = z 1
where, θ1, x1, z1 are relative coordinates, x, y, z are spatial coordinates.

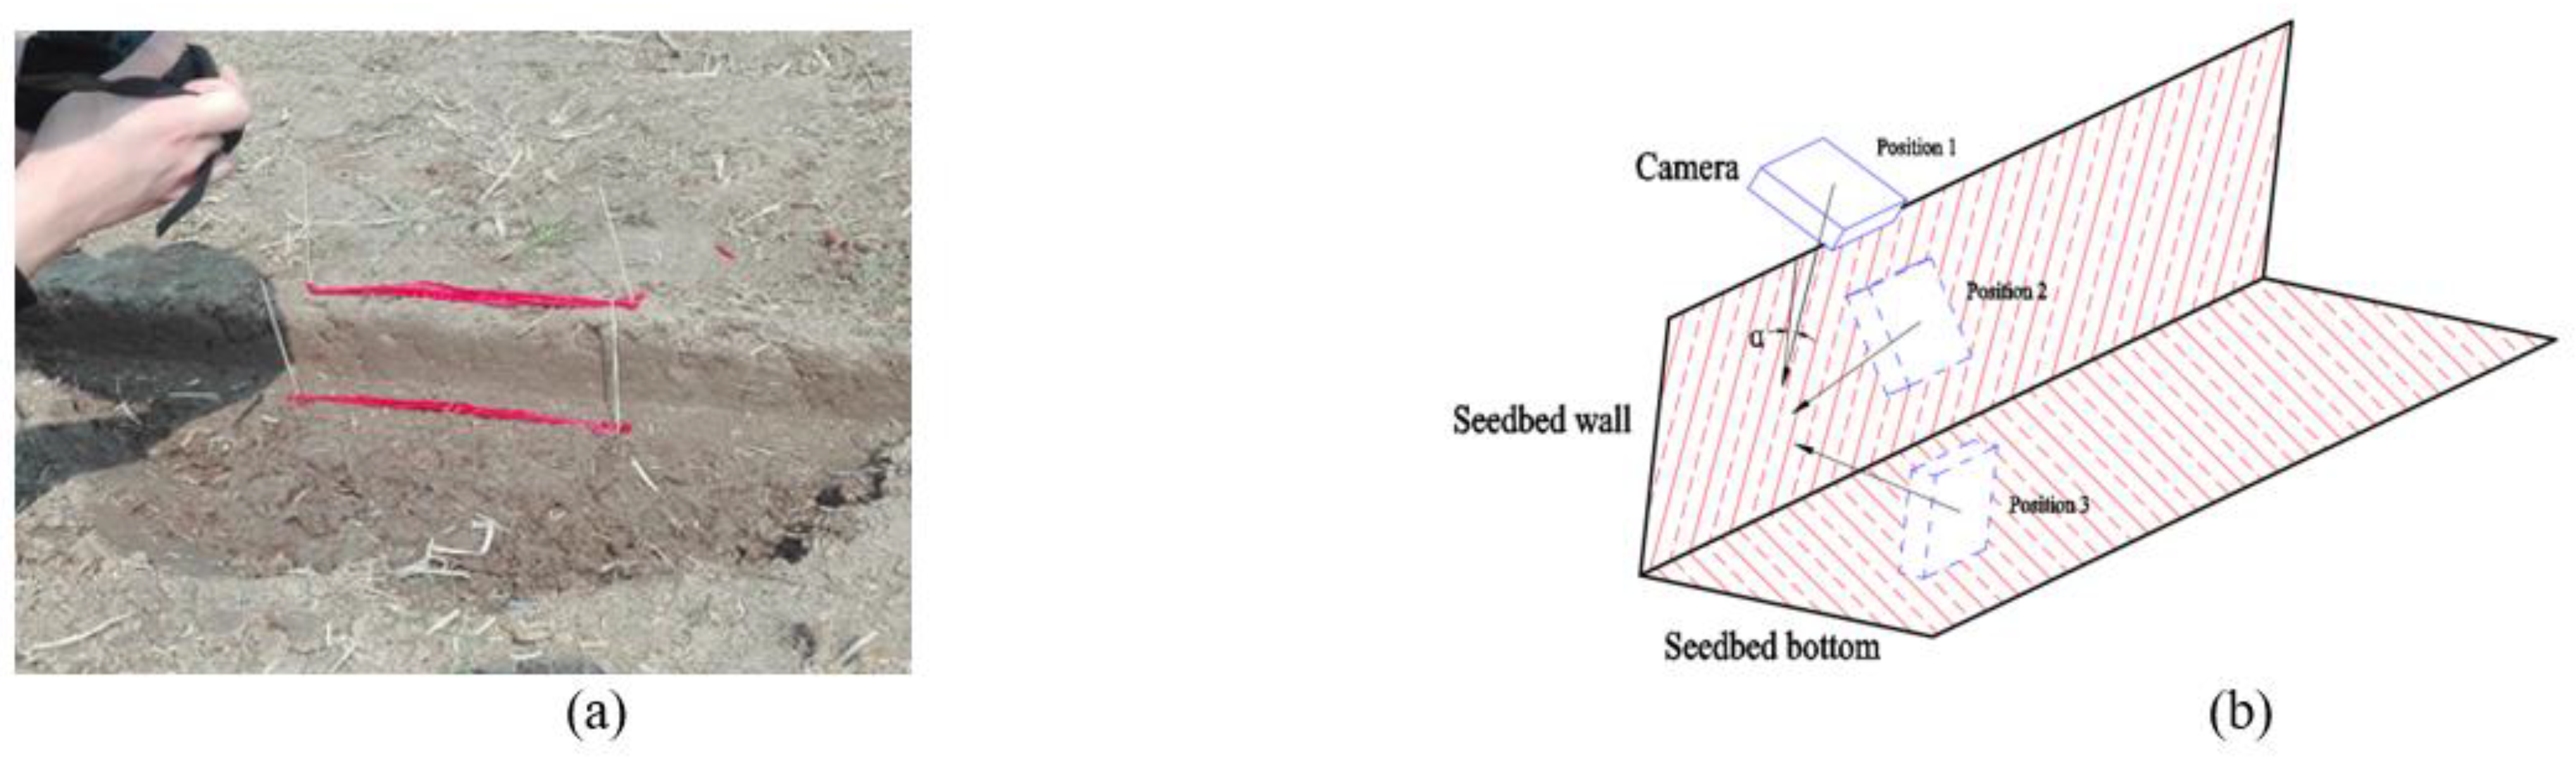
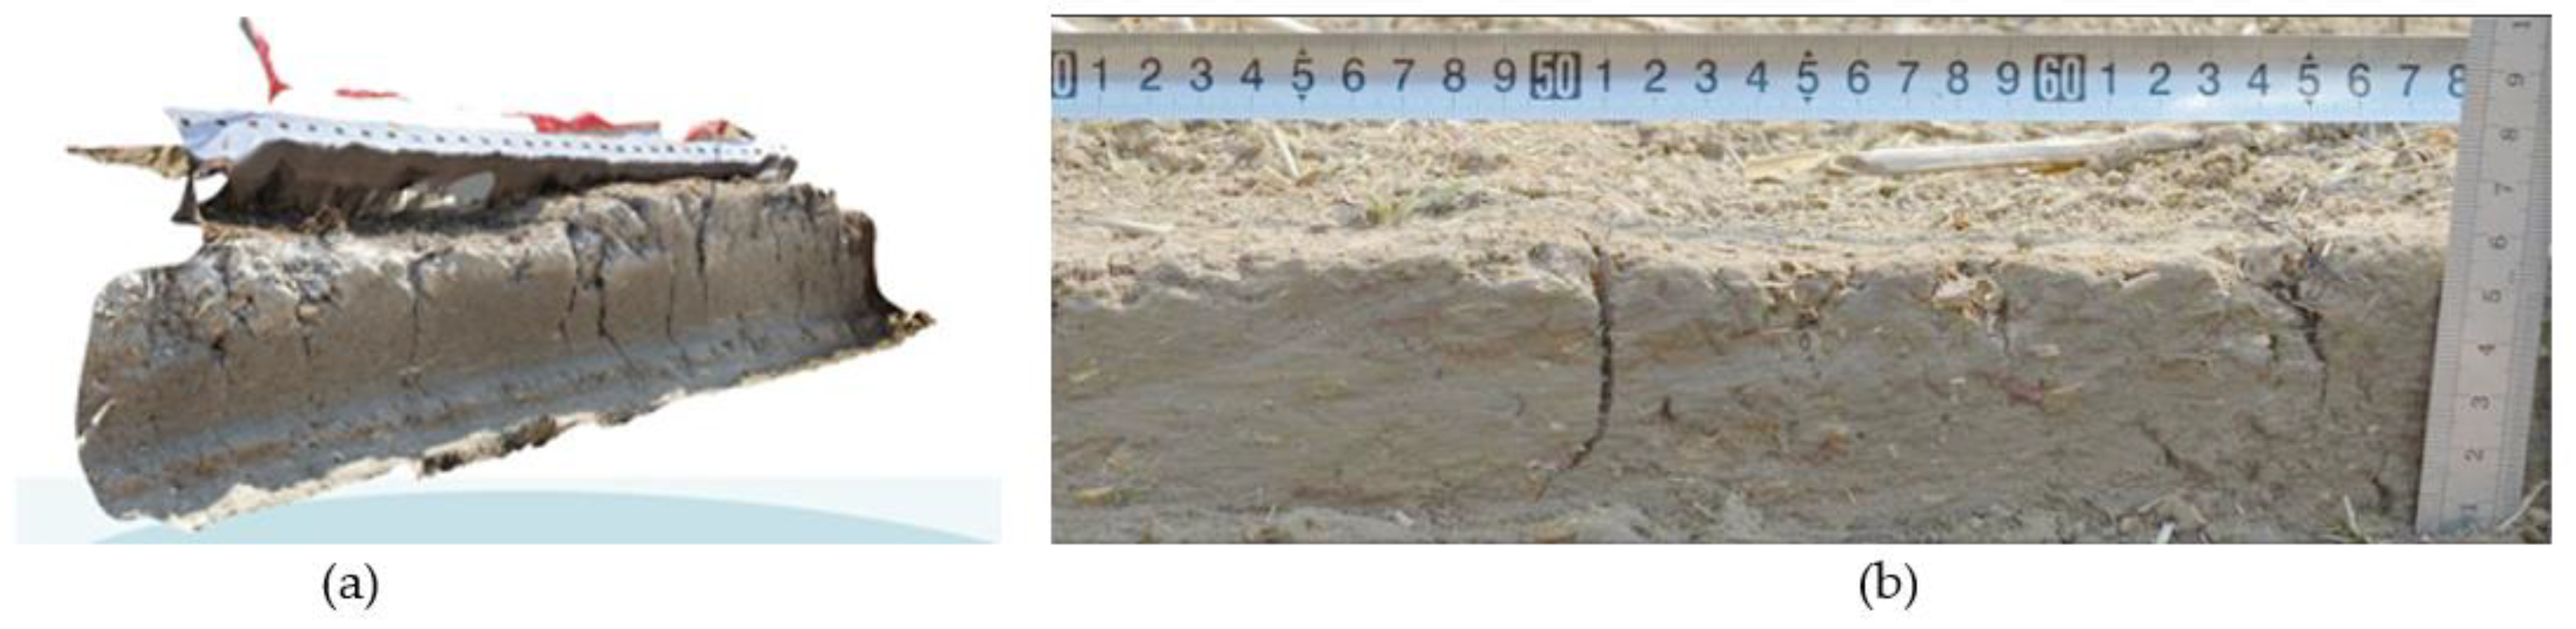
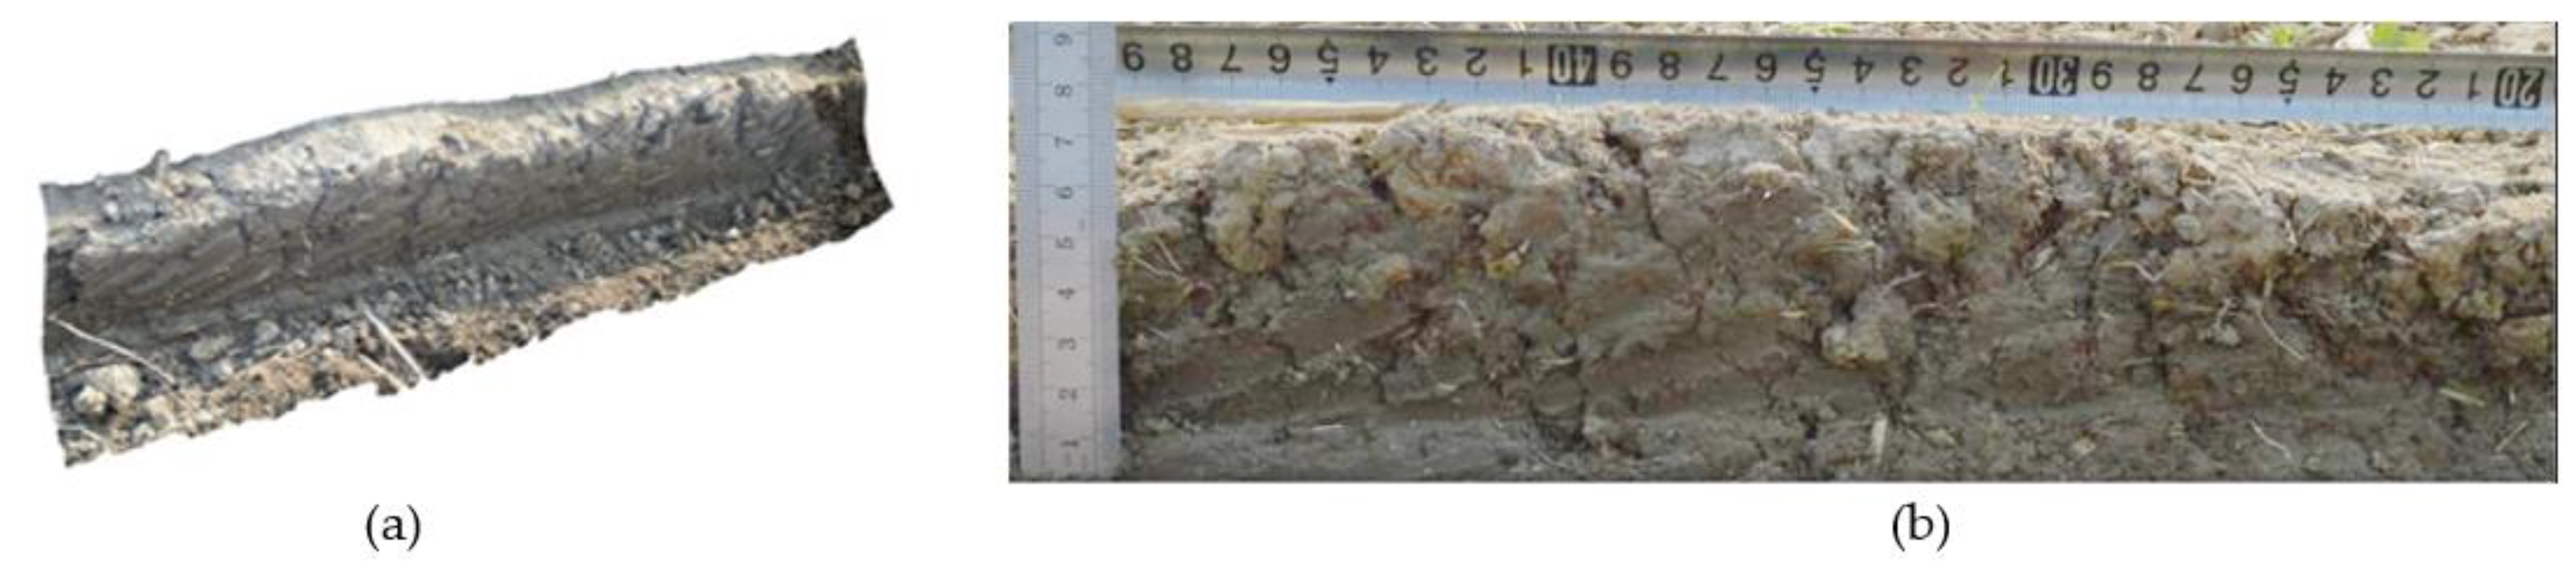
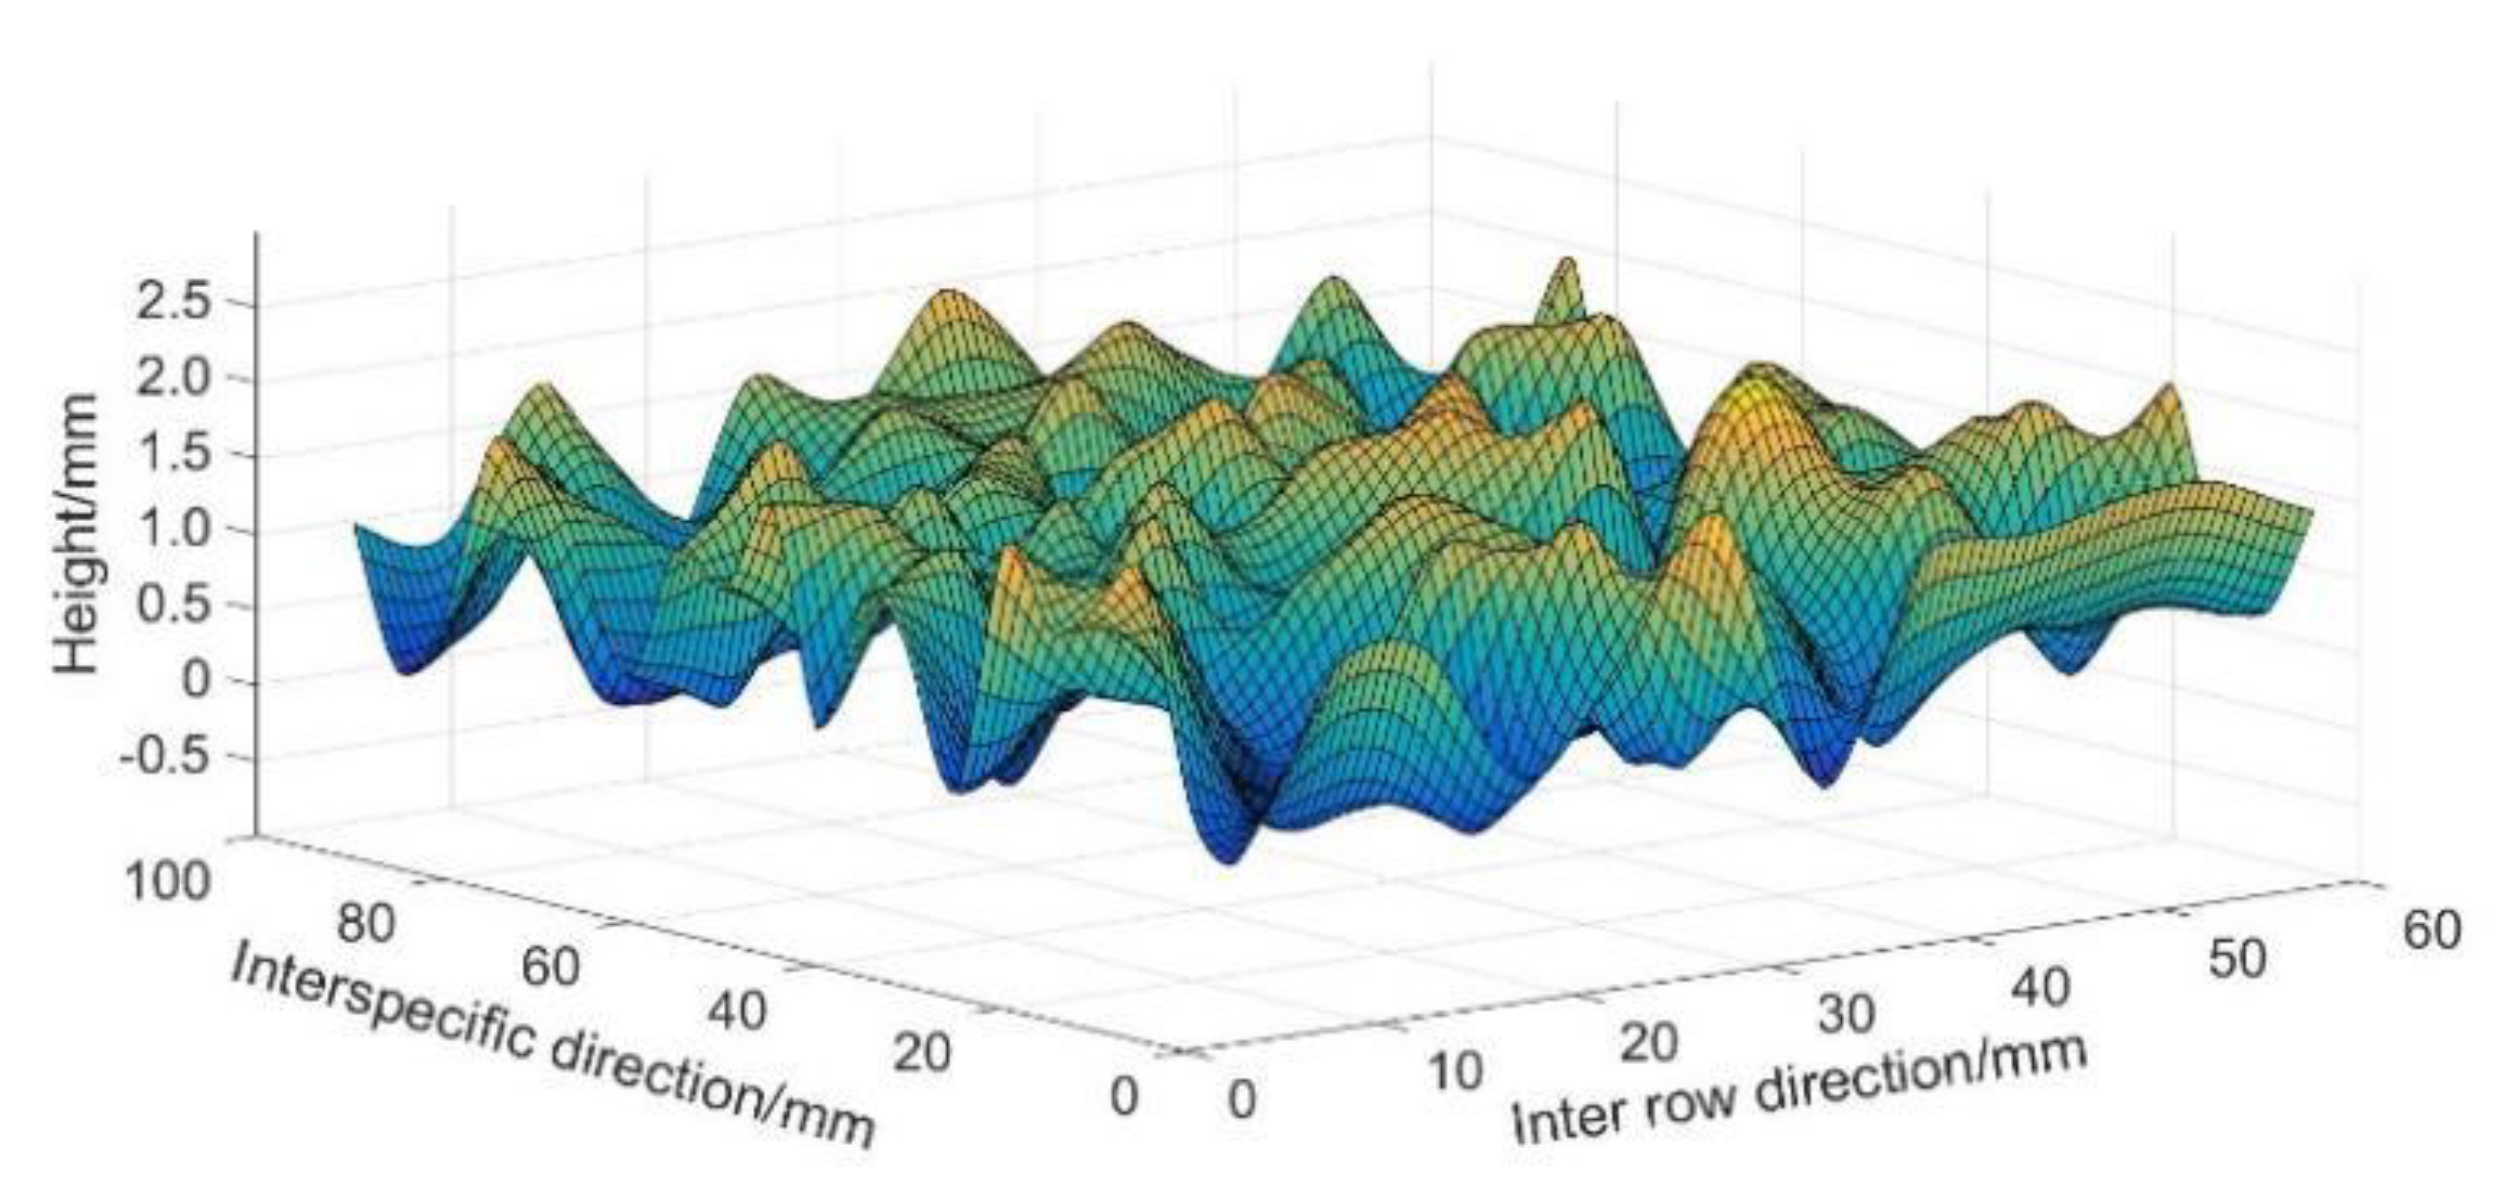
2.3. D Modeling of the Soil Surface of the Seedbed Wall

In order to obtain the soil surface roughness of the seedbed wall at different sampling times, a 1 m-long farming area was randomly selected as the shooting area, and the broken soil inside and outside the seedbed was gently cleaned up with a brush. One side of the trench wall was selected as the soil roughness measurement surface, and the other side of the trench wall and the surrounding soil was removed to facilitate image acquisition (Figure 4a).
As shown in Figure 4b, the camera was adjusted to a certain height, and photos were taken in an oblique and vertical way along one end of the selected shooting area from positions 1, 2, and 3, respectively. There is over 80% overlap between the photos taken each time, and the ones taken previously to those. The extension line of the lens at positions 1 and 2 forms an included angle with the ground, and the overlap of the photos taken at the two positions can be more than 80%. For some soil surface areas whose shapes are extremely complex and it is difficult for the previously collected images to fully capture all their characteristics, the complex areas were shot from multiple angles and directions to ensure that the subtle parts are presented on at least three photos with different angles or directions.
The obtained soil surface image of the seedbed wall was placed in Autodesk Remake, and feature points were matched using the processes of scale space construction, extreme value detection, feature point quality detection, and key point description [24]. By extracting feature points, the seed point cloud is generated and diffused based on the feature points to obtain the basic point cloud model. Using the point cloud data model, the 3D modeling of the soil surface of the seedbed wall was completed using the steps of pushing the scene and obtaining the integral relationship.

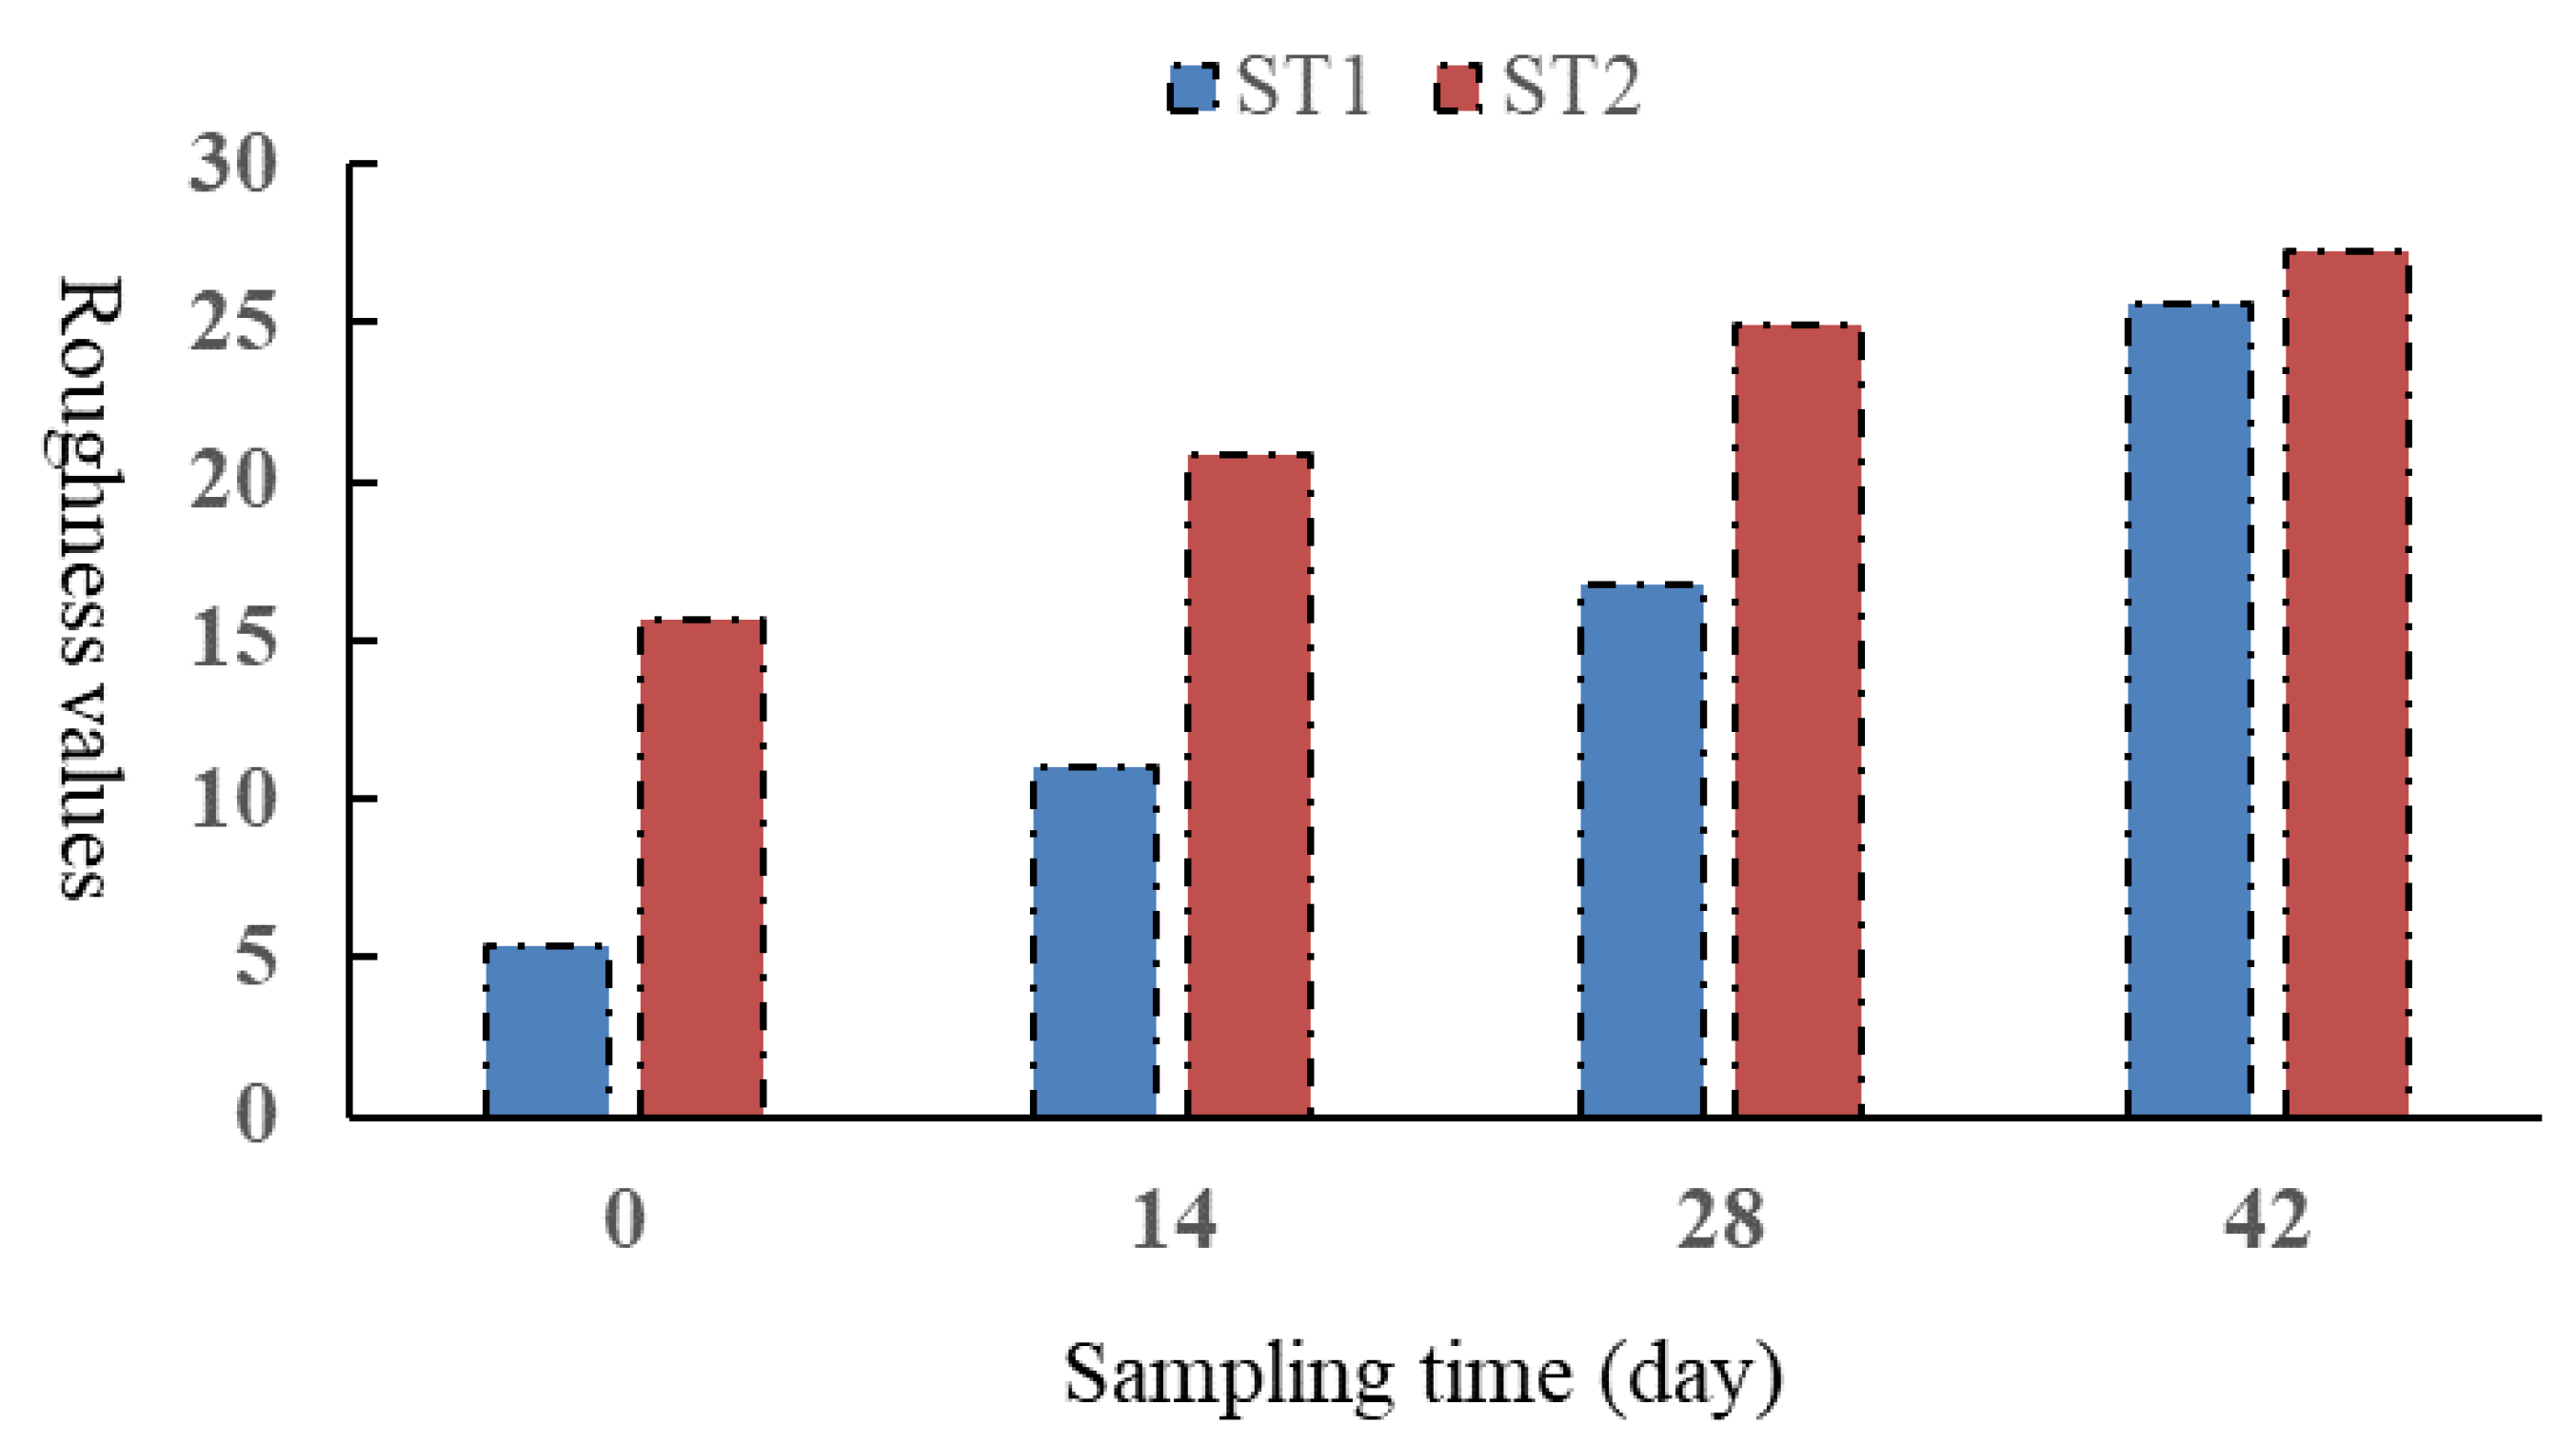
2.4. Calculation of Soil Surface Roughness of the Seedbed Wall

Surface roughness refers to the roughness of the soil surface with a certain distance and the unevenness of the peak and valley. Based on the 3D model of the soil surface of the seedbed wall at different sampling times, the soil roughness of the seedbed wall surface is expressed by the roughness coefficient SR of the soil surface of the seedbed wall. The smaller the value of R is, the smoother the surface of the seedbed wall is, which is more unfavorable to the growth of crop roots. The calculation formula is as follows [25]:
S R = S a S p 1 × 100
where:
  • SR—roughness coefficient of trench wall surface;
  • Sa—surface area of trench wall soil (mm2);
  • Sp—Projected area of soil wall (mm2).

2.5. Trend Coefficient and Difference Coefficient of Root Expansion

In order to explore the influence of strip tillage on the interspersed expansion of roots, the wheat root structure model was projected to the x-y plane, x-z plane, and y-z plane, respectively, as shown in Figure 3, to calculate the space occupation rate of soil inside and outside the seedbed, the inter-row expansion trend, and the expansion tendency between species.

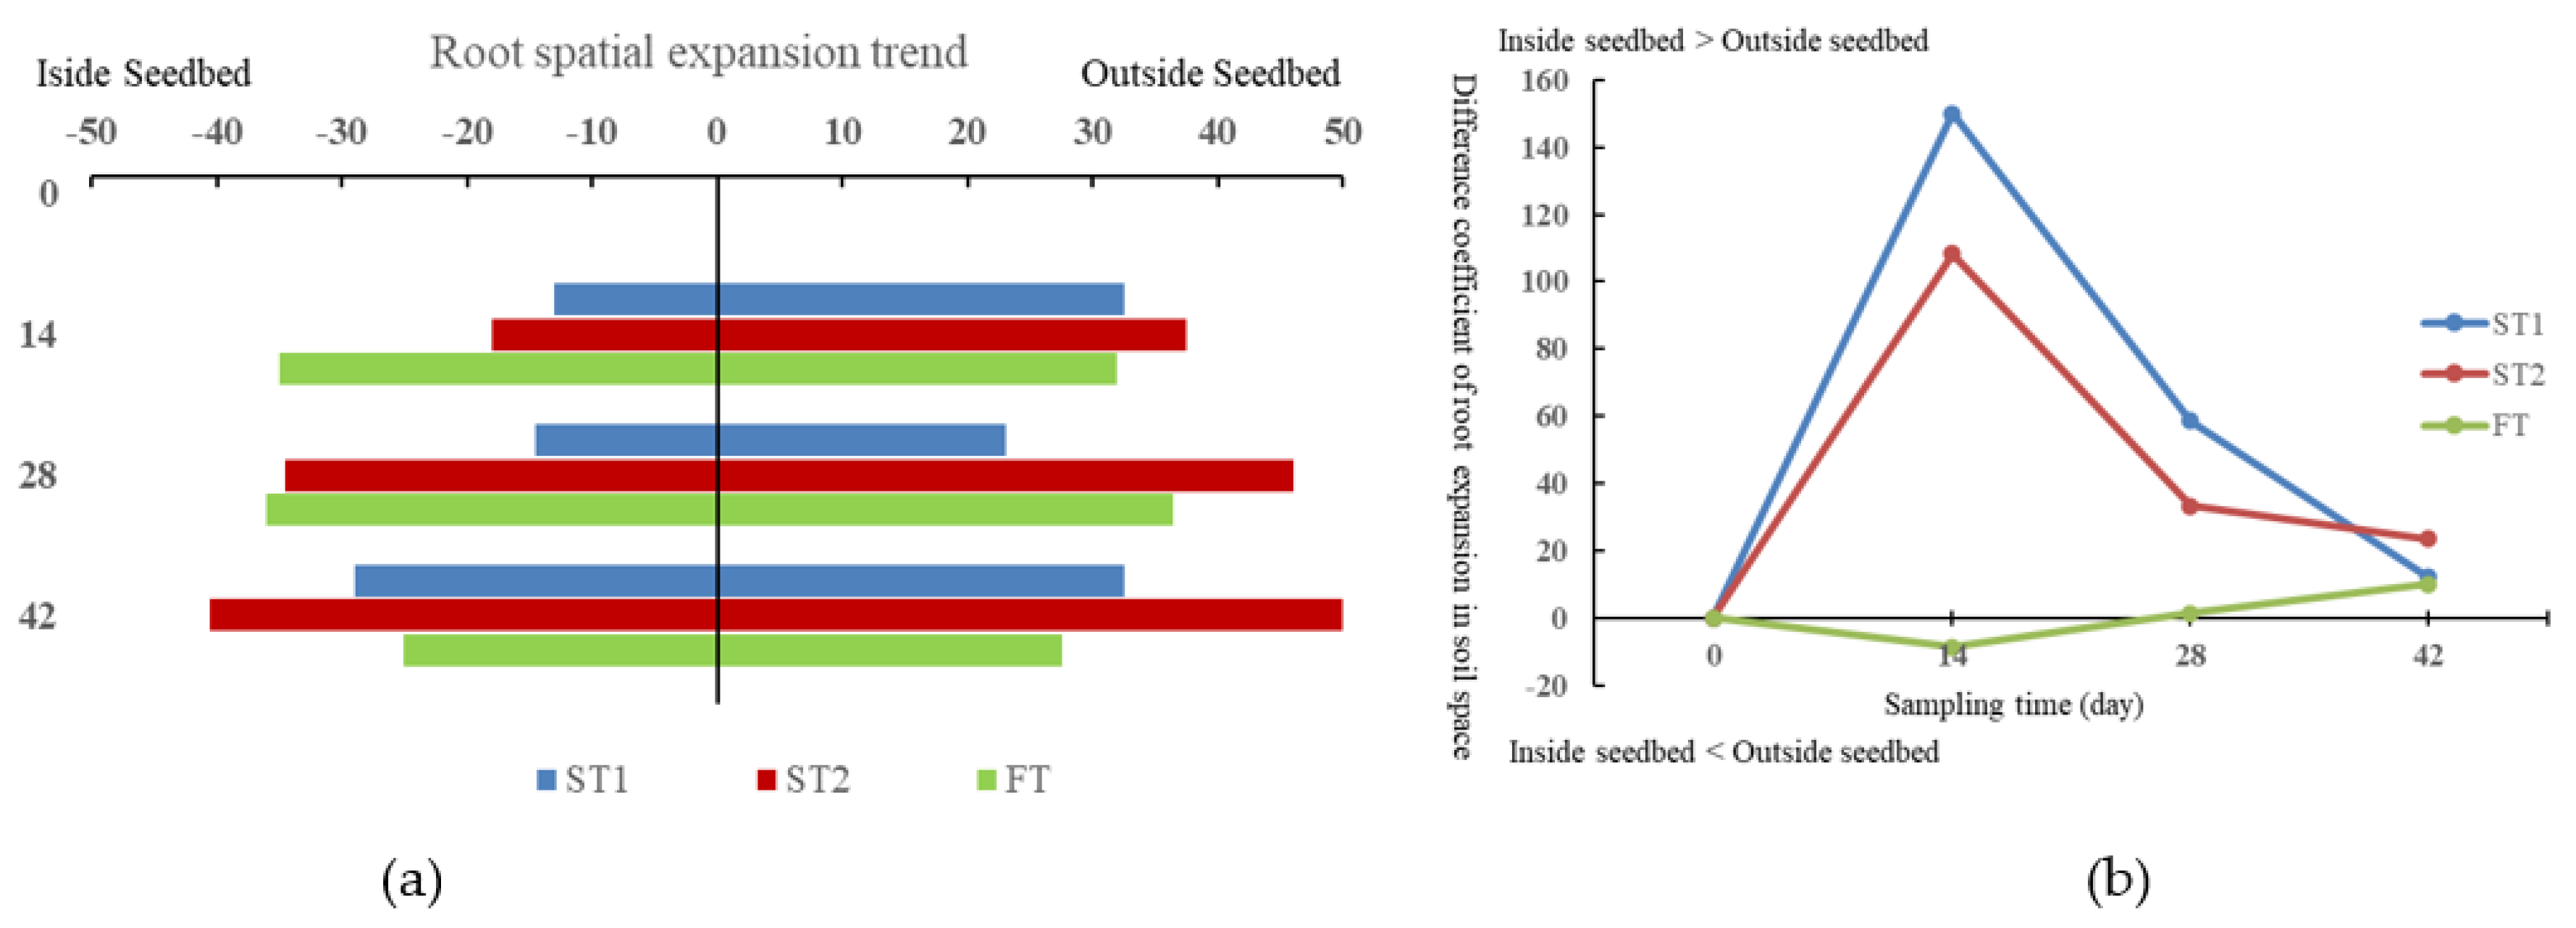
2.5.1. Difference Coefficient of Space Occupancy of Root Soil Inside and Outside the Seedbed

We divided the x-y projective plane into squares of 0.5 × 0.5 cm (Figure 5a) and set the position of the seed as the center, with an initial boundary of 6.5 × 6.5 cm. The growth of roots inside and outside the seedbed outside the initial boundary was calculated. For full-scale tillage treatment, the virtual seed boundary was set to quantify the root growth trend. The calculation method of soil space occupancy difference coefficient P inside and outside the root seedbed is shown in Formula (5) [25], in which the greater the value of P is, the more obvious the root growth trend along the direction between seeds is.
P = N 1 N 0 1 × 100 .
where, P is the difference coefficient of space occupancy of soil inside and outside the bed; N1 represents the number of grids containing roots in the seedbed; and N0 indicates the number of grids containing roots outside the seedbed.

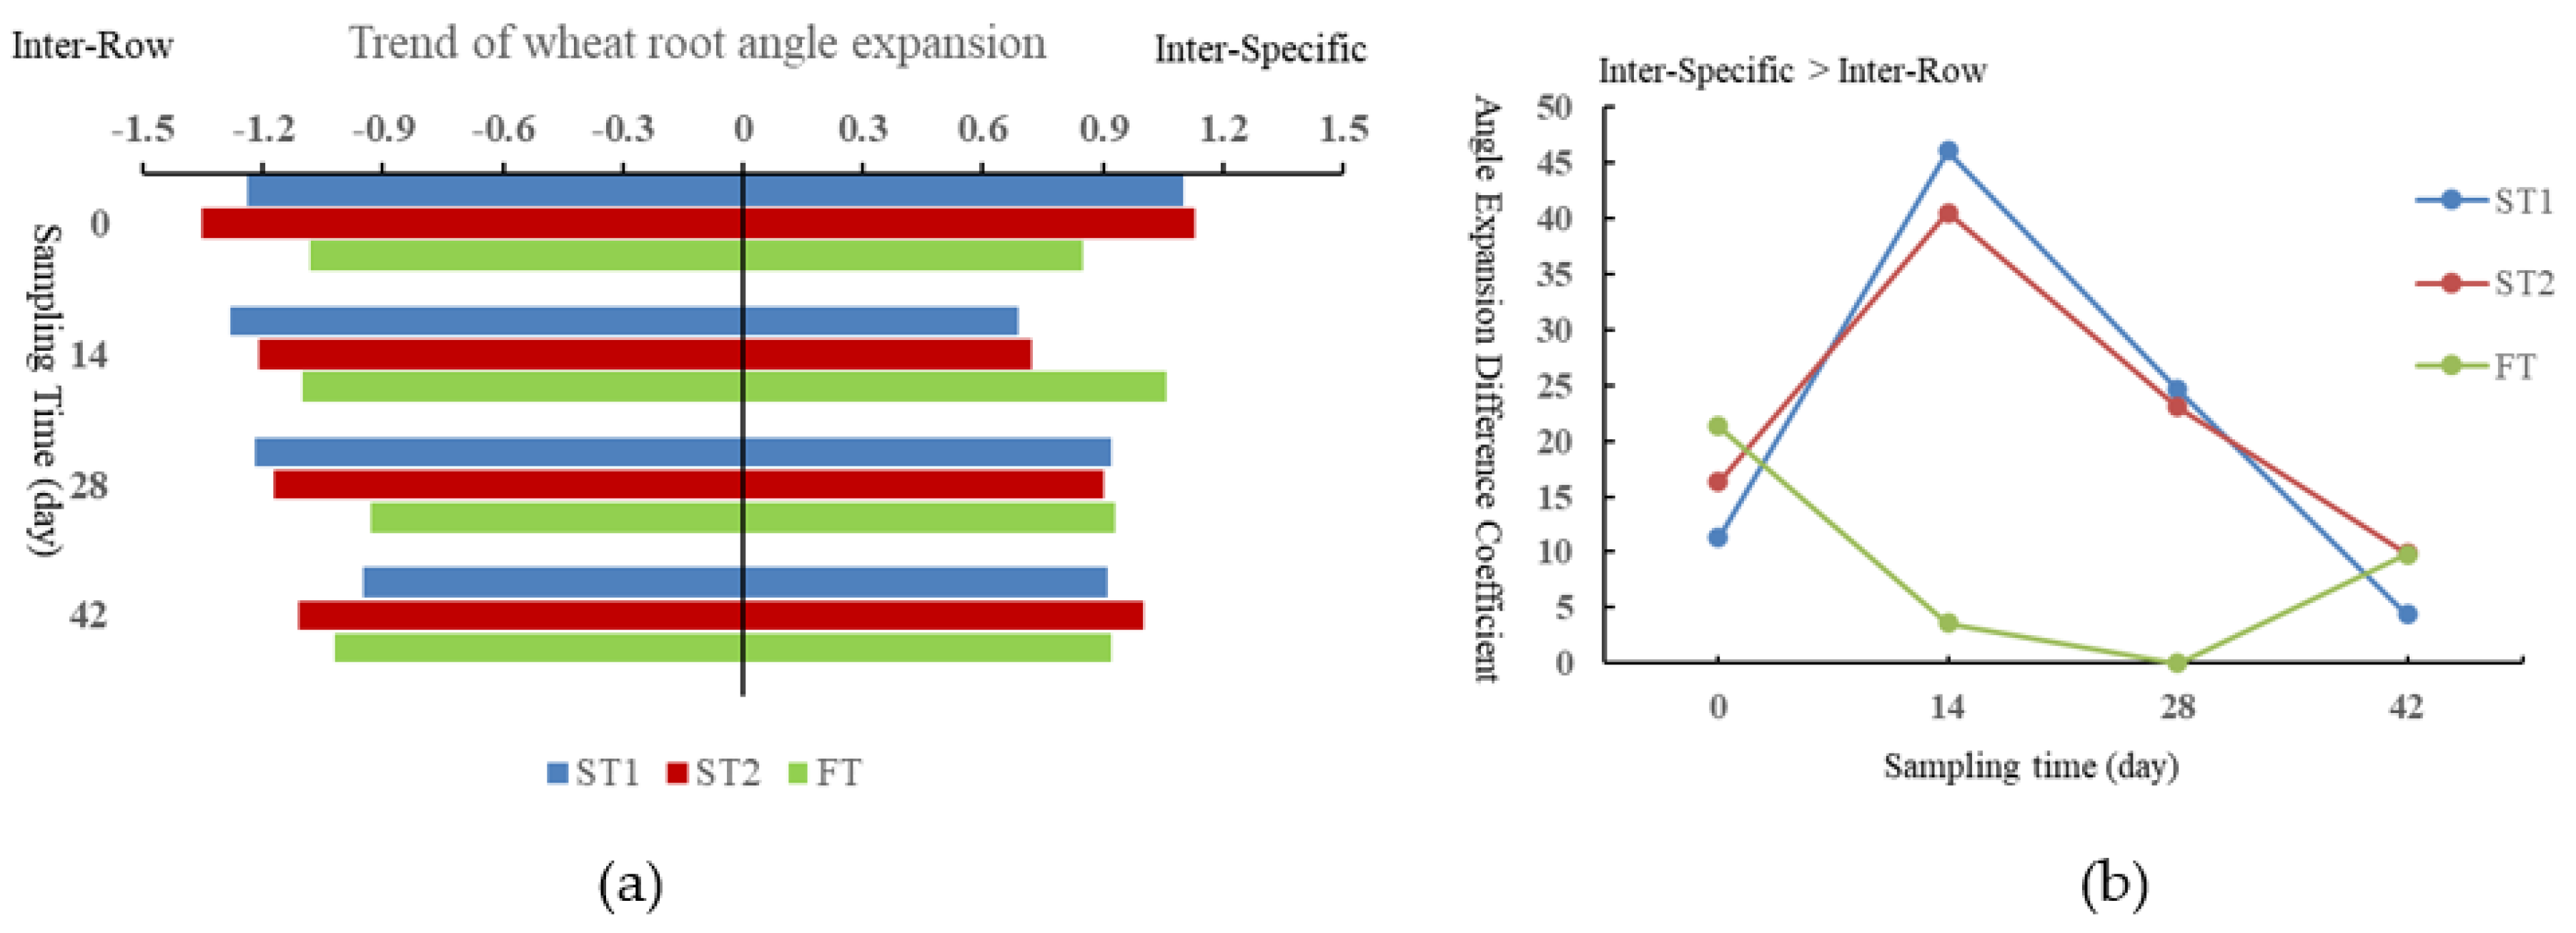
2.5.2. The Expansion Trend of Root System between Lines and Species

We took the position of the seed as the initial position, carried out layering treatment at an interval of 0.5 cm (Figure 5b), and calculated the angle expansion trend and length expansion trend of the roots in the left and right parts divided by the z-axis, respectively. We measured each root one by one according to the layering to obtain the expansion trend angle between the two connecting lines in the layer α and extended length L.
We took the expected value as 1 and the cosine value of the expanding trend angle α was analyzed by variance. The sum T A of the left and right variance values was used as a quantitative index to evaluate the angle and length expansion trend of the root system. The smaller the T A value is, the greater the angle expansion trend is. The calculation formula is as follows:
C 1 = cos α 11 + cos α 12 + c o s α 1 n n
T α = 1 n C 1 1 2 + C 2 1 2 + C n 1 2 .
T A = T α R   + T α L   .
where: C1—mean value of cosine value of expansion trend angle of the first root in the nth layer; α11—the perspective of the expansion trend of the first root in the first layer, and so on; TαL, TαR—root angle expansion trend coefficient of the left and right parts of the view; and TA—angle expansion trend coefficient of root system in the whole view.
With the expected value of 0, the expansion length l was analyzed by variance, and the sum of the variance values T L of the left and right parts was used as a quantitative index to evaluate the angle and length expansion trend of the root system. The greater the T L value is, the greater the length expansion trend is.
The calculation formula is as follows:
L 1 = L 11 + L 12 + L 1 n n ;
T l   = 1 n L 1 0 2 + L 2 0 2 + L n 0 2 ;
T L = T l R   + T l L   .
where: L 1 —the average value of the length expansion trend of the first root in the nth layer; L 11 represents the development trend length of the first root in the first layer, and so on; T l L , T l R —the length expansion trend of the left and right parts of the view; T L —length expansion trend in the whole view.

2.5.3. Difference Coefficient of Root Expansion Trend between Rows and Species

In this paper, the angle expansion trend coefficient P a and length expansion trend coefficient PL were used to quantify the expansion trend of roots between rows (x-z plane) and species (y-z plane). The greater the absolute values of P a and PL, the greater the difference in the growth trend of roots in the two directions. The positive values of P a and PL indicate that the growth trend of roots along the inter-specific direction is greater than that between rows. The calculation formula is as follows:
P a = T A x - z T A y - z 1 × 100 .
where: P a —angle expansion trend difference coefficient; TAy-z—inter-specific direction and angle expansion trend; TAx-z—inter line direction angle expansion trend.
P L = T L y - z T L x - z 1 × 100 .
where: PL—length expansion trend difference coefficient; TLy-z—interspecific direction length expansion trend; TLx-z—length expansion trend in the direction between lines.

3. Results

3.1. Soil Roughness of Seedbed Wall Surface

The 3D modeling technology of soil surface based on the digital image method can truly restore the soil surface configuration on the surface of seedbed wall (Figure 6 and Figure 7). The Matlab software and the Kriging method were used to interpolate the 3D reconstruction model data after sparse and the 3D micro geomorphic model, respectively, which can clearly show the geometric information of the soil on the surface of the seedbed wall (Figure 8). The analysis shows that the soil surface structure of the seedbed wall created by ST1 and ST2 treatment is quite different. The surface of the seedbed wall caused by ST1 treatment was seriously smeared after tillage. The roughness caused by ST1 is 70% lower than that of ST2 treatment at first sampling time (Figure 9). However, the difference of the roughness caused by ST1 and ST2 gradually decreases with the passage of sampling time, and there is almost no difference in soil roughness at the last sampling.

3.2. Space Occupancy Rate of Root Soil Inside and Outside the Seedbed

The x-y plane projection view of the three-dimensional root configuration obtained by different cultivation methods and different sampling times is shown in Figure 10. It can be intuitively seen from the figure that the cultivation mode has a great impact on the growth trend of the root system. As shown in Figure 11, from the second sampling, the difference in the space occupation rate of root soil inside and outside the seedbed under strip tillage treatment is significantly higher than that under full-width tillage. On the 14th day, the difference coefficients of root soil space occupancy inside and outside the seedbed under ST1 and ST2 treatments were as high as 150% and 108%, respectively. On the 28th day, the difference decreased, but it was still significantly higher than that under FT tillage treatment. Compared with ST2 treatment, the seedbed environment created by ST1 has more obvious restrictions on root growth, which was 38% and 75% higher than ST2 treatment on the 14th day and the 28th day from the seedling stage, respectively.

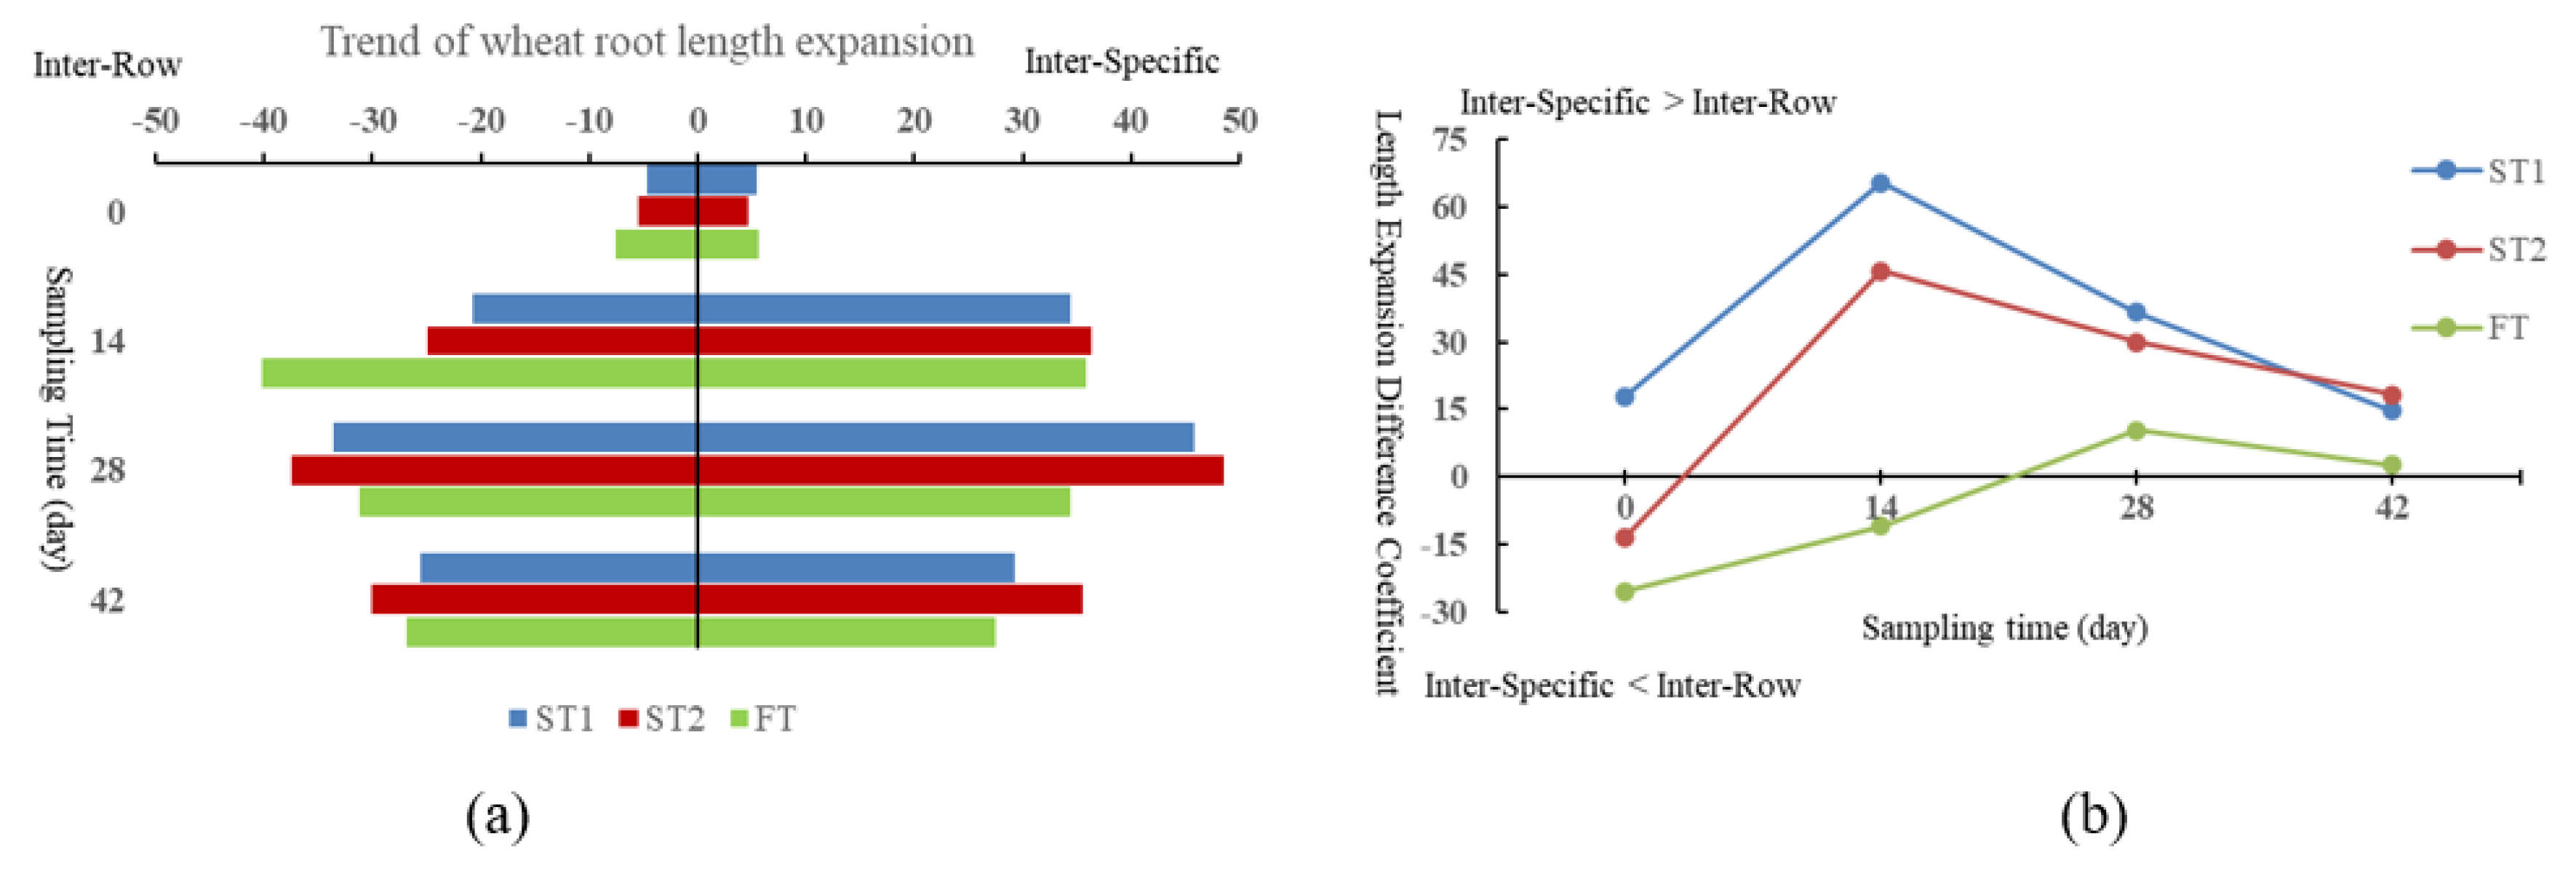
3.3. Expansion Trend of Root System between Lines and Species

The angle and length development trend of wheat roots in soil space are shown in Figure 12 and Figure 13. Different tillage treatments had significant effects on the angle and length expansion trend of wheat roots. Under full tillage treatment, the wheat root system is not limited by the boundary of the seedbed, which makes its growth direction irregular. Under strip tillage treatment, the growth trend of wheat roots along the inter-specific direction was obvious on the 14th and 28th day. On the 14th day, the difference coefficients of angle expansion trend of wheat roots with ST1 and ST2 treatments were as high as 46 and 40, respectively, and the difference coefficients of length expansion trend reached 65 and 45, respectively. Comparing between ST1 and ST2 treatments, the seedbed environment created by ST1 has more obvious restrictions on root growth. When 14 days and 28 days from the seedling stage, the angle expansion trend was 14% and 6.5% higher than that of ST2 treatment, and the length expansion trend was 42% and 21% higher than that of ST2 treatment, respectively.

4. Discussion

The strip rotary tillage sowing technology using the rotary tillage blade as the tillage component to create a loose and breathable seed fertilizer belt suitable for wheat sowing [14,22,23], which is characterized by less and no tillage, makes a significant difference in the soil structure inside and outside the seedbed. The soil environment within the seedbed is loose and porous with low volumetric weight, strong permeability, and sufficient oxygen, which is more favorable to the growth and expansion of crop roots [14,15]. The volumetric weight and compactness of the soil outside the seedbed are relatively large, which is unfavorable to the growth of roots. Li Chaohai [12,13]. Therefore, under strip tillage treatment, the growth trend of wheat roots along the inter-specific direction is obvious on the 14th and 28th day (Figure 11, Figure 12 and Figure 13). Due to the even soil structure of the seedbed and the absence of limitation of the seedbed wall, the root system showed a random growth trend.
When making a comparison among the three tillage treatments, the root growth trend of ST1 and ST2 treatments was most obvious in the second sampling [14]. This is because the number of roots increased significantly at this stage, but the individuals roots were not large (Figure 10). The nutrients in the seedbed were sufficient to meet the growth and development needs of the roots, and the competition between seeds was not obvious. With the continuous growth of individual plants and the increasing demand for nutrients, the competition between seeds is more intense. If the nutrients in the seedbed cannot normally meet the needs of plant growth and development, the root system began to expand in other directions to obtain more nutrients. Therefore, when the sampling time is 28 and 42 days, the root growth trend decreases gradually along the inter-specific direction, whereas the limitation of strip tillage on root growth trend is still greater than full-width tillage.
Soil surface roughness is an important index for quantifying the soil structure on the surface of the seedbed wall. The 3D reconstruction technology for soil surface structure provided in this paper is fast and convenient, and can solve the disadvantage of the previous methods of obtaining soil surface roughness, this being that they cannot tackle complex field conditions, and provides a new method for indirectly and nondestructively obtaining and quantifying the 3D geometric information of soil surface contour characteristics. Using this method to analyze the surface soil structure of seed the bed wall created by strip tillage ST1 and ST2 treatments showed that the soil roughness of the seedbed wall created by ST1 treatment is significantly lower than that of ST2 treatment, especially in the first three sampling times (Figure 9), and the restriction on root growth and development is more obvious. This is because the soil failure mode formed by IT225 rotary tillage cutter is shear failure as the cutter cuts and squeezes the seedbed wall during farming (Figure 1c), which leads to the destruction of soil structure on the surface of the seedbed wall and heavy plastering (Figure 6b). Moreover, the coating layer significantly reduces the soil roughness and porosity of the seedbed wall and hinders the transmission of water and oxygen. The volumetric weight of the soil in this layer increases significantly in the process of soil going from wet to dry, resulting in the increased difficulty of root penetrating the soil and uneven growth distribution, which is consistent with the previous research conclusions. Li Chaohai and others studied the impact of the change of soil structure on the growth and length of maize roots, which showed that the larger the soil volumetric weight value, the fewer the number of roots and the more obvious the reduction of dry weight and length [12,13]. The soil failure mode formed during soil breaking by chisel rotary tillage with ST1 treatment belongs to typical tensile failure. The seedbed boundary is formed by cracks generated during soil fracture (Figure 1d). As the soil structure on the surface of the seedbed wall was less damaged and smeared by the cutter (Figure 7b), and the soil roughness and porosity were higher than those of ST1 treatment, the restriction on the growth trend of crop roots is relatively low (Figure 11, Figure 12 and Figure 13); thus, it is more conducive to the growth and development of roots.

5. Conclusions

A 3D modeling technology based on the image method was proposed. The method effectively restored the soil surface structure of the seedbed wall and provided a new method for quantifying the quality of strip tillage.
A series of evaluation indexes for the trend of crop root development was proposed. The proposed indicators of difference coefficient of root soil space occupation, difference coefficient of root angle expansion trend, and difference coefficient of root length expansion trend have solved the problem of the root expansion trend not being able to be quantified.
The tillage method significantly affected the seedbed wall soil structure. The three-dimensional modeling technology based on the image method was used to reconstruct and quantify the soil surface structure of the seedbed wall produced by STI and ST2 treatments. The research showed that the soil structure of the seedbed wall was damaged more seriously by the ST1 treatment, and the soil roughness of the seedbed wall produced by ST1 treatment was 70% lower than that of ST2 treatment. Combined with the quantitative index of root growth trend, it was found that the lower the soil roughness on the seedbed wall, the more obvious the restriction on root growth.
The tillage method has a significant effect on the growth trend of root system. Based on the three-dimensional digital model of the root system in different growth periods, the quantitative indexes of crop root growth trend were comprehensively analyzed. It was found that the seedbed wall created by strip tillage had an obstacle effect on crop root penetration and nutrient acquisition.

Author Contributions

Conceptualization, Y.Y. and Z.H.; methodology, Y.Y. and Q.D.; investigation, F.G. and J.W.; writing—original draft preparation, Y.Y. and F.G.; writing—review and editing, Y.Y., Z.H., F.G., J.W. and Q.D. All authors have read and agreed to the published version of the manuscript.

Funding

This research was funded by the natural science foundation of jiangsu province (Grant No. BK 20221187) and national natural science foundation of China (31901418).

Institutional Review Board Statement

Not applicable.

Informed Consent Statement

Not applicable.

Data Availability Statement

Not applicable.

Conflicts of Interest

The authors declare no conflict of interest.

References

  1. Timsina, J.; Connor, D.J. Productivity and management of rice–wheat cropping systems: Issues and challenges. Field Crops Res. 2001, 69, 93–132. [Google Scholar] [CrossRef]
  2. Wang, C.; Li, H.; He, J.; Wang, Q.; Lu, C.; Yang, H. Optimization Design of a Pneumatic Wheat-Shooting Device Based on Numerical Simulation and Field Test in Rice–Wheat Rotation Areas. Agriculture 2022, 12, 56. [Google Scholar] [CrossRef]
  3. Huo, L.; Liu, J.; Abbas, A.; Ding, Q.; Wang, H.; Zhou, Z.; Meng, L.; Bai, Z. Effects of dry bulk density and water content on compressive characteristics of wet clayey paddy soil. Agron. J. 2022, 114, 2598–2607. [Google Scholar] [CrossRef]
  4. Yang, Y.; Fielke, J.; Ding, Q.; He, R. Field experimental study on optimal design of the rotary strip-till tools applied in rice-wheat rotation cropping system. Int. J. Agric. Biol. Eng. 2018, 11, 88–94. [Google Scholar] [CrossRef]
  5. Matin, M.A.; Fielke, J.M.; Desbiolles, J.M.A. Furrow parameters in rotary strip-tillage: Effect of blade geometry and rotary speed. Biosyst. Eng. 2014, 118, 7–15. [Google Scholar] [CrossRef]
  6. Matin, M.A.; Fielke, J.M.; Desbiolles, J.M.A. Torque and energy characteristics for strip-tillage cultivation when cutting furrows using three designs of rotary blade. Biosyst. Eng. 2015, 129, 329–340. [Google Scholar] [CrossRef]
  7. Lee, K.S.; Park, S.H.; Park, W.Y.; Lee, C.S. Strip Tillage characteristics of rotary tiller blades for use in a dryland direct rice seeder. Soil Tillage Res. 2003, 71, 25–32. [Google Scholar] [CrossRef]
  8. Celik, A.; Altikat, S. Effects of various strip widths and tractor forward speeds in Strip Tillage on soil physical properties and yield of silage corn. Tar. Bil. Der. 2010, 16, 169–179. [Google Scholar]
  9. Hossain, I.; Esdaile, R.J.; Bell, R.; Holland, C.; Haque, E.; Sayre, K.; Alam, M. Actual challenges: Developing low cost no-till seeding technologies for heavy residues; small-scale no-till seeders for two wheel tractors. In Proceedings of the 4th World Congress on Conservation Agriculture, New Delhi, India, 4–7 February 2009; pp. 171–177. [Google Scholar]
  10. Matin, M.A.; Desbiolles, J.M.A.; Fielke, J.M. Strip-tillage using rotating straight blades: Effect of cutting edge geometry on furrow parameters. Soil Tillage Res. 2016, 155, 271–279. [Google Scholar] [CrossRef]
  11. Chen, X.; Ding, Q.; Błaszkiewicz, Z.; Sun, J.; Sun, Q.; He, R.; Li, Y. Phenotyping for the dynamics of field wheat root system architecture. Sci. Rep. 2017, 7, 37649. [Google Scholar] [CrossRef]
  12. Crow, W.T.; Berg, A.A.; Cosh, M.H.; Loew, A.; Mohanty, B.P.; Panciera, R.; de Rosnay, P.; Ryu, D.; Walker, J.P. Upscaling sparse ground-based soil moisture observations for the validation of coarse-resolution satellite soil moisture products. Rev. Geophys. 2012, 50, 3881–3888. [Google Scholar] [CrossRef] [Green Version]
  13. Mombini, A.; Amanian, N.; Talebi, A.; Kiani-Harchegani, M.; Rodrigo-Comino, J. Surface roughness effects on soil loss rate in complex hillslopes under laboratory conditions. Catena 2021, 206, 105503. [Google Scholar] [CrossRef]
  14. Xing, M.; Huang, F.; Guan, Y. Experimental Study on Measurement of Soil Surface Roughness Based on Image Processing. Exp. Sci. Technol. 2019, 17, 1–5. (In Chinese) [Google Scholar]
  15. Li, L.; Wang, D.; Wang, P.; Huang, J.; Zhu, D. Soil Surface Roughness Measurement Based on Color Operation and Chaotic Particle Swarm Filtering. Trans. Chin. Soc. Agric. Mach. 2015, 46, 158–165. (In Chinese) [Google Scholar]
  16. Chen, Q.; Shi, Y.; Ding, Q.; Ding, W.; Tian, Y. Comparison of straw incorporation effect with down-cut and up-cut rotary tillage. Trans. Chin. Soc. Agric. Eng. 2015, 31, 13–18. (In Chinese) [Google Scholar]
  17. Zheng, X.; Zhao, K.; Li, X.; Li, Y.; Ren, J. Improvements in farmland surface roughness measurement by employing a new laser scanner. Soil Tillage Res. 2014, 143, 137–144. [Google Scholar]
  18. Arvidsson, J.; Bölenius, E. Effects of soil water content during primary tillage-laser measurements of soil surface changes. Soil Tillage Res. 2006, 90, 222–229. [Google Scholar] [CrossRef]
  19. Kang, Y.; Wang, J.; Zhou, H.; Liu, Y. Soil surface roughness estimation using multiangular remote sensing observations: A preliminary study. J. Remote Sens. 2013, 17, 180–192. (In Chinese) [Google Scholar]
  20. Ahmad, F.; Weimin, D.; Qishuo, D.; Hussain, M.; Jabran, K. Forces and Straw Cutting Performance of Double Disc Furrow Opener in No-Till Paddy Soil. PLoS ONE 2015, 10, e0119648. [Google Scholar] [CrossRef]
  21. Blevins, R.L.; Frye, W.W. Conservation Tillage: An Ecological Approach to Soil Management. Adv. Agron. 1993, 51, 33–78. [Google Scholar]
  22. Bianchini, A.; Magalhães, P.S.G. Evaluation of coulters for cutting sugar cane residue in a soil bin. Biosyst. Eng. 2008, 100, 370–375. [Google Scholar] [CrossRef]
  23. Chen, X.; Ding, Q.; Ding, W.; Tian, Y.; Zhu, Y.; Cao, W. Measurement and Analysis of 3D Wheat Root System Architecture with a Virtual Plant Tool Kit. Sci. Agri. Sin. 2014, 47, 1481–1488. (In Chinese) [Google Scholar]
  24. Xie, T.; Yang, Y.; Huo, L.; Li, Y.; He, R.; Ding, Q. Measurement of Soil Roughness by 3D Reconstruction Based on Digital Images. Chin. J. Soil Sci. 2018, 49, 519–524. (In Chinese) [Google Scholar]
  25. Yang, Y. Study on Optimization of Tillage Parts of Wheat Strip Rotary Planter. Ph.D. Thesis, Nanjing Agricultural University, Nanjing, China, 2017. [Google Scholar]
Figure 1. Farming tools and working principle: (a) bent C blade, (b) hoe blade, (c) working principle of bent C blade, and (d) working principle of Hoe blade.
Agriculture 12 01411 g001
Figure 2. Digital instrument structure of root system configuration measurement. 1: Curved scale; 2: Level scale; 3: Vertical scale; 4: Plant sampling; and 5: Lifting platform.
Agriculture 12 01411 g002
Figure 3. 3D model of root.
Agriculture 12 01411 g003
Figure 4. Sketch of soil surface image on tillage wall: (a) schematic diagram of in situ photography and (b) schematic diagram of camera position.
Agriculture 12 01411 g004
Figure 5. Calculation principle of wheat root expansion trend: (a) x-y plane projection and (b) x-z plane projection.
Agriculture 12 01411 g005
Figure 6. The seedbed wall surface produced by ST1 treatment after tillage: (a) the 3-D model and (b) actual surface of seedbed wall.
Agriculture 12 01411 g006
Figure 7. The seedbed wall surface produced by ST2 treatment after tillage: (a) the 3-D model and (b) actual surface of seedbed wall.
Agriculture 12 01411 g007
Figure 8. Digital image reconstruction data 3D model of seedbed wall surface 60 × 100 mm area at first sampling time.
Agriculture 12 01411 g008
Figure 9. Comparison of roughness values produced by ST1 and ST2 treatment at different sampling times.
Agriculture 12 01411 g009
Figure 10. x-y plane projection view of 3D configuration of wheat root system at each sampling time node with different treatments.
Agriculture 12 01411 g010
Figure 11. Differences in spatial coverage of wheat root soil: (a) root spatial expansion trend and (b) difference coefficient of root expansion in soil space.
Agriculture 12 01411 g011
Figure 12. Trend of wheat root angle expansion: (a) trend of wheat root angle expansion and (b) angle expansion difference coefficient.
Agriculture 12 01411 g012
Figure 13. Trend of wheat root length expansion (a) trend of wheat root length expansion, (b) length expansion difference coefficient.
Agriculture 12 01411 g013
Table 1. 3D test data of a root axis.
Original CoordinatesRelative CoordinatesSpatial Coordinates
x0θ0z0x1θ1z1xyz
8.19937.1000000
58.8100.9380.71.90.91.84.70.9
57.59343−0.6−65.9−6−3.95.9
57.386.543.3−0.8−12.56.2−12.6−56.2
55.186.646−3−12.48.9−13.2−18.98.9
54.476.547−3.7−22.59.9−23.7−22.29.9
5461.852−4.1−37.214.9−38.5−22.914.9
535268−5.1−4730.9−49.8−27.630.9
52.346.880−5.8−52.242.9−54.7−29.842.9
Publisher’s Note: MDPI stays neutral with regard to jurisdictional claims in published maps and institutional affiliations.

