1. Introduction
Vegetable grafting cultivation, widely used in the large-scale production of various vegetables, is an effective way to overcome the obstacles of continuous cropping and improve the quality and yield of vegetables [
1,
2] diseases and low temperatures. It is also one of the important measures to improve the high quality, stable and high yield of vegetables which has been widely used in the large-scale production of various vegetables. With the increasing demand for vegetables and the growing scale of planting, traditional artificial grafting has gradually been unable to meet the needs of large-scale production of vegetables due to its low efficiency and high labor intensity. There is an increasingly urgent need to improve grafting efficiency. Mechanized seedling grafting is one of the keys to solving this problem. Cutting is one of the main links in the mechanized grafting of seedlings, and the rationality of the design of the cutting device will directly affect the grafting efficiency and quality [
3].
During cutting operations, the cutter interacts with the stem. At the beginning of the cut, the stem is compressed by the cutter and bends flexibly. The stem fiber layer in the contact area produces tensile stress, which is maximum at the minimum radius of curvature. When the tensile stress here exceeds the tensile strength of the stem fiber, the stem fails and is pulled off. At this time, the highly tensioned state of the fiber before the blade disappears, and the fiber layer on the upper section of the cutter is in the shape of a flap. The cutting cross-section of the stem on the lower plane of the cutter is parallel to the surface of the cutter, and the cutter completes the cutting operation at this stage. As the cutter advances, the fiber layer of the stem in front continues to be bent, and the next cutting stage begins. The cycle is repeated until the entire stem is cut. Therefore, the mechanical cutting properties could be influenced by the structural and working parameters of the cutter, and the cutting operation mode all affect the mechanical cutting properties [
4,
5].
Some experts and scholars analyzed the influence on the mechanical properties of the stem by taking the structural parameters of the cutting blade and the cutting method as the influencing factors. Relevant scholars have studied this method through physical experiments [
6]. By analyzing the cutting force of green pepper branches, a theoretical mechanical model was established by Li [
7]. The whole process of cutting green pepper with a straight knife was studied, and the cutting mechanism was revealed. Combine stress-strain systems, high-speed photography systems, and numerical predictions to observe and measure key state variables such as stress during cutting in detail. Aydin et al. [
8] analyzed the maximum cutting stress of maize stem under different moisture contents and found that the correlation between shear stress and moisture content was 0.92. When the moisture content increased from 50% to 65%, the shear force gradually decreased and then began to increase linearly. The limited cutting angle range of rootstock and the cutting angle of scion seedlings were studied by Xu [
9]. A splicing and grafting method based on visual images was proposed, aiming at maximizing the splicing rate between the rootstock and the scion seedling, and realizing the precise cutting and grafting of the grafting machine. In addition to the mechanical and physical properties of the plant, the structural parameters and working parameters of the cutting tool also affect the mechanical cutting properties. Many studies have investigated the effect of factors such as cutter type, cutting method, and cutting speed on cutting mechanical properties. Gan et al. [
10] compared the harvesting power consumption when harvesting Miscanthus using right-angle, bevel, and serrated cutters. The study found that the design of the cutting blade impacts the energy consumption and field performance of biomass harvesting equipment. Zhang et al. [
11] studied the cutting device using a texture analyzer and found the effect of the cutter slip angle and stem level on the cutting energy of a single rice root. The results show that optimizing the sliding cutting angle and stem level affects cutting energy saving. The average cutting energy in the upper part of the stem is higher than that in the lower part. As the blade sliding cutting angle increases, the peak cutting force per unit stem cross-sectional area decreases. Similar results were reported by Boydas et al. [
12], who found that the shear stress value at the 28° bevel angle was lower than the shear stress value at the 0° bevel angle when the red bean stem was cut by the cutter. Du et al. [
13] found the conditions of splitting failure according to the mechanical model in the cutting process of cabbage. Through experiments, it is found that slip angle, cutting speed, cutting diameter, and the interaction between cutting speed, slip angle, and cutting diameter affect the degree of splitting damage. The optimal cutting combination for cabbage was finally determined as a sliding angle of 40°, a cutting speed of 300 mm/min, and a cutting diameter of 35 mm. The mechanical cutting properties of rice have been confirmed in the pendulum displacement cutting test bench, indicating that the cutting angle and inclination angle of the cutter affects the specific cutting energy. The best specific cutting energy is obtained when the cutting angle is 30° and the blade inclination angle is 30° [
14]. The physical test method could directly reflect the result of the cutter-stem interaction, but the time and economic costs are high.
During the cutting process, the contact between the cutter and the stem is random and nonlinear. It is difficult to obtain the dynamic mechanism between the two using traditional physical test methods. This problem could be solved with the help of computer technology. The dynamic simulation analysis in ANSYS software (San Jose, CA, USA) could simulate various geometric nonlinearity, material nonlinearity, and contact nonlinearity, and is especially suitable for the dynamic impact of high-speed collision of three-dimensional nonlinear structures. To determine the pulverization mechanism during ultrafine pulverization, Cheng et al. used ANSYS/LS-DYNA to analyze the influence of the mechanical properties of the wheat bran structure layer on ultrafine pulverization. It provides a theoretical basis for optimizing wheat bran ultrafine grinding equipment and process parameters [
15]. Xie et al. established a finite element model of sugarcane harvesting machinery and simulated the cutting process. The effects of the cutting drum rotation speed, the overlapping length, and the bevel angle of the upper and lower shredding blades on the cutting quality and the maximum cutting power consumption were studied [
16]. Meng et al. established the mechanical model of the sugarcane cutting system using the finite element method, clarified the dynamic mechanism between the sugarcane and the cutter during the cutting process, and provided a reference for optimizing the structure and working parameters of the disc cutter [
17]. A review of previous studies found that using the finite element method could effectively simulate complex nonlinear contact problems and reduce the difficulty of mechanical analysis in the cutting process.
The geometric and physical characteristics of vegetable grafted seedlings differ from other crops. The stems are short, and the tissue structure is crisp and tender. When cutting, problems such as low cutting quality and high cutting power consumption are prone to occur. In this study, the finite element numerical simulation technology was used to analyze the dynamics of the cutting process of vegetable grafted seedlings. The influence of relevant parameters on the mechanical cutting properties of vegetable grafted seedlings was studied, and the structural parameters and working parameters of the seedling grafting pipeline cutting device were optimized. This research could prolong the service life of the cutter, improve the cutting quality, and finally provide a reference for the design and improvement of vegetable seedling grafting line cutting equipment.
2. Numerical Simulation Analysis
2.1. Analysis of Cutting Mechanism
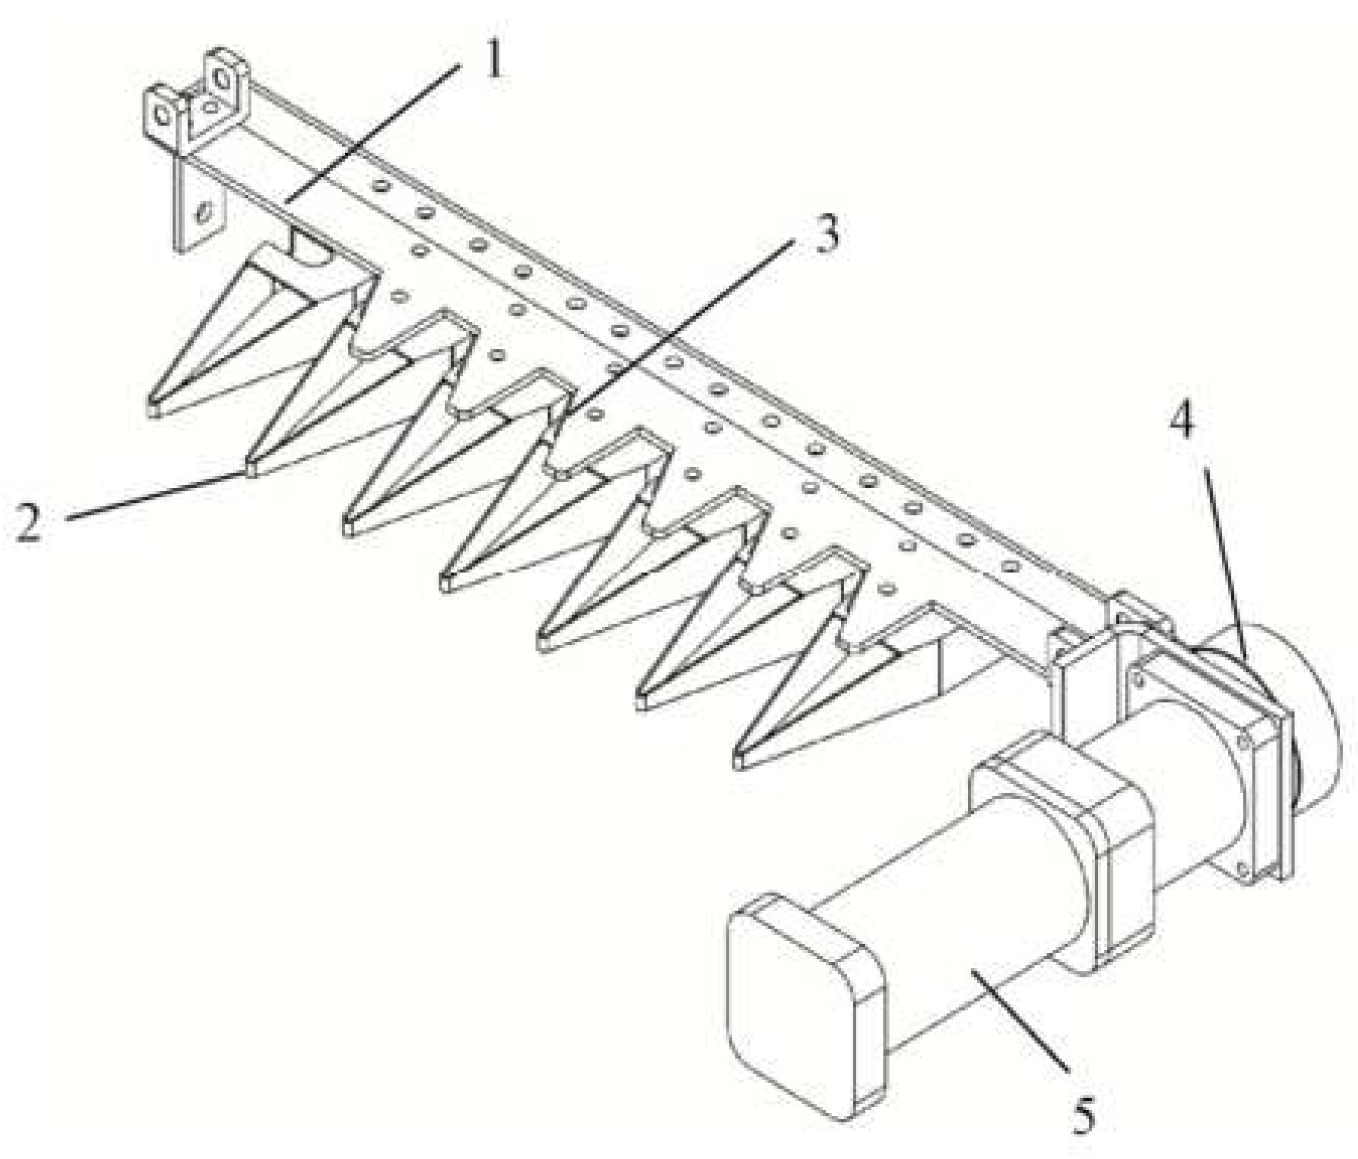
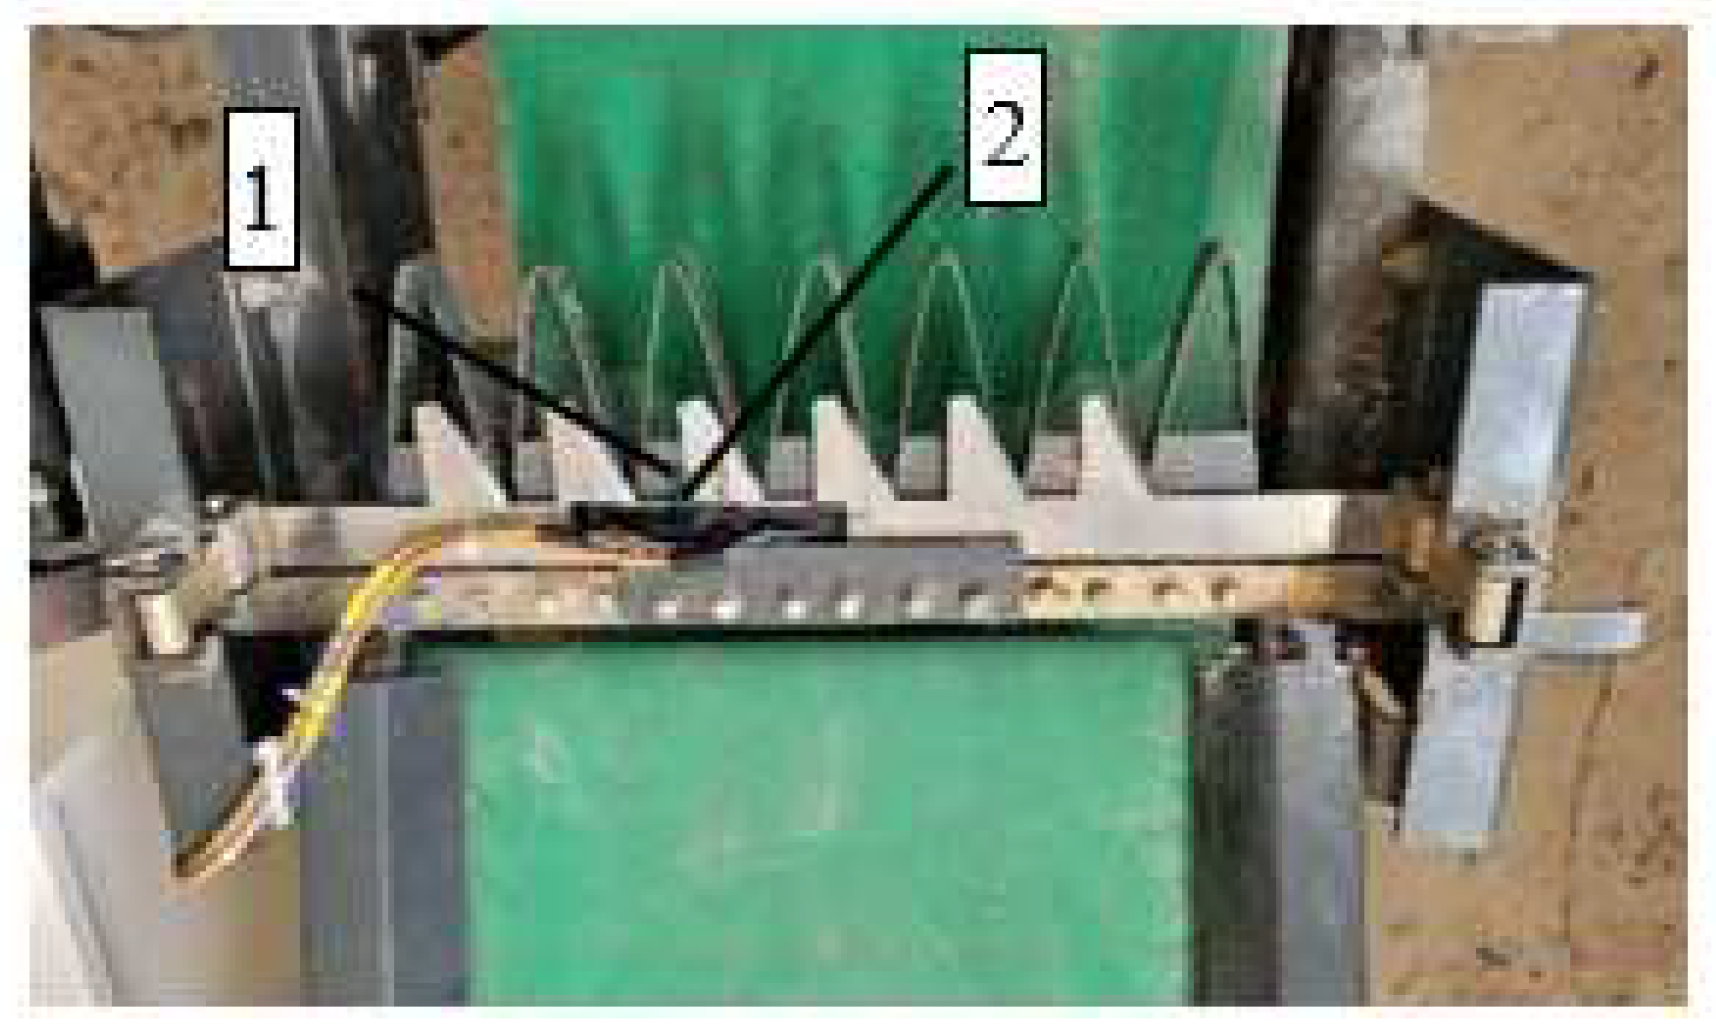
The reciprocating cutting device of the seedling grafting line is mainly composed of a drive motor, a transmission mechanism, a cutter holder, a crop divider, and other components. The cutting method is single support cutting. The motor drives the crank rocker mechanism, and then the rocker drives the cutting blade to make a reciprocating linear motion. The specific structure of the device is shown in
Figure 1. The stem is elastically deformed before the cutter cuts into the stem. After the cutter cuts into the stem, the interaction between the cutter and the plant stem is nonlinear high-speed erosion damage. The force of cutting plant stems is the cutting force, the resistance that the cutter must overcome when it is working. When the cutting resistance is large, it would inevitably lead to greater cutting power consumption, accelerate the wear of the cutter, and reduce the service life [
18].
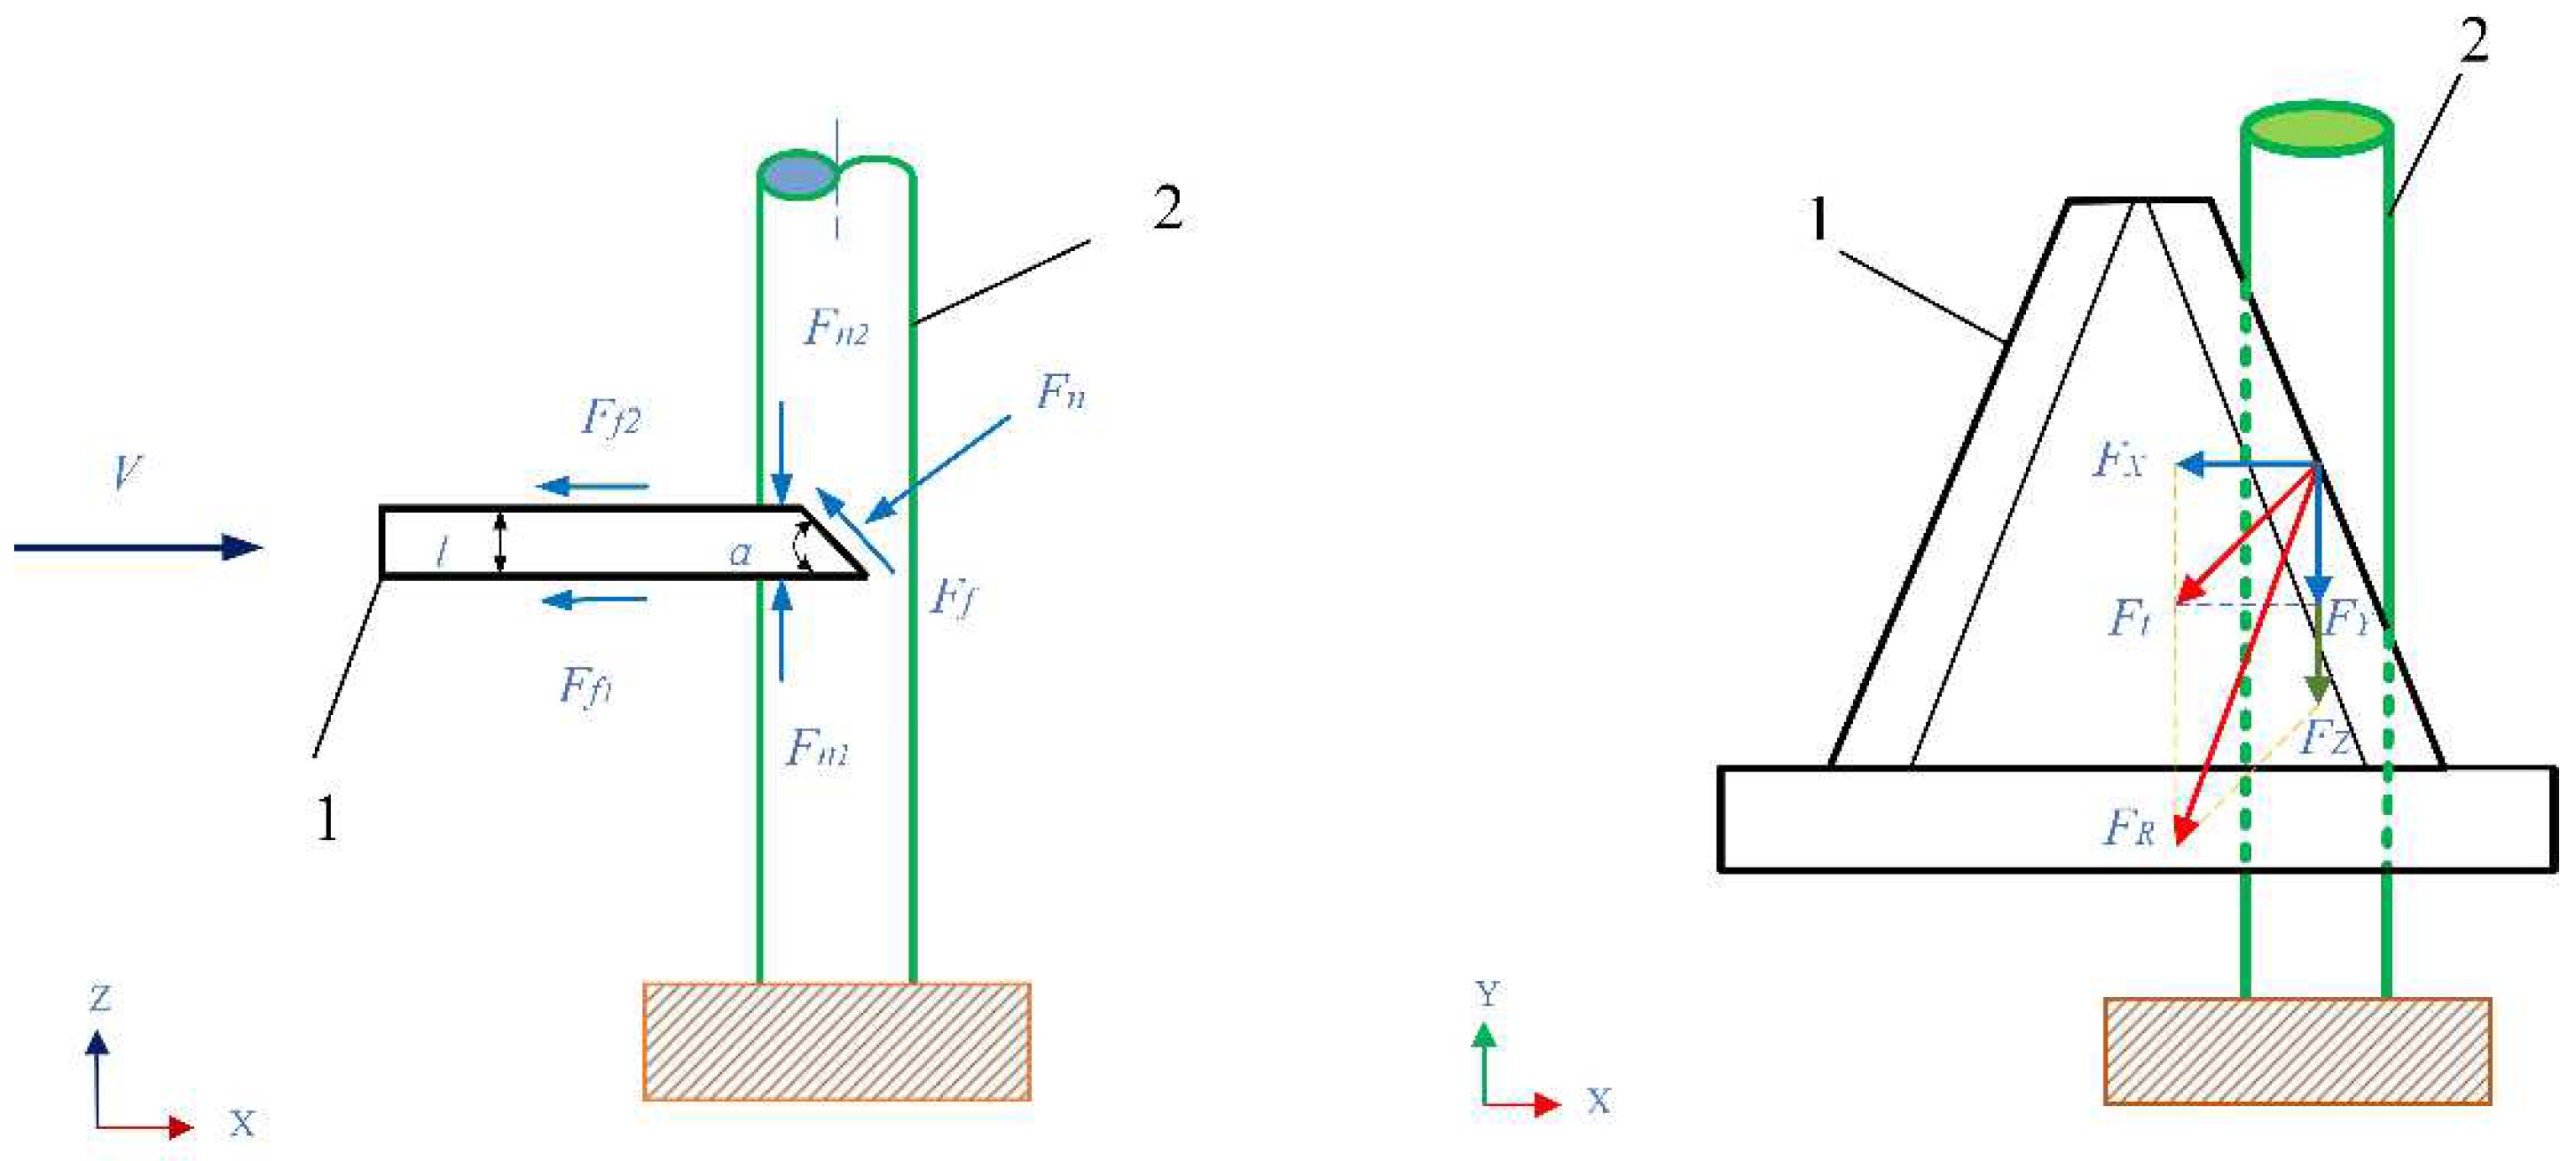
The resistance of the stem to the cutter is mainly composed of contact pressure (
), frictional resistance (
) and inertial force (
). The contact pressure and friction resistance represent the cutting resistance that the cutter must overcome, as shown in
Figure 2. In the XZ plane, the cutter cuts the seedling stalks at a constant speed. The stem is subjected to the combined action of
perpendicular to the surface of the cutter and
parallel to the surface of the cutter [
19].
In the opposite direction to the relative motion, the cutting resistance on the horizontal plane of the contact area between the cutter and the stem is decomposed into the component forces of
in the X direction and
in the Y direction, then the resultant force of
and
is
. The resultant force (
) of the cutting resistance is the resultant force (
) and the resistance force (
) perpendicular to the XY plane, which is calculated by the following Equation (1) [
20]:
In this study, to avoid the influence of the diameter change of the seedling stem on the cutting force, according to previous research [
21], the maximum shear stress was taken as the evaluation index. The shear stress calculation Equation (2) is as shown:
The factors affecting the shear stress are the cutter structural parameters and motion parameters [
22]. The influence mechanism of cutting speed on cutting force is relatively complex. In this study, four factors, including average cutting speed, sliding angle, cutting edge angle, and cutting clearance, which affects cutting stress, are selected as the factors affecting cutting stress. The influence of the combination of different factors on the cutting energy consumption is analyzed.
2.2. Establishment of Finite Element Model
A simulation calculation is performed to model a cutting device. The model includes three parts: cutter, seedling divider, and grafted seedling stem. On the premise of not affecting the simulation effect, the model is appropriately simplified. Irregular shapes of the stem are not considered. Differences in cortex and xylem and interactions between seedlings are ignored. The stem is assumed to be a homogeneous cylindrical structure with a diameter of 4 mm and a length of 30 mm. The cutting position is 22 mm from the ground. When establishing the 3D model of the cutting device, to save computing time, factors such as transmission parts and bolt connections are omitted, and only the structure of the cutting device is retained. The length of the cutter holder is 64 mm, the width is 22 mm, the bottom width of the cutter is 25 mm, the height is 37 mm, and the top width is 8 mm. When the model is assembled, it is assumed that the stems are all upright and have no inclination to the ground. The distance between the cutter and the stem is minimized to reduce model simulation time. The 3D model of the cutting device is saved in the Parasolid (*.x_t) format and imported into the ANSYS Workbench.
2.3. Material Properties
ANSYS Workbench could provide commonly used engineering materials and select structural steel materials as cutters and dividers according to actual conditions. Select Structural Steel in the Engineering Data material properties module of the Workbench for settings (
Table 1). The cutting process of grafted seedling stems is essentially a penetration problem. During this period, large deformation and damage would inevitably occur with the failure of materials. The accuracy of the material properties directly affects the simulation results. The model adopts transversely isotropic material properties [
21]. The Poisson’s ratio of crop stems is 0.20 to 0.50. Comparing the Poisson’s ratio of common wood, it is found that the Poisson’s ratio on the isotropic surface perpendicular to the axial direction of the stalk material is large, and the Poisson’s ratio on the anisotropic surface parallel to the axial direction is small. The ratio between the two is generally 1.27~2.86 multiple relationships. Concerning the mechanical properties of the stem comprehensively, its constitutive parameters are shown in
Table 1.
2.4. Meshing Process
- (1)
Cutter model meshing
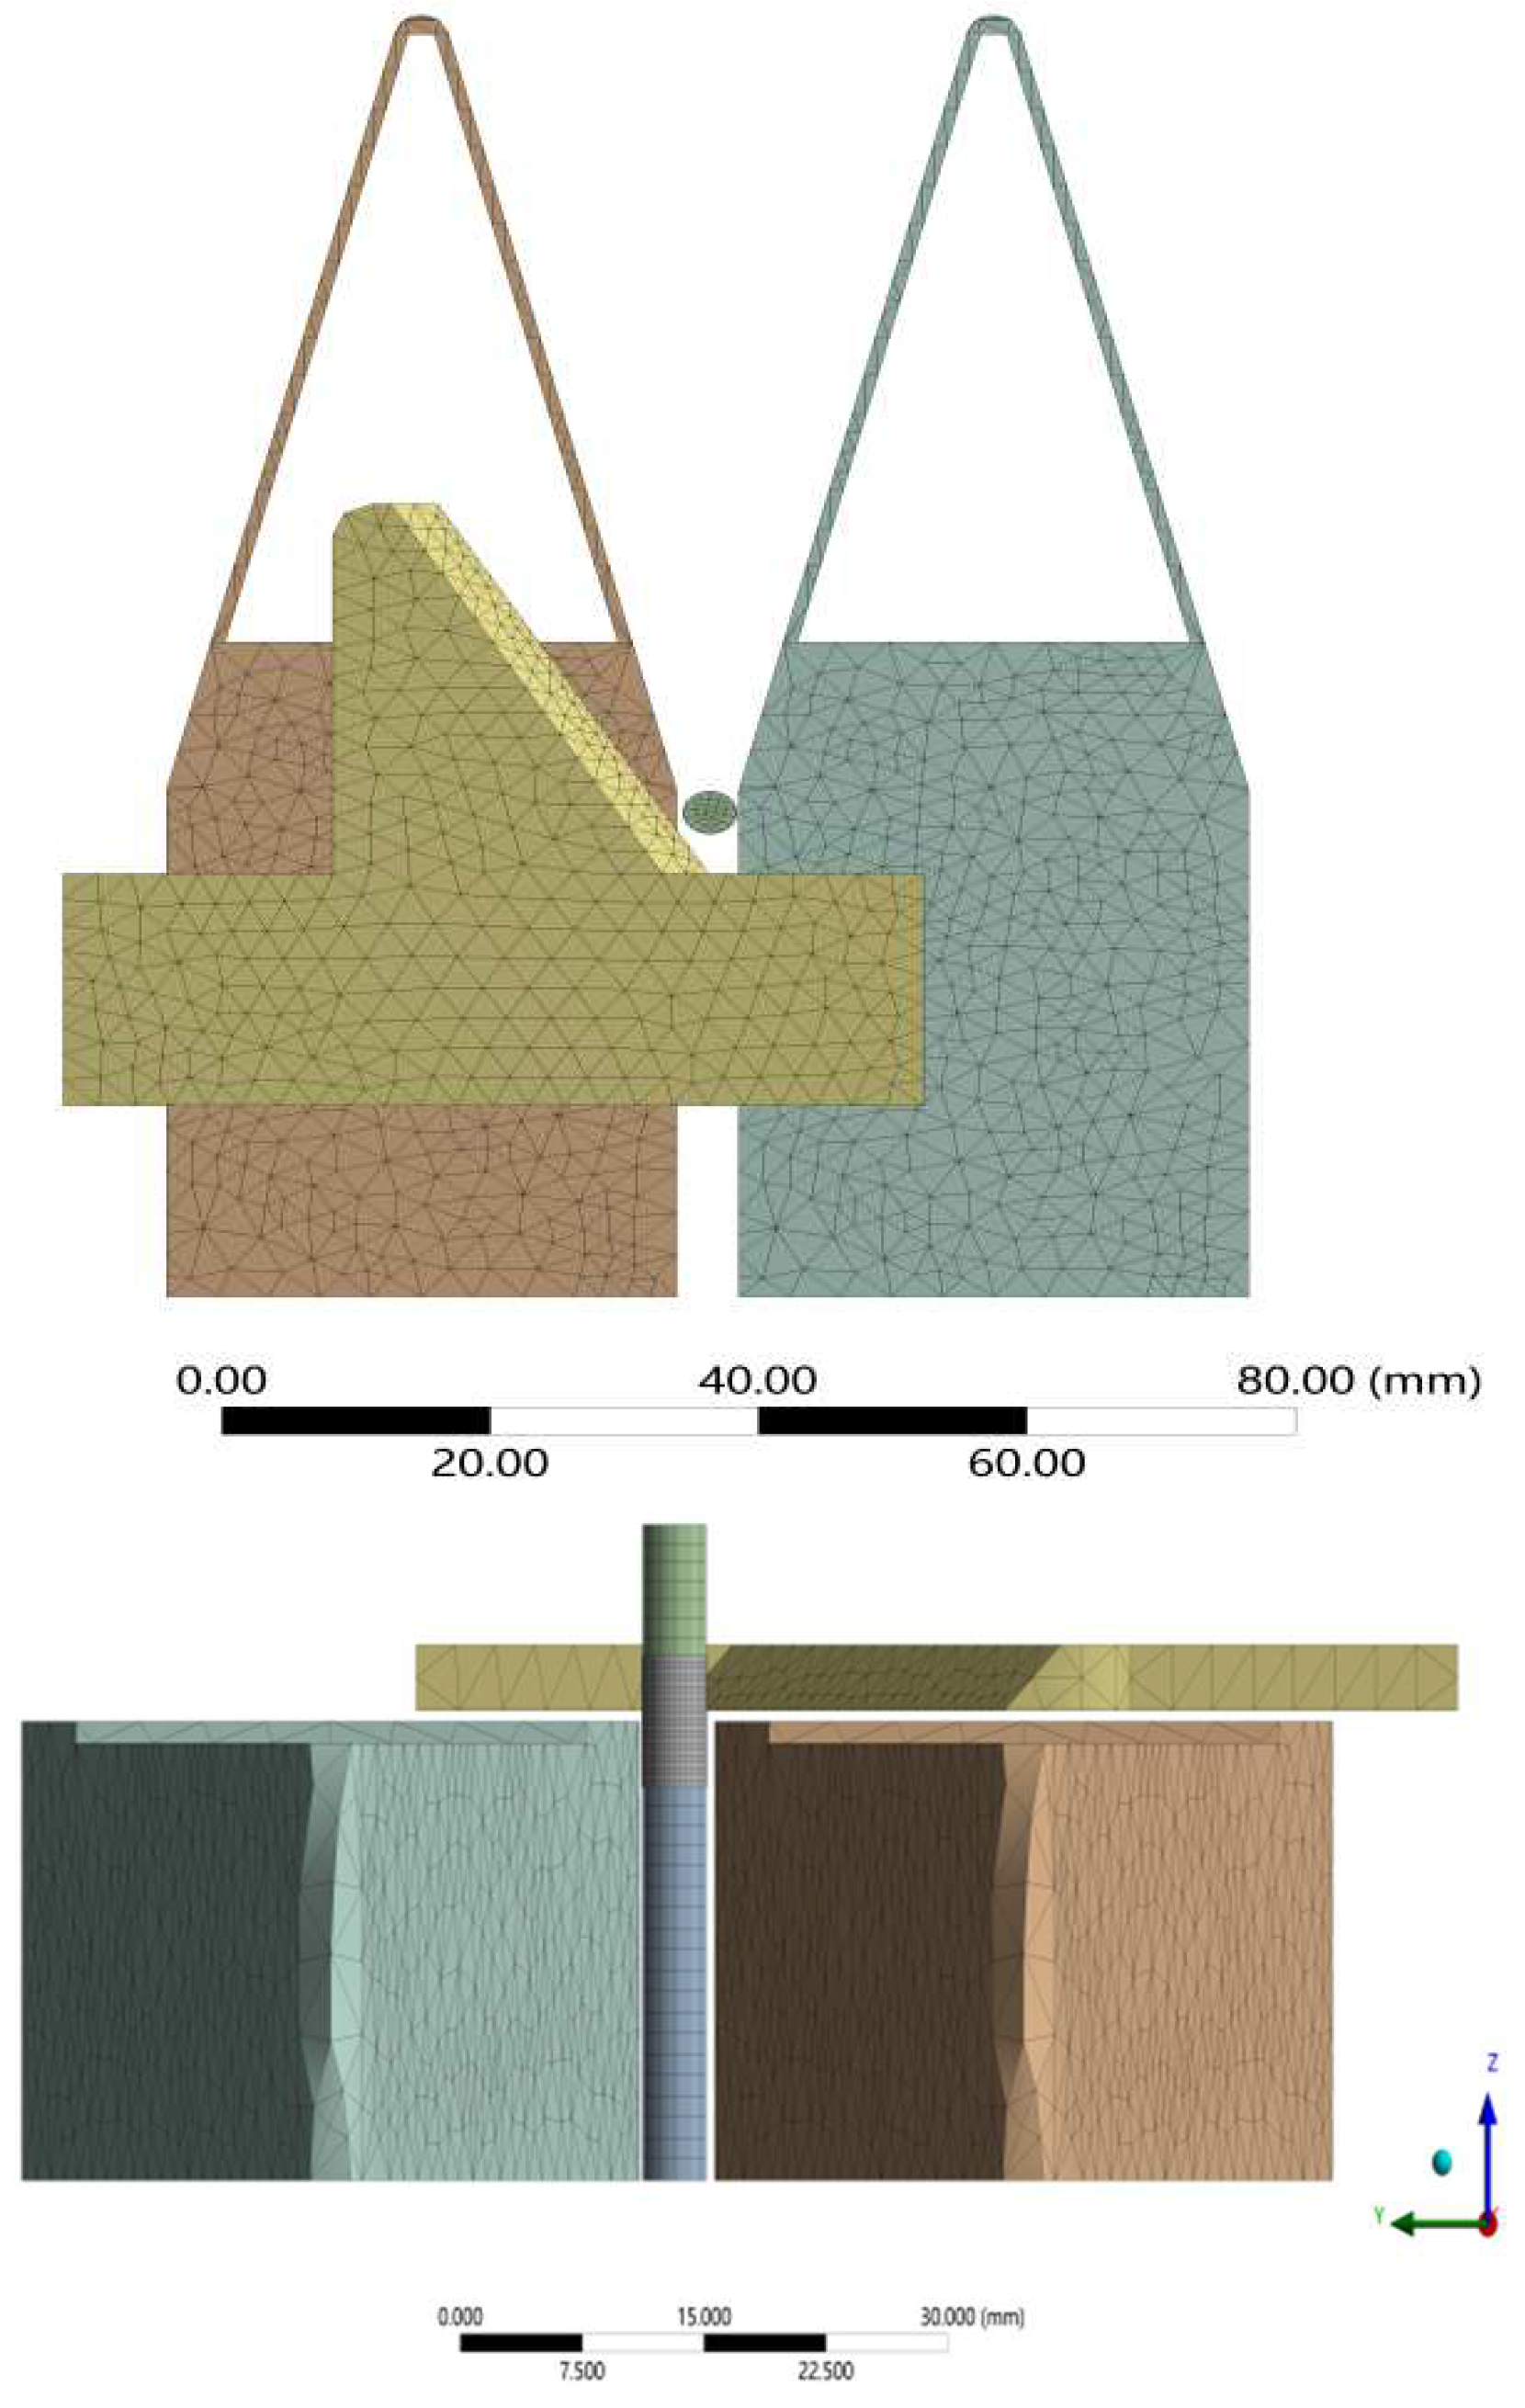
When the cutter mesh is divided, a reasonable mesh structure and size should be selected to improve the simulation accuracy and reduce the calculation cost. In this simulation, considering the irregular shape of the cutter, a tetrahedral mesh with the Patch Conforming function was used, with the geometry set to Tetrahedrons in Mesh Control. To ensure the simulation accuracy, the mesh of the cutting edge was refined, the Geometry option in Sizing was set to the cutting edge, and the mesh size was set to 1 mm. The effect of mesh division is shown in
Figure 2. After the division is completed, there are 1132 node elements.
- (2)
Mesh division of stem model
Since the stem model is a regular cylindrical structure, the Sweep function was used to divide the mesh. Set the free surface mesh type to Quad/Tri. The mesh was divided based on the cutting edge. Divide the model into cut areas and non-cut areas. The mesh of the cutting area was refined, and the size was set to 0.3 mm. The non-contact area mesh was set to 1 mm [
23]. The number of model mesh nodes is 1,5178. The division result is shown in
Figure 3.
2.5. Setting of Constraints and Boundary Conditions
- (1)
Constraint setting:
During cutting, the interaction between the cutter and the stem falls into the category of penetration. When the maximum shear strain reaches the ultimate strain, the material element on the stem becomes invalid. Therefore, the contact type was defined as face-to-face erosion contact. Set the option in Erosion Controls to On Material Failure. In Body Interaction, the kinetic friction coefficient between the cutter and the stem is set to 0.38, the static friction coefficient is 0.4, and other parameters are default values [
17]. Define initial conditions and boundary constraints based on actual operating conditions. This model assumes that there is no slack in the soil and the ground is absolutely flat. Assuming the soil-to-stem constraint as a cantilever constraint. Displacement constraints in the Y and Z directions are applied to the bottom end of the stem to limit the displacement in this direction. The constraints of the cutter are fixed translation constraints in the X and Z directions. That is, the double-acting cutters only move toward each other in the Y direction. The divider boundary conditions are set to fully fixed constraints.
- (2)
Boundary Condition setting:
According to the actual operation situation, the speed in the X direction of the stem model’s bottom is given to simulate the forward speed of the conveyor belt. Ignoring the effect of mechanical vibration during the cutting process of the cutting device, assuming that the cutter always moves in the same plane, set the cutter to the speed of Y positive movement. The cutting completion time is calculated based on the cutting distance and speed, and the entire numerical simulation is set to solution time.
2.6. Numerical Simulation Post-Processing Results
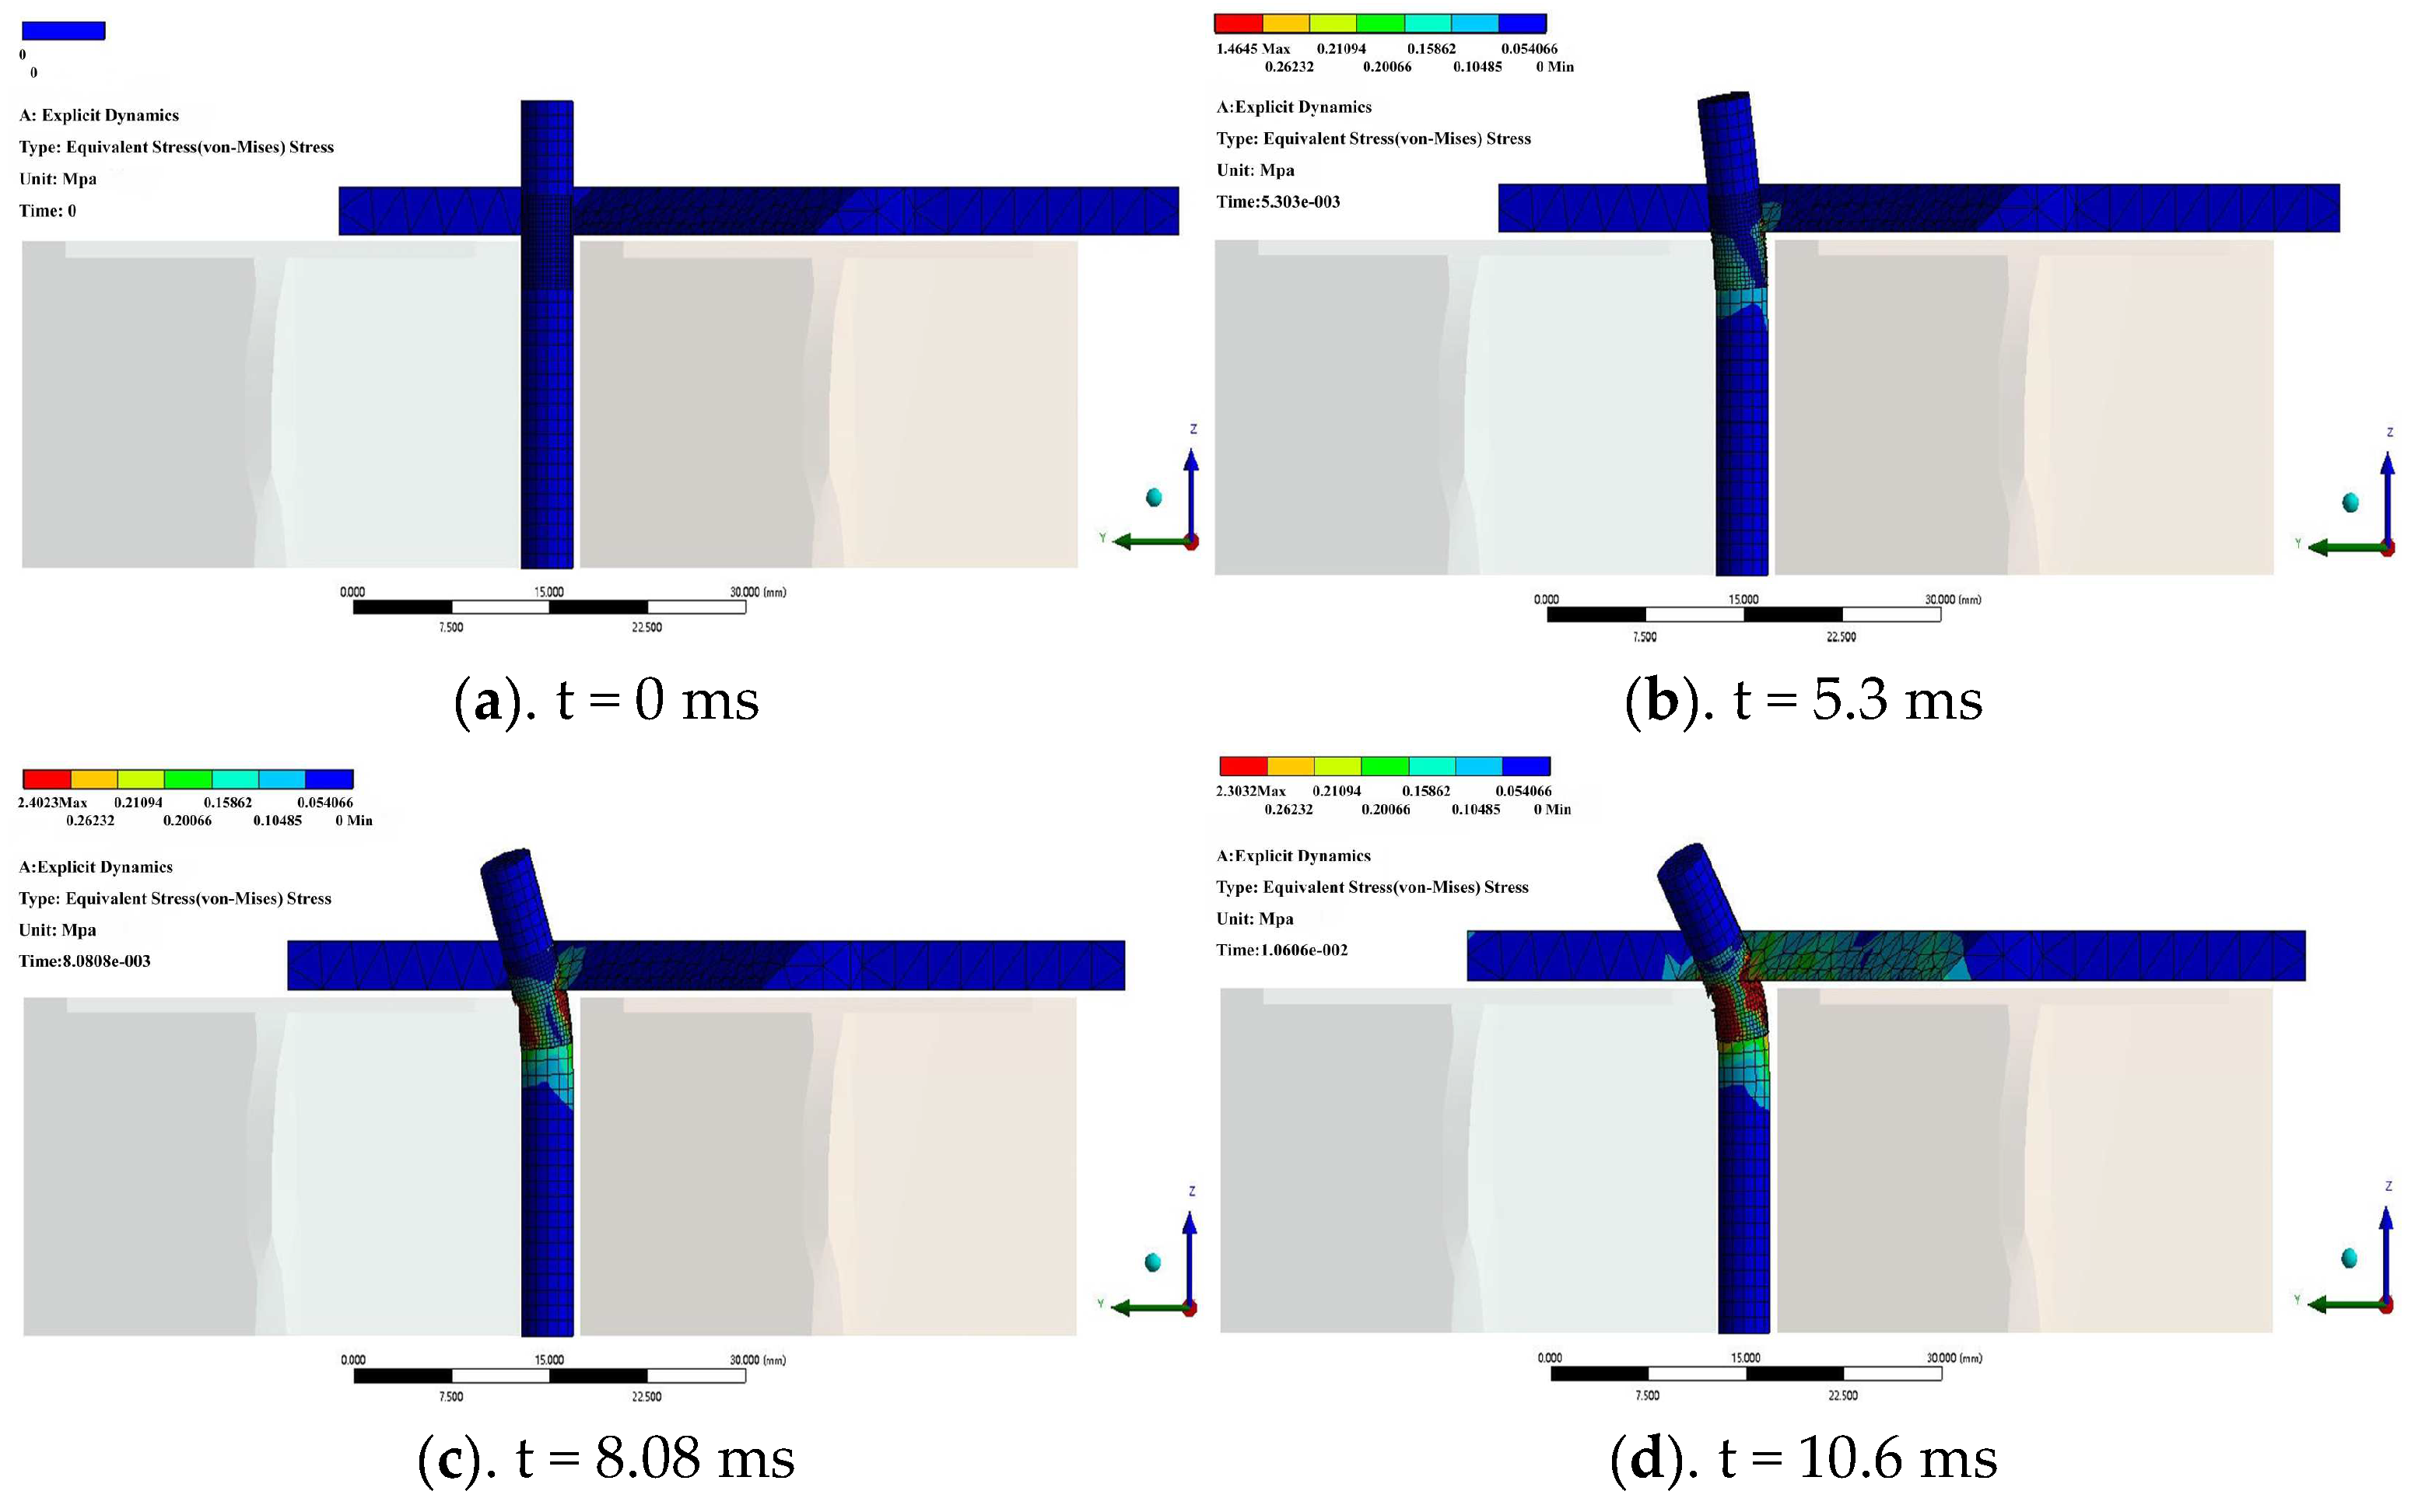
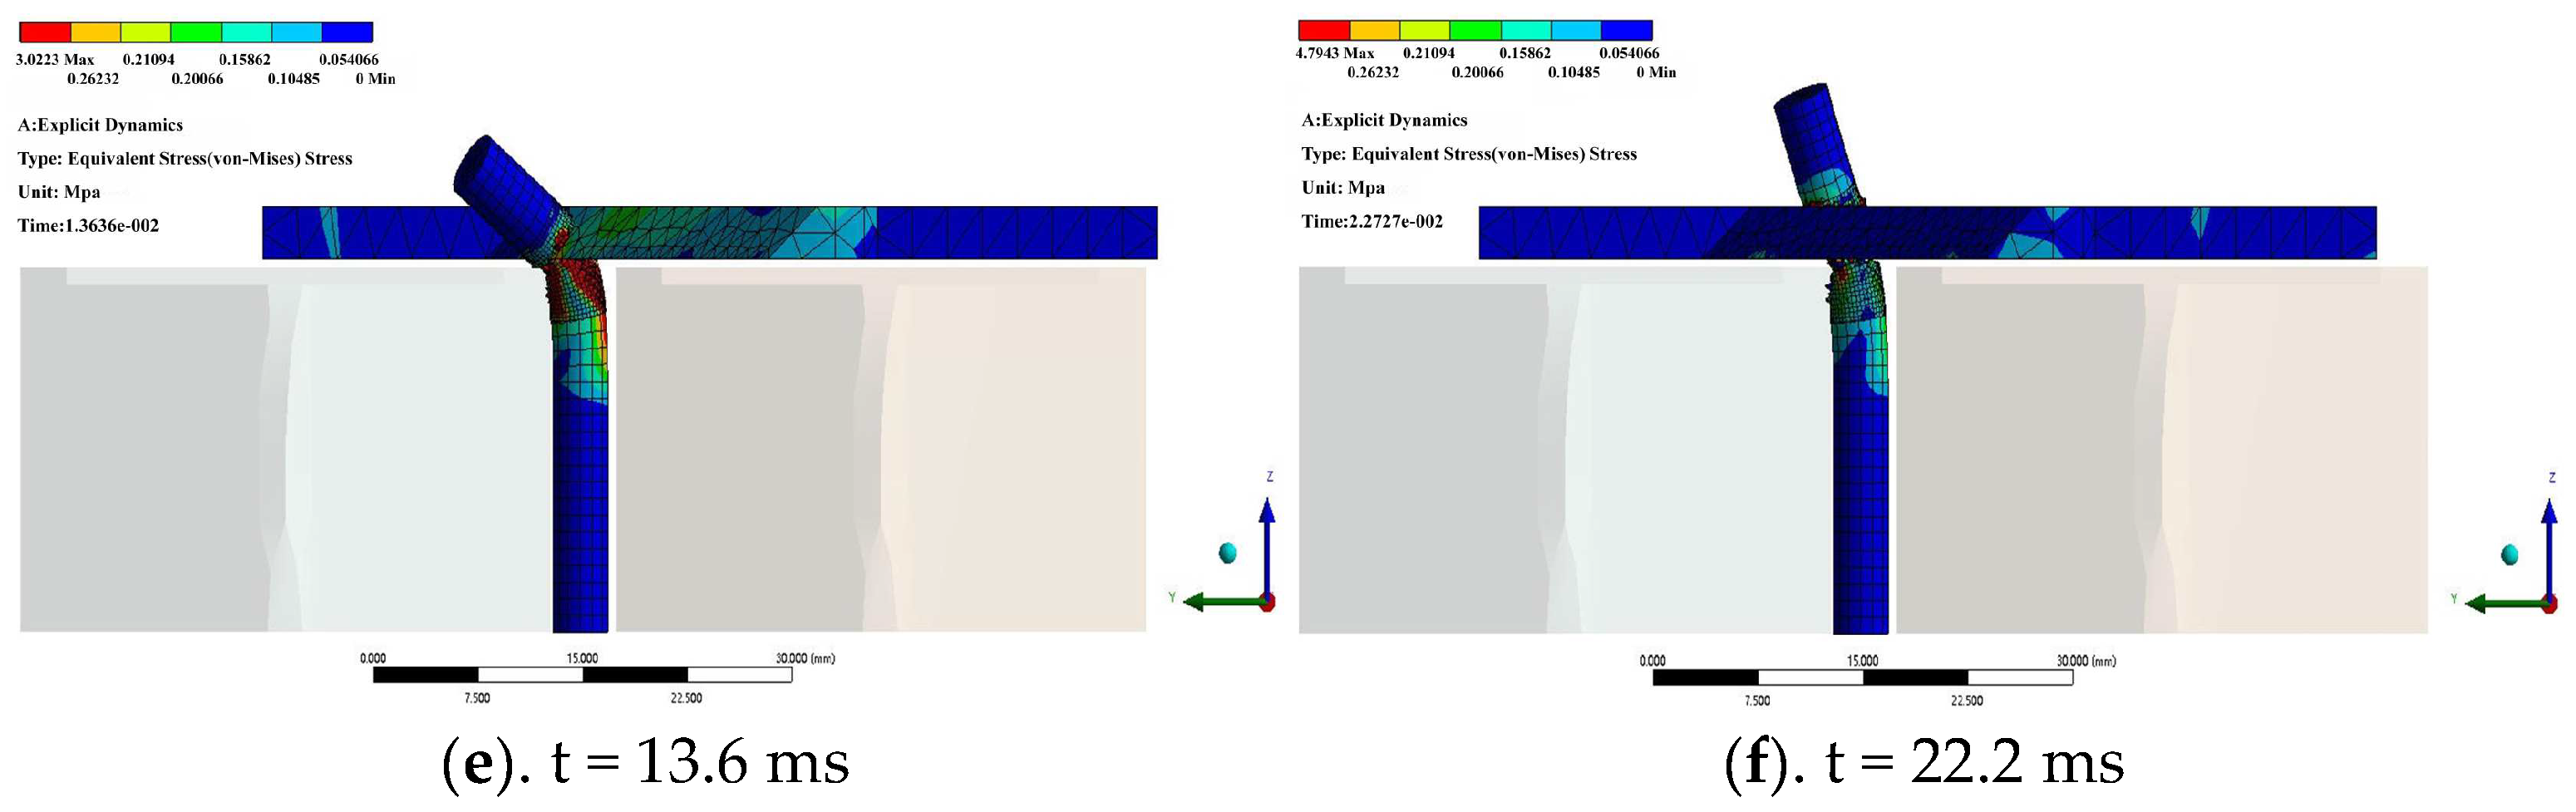
The equivalent stress changes during the cutting process were analyzed when the average cutting speed was 500 mm/s, the sliding angle was 30°, the cutting edge angle was 30°, and the cutter clearance was 1 mm, as shown in
Figure 4. The entire cutting process could be divided into four stages: the stage to be cut, the initial cutting stage, the in-depth cutting stage, and the termination cutting stage. First, in the stage to be cut (
Figure 4a), when the cutter and the stem are not in contact, the equivalent stress of the cutter and the stem are both 0 Mpa. Then the cutter moves at a speed of 500 mm/s in the Y direction and comes into contact with the stem at 2.78 ms. The cloud diagrams of the equivalent stress distribution in the initial cutting stage are shown in
Figure 4b,c. At this time, the stem is squeezed, and the equivalent stress in the contact area with the cutting edge increases sharply. The stem undergoes significant plastic deformation. When the shear strain exceeds the tensile strength of the fiber, the stem tissue is destroyed and invalid, and the cutter gradually cuts into the stem. During the in-depth cutting stage (
Figure 4d,e), the stalk tissue in the front end region of the cutter continued to fail, resulting in slippage and fracture of the entire fiber layer. Ultimately, shear damage to the entire stem is caused. In this stage, the cutting equivalent stress fluctuation increases. Stress concentration occurs throughout the cutting edge. The maximum equivalent stress time is 19.5 ms, and the maximum value is 7.08 MPa.
Figure 4f is the termination cutting stage. At this stage, the stems after cutting are gradually separated from the stubble. The maximum equivalent stress of the cutter and the stem is significantly reduced, but the cutter still has residual stress, so the equivalent stress is not 0 MPa.
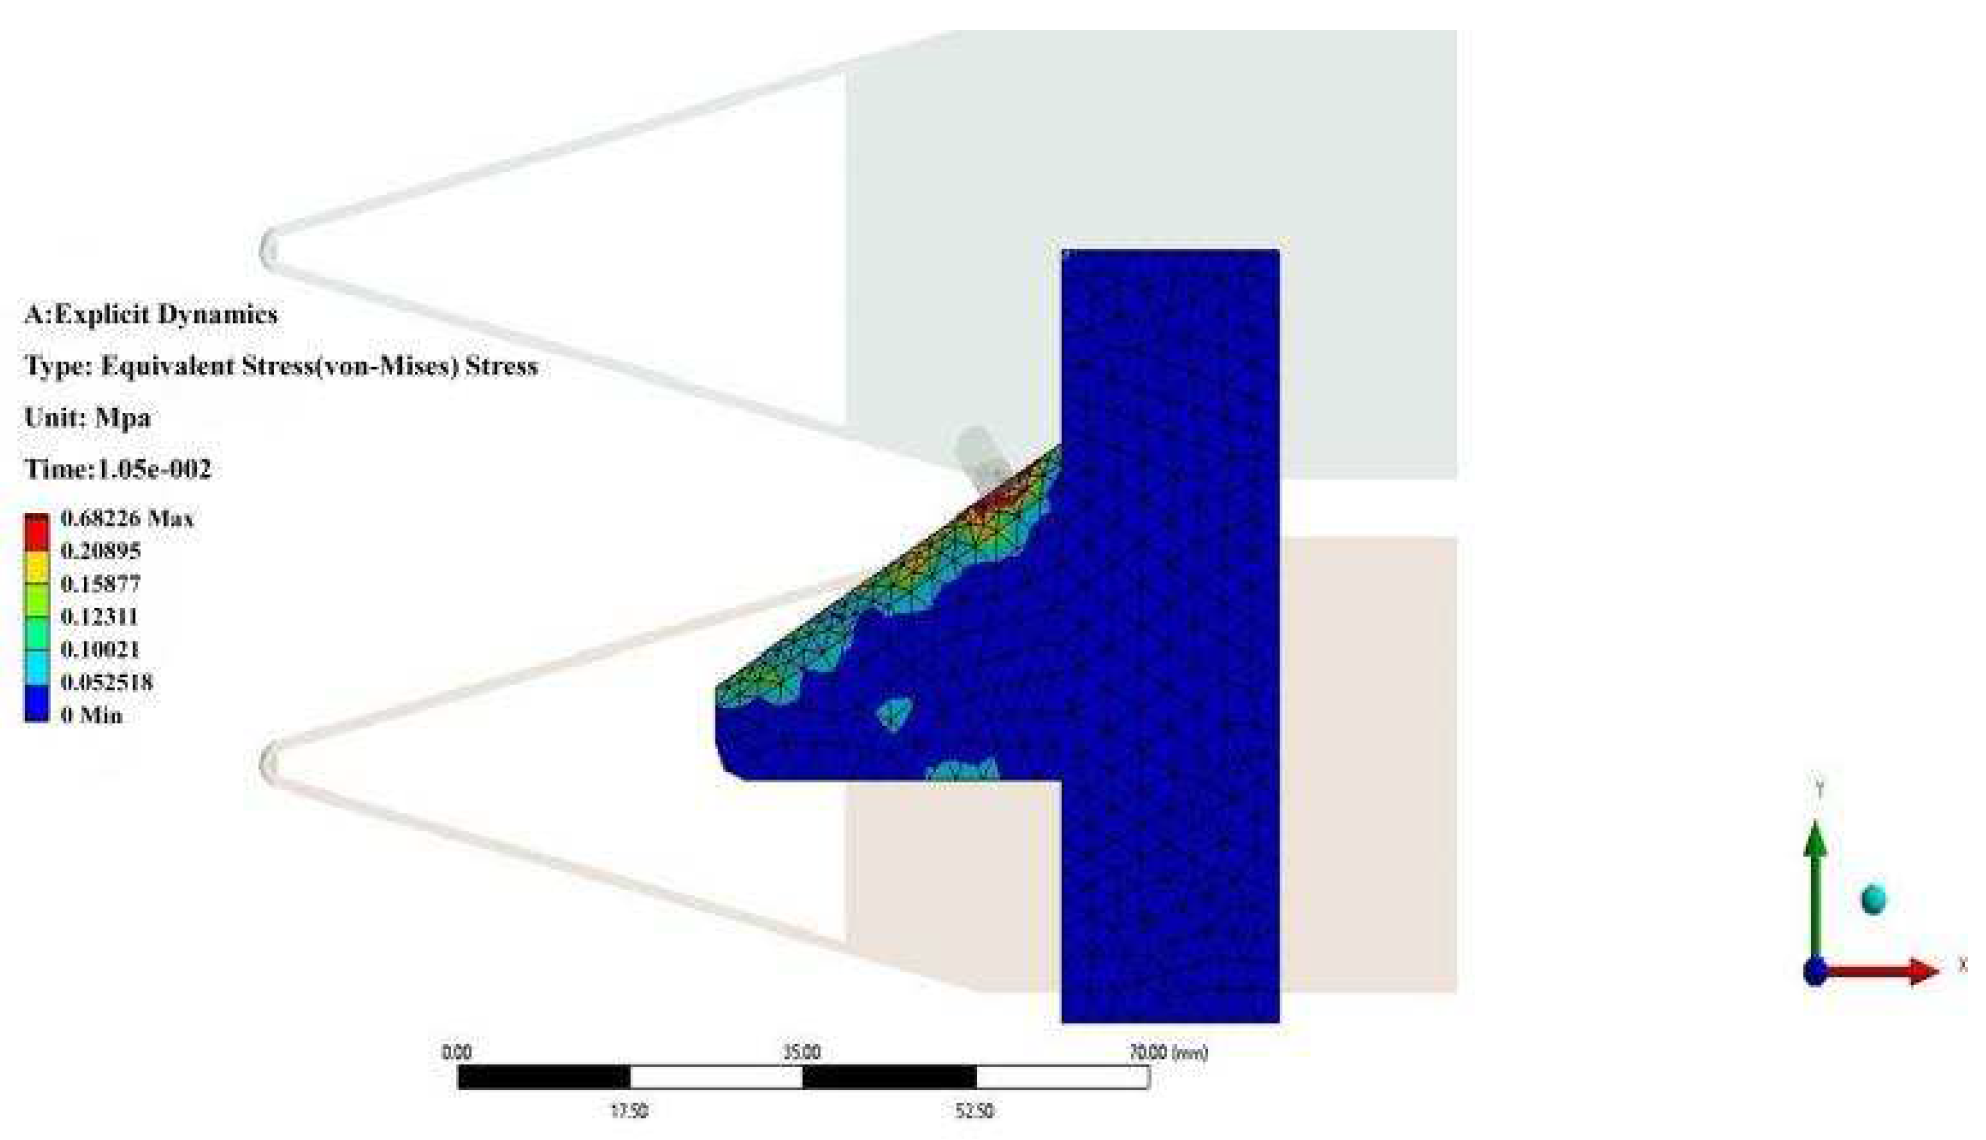
The cloud map of the cutter’s maximum equivalent stress distribution during the cutting process is shown in
Figure 5. When t = 10.5 ms, the contact between the upper cutter and the stem is the local stress peak area of the cutter. The maximum equivalent stress of the cutter is 0.62 MPa. It could be seen from the cloud map of the cutter’s maximum equivalent stress distribution that the stress mainly occurs in the cutting edge area. The stress and strain sensor should be installed here to improve detection accuracy during the cutting test.
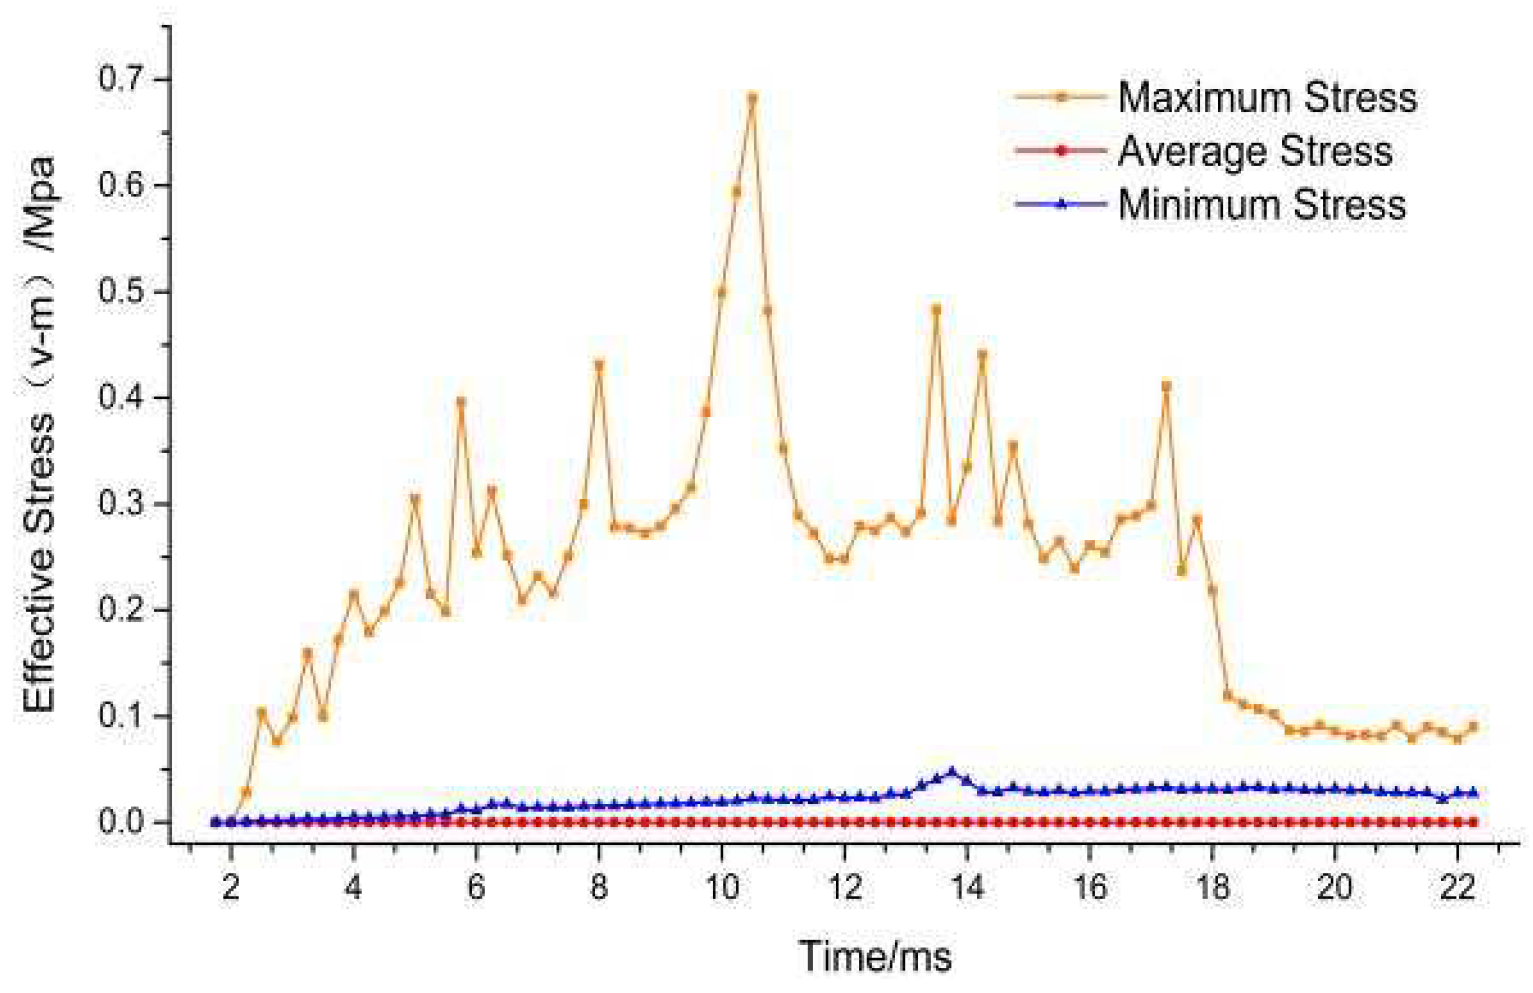
The equivalent stress change curve of the cutter during the cutting process is shown in
Figure 6. It can be seen in
Figure 6 that the cutter and the stem are in contact with each other at about 2 ms, and finally, the cutting operation is completed at about t = 19 ms. The entire cutting process lasts for 17 ms. The maximum cutting equivalent stress continuously changes dynamically, showing a trend of first increasing and then decreasing, consistent with the cutting resistance change of the actual shearing operation. Since the cutter is still affected by residual stress after the cutting operation is completed, the equivalent stress of the cutter does not disappear at the end of the cutting stage. The maximum equivalent stress of the cutter during the entire cutting process is 0.68 Mpa, which is much smaller than the yield limit of the structural steel material of 355 Mpa, which means that the cutter will not experience obvious plastic deformation and failure during operation.
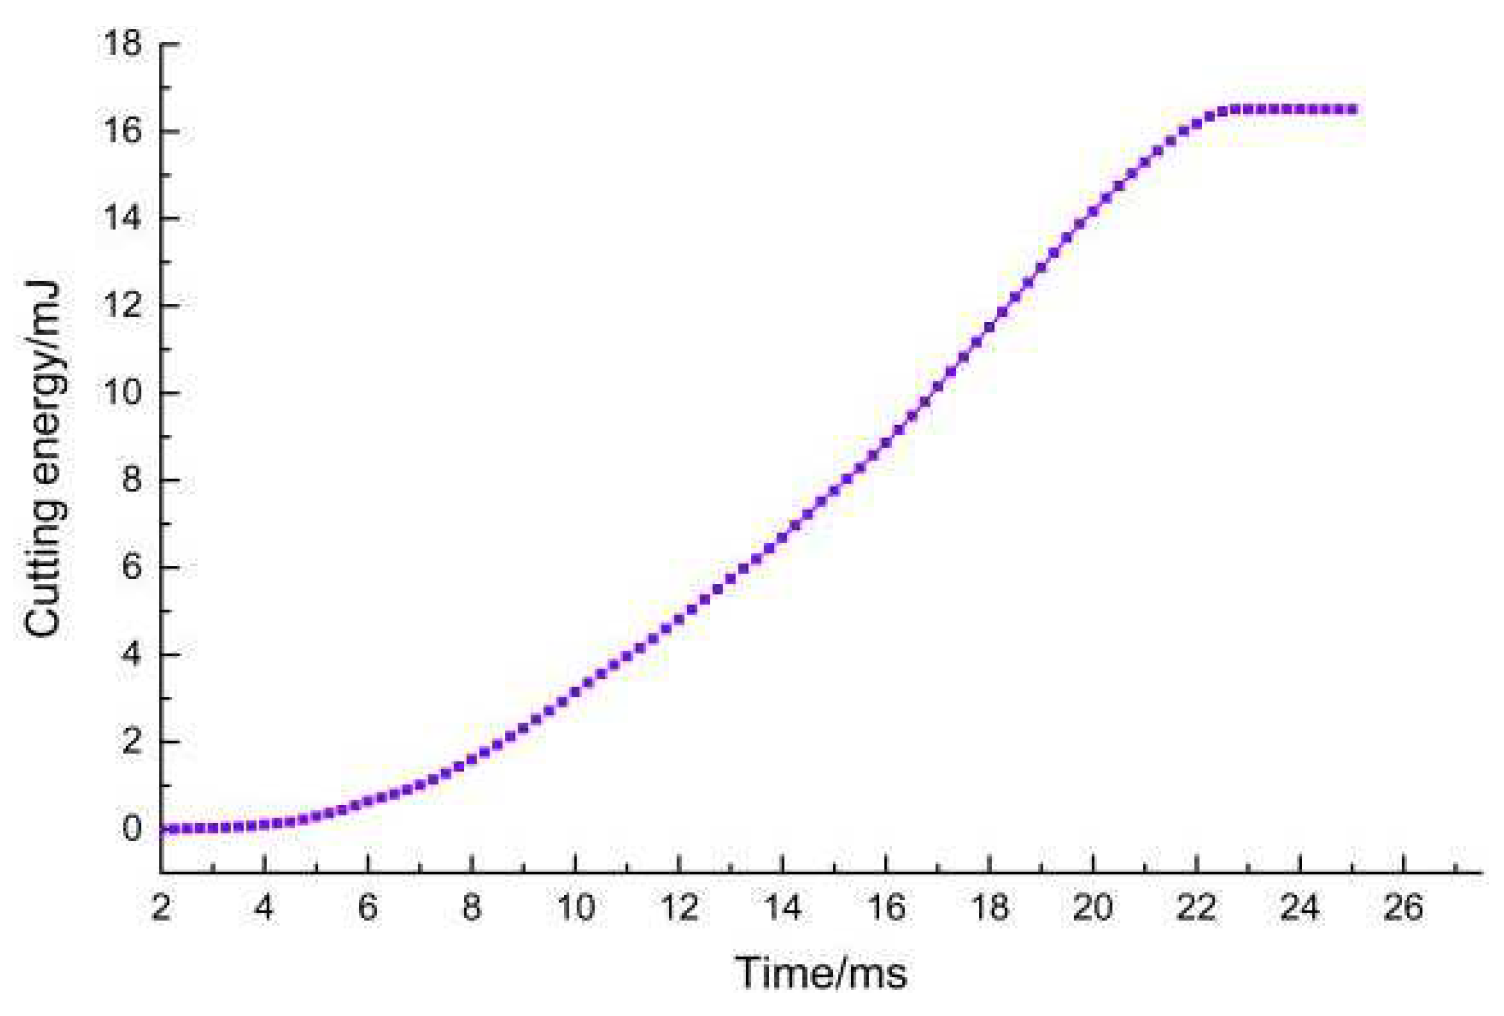
Figure 7 is the power consumption curve during the cutting process. During the cutting process, the power consumption experienced three stages: slow increase, sharp increase, and stable. It shows that the cutting resistance is smaller in the initial and the end stages of cutting but larger in the middle stage.
2.7. Design of Orthogonal Experiments
According to the actual working conditions of seedling grafting operation, the average cutting speed (X
1), sliding angle (X
2), cutting blade angle (X
3), and cutter clearance (X
4) were selected as influencing factors, referring to the structural parameters of various vegetable grafting cutters. The peak cutting equivalent stress σ
max of the cutter is the evaluation index. Combined with the Box-Behnken experimental design scheme, the response surface test was carried out to analyze the influence of various factors on the mechanical cutting properties of grafted seedlings. Then, single-factor and multi-factor interactions were analyzed using response surface methodology. A corresponding mathematical model is established to optimize the structure and motion parameters of the cutter. The test factor level coding table is shown in
Table 2.
2.8. Analysis of Orthogonal Experiment Result
The results of the response surface are shown in
Table 3. In the table, X
1, X
2, X
3, and X
4 are the average cutting speed, sliding angle, cutting blade angle, and cutting clearance, respectively. Y
1 is the test value table, which represents the maximum cutting stress of the cutter. The variance analysis was performed on the test data in
Table 3, and the multiple regression fitting equation of the maximum cutting stress of the cutter was obtained as shown in Equation (3):
It could be seen from
Table 4 that the regression model of the maximum stress of the stem cutting of grafted seedlings is significant (
p < 0.01), the lack of fit is not significant (
p > 0.05), and the model determination coefficient R2 ≥ 91%. The fitting accuracy of the model is high, indicating that the model could analyze the influence degree of each factor and predict the best parameters within the range of experimental values [
24]. The significance of each regression model’s factor could be judged by comparing the
p value. It could be seen from
Table 4 that for the maximum cutting stress, X
2, X
3, X
1X
2, X
2X
3, and X
3X
4 are extremely significant items (
p < 0.01). X
1 and X
4 are significant items (
p < 0.05). The other items were not significant (
p > 0.05). The influence of each factor on the maximum cutting equivalent stress of the cutter was judged by the
p value and the coefficient of the regression model’s factors. From large to small, the order is: sliding angle (X
2); cutting edge angle (X
3); cutting knife clearance (X
4); average cutting speed (X
1).
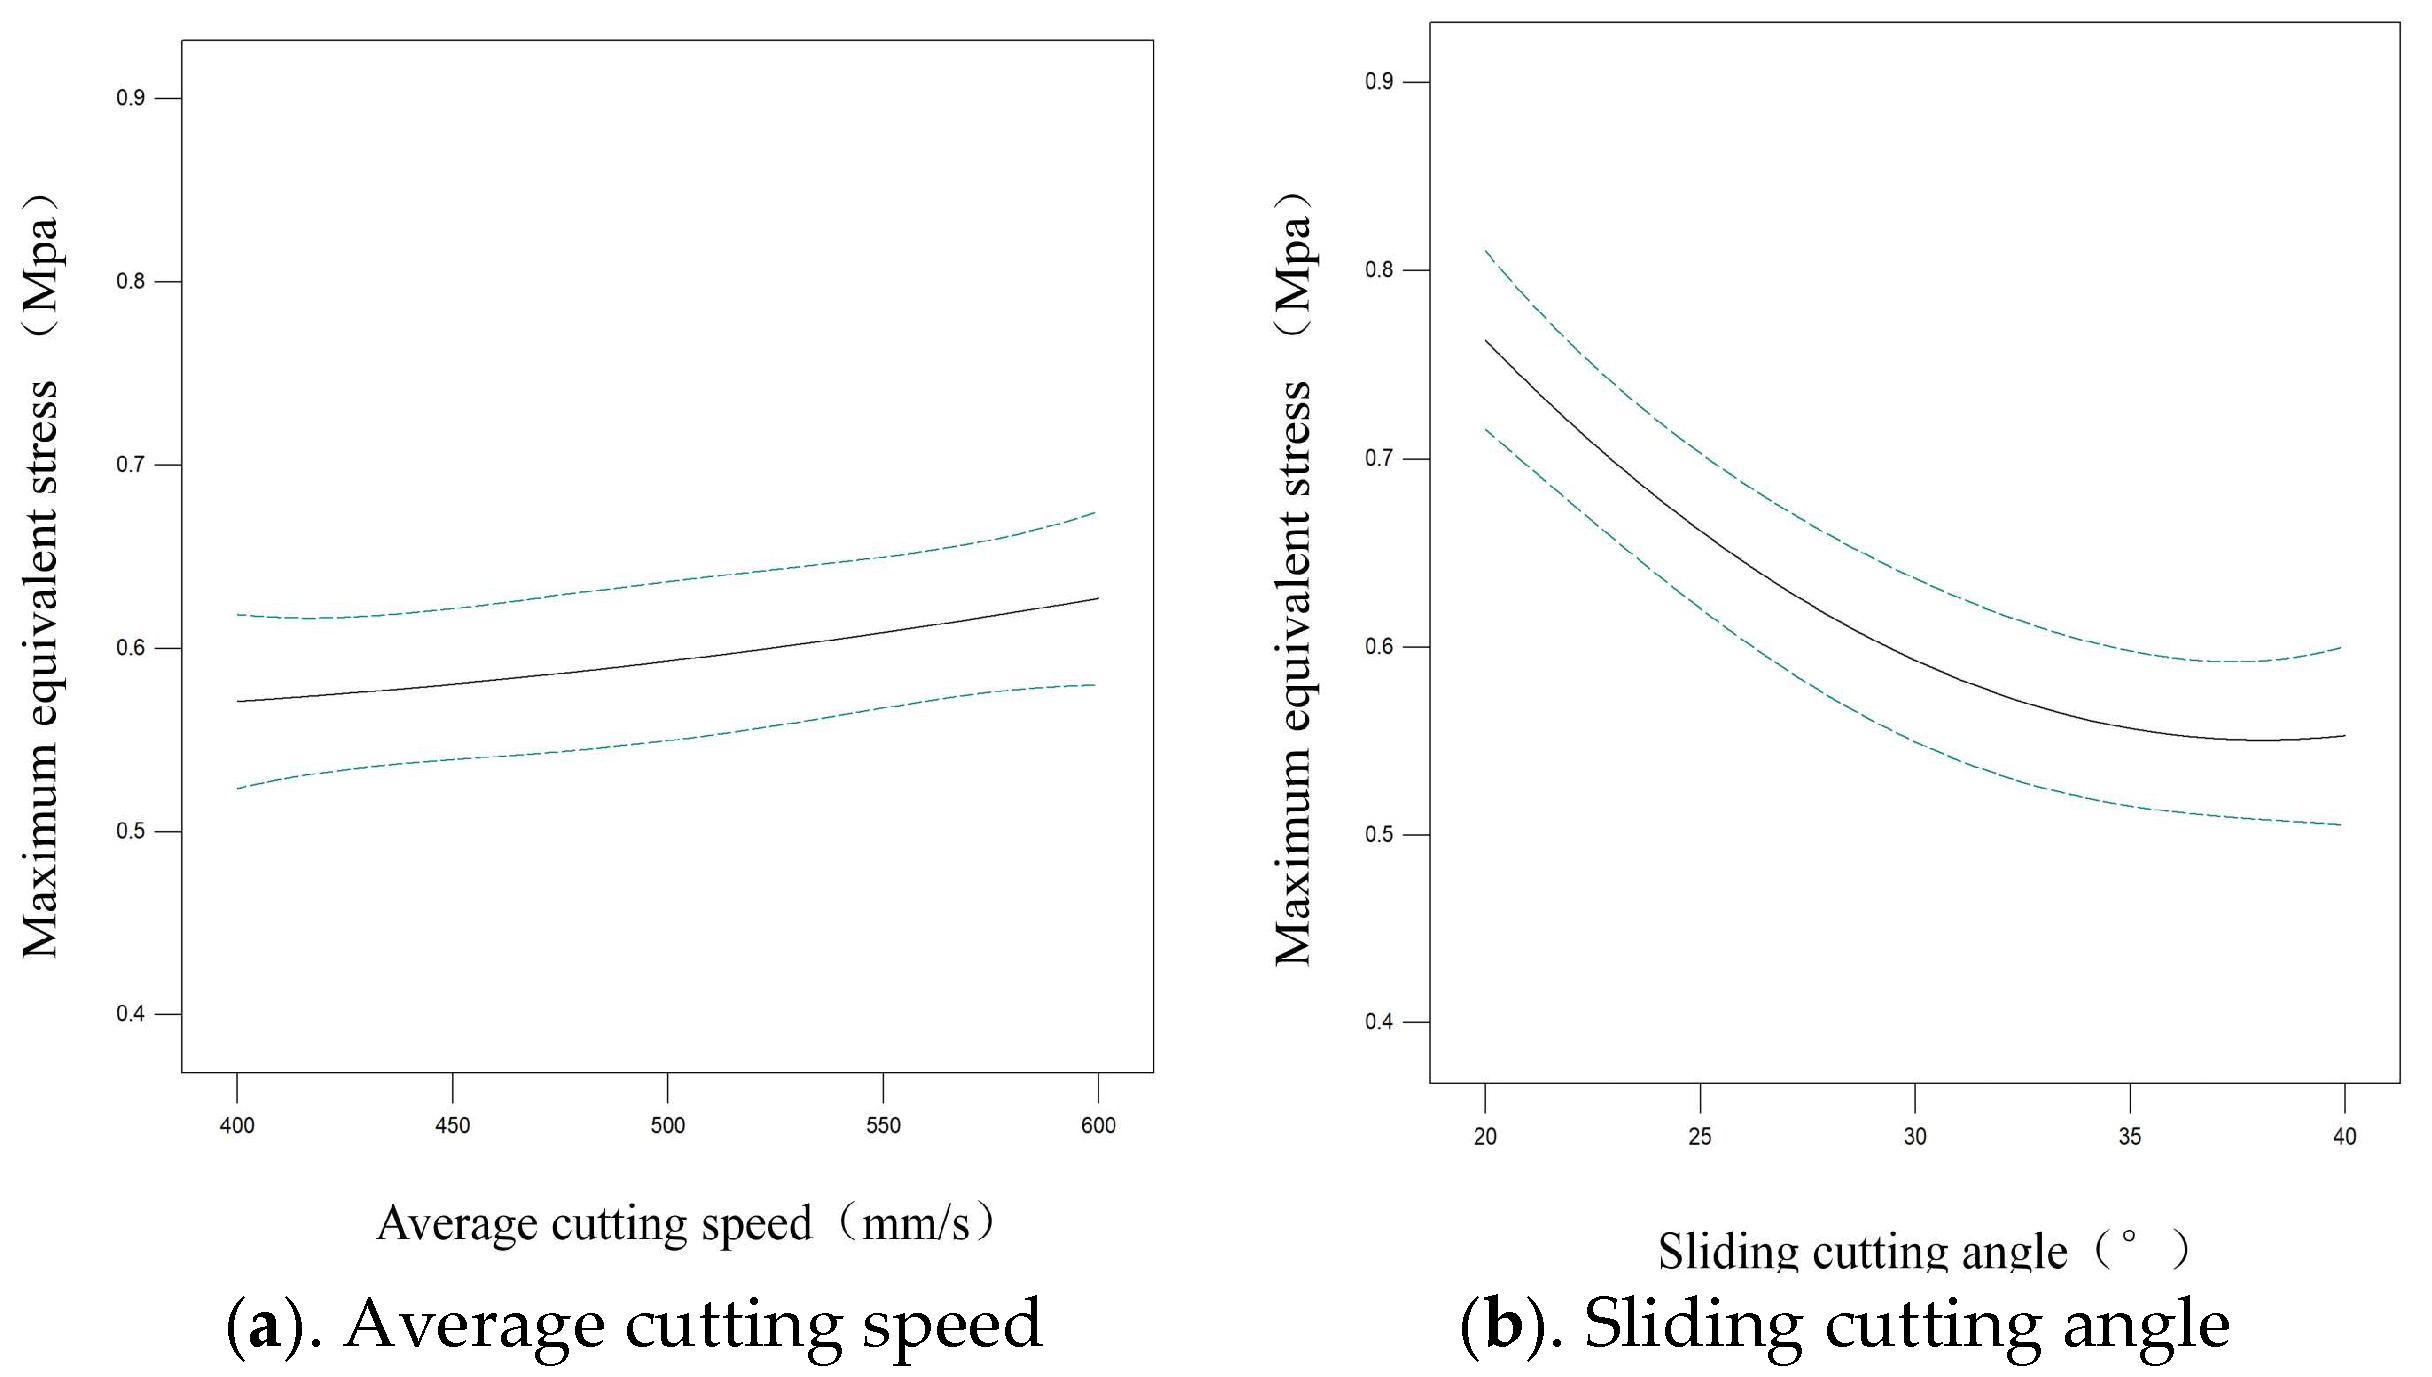
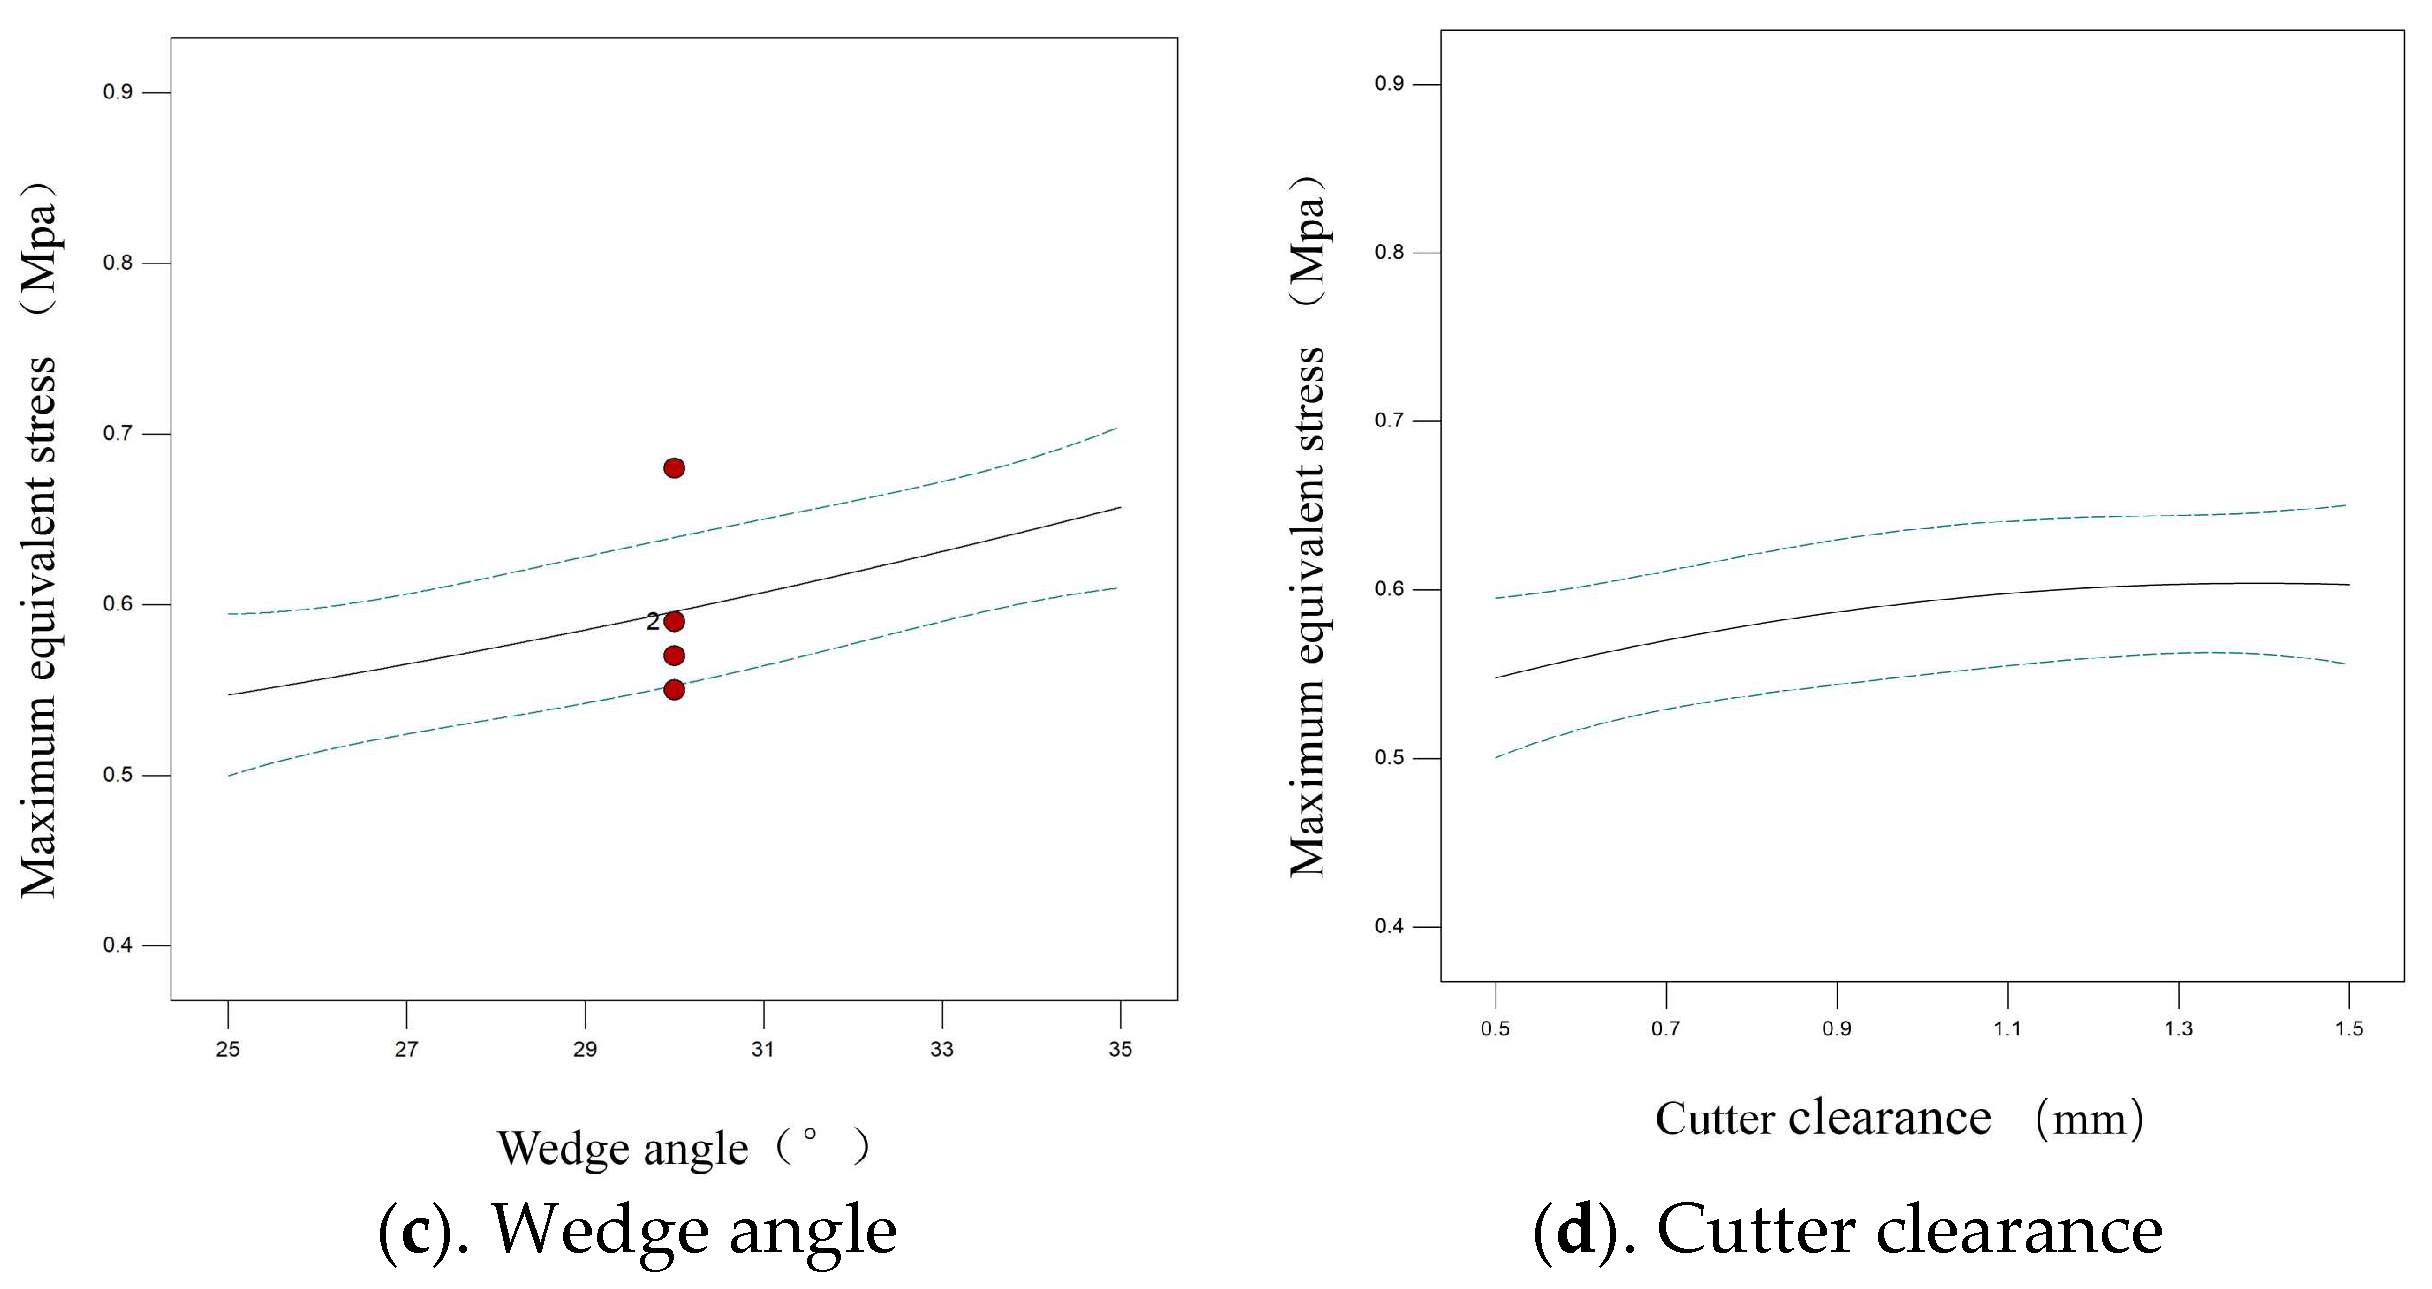
The influence curve of each factor on the maximum cutting stress of the cutter is shown in
Figure 8. It could be seen that within the specified range of cutter structure parameters, the maximum cutting stress presents a gentle upward trend with the increase of the average cutting speed. The maximum cutting stress decreases with the increase of the sliding cutting angle. The maximum cutting stress increases with the increase of the cutting edge angle. The maximum cutting stress increased slowly and then decreased slowly with the increase of the cutter clearance.
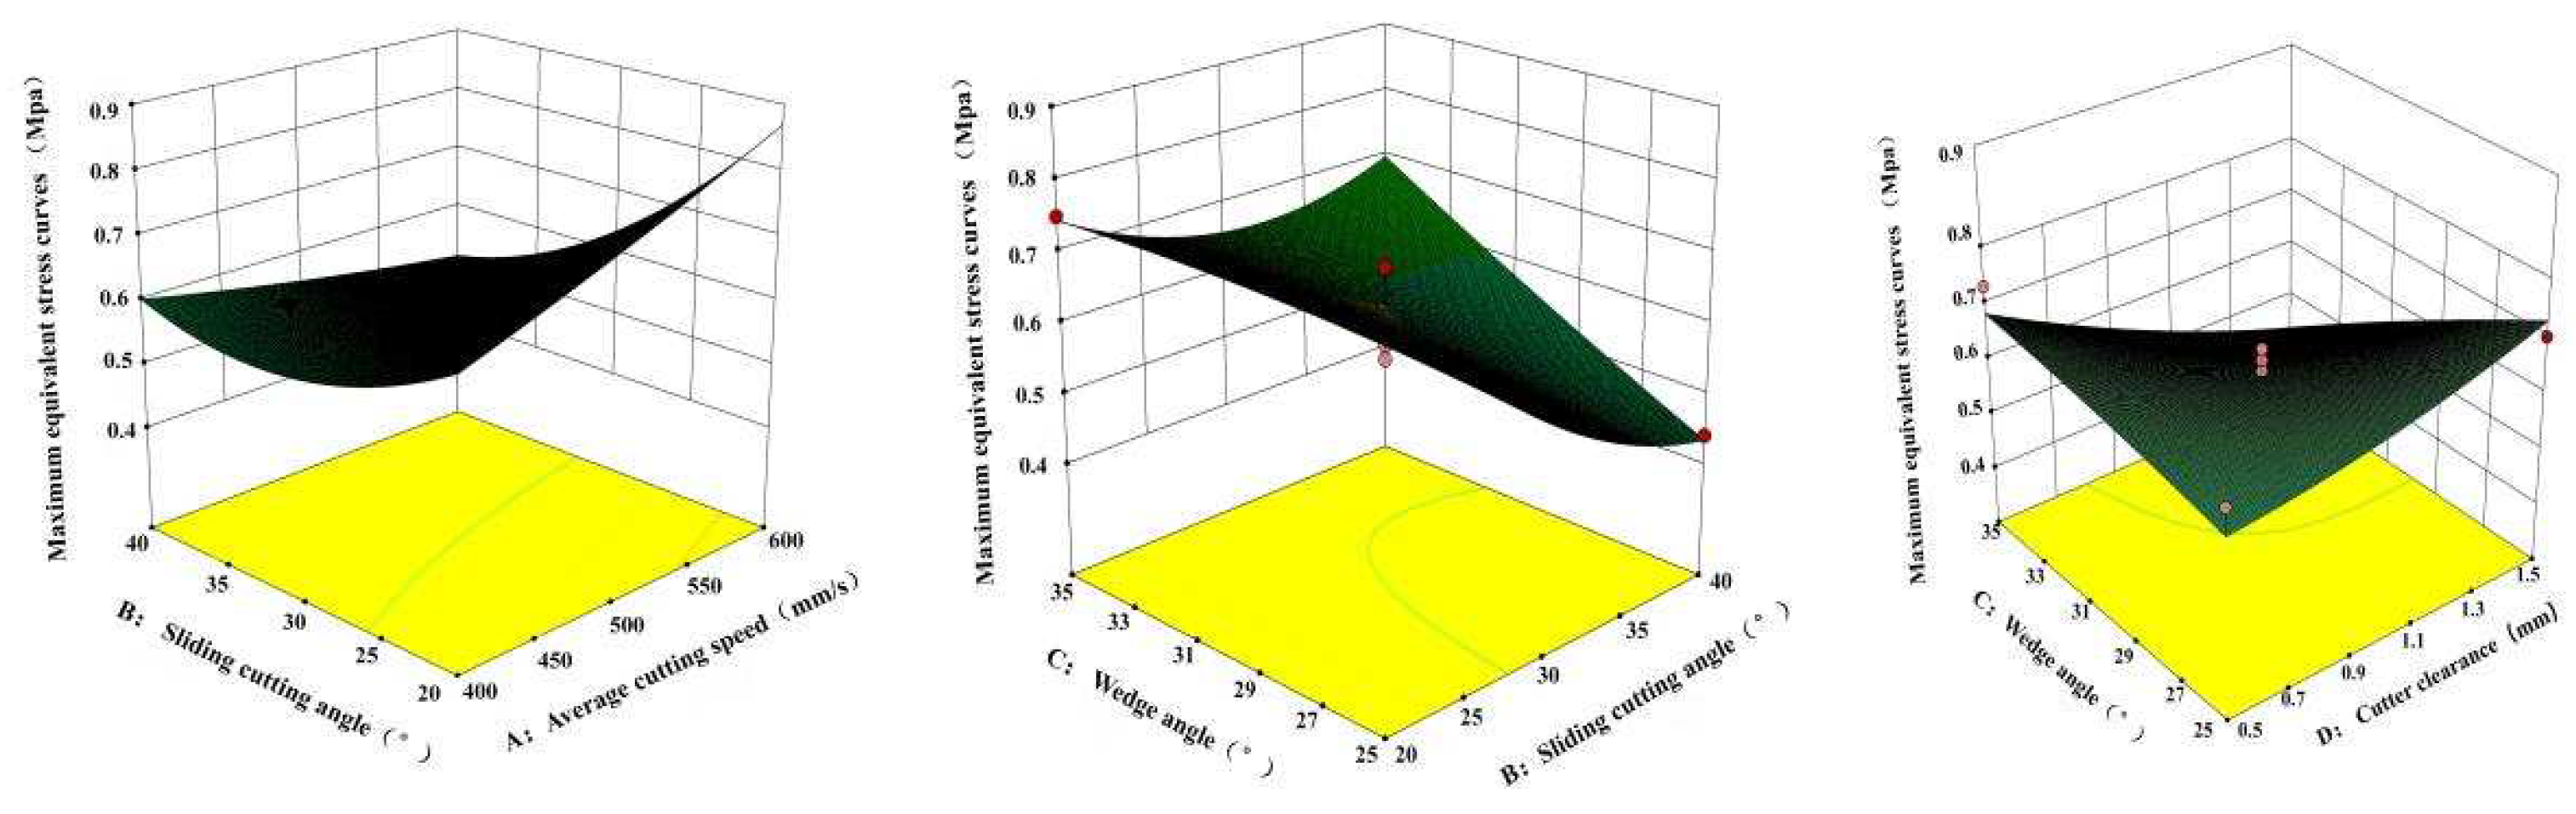
The effect of the interaction on the cutting stress of the stem was analyzed, and the response surface diagram is shown in
Figure 9. Within the range of different cutting angles, the maximum cutting equivalent stress of grafted seedlings decreased with the increase of the average cutting speed. When the cutting speed is constant, the maximum cutting equivalent stress decreases with the increase of the sliding angle. The interaction term of the sliding angle and the cutting edge angle had a very significant effect on the two indicators (
p < 0.01). In the range of different sliding angles, the maximum cutting equivalent stress decreases with the increase of the cutting edge angle. The interaction term of sliding cut angle and cutting clearance had a highly significant effect on the two indexes (
p < 0.01). The maximum cutting equivalent stress decreases with the increase of cutter clearance.
The two-dimensional contour map of the response surface in
Figure 9 shows that the change rate of the maximum cutting equivalent stress along the direction of each factor from fast to slow is the sliding cutting angle, cutting edge angle, cutting knife clearance, and average cutting speed, successively. It shows that the sliding angle has the most significant effect on the cutting stress, followed by the cutting edge angle. The cutter clearance and average cutting speed have little effect on the cutting stress.
2.9. Optimization of Regression Models
Within the constraints, the average cutting speed is 400 mm/s~600 mm/s, the sliding angle is 20~40°, the cutting edge angle is 25~35°, and the cutter clearance is 0.5 mm~1.5 mm. Taking the ultimate cutting stress of the cutter as the response index function, the response surface method is used to optimize the quadratic polynomial regression model. The optimal cutter structure and motion parameters of grafted seedling stems were obtained. The average cutting speed of the cutter is 532.17 mm/s, the sliding angle is 39.53°, the cutting edge angle is 25.15°, and the cutter clearance is 1.37 mm. At this time, the cutting limit equivalent stress of the cutter is the minimum, and the predicted value is 0.37 Mpa. To facilitate the cutter processing and parameter setting, the optimal cutter structure and motion parameters of the grafted seedling stem were set as the average cutting speed of 530 mm/s, a sliding angle of 39.5°, a cutting edge angle of 25.2°, and cutter clearance of 1.4 mm.
4. Discussion
In this study, we investigated the functional correlation between the working parameters and the working performance of the cutting device utilizing numerical simulations and physical experiments. It was found that the mechanical cutting properties of grafted seedlings had a great influence on the average cutting speed, sliding angle, cutting edge angle, and cutter clearance. By combining the numerical simulation method with the response surface method the cutting parameters were optimized, and the simulation results were verified by physical experiments.
Our results show that the maximum cutting stress is proportional to the average cutting speed. As the cutting speed increases, the inertial force of the stem to maintain the original state also increases, thereby increasing the cutting resistance. This result is comparable to that of Zhao et al. [
25] and Johnson et al. [
29]. This indicated that the mechanical cutting properties of grafted seedlings, Miscanthus, and maize are similar. The maximum cutting stress decreased with the increase of the sliding angle because the cutter caused tangential sliding along the cutting edge while cutting radially along the stem. When the cutting depth is the same, the larger the sliding angle, the larger the lateral slip of the cutter, though the cutting force is smaller at this time. Consistent with the theory of Cui et al. [
18], following the Goryachkin mechanics. The maximum cutting stress increases with the increase of the cutting edge angle. The cutter’s blade compresses the stem and produces the greatest tensile stress at the smallest radius of curvature. When the tensile stress exceeds the tensile strength of the stem fiber, the stem becomes invalid and is pulled off. The smaller the cutting edge angle, the smaller the radius of curvature of the contact area. At this time, the tensile stress generated by the blade increases, and it is easier to cut the fibrous tissue of the stem. The maximum cutting stress increased slowly and then decreased slowly with the increase of the cutter clearance. Because when the cutter clearance is small, the stem shear band ratio value is larger than the fracture band ratio value. At this time, the stem is in a pure shear state, and the cutting resistance value is large. When the cutter clearance is too large, the ratio of the fracture band is greater than the ratio of the shear band, resulting in increased cutting resistance. This theory has also been proved in the study of cutting mechanical properties of apple branches [
30].
However, it is worth noting that there are still some deviations in the numerical simulation technology, that is, the inconsistency between the calculation environment and the real environment, such as the plant material parameters of grafted seedlings. The effect of moisture content and differences between epidermis and xylem on cutting resistance were also not considered in this study, but there is a certain relationship between these factors and cutting resistance. In ANSYS software, the cutter could only complete the simulation of one stroke, which is inconsistent with the reciprocating working conditions of the cutter in reality. In addition, the cutting device would generate large periodic vibrations during high-speed cutting operations, and this working condition also affects the cutting force, which should be considered in subsequent research.
According to the experimental data in
Table 6 and
Table 7, it is found that the maximum longitudinal cutting stress value obtained by numerical simulation and physical experiment is greater than the transverse cutting stress value, that is, σ
X > σ
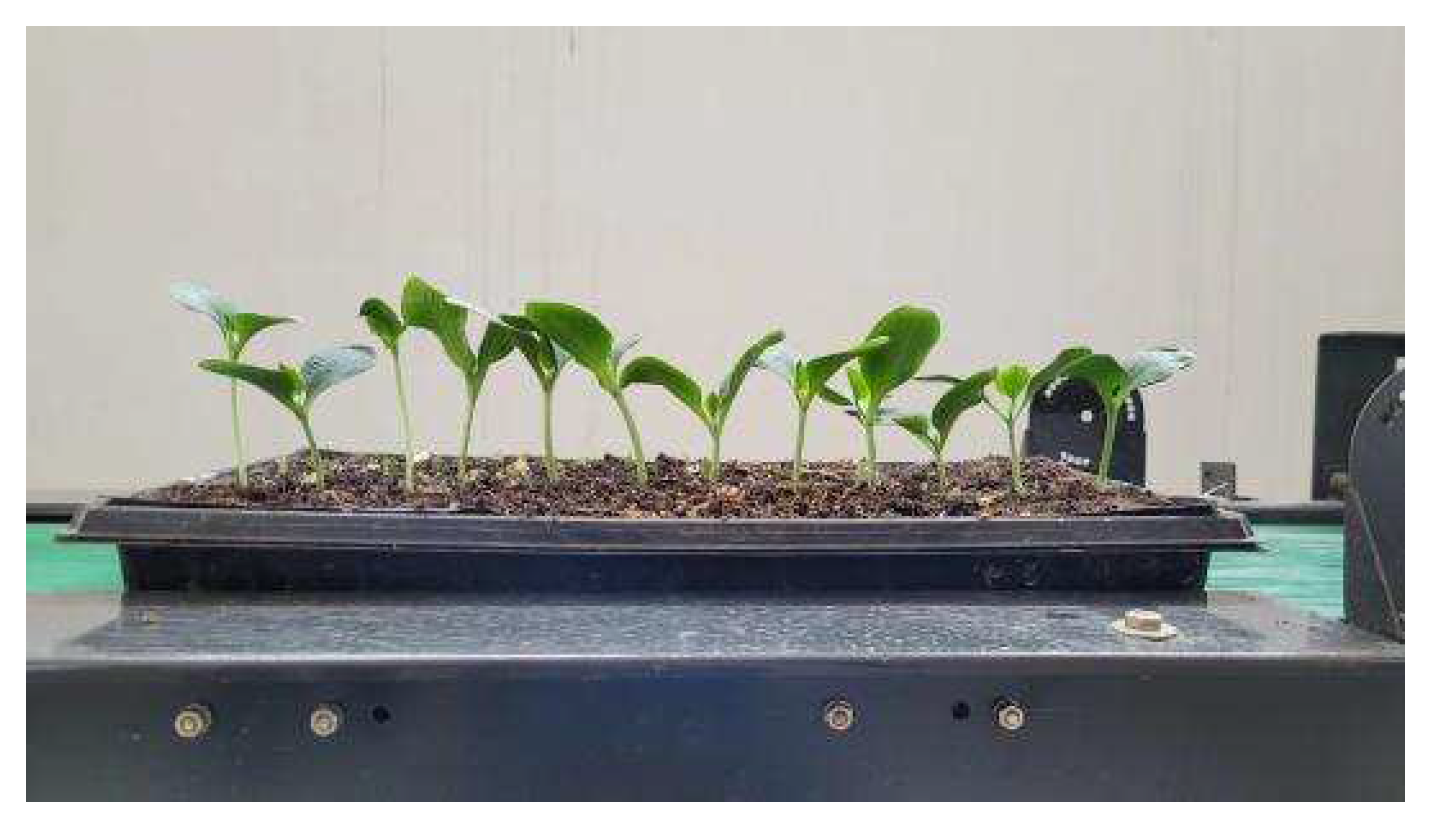
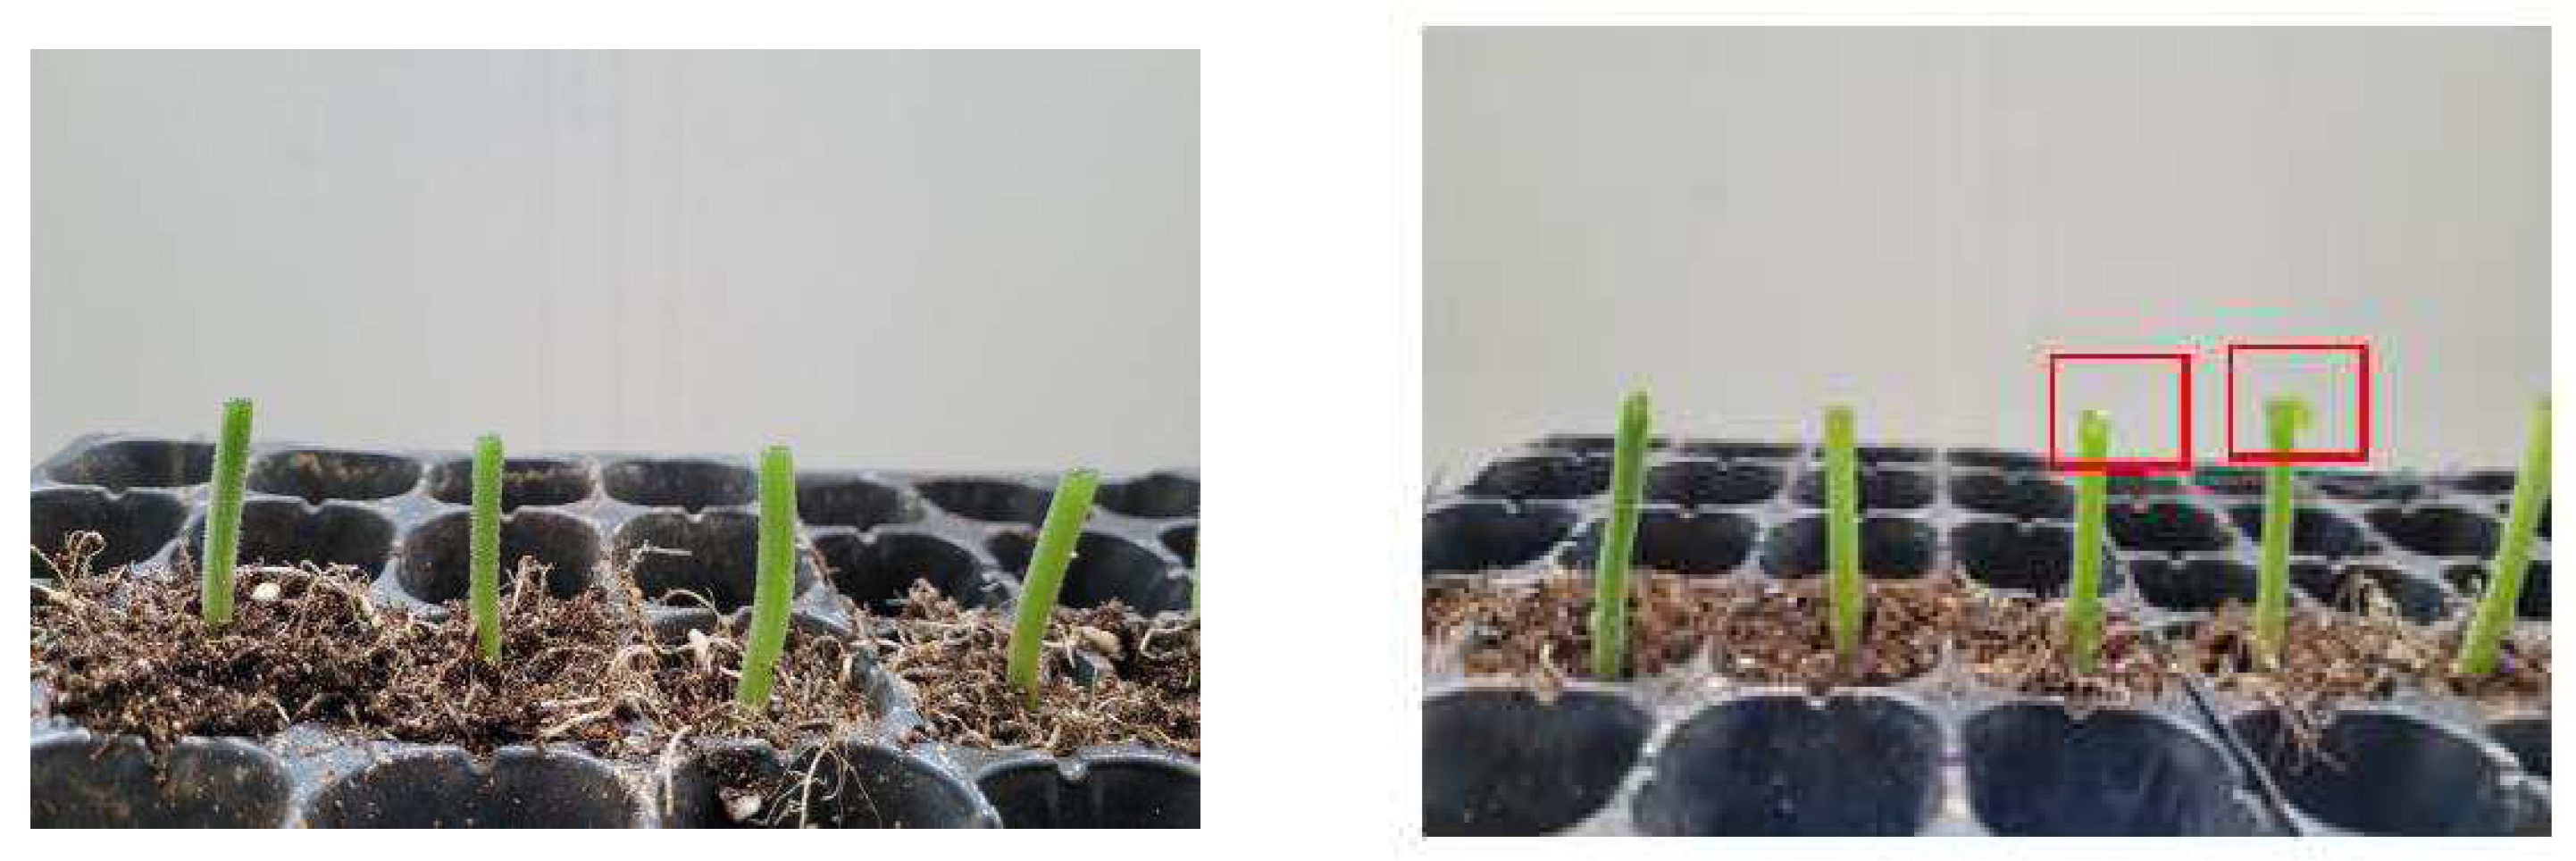
Y. This indicates that in the cutting process, the collision between the cutter and the stem has a great influence on the cutting stress in the forward direction. Feed speed and cutter tip geometry could be important factors in cutting resistance. The effect after cutting is shown in
Figure 14, and it is found that the cutting quality is generally good. However, the cutting quality of individual grafted seedlings is poor, leading to problems such as a low graft survival rate. The cutting quality is closely related to the structural parameters and motion parameters of the cutting device, and improving the cutting quality is the content that should be studied in the follow-up of the device.
5. Conclusions
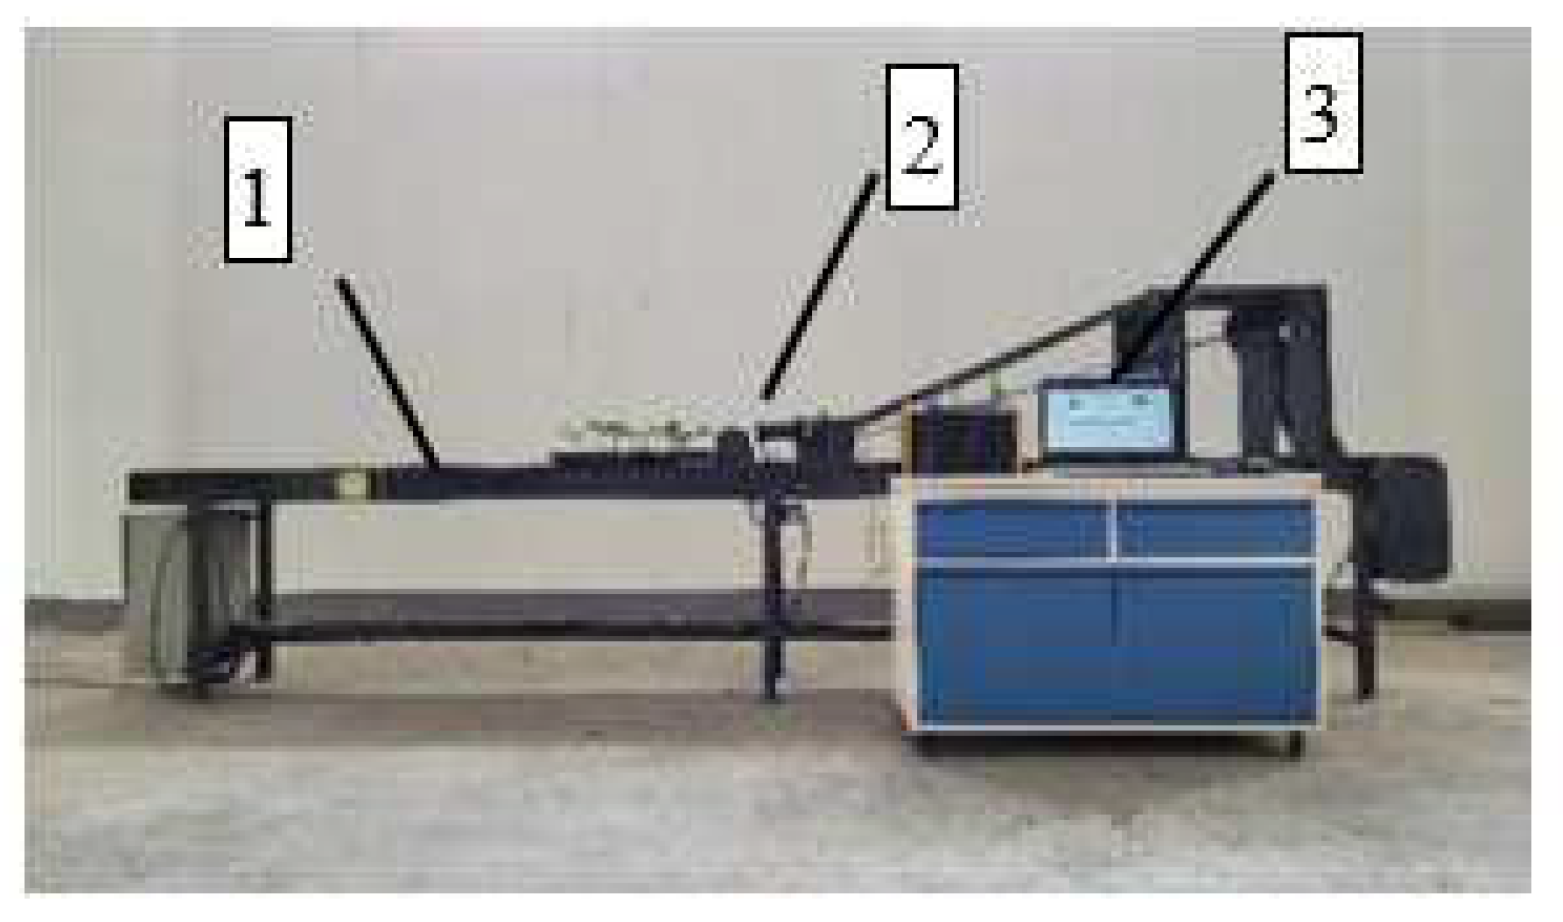
By combining the numerical simulation method with the orthogonal experiment method, the influence of the structure and working parameters of the cutting device on the mechanical properties of grafted seedlings was studied. The optimal cutting combination parameters were obtained by numerical simulation and multi-factor orthogonal experiment. An experimental bench for stem cutting was developed, and the accurate determination of the simulation results was verified by cutting experiments. The following conclusions could be drawn from the results of this study:
(1) The descending order of significance affecting the maximum cutting stress is the sliding angle (X2), the cutting edge angle (X3), the cutter clearance (X4), and the average cutting speed (X1). The interaction between the average cutting speed and the sliding angle, the sliding angle and the cutting edge angle, and the cutting edge angle and the cutter clearance has a significant effect on the cutting stress. The optimal cutting combination parameters are the average cutting speed of 532.17 mm/s, the sliding angle of 39.53°, the cutting edge angle of 25.15°, and the cutter clearance of 1.37 mm. At this time, the cutting limit equivalent stress of the cutter is 0.37 Mpa.
(2) Cutting experiments were carried out under the conditions of different cutting speeds and different sliding angles. The error of the maximum cutting stress between the simulated value and the experimental value is within 10%. The cutting stress under the optimal parameter combination is the smallest, which verifies the reliability of the simulation results. It provides a reference for optimizing a vegetable grafted seedling cutting device.


