Article

Experimental Study on the Particle Size and Weight Distribution of the Threshed Mixture in Corn Combine Harvester

1
Key Laboratory of Bionic Engineering, Ministry of Education, Jilin University, Changchun 130022, China
2
Key Laboratory of Efficient Sowing and Harvesting Equipment, Ministry of Agriculture and Rural Affairs, Jilin University, Changchun 130022, China
3
Chinese Academy of Agricultural Mechanization Sciences, Beijing 100083, China
4
College of Mechanical and Electrical Engineering, Shihezi University, Shihezi 832000, China
*
Author to whom correspondence should be addressed.
Agriculture 2022, 12(8), 1214; https://doi.org/10.3390/agriculture12081214
Submission received: 31 July 2022 / Revised: 10 August 2022 / Accepted: 11 August 2022 / Published: 12 August 2022

Abstract

:
The distribution of the threshed mixture is the link between the threshing and cleaning process during corn harvesting. Uneven distribution leads to a local accumulation of the mixture in the cleaning, resulting in high impurity and loss rate. Existing studies rarely concern the distribution of the corn threshed mixture. To address this problem, the distribution experiment was conducted in a self-made corn longitudinal axial threshing system to explore the distribution pattern, and both the particle size distribution and weight distribution of components (corn kernel, corn cob, and corn husk) were analyzed in this study. The results showed that the drum speed and concave clearance has a significant effect on particle size. Moreover, the impurities (corn cob, corn husk) increase with the drum speed. The weight distribution has an obvious uneven trend. In the axial weight distribution, corn kernels increased initially and decreased afterwards, while corn cobs and corn husks constantly increased. In the radial weight distribution, corn kernels and corn cobs were greater on both sides and less in the middle; corn husks had a clear left posterior accumulation. The increase in drum speed and feed rate and the decrease in concave clearance aggravated the inhomogeneity of the weight distribution. By analyzing the distribution characteristics, the drum speed of 400 r/min, concave clearance of 40 mm, and feed rate of 7 kg/s were confirmed to be optimal operating parameters. Under these conditions, the accumulation of the threshed mixture was weakened, which provided a satisfactory base for the subsequent cleaning. This study could provide a data support for the improvement of the threshing system. Additionally, this study is believed to have the potential to be used for the structural design of the cleaning system to reduce mixture accumulation and improve the cleaning performance.

1. Introduction

Corn is an important food crop and feed source, and the most productive crop worldwide [1]. With the increase in the corn plant area, the percentage of corn combine harvesters is rapidly increasing. The corn combine harvester can complete the processes of ear snapping, threshing, cleaning, and collection simultaneously, which has a high efficiency [2]. However, it also suffers from high loss and high impurity rates [3,4]. In the corn combine harvester, a longitudinal axial threshing drum and an air-and-screen cleaning device are wildly used for threshing and cleaning [5]. In recent years, several studies have committed to researching the threshing and cleaning device to reduce impurity and loss. Petkevichius et al. [6] analyzed the effects of drum speed and concave clearance on grain separation. Results showed that increasing the clearance appropriately had a significant effect on reducing grain loss and crushing. Wang et al. [7] proposed a corn threshing drum with a gradual change in diameter. The drum enhanced the contact and rubbing between the ears to achieve rapid separation of the kernel from the cob. Geng et al. [8] developed a plate tooth threshing device based on the mechanical characteristics of non-equilibrium threshing. It effectively reduced the grain damage to meet the requirements of corn combine harvest with high moisture content. Badretdinov et al. [9] simulated and analyzed the cleaning process of the grain combine harvester. The parameter combination of the cleaning device was determined through a mathematical model of the material and airflow. Gebrehiwot et al. [10] studied the influence of crossflow openings on the performance of centrifugal fans. Wang et al. [11] explored the material properties, structural forms, and working parameters of the corn cleaning screen. Based on these studies, several cleaning screens, such as a curved screen, combined hole screen, and polyurethane rubber screen, were designed. Liang et al. [12] developed a multi-duct cleaning device with a return pan for rice combine harvesters according to the distribution of airflow and threshed outputs.
The cleaning unit is located below the threshing unit, and they are closely related units, as shown in Figure 1. When the combine harvester is working in the field, corn ears are threshed by the threshing drum and concave after picking [13]. The threshed mixture continuously drops on the oscillating plate and cleaning screen. Then, corn kernels are separated from impurities by combining airflow and vibration [14]. The object in the cleaning unit is the threshed mixture produced from the threshing unit. The distribution of the threshed mixture plays an important connecting role between the threshing and cleaning procedure. The distribution reflects the performance of the threshing device. Thereby, it provides data support for the improvement of the threshing device. More importantly, it directly affects the subsequent cleaning performance. Therefore, it has great significance to study this distribution to reduce the cleaning impurities and loss. For the distribution and motion of agricultural materials, Hunynh et al. [15] introduced stochastic concepts to establish a mathematical model of threshing and separation. The model quantified the effect of structural and process parameters on grain loss rate. Miu et al. [16,17,18] investigated the threshing and separation processes of axial and tangential threshing units. A cumulative separation curve was established to indicate the proportion of unthreshed grain, free grain, and separated grain along the axial and tangential. Yi et al. [19] compared the distribution of rice threshed mixtures in plank-tooth and spike-tooth axial flow threshing installation. Results showed that the distribution curves of the two devices were the Peal–Reed model along the axis and polynomial with different coefficients along the radial. Yuan et al. [20] explored the weight distribution of rape components under the cyclone cleaning system. The results confirmed the significant influence of each component under the sieve on the cleaning performance. Chen et al. [21] conducted the effects of drum speed, concave clearance, and operating parameters of the diversion plate on the distribution of a soybean flexible threshing device. Fu et al. [22] simulated the distribution of the rice threshed mixture in a drum-shaped bar-tooth longitudinal axial flow threshing device using EDEM software. The feasibility of the simulation was verified by a bench test. Chai et al. [23] found that the distribution of the threshed rice under a tangential–longitudinal flow threshing device was uneven. A guide device on the return plate was developed to distribute the threshed output evenly and reduce the cleaning loss.
However, the above studies mainly focus on the distribution of grains such as wheat and rice. Few previous studies investigate the distribution of corn threshed mixture. The mixture in the cleaning process of corn combine harvesting is different from that of wheat or rice. The threshed mixture of wheat or rice is mainly composed of grain kernels and stalks. For the corn, the corn ears are threshed. The threshed mixture consists of corn kernels, corn cobs, and corn husks. There are considerable differences in the physical characteristics of components, such as the suspension velocity, friction coefficient, and collision recovery coefficient [24]. Additionally, the structure of corn ears is very different from the structure of wheat and rice. The corn husk and corn cob are located in the outermost and innermost part of the ear, respectively. The distribution location differs with the collision time with the drum. Due to differences in components and their physical properties, the distribution patterns for wheat and rice are not directly applicable to corn. In addition, there were few reports on the particle size distribution of the corn threshed mixture. In the subsequent cleaning process, the particle size provided an important basis for the selection of working parameters, such as the fan speed and screen opening. Therefore, in order to reduce the cleaning impurity rate and loss rate, subdividing the threshed mixture into each component and studying their particle size and weight distributions are highly warranted.
To address the above problem, the purpose of this study is to subdivide the composition of corn threshed mixture and to explore the particle size and weight distribution, respectively. The main work including the novelties of this study are summarized as follows.
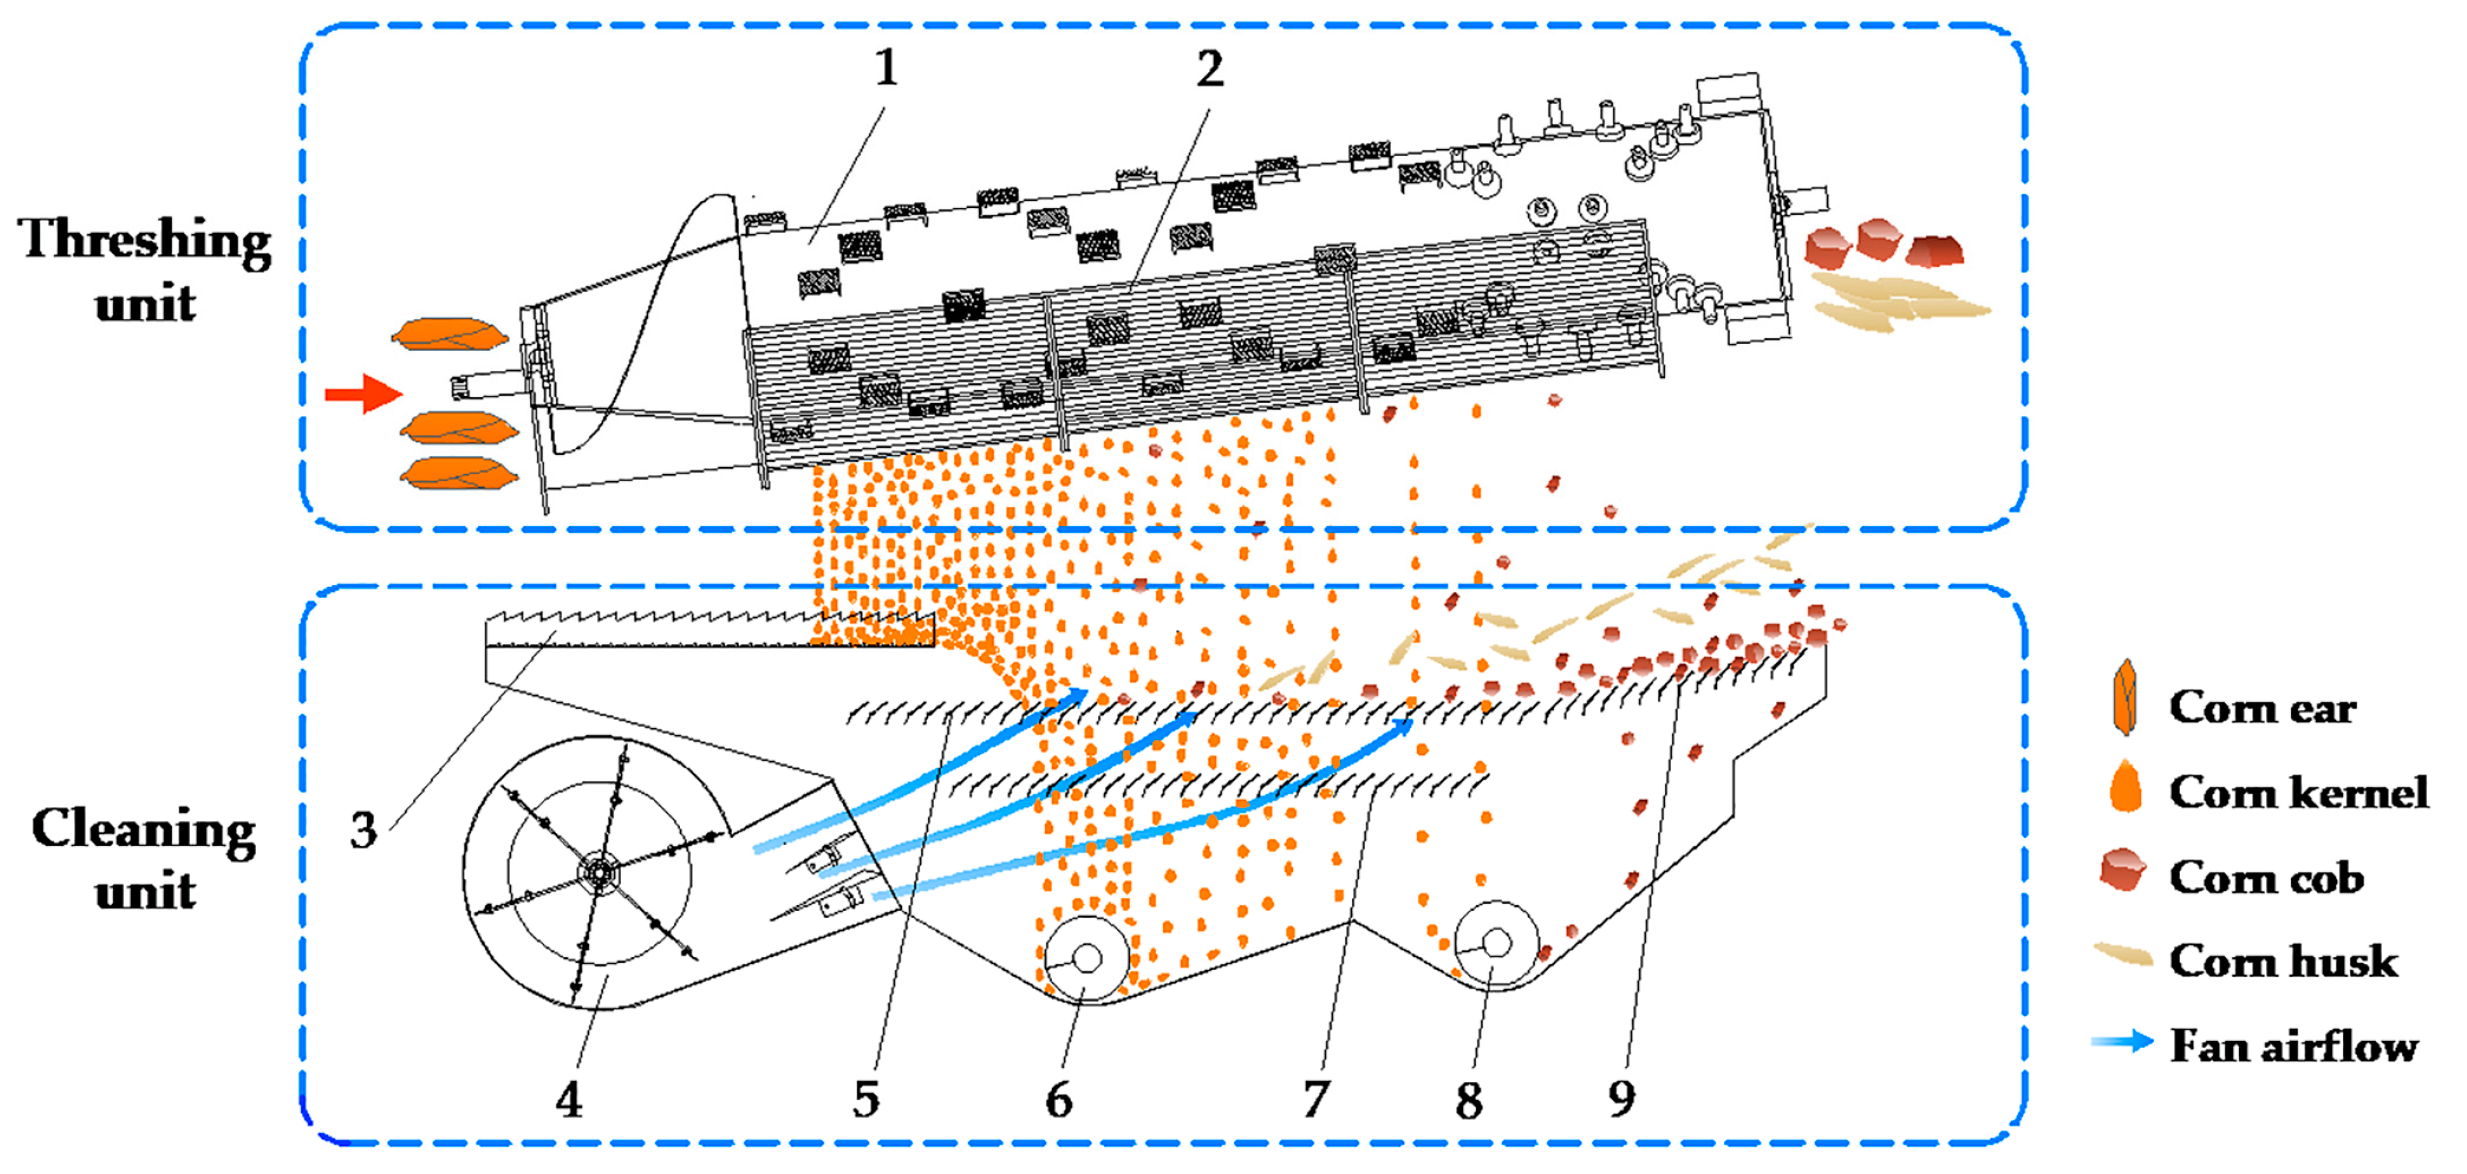
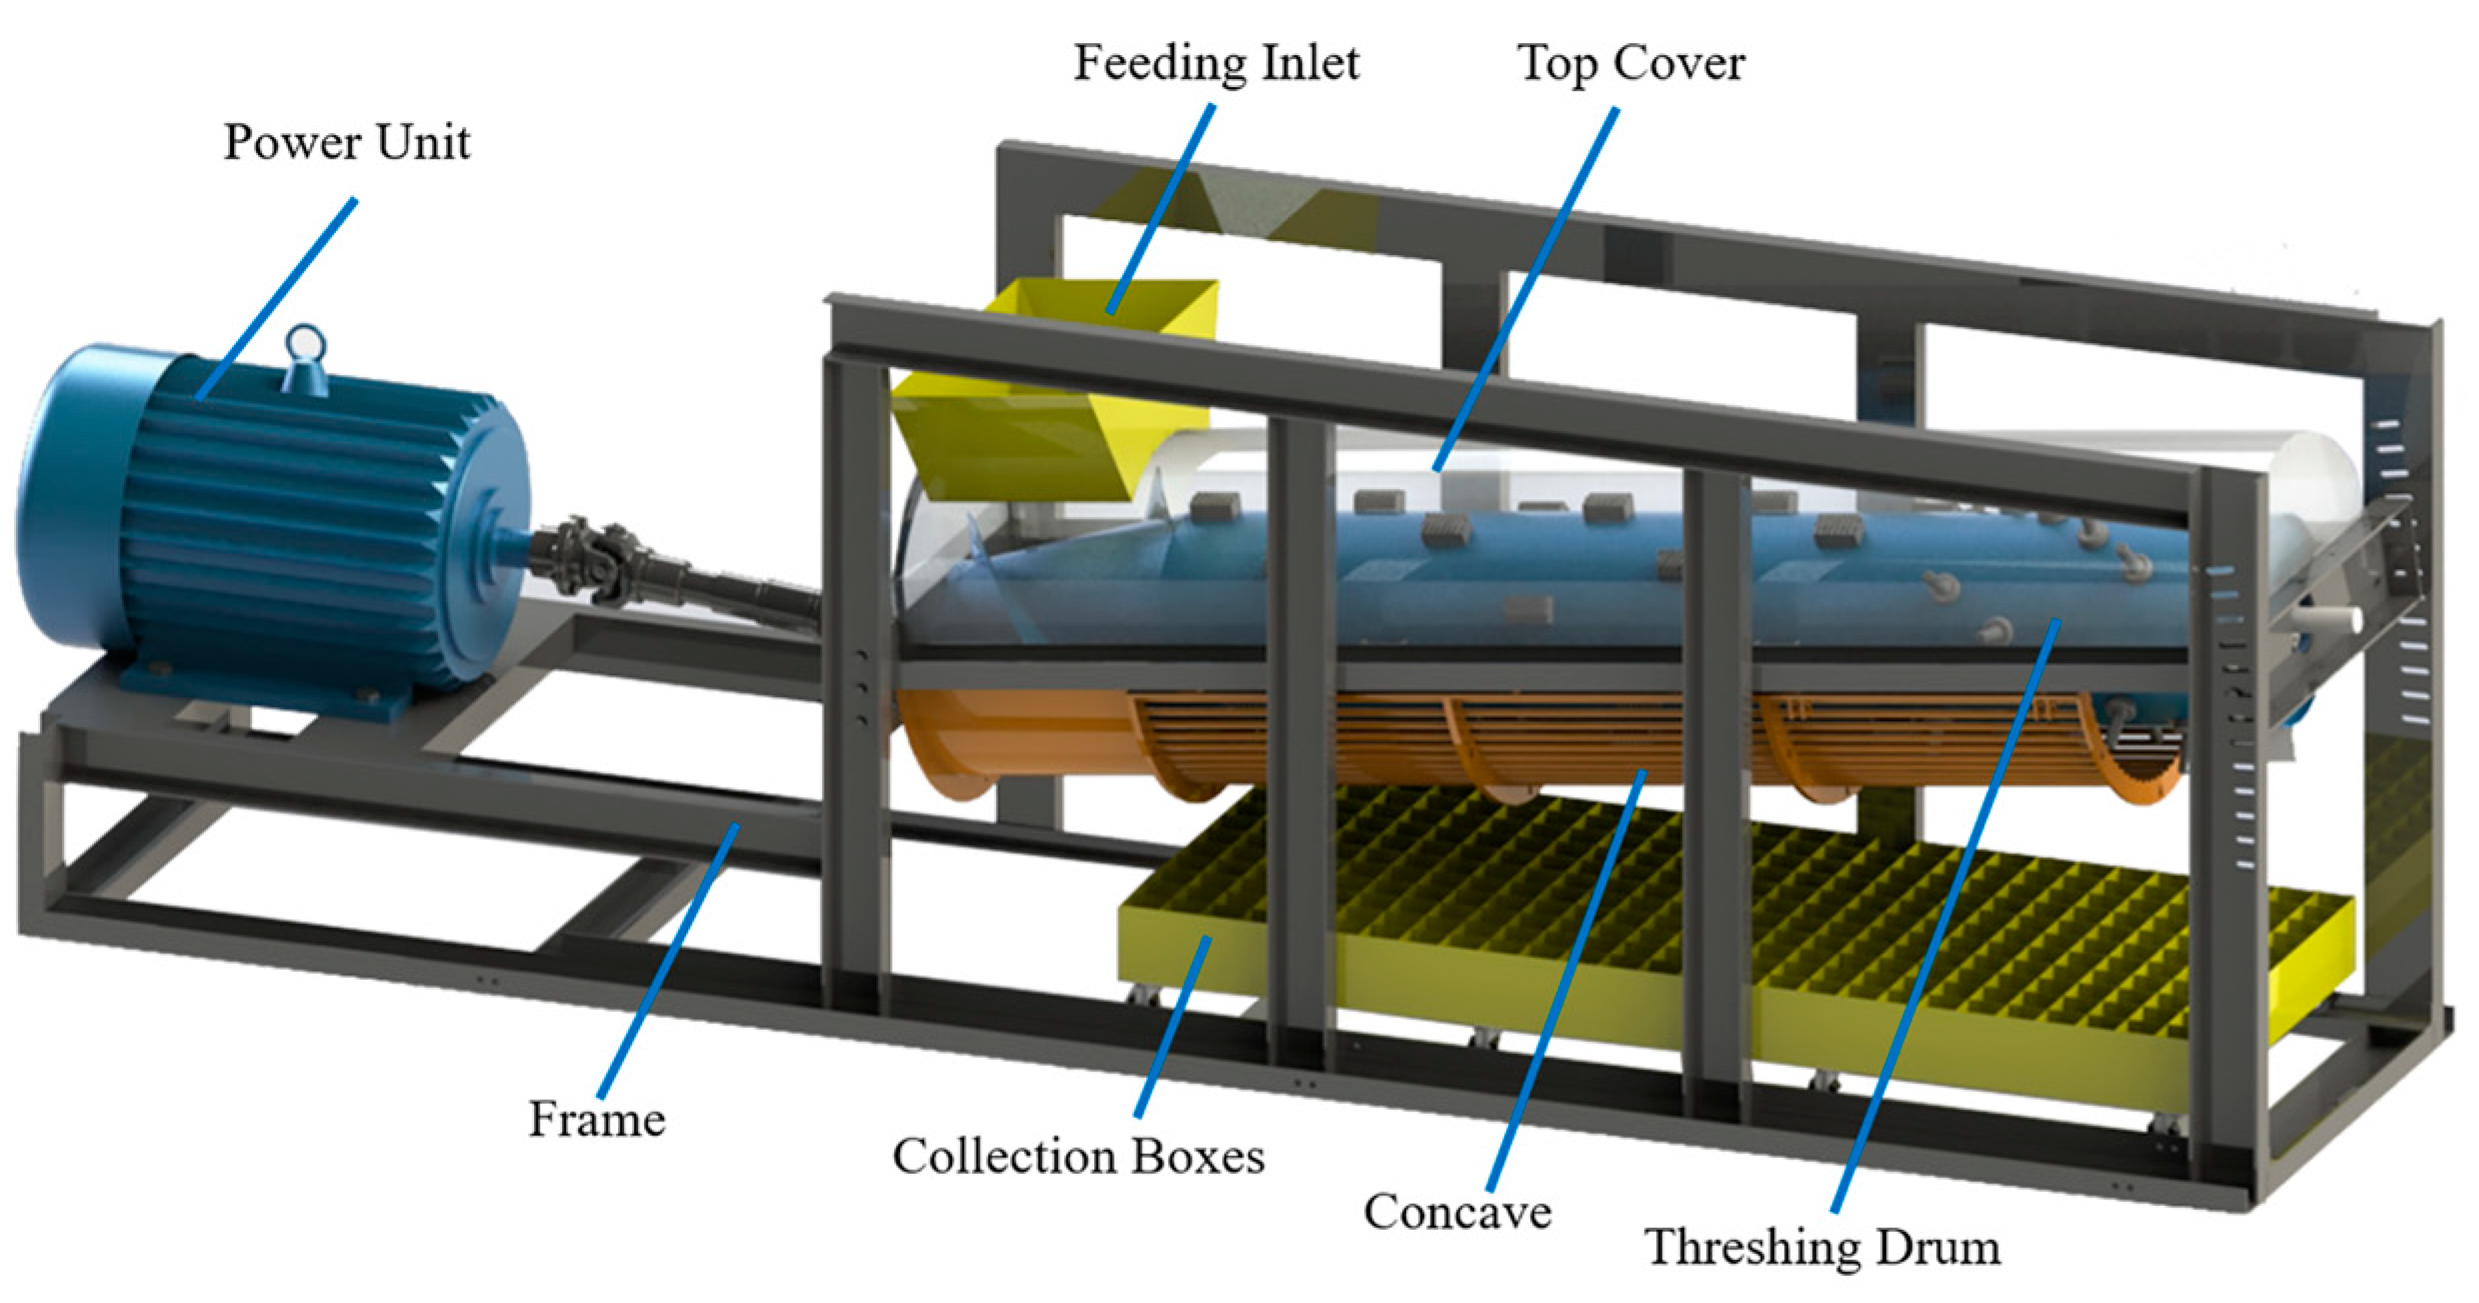
  • A large feed corn threshing test platform was established. Consistent with the corn combine harvester, a longitudinal axial threshing drum was adopted. The process parameter can be adjusted according to the real requirement.
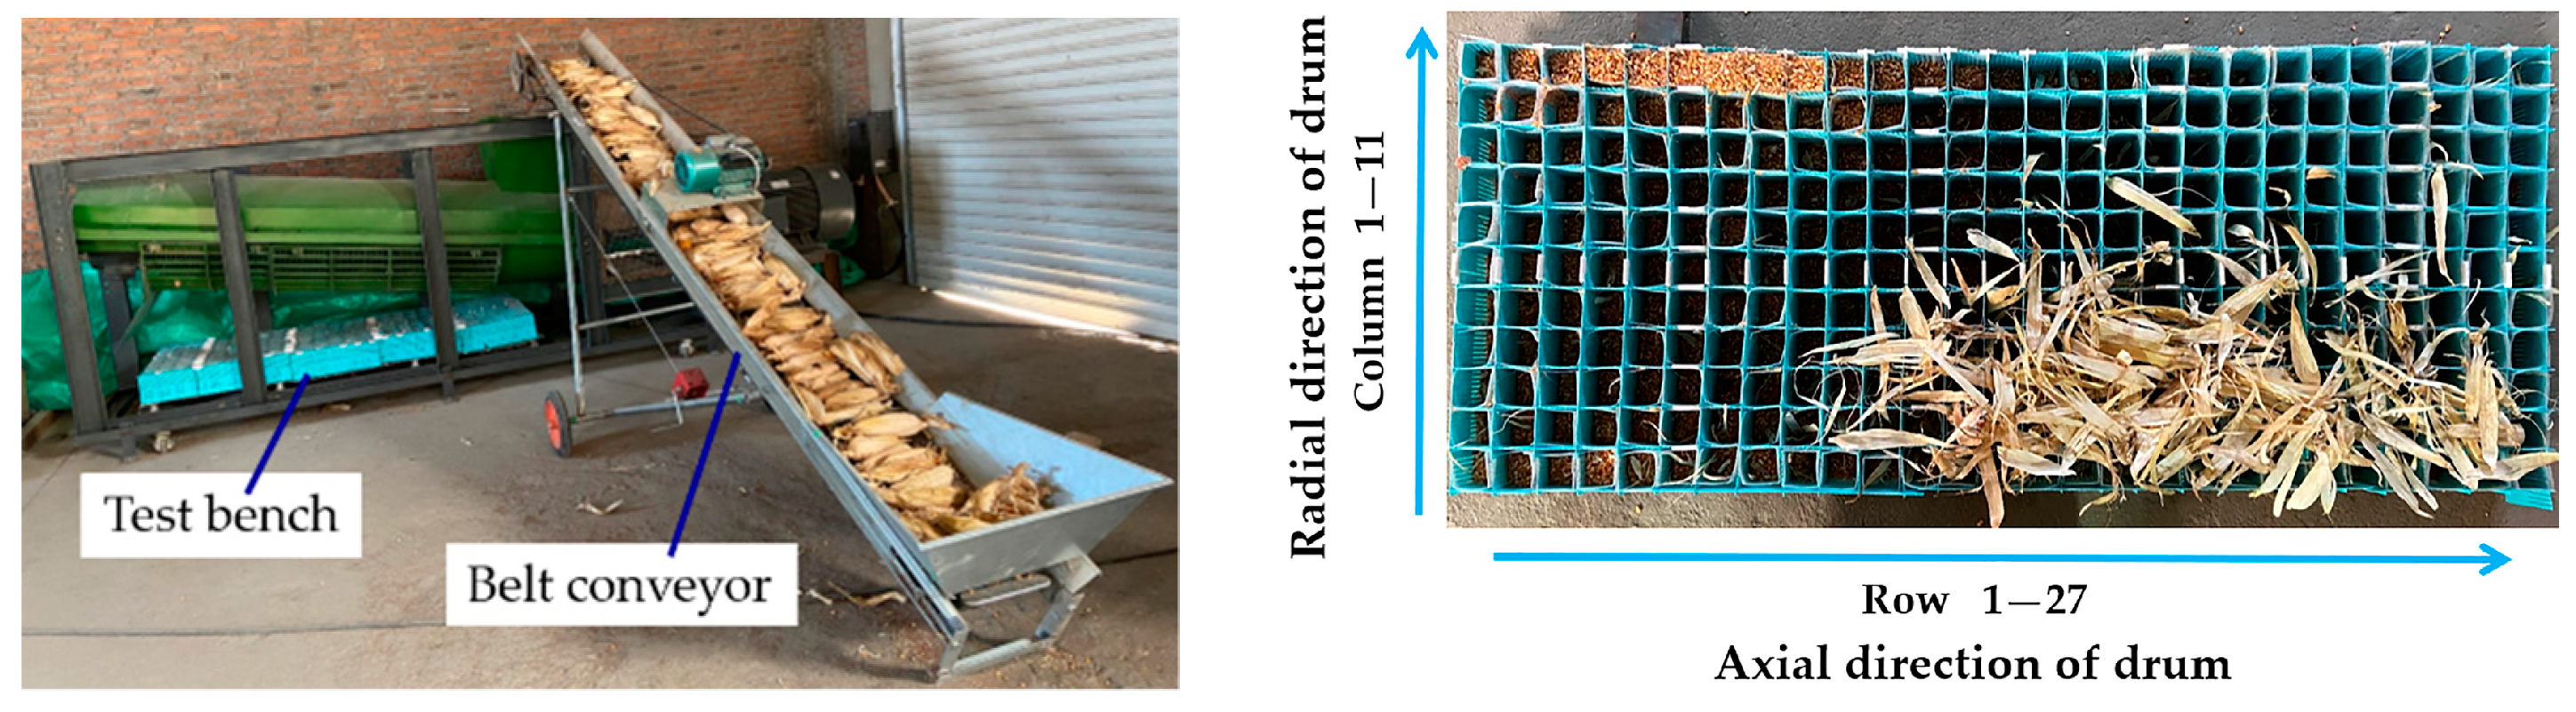
  • The distribution experiment was carried out on this test platform and important data on particle size and weight distribution of the corn threshed mixture were acquired.
  • The components of the corn threshed mixture were conducted. The particle size of each component was analyzed by analysis of variance. The experimental results revealed the significance of process parameters to the particle size distribution.
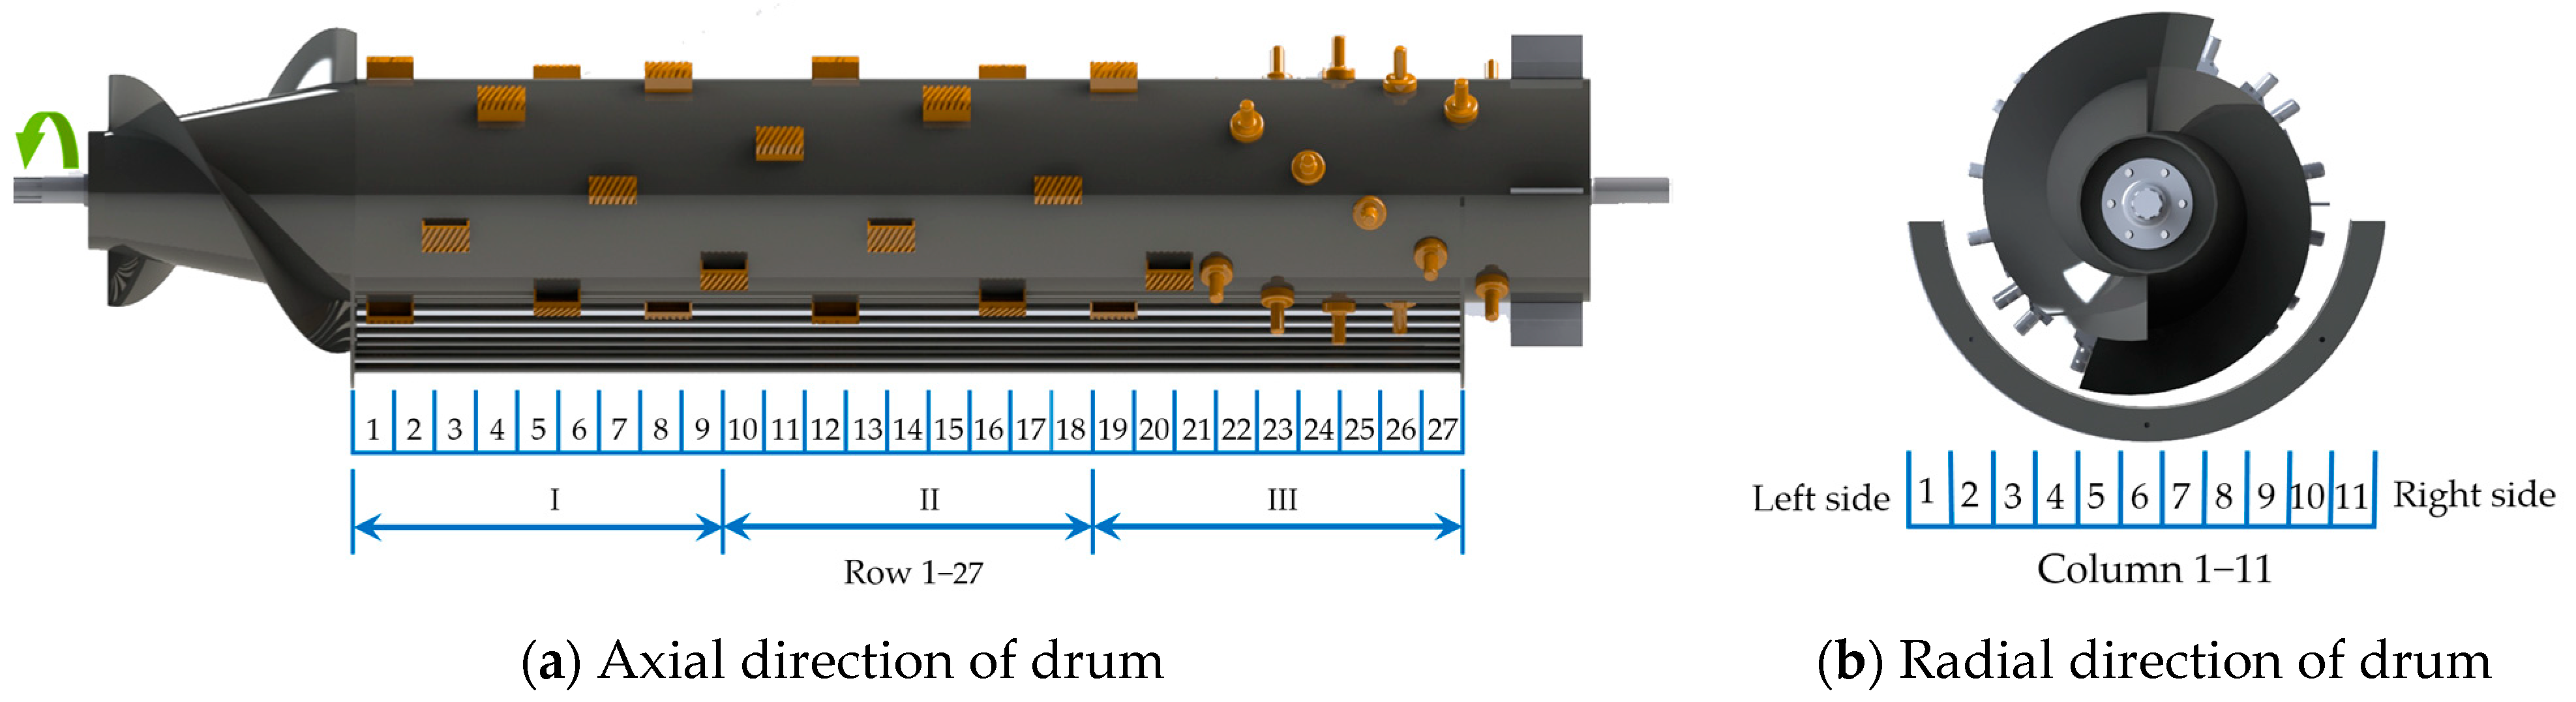
  • The weight distribution patterns of each component (corn kernel, corn cob, and corn husk) along the axial and radial directions were explored. The influences of the drum speed, concave clearance, and feed rate on the weight distribution were analyzed by the single factor method.
The study provides the basis for optimizing the threshing system with a lower threshing loss. Meanwhile, the performance of the cleaning system is sensitive to the mixture distribution. It also provides an important basis for reducing the cleaning load and designing the cleaning structure to achieve optimal cleaning performance.

2. Materials and Methods

In this section, we provide an introduction of the experimental materials and the apparatus used for the threshing distribution study. Then, we present the experimental method.

2.1. Materials

The experiment was conducted in the Agricultural Experimental Base of Jilin University (43°56′ N, 125°14′ E). Corn ears with the husks were picked by hand on 25 October 2021. The total mass of preparative corn ears was 2000 kg. The corn cultivar was Xianyu 335, and the average moisture content was 23.6% (wet basis). To avoid moisture content changes in those ears, the threshing experiment was completed within 5 days after picking. The average temperature ranged from 14.3 to 15.8°C throughout the experimental period.

2.2. Experimental Apparatus

The longitudinal axial threshing drum for corn was used for the distribution experiment, as shown in Figure 2. The threshing test bench mainly consisted of a frame, power unit, feeding inlet, top cover, concave, threshing drum, and collection boxes. Corn ears were fed into the feeding inlet by a conveyor and then were threshed and separated. The corn threshed mixture passed through the concave and dropped into the collection boxes. In each trial, corn ears were placed in order and fed with a constant velocity into the feeding inlet by a belt conveyor (Figure 3). After being threshed, the threshed mixture was collected by the collection boxes (Figure 4). The drum speed was adjusted by an FR500-4T-110G frequency converter (Frecon Electric Co., Ltd., Shenzhen, China). The concave clearance was adjusted with the bolt falling depth. The feed rate was adjusted by changing the conveying speed according to the different requirements.
The arrangement of collection boxes is shown in Figure 4. The 11 columns × 27 rows matrix of 80 × 80 × 150 mm boxes were arranged evenly under the threshing drum. As shown in Figure 3, serial numbers 1–27 were used for the collection boxes from the feeding inlet in the axial direction. The serial numbers 1–11 were used for the collection boxes along the axial direction. For a clear analysis of the results, we divided the axial collection boxes into three parts: I, II, and III.

2.3. Experimental Method

According to the working principle in the threshing drum, factors that affect the distribution and threshing performance include drum speed, concave clearance, and feed rate [25]. The purpose of this study is to explore the effect of the factors on particle size and weight distribution, so that a single factor experimental scheme was determined. The drum speed was determined to be from 300 to 700 r/min, the concave clearance was determined to be from 30 to 50 mm, and the feed rate was determined to range from 5 to 9 kg/s. The single factor experiment was arranged in terms of five values for each factor. The experimental scheme was shown in Table 1.
The experiment was repeated three times. After each trial, the collection boxes were taken out in sequence. Then, the threshed mixture in each box was sorted into 3 categories, corn kernels, corn cobs, and corn husks, as shown in Figure 5. Each component was weighed by an electronic balance (0.01 g accuracy) and measured with a digital caliper (0.01 mm accuracy).

3. Results and Discussion

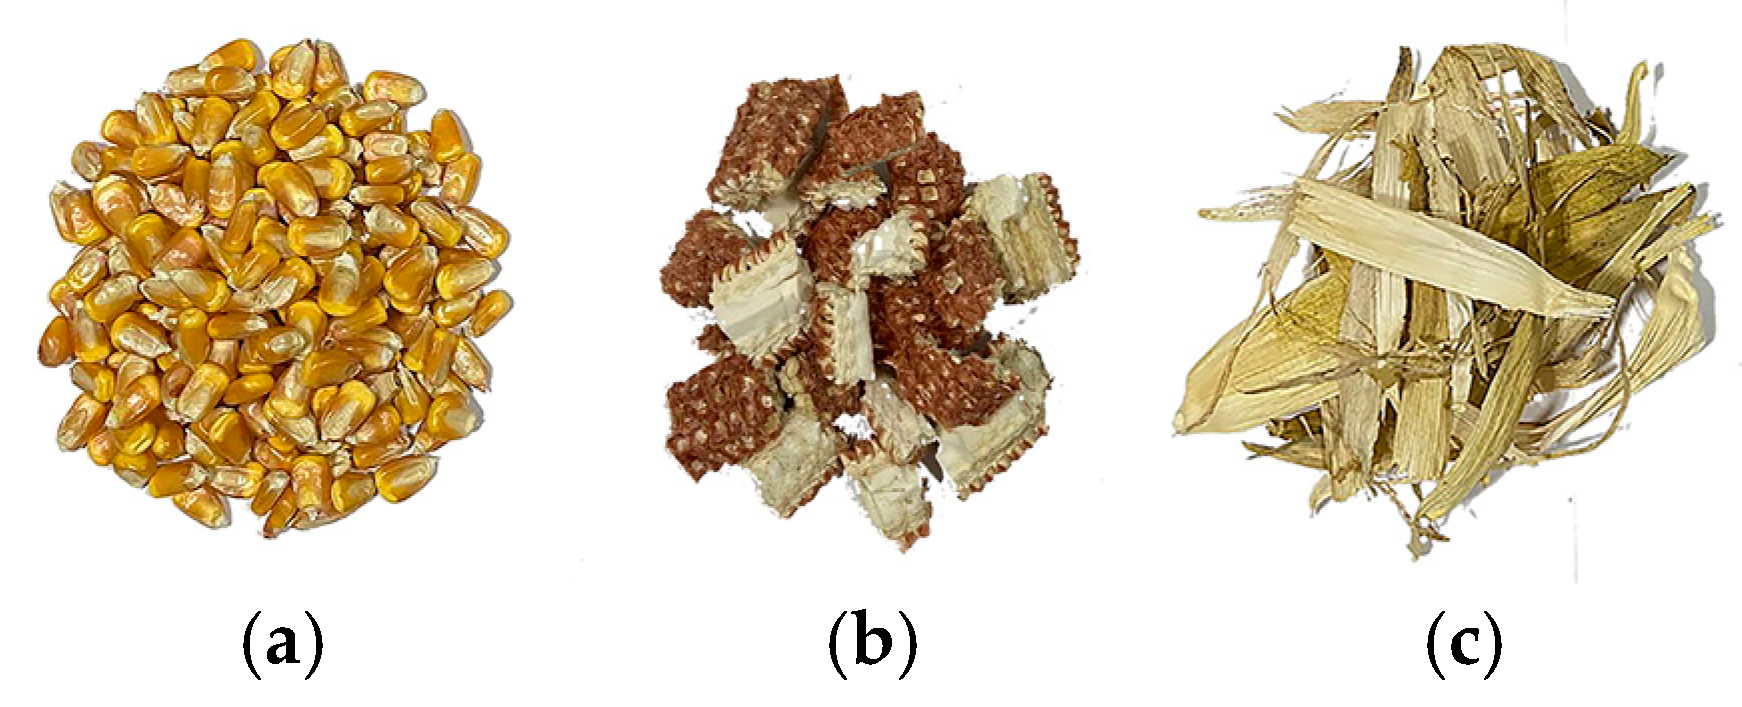
3.1. Particle Size Distribution of Components

In this section, we investigated the effects of three parameters (drum speed, concave clearance, and feed rate) on the particle size distribution of kernels, cobs, and husks.

3.1.1. Particle Size Distribution of Corn Kernels

In the corn threshing, the vast majority of corn kernels do not change in size by process parameter variations. Only a few kernels were broken by the collision [25]. It had little to no effect on the particle size distribution. For that reason, we did not discuss the influence of experimental factors: only the characteristic sizes of the corn kernel were counted in this study. The shapes and particle sizes of corn cultivar Xianyu 335 were measured and analyzed. First, we randomly selected 500 g corn kernels from the threshed mixture. Then corn kernels were divided into horse-toothed, conical, and spherical shapes, accounting for 85.1%, 11.3%, and 3.6%, respectively. Furthermore, their characteristic sizes were defined as W1, W2, Hh, T, HC, DC, HS, and DS, respectively [26,27]. The particle size distribution of the corn kernels (Xianyu 335) is shown in Table 2.

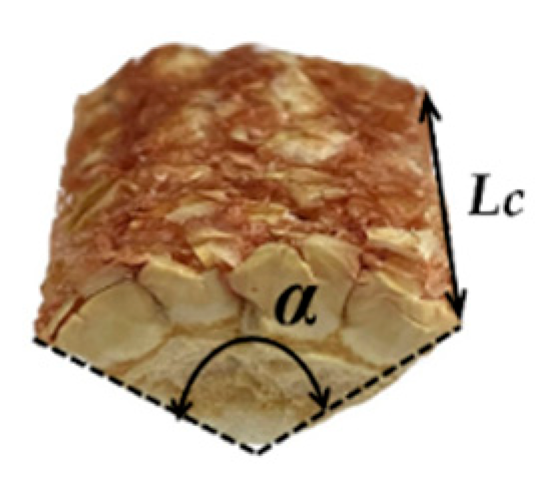
3.1.2. Particle Size Distribution of Corn Cobs

In the corn threshed mixture, the shapes of the corn cobs were mainly incompletely cylindrical and a few completely cylindrical [28]. In Figure 6, the length (Lc) and angle (α) were selected as characteristic sizes to count the particle size [29]. The effect of drum speed on the particle size distribution was analyzed (Figure 7).
Corn cobs were classified into seven classes (0–10 mm, 11–20 mm, 21–30 mm, 31–40 mm, 41–50 mm, 51–60 mm, >60 mm). We defined the corn cob length classes {(0–10 mm), (11–20 mm), (21–30 mm)} as “small length” and the corn cob length classes {(31–40 mm), (41–50 mm) (51–60 mm)} as “medium length”, whereas the corn cob length class (<60 mm) was referred to as “large length” [30,31,32]. As illustrated in Table 3 and Table 4, drum speed and concave clearance had a significant effect on the length (Lc) and angle (α) of corn cob broken (p < 0.01). However, feed rate had no effect on the length (Lc) of two classes (11–20 mm, 31–40 mm) and angle (α) of corn cob broken (p > 0.01). In the following paragraphs, the effects of each factor on the particle size distribution of corn cob were comprehensively discussed.
In Figure 7a, we found that corn cobs of all lengths increased rapidly with drum speed; the number of corn cob was amplified by as much as ten times. Among them, the “small length” proportion increased from 76.2% to 94.6%. The increase in the collision between the cobs and drum was the primary cause of producing more fine cob particles. Higher drum speed creates more collisions and aggravated fractures in corn cobs. For “medium length”, the number increased from 32 to 112. The reason is attributed to some medium–length corn cobs being cut into smaller particles. Comparing the angle (Figure 7b), it is apparent that a smaller angle of the corn cob occurs at a higher speed. Thus, this result confirms the significant influence of drum speed on corn cob crushing.
Figure 7c,d shows the particle size distribution of corn cobs under different concave clearances. In terms of the amount of “small length” corn cobs (Figure 7c), there was an apparent decrease as concave clearance increased. The proportion of 0–10 mm cobs fell from 41.8% to 26.6%, while the proportion of 10–20 mm tended to increase by 20.1%. It indicates that, with a large concave clearance, there is less contact area. The collision and friction decreased, resulting in a decrease in the overall number of “small length” cobs. However, the collision and friction played a limited role. Fewer corn cobs became the smallest particles. Lc was concentrated in the 21–30 mm, explaining the rise in proportion. For “medium length”, the number kept dropping from 100 to 56. For “large length”, we did not find any quantitative difference. As shown in Figure 7d, the number of corn cobs at small angles (0–45°) declined rapidly. Corn cobs at other angles also had a slow downward trend.
The particle size distribution of corn cobs with a change in feed rate is shown in Figure 7e,f. In general, the number of corn cobs increased with the feed rate. However, analysis of variance showed no significant difference under different feed rates. When the feed rate was slow (5 kg/s), there were more collisions, leading to more broken corn cobs. Nevertheless, when the feed rate increased, corn ears were threshed insufficiently, resulting in a decrease in the number of broken cobs. Likewise, as shown in Figure 8b, we also noticed that the broken angle was increasing with the feed rate. Thus, the increased number of corn cobs—due to increased feed rate—was partially offset by the decrease due to breaking. The number and proportion of “small length” cobs showed a downward trend, while the “medium length” and “large length” showed a clear rising tendency. Combined with the weight distribution analysis, the weights of “medium length” and “large length” were dominant, which also helps explain why the total weight was still increasing.

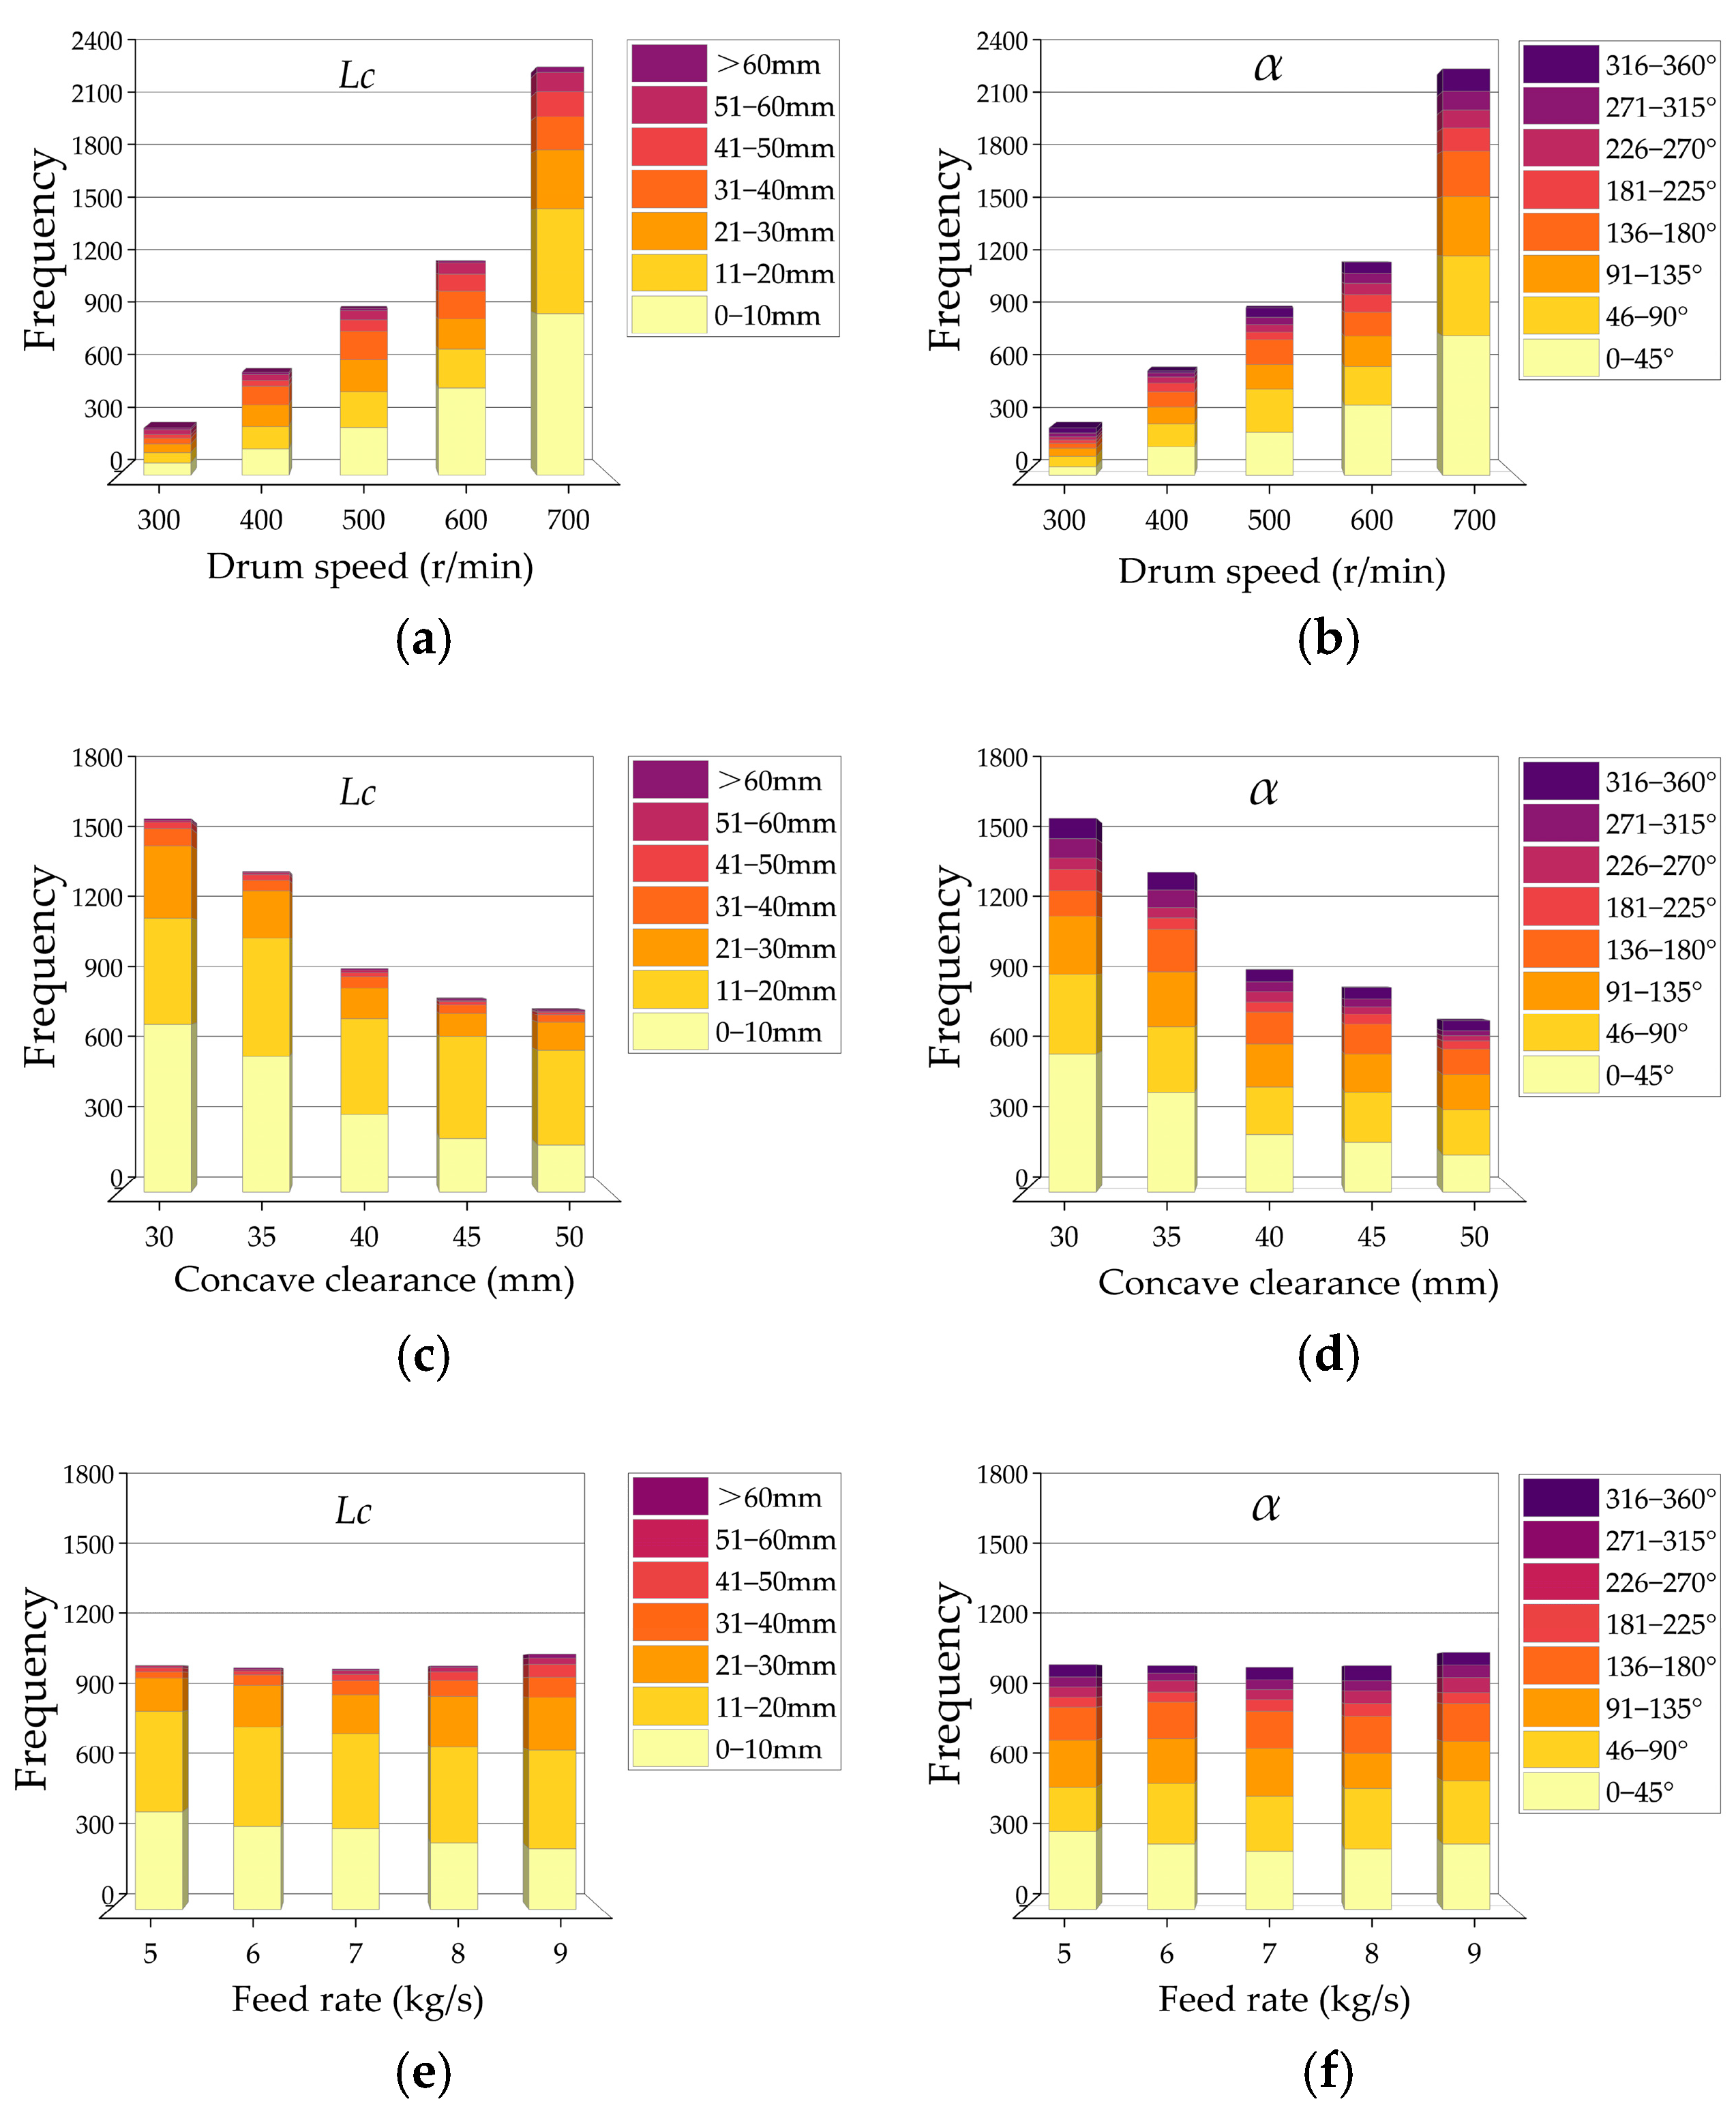
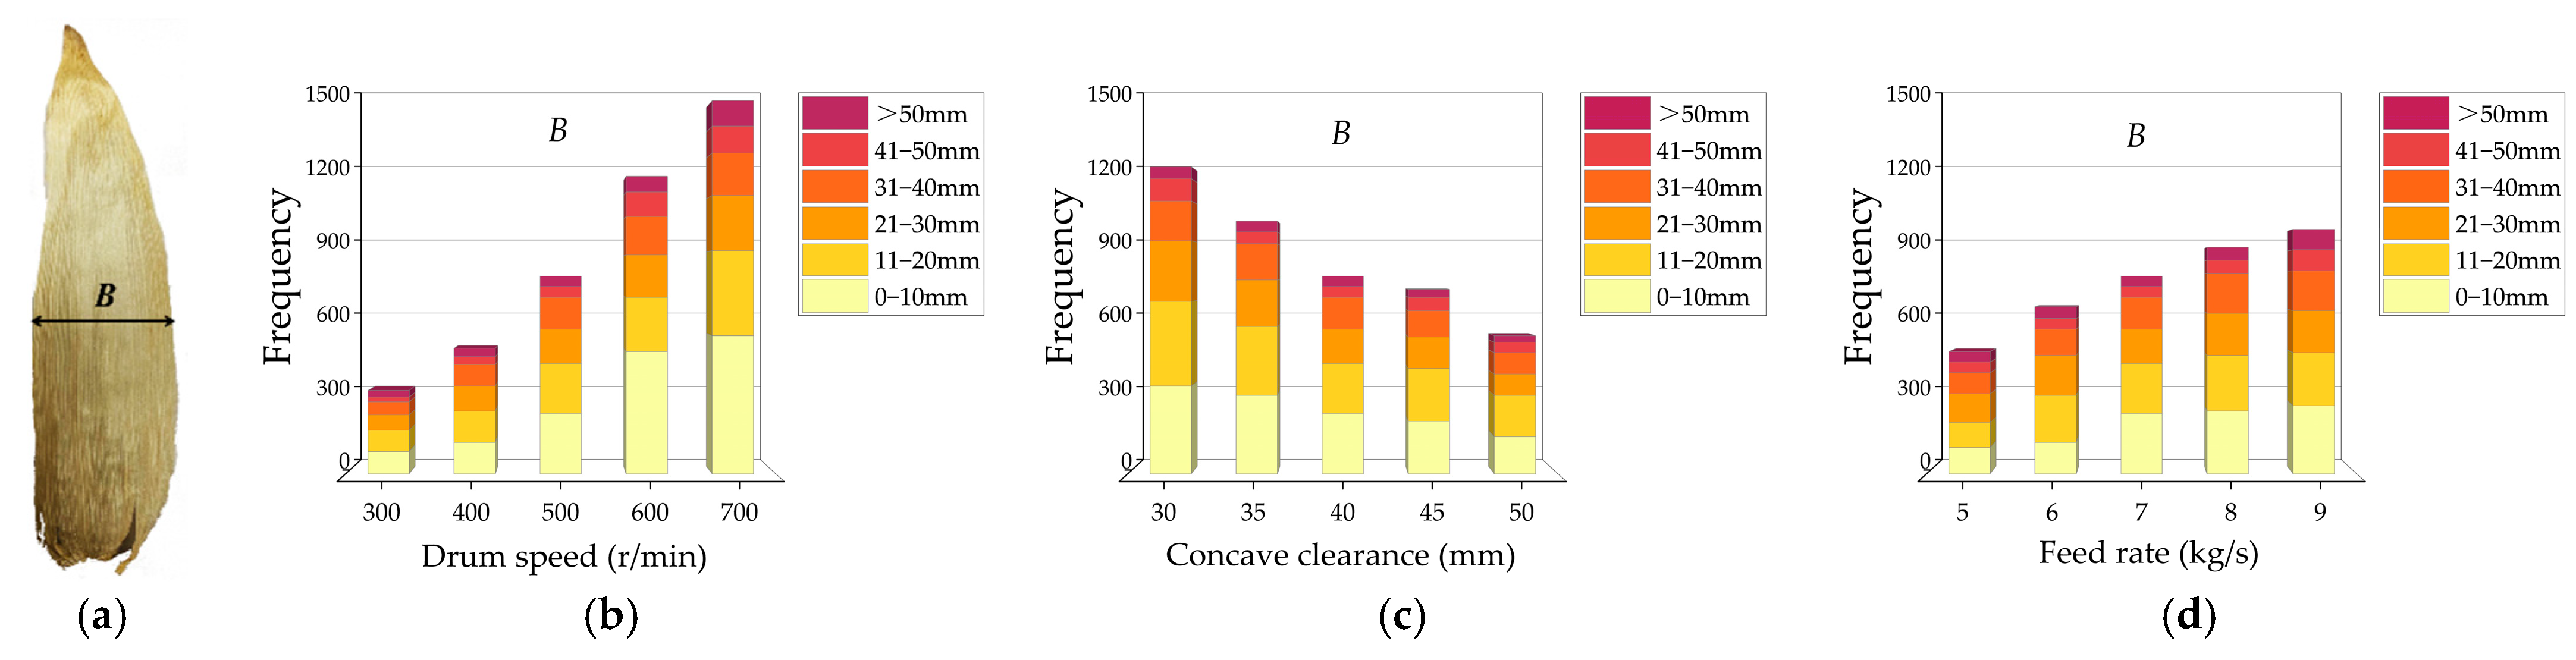
3.1.3. Particle Size Distribution of Corn Husks

The tensile strength in longitudinal corn husks was more than nine times larger than the transverse [33]. Further, in a threshing experiment, we also found a few longitudinal fractures of the corn husks. Most of the husks were torn along the transverse in varying degrees [34,35]. Therefore, we only selected the width (B) to elaborate on the influence of experimental factors on the size distribution of corn husks (Figure 8a). Table 5 shows the variance for the particle size distribution of corn husks. The results indicated the drum speed, concave clearance, and feed rate had a significant effect on the width (B).

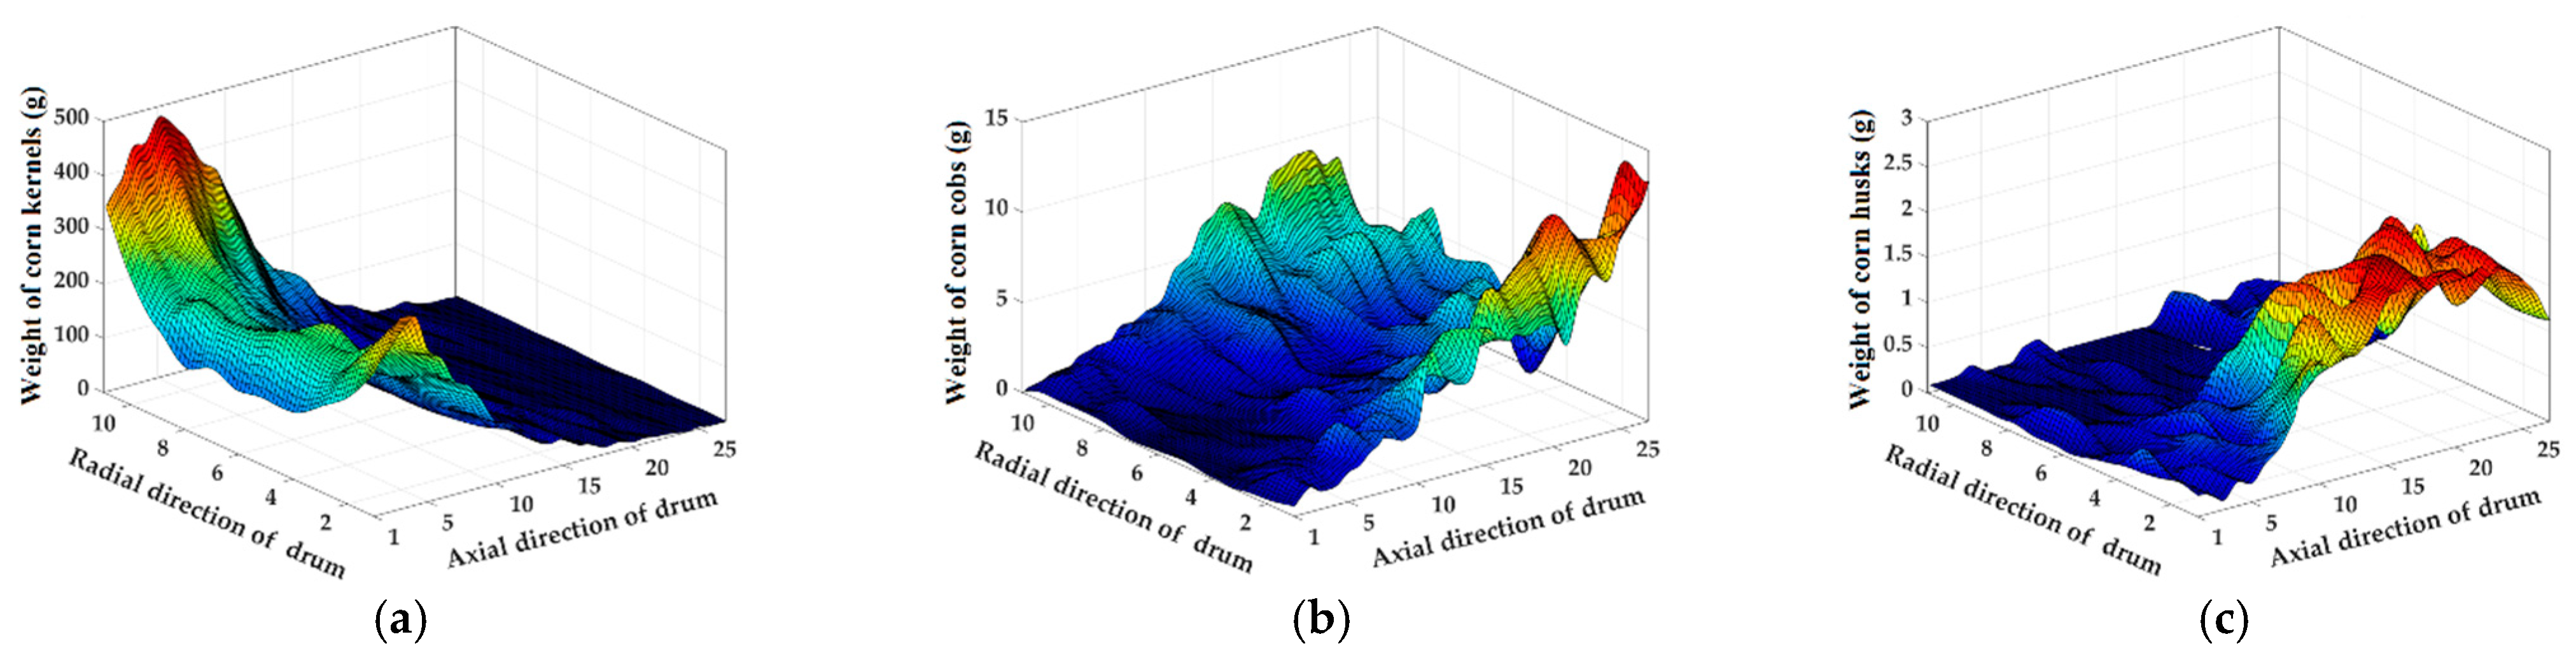
3.2. Weight Distribution of Components

To clearly express the distribution pattern, the 3D distribution of the weight is shown in Figure 8. Next, we investigated the influence of test factors on the weight distribution of each component one by one.
As shown in Figure 9a, the weight distribution pattern of corn kernels was more like a “skateboard”. There was more on both sides and less in the middle in the radial direction, that first increased and then decreased in the axial direction. The corn cobs’ weight distribution increased continuously along the axial direction and was greater on both sides and lower in the middle in the radial direction (Figure 9b). The weight distribution pattern of corn husks was a clear left posterior distribution. Figure 9c showed that the weight of corn husks was mainly concentrated in rows 11–27 and columns 1–5. More husks gathered on the left side of the collection boxes.

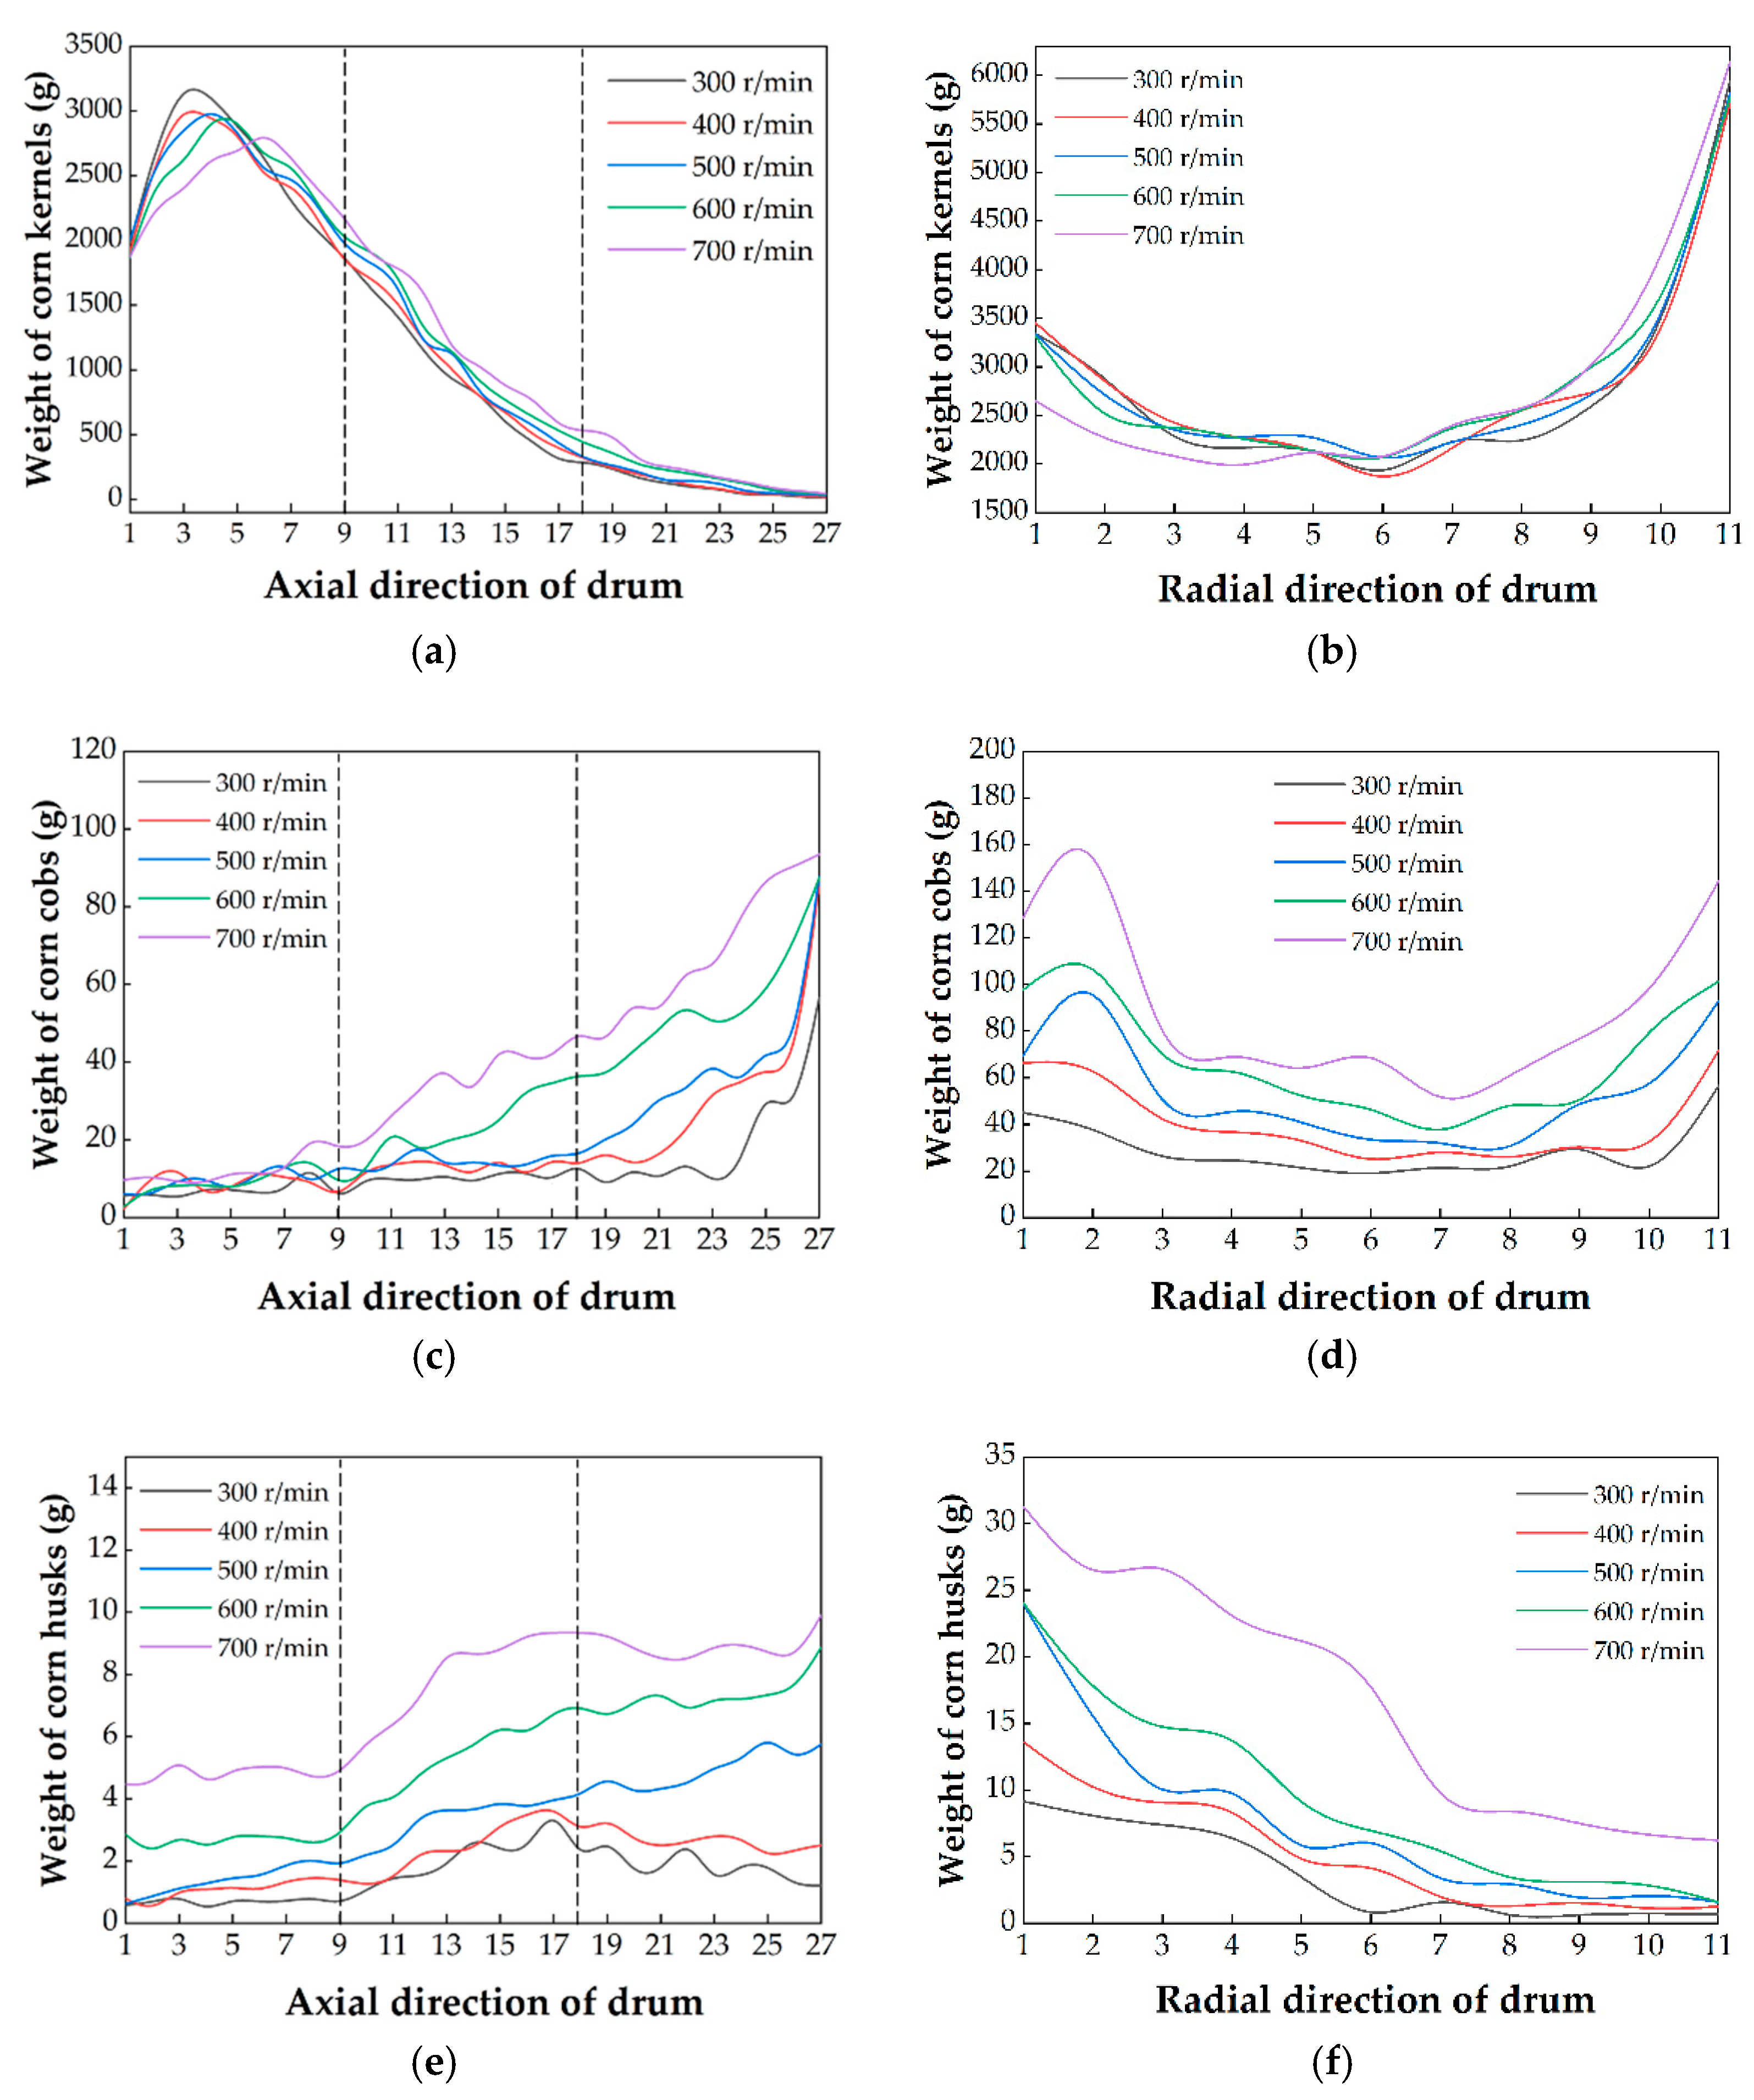
3.2.1. Effects of Drum Speed on the Weight Distribution of Components

The drum speed determines the frequency of collision and velocity, which has an important influence on the distribution of the threshed mixture [36]. The weight distribution with different drum speeds is shown in Figure 10.
As shown in Figure 10a, the weight of corn kernels was first increased from row 1 to rows 2–6, and then decreased to the end in the axial direction. The weight reached the highest value at row 3 when the drum speed was 300 r/min. Meanwhile, the peak weight shifted to row 6 when the drum speed increased to 700 r/min. This shift was due to changes in the linear velocity caused by the drum speed. The mixture moved backward faster with higher linear velocity. In the radial direction, the weight on the left and right sides was always greater than that in the middle (Figure 10b). The greatest kernel weight was in column 11, while the lowest weight was in column 6. In particular, the weight in column 11 was about 2.5 times that in column 6. Thus, the weight presented prominent accumulation on both sides, especially on the right. Indeed, the centrifugal force generated radial acceleration. Counterclockwise rotation of the drum accounted for this uneven distribution. With the increased drum speed, the weights of the top three columns (9–11) increased, while the weight of the remaining columns decreased. Because of the increased centrifugal force acting on kernels, they tended to fly out to the right. The total weight of corn kernel increased continuously in the trial. The main reason for this was the drum’s increased frequency of strikes to corn ears. There were more kernels to be separated from ears and passed through the concave. Furthermore, the first 18 rows of kernels accounted for more than 92% of the total weight, indicating that the corn kernel separation was completed in two-thirds of the drum.
Corn cob is an important impurity in the mixture. As illustrated in Figure 10c, the weight of corn cobs increased continuously in the axial direction. Among these, rows 1–9 contained a few corn cobs. The cobs were mainly concentrated after the 10th column, which presented a rapid growth trend. According to the distribution of kernels, we knew that corn ears were rapidly threshed in rows 1–9. In this section, the drum mainly collided with the corn kernels, with 80% of kernels falling off the corn cob. Then, these corn cobs were exposed. In rows 10–27, collision mainly occurred between the drum and corn cobs, which caused cobs to break and fall. High drum speed means that the probability of collision is high, resulting in the relative increase in broken corn cobs. The total weight of the corn cob increased by 624 g as the drum speed increased from 300 to 700 r/min. This result corresponded to the number of corn cobs in Figure 7a. For the distribution in the radial direction, as shown in Figure 10d, the weight on the left and right sides was higher than in the middle. The higher weight was seen in the left column 2 and right column 11. The corn cobs flew out to the sides under centrifugal force. With the increased drum speed, over 80% of corn cobs were assigned to the right and left side distribution. This suggests that centrifugal force increased the accumulation of corn cobs on both sides. Additionally, the gradual increase in total weight also meant that the uniformity was poor. These conditions did not show any benefit for cleaning.
In Figure 10e, the weight of corn husks increased continuously in the axial direction. Indeed, most husks were peeled off the ears in the first nine rows. However, the corn husks were broad and unable to get through the concave at this stage. In rows 10–27, they were crushed under impact and fell constantly. Therefore, the weight showed a sharp upward trend. The total weight of corn husks increased greatly with the increase in drum speed. This was due to the increase in the frequency of collisions between the drum and husks. Along the radial direction (Figure 10f), corn husks mainly gathered in the left 1–6 columns. The reason was that some husks did not pass through the top cover to the right side due to excessive volumes. As the drum speed increased, the husk weight in columns 1–6 increased. The more serious accumulation is on the left side. Especially, the weight of the husks increased rapidly when the drum speed was 700 r/min. Thus, it added to the difficulty to reduce the impurities rate in the cleaning process.
Overall, the distribution of corn kernels, corn cob, and corn husks became more uneven with the increase in drum speed. The results also showed the weight of impurities (corn cobs and corn leaves) increased. Undoubtedly, both exacerbated the load of subsequent cleaning. In addition, more broken kernels were in the collection box when the drum speed was high. This result was the same as the conclusion of Fu’s study [37]. Thus, the drum speed can be reduced to achieve less impurity and broken kernels when threshing. However, we found more lost kernels at the end of the drum as the drum speed decreased. To ensure less kernel loss, the drum speed should not be too low. Qu et al. [38] tested the drum speed in a longitudinal axial flow threshing and separating device. The results showed the optimal drum speed was 254–486 r/min when the feed rate was 8 kg/s. Therefore, considering the breakage and loss of kernels, the drum speed of 400 r/min was superior.

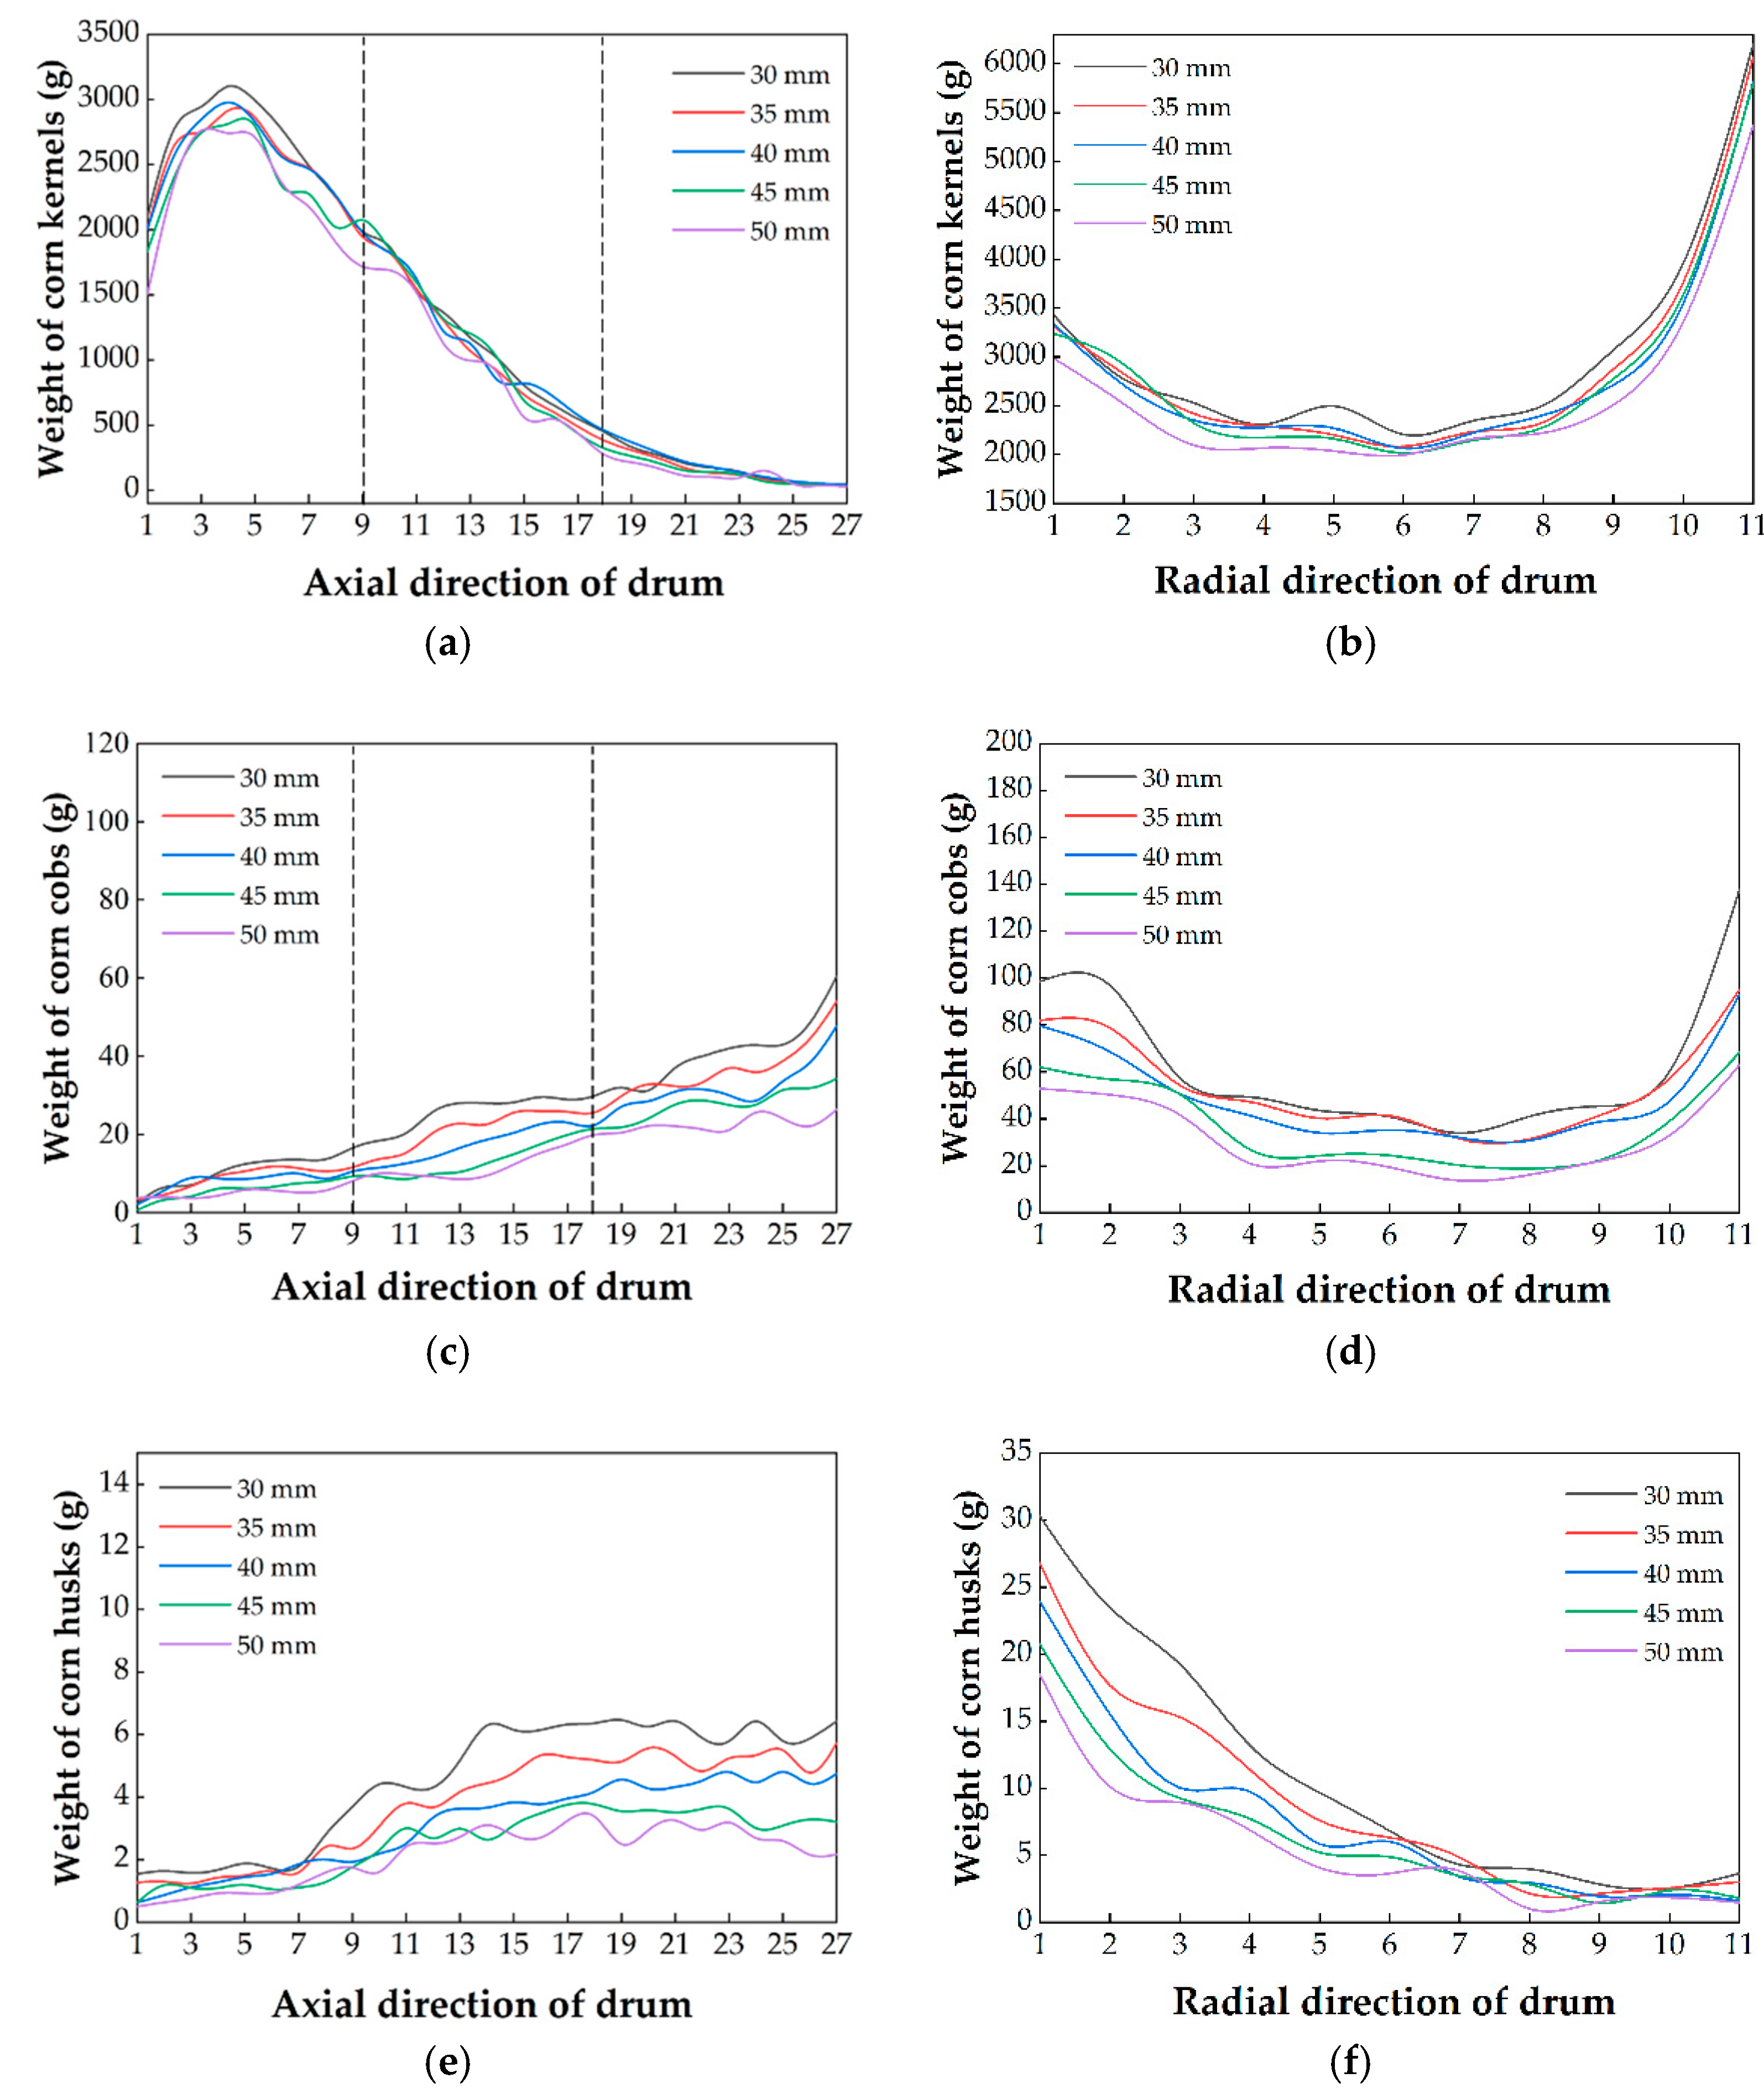
3.2.2. Effects of Concave Clearance on the Weight Distribution of Components

The concave clearance determines the threshing space, affecting the accumulation thickness of corn ears [39]. The influences of concave clearances on weight distribution are shown in Figure 11.
Figure 11a shows that the weight of corn kernels decreased and then increased. The basic tendency was the same under five concave clearances. Since the threshing space became larger when the concave clearance increased, the collision frequency of the drum to corn ears decreased. The weight in each column was constantly declining. The total mass decreased by 896 g while the concave clearance increased from 30 to 50 mm. Some kernels on the ear were transported without being threshed, which caused a large kernel loss. Because of the same reason, the weight in each column was constantly declining, which can be seen in Figure 11b. In the radial direction, as shown in Figure 11b, with a small concave clearance, more ears were moved on the right side under the rubbing action. As the concave clearance increased, the loose flow of ears in the threshing space made it easier for kernels to fall through the concave. Hence, the radial distribution of the mixture tended to be uniform.
As illustrated in Figure 11c, the weight of corn cobs increased continuously in the axial direction. As mentioned previously, corn cobs collided with the drum after corn kernels were threshed. Therefore, there was an obvious acceleration in the increase in weight from row 10 to row 27. The weight trend was similar at 5 concave clearances. With the concave clearance increased, corn cob weight was reduced. This was due to the drum hitting the cob less frequently. In the radial direction, the weight decreased first and subsequently increased, as shown in 10d. When the concave clearance increased, the weight distribution of cobs tended to be uniform in the radial direction. One reason for this was that the loose distribution of corn cobs gathered less on both sides under the action of rubbing. Another reason was that the total weight of broken corn cobs decreased. In addition, compared with the drum speed, the concave clearance had a moderate change in the corn cob weight.
Figure 11e shows that the corn husk’s weight increased continuously in the axial direction. The cause was the same as that of drum speed (Figure 10e). Figure 11f shows the corn husks also piled up on the left along the radial direction. With the concave clearance increased, the unevenness of husks in both the axial and radial directions was reduced. Meanwhile, the total weight of husks decreased significantly. This was due to reduced contact area between drum and husks, resulting in fewer broken husks.
Compared with the results of the drum speed, the effect of concave clearance on weight distribution was relatively weak. The increase in concave clearance weakened the phenomenon of unilateral accumulation to an extent. Additionally, it has a positive influence on the uniform distribution in the radial direction. Moreover, the impurities in the corn threshing mixture had less weight, which was conducive to cleaning. However, it caused an increase in the kernel loss at the end of the drum [36,39]. With careful consideration, the optimal working parameter of the concave clearance was selected as 40 mm.

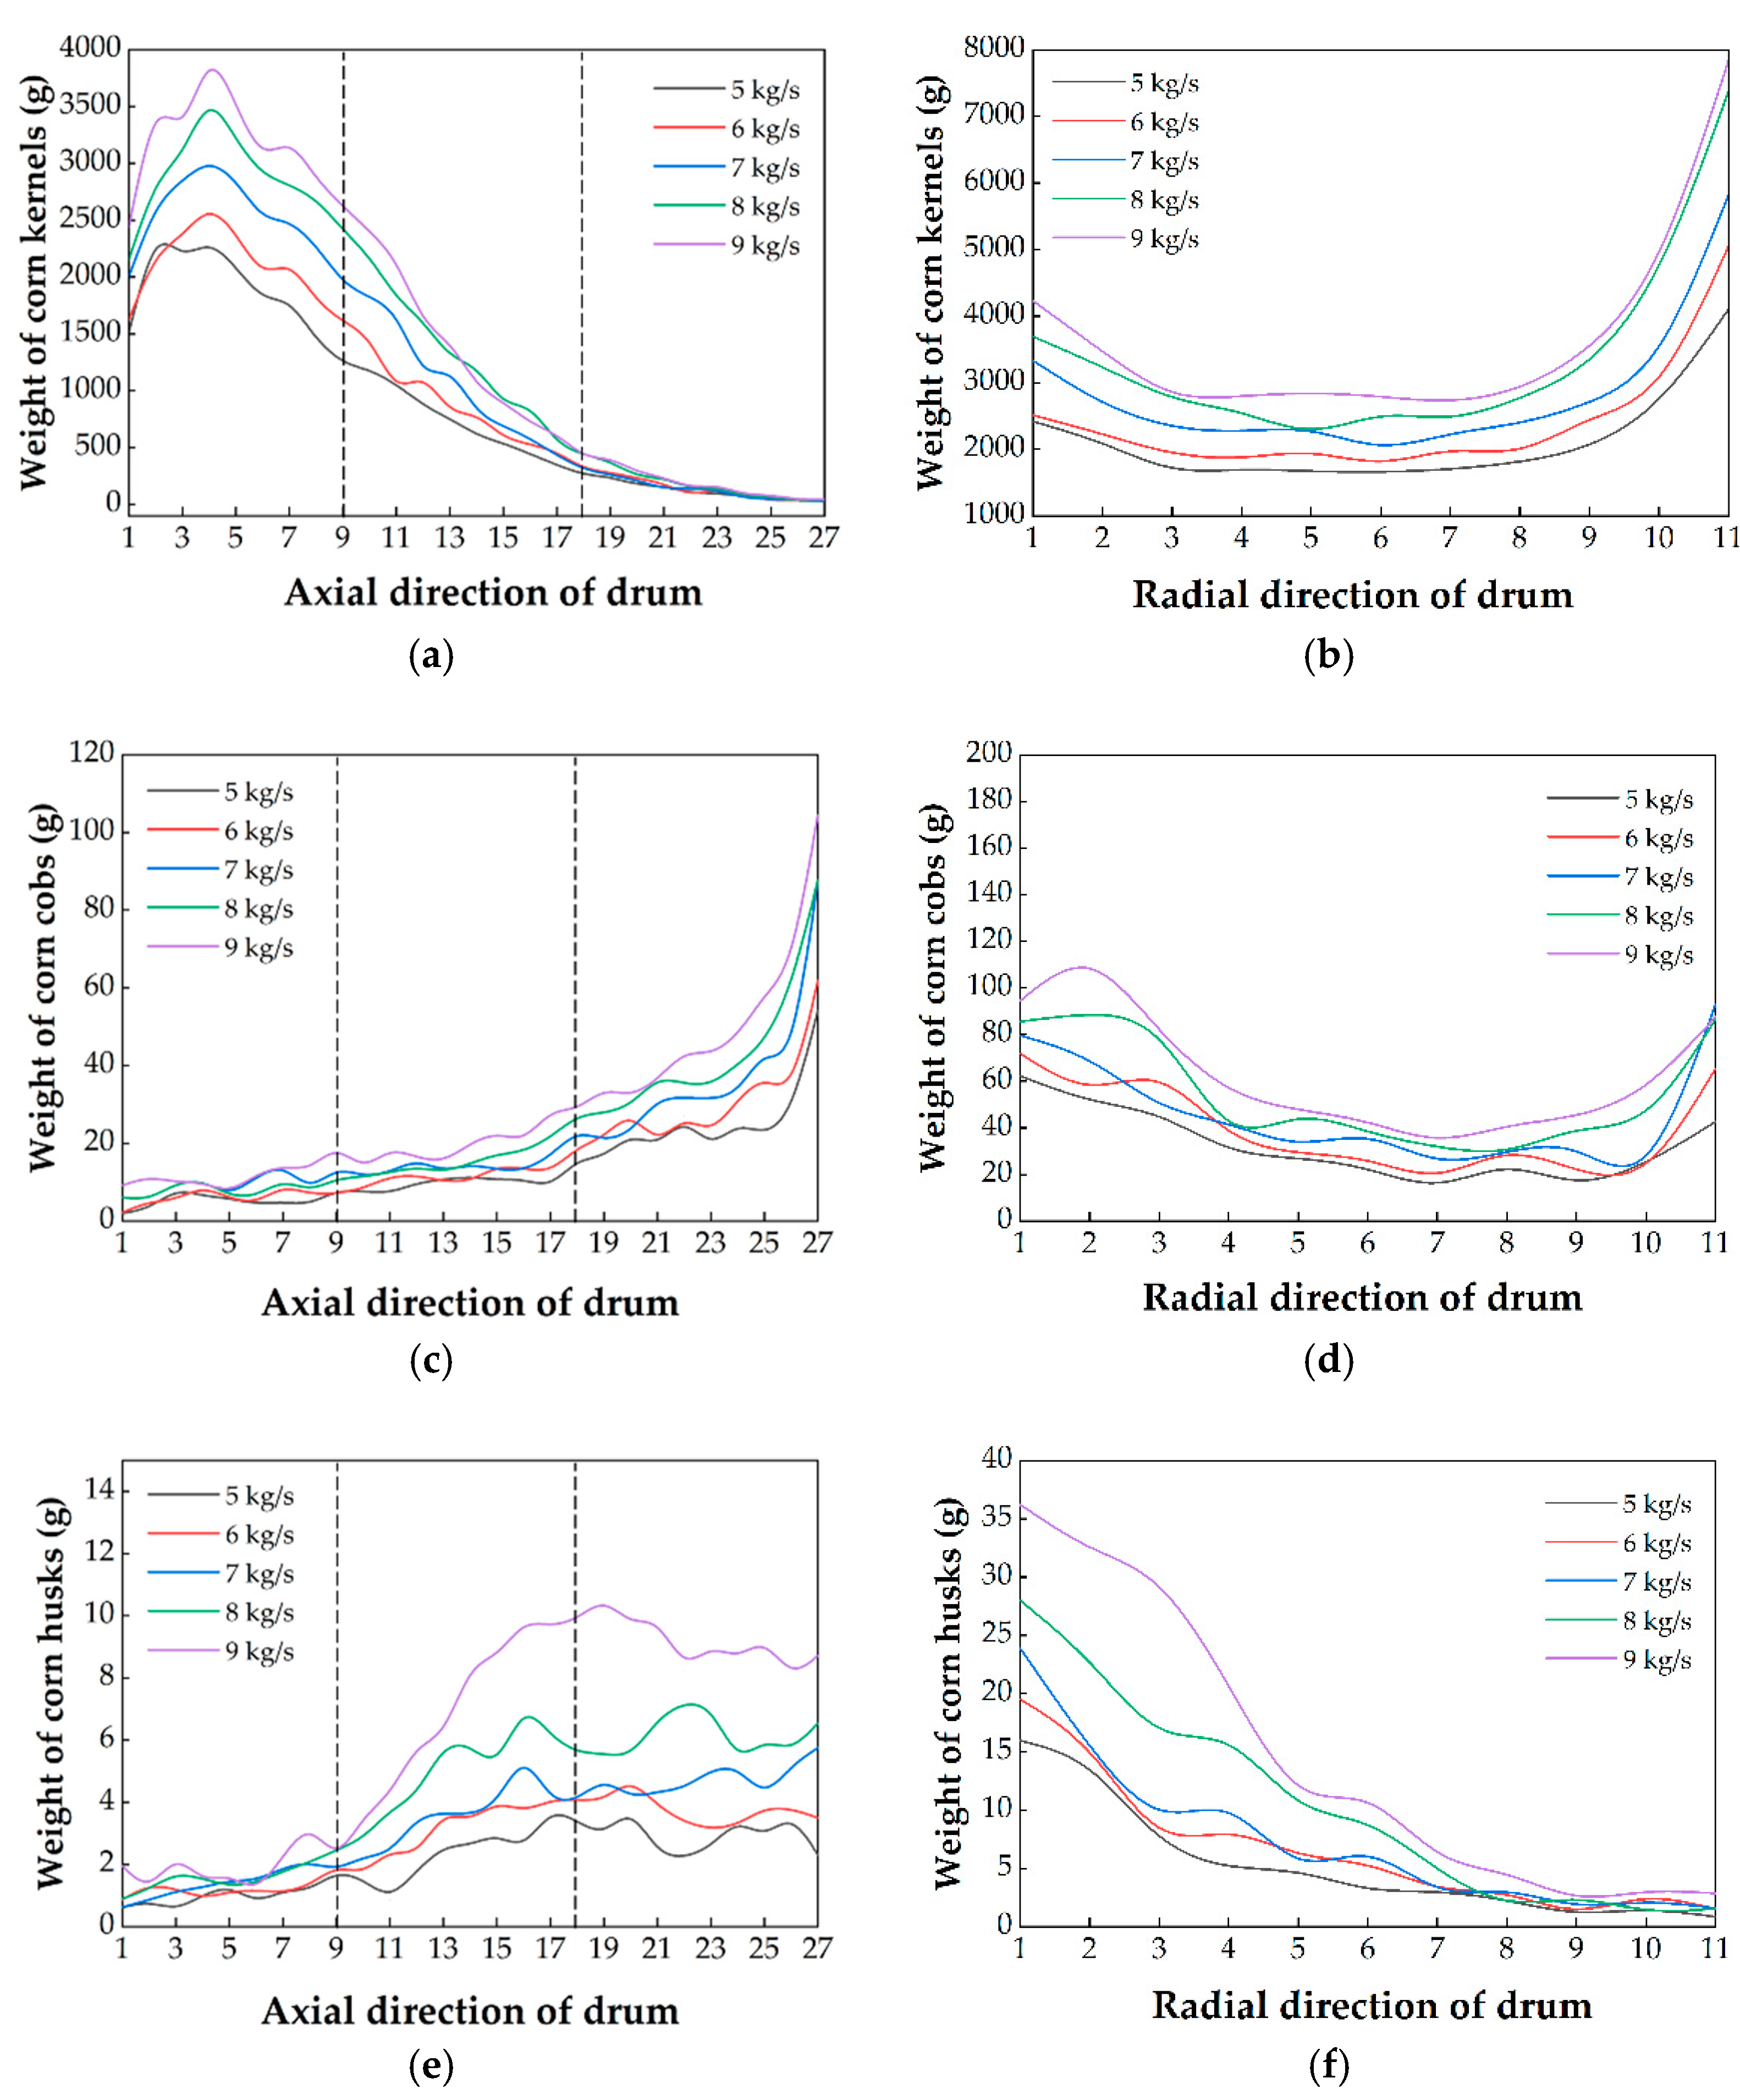
3.2.3. Effects of Feed Rate on the Weight Distribution of Components

The feed rate determines the density of the corn eras in the threshing space [40,41]. Figure 12 shows the influences of feed rate on weight distribution.
In Figure 12b, the corn kernel weight first increased and then decreased in the axial direction. The weight peak was mainly concentrated in rows 5–7. Under different feed rates, the weight distribution trend was similar, while the proportions of corn kernel weight were different. While the feed rate increased from 5 to 9 kg/s, the weight percent of corn kernels decreased from 96.7% to 95.8%. The reason for this was that the density of ears increased in the threshing space, resulting in a deficiency of rubbing. Thus, the ability of the drum to separate corn kernels was weakened, resulting in significant kernel loss. Figure 11b shows that the corn kernel weight decreased first and then increased in the radial direction. Corn kernels that dropped on the right side were consistently higher than those on the left. The counterclockwise rotating drum offered centrifugal force, which caused the result. With the rise in feed rate, a greater density of corn ears in the threshing space made the drum carry more kernels to both sides, aggravating the uneven distribution in the radial direction.
As shown in Figure 12c, the weight of corn cobs was increased continuously in the axial direction. It is found that the corn cob weight increased with the increase in feed rate, including the weight of each row and the total weight. When the feed rate increased from 5 kg/s to 9 kg/s, the weight raised from 319 g to 724 g. In the radial direction, the distribution trend decreased first and then increased (in Figure 12d). With the increase in feed rate, the weight in each row increased gradually, and the accumulation on both sides was more serious. More corn cobs gathered to both sides under the rubbing action due to the density increase.
In Figure 12e,f, the weight of corn husks increased continuously in the axial direction and decreased continuously along the radial direction. The distribution was the same as that of drum speed and concave clearance. With the increased feed rate, the total weight of husks increased gradually. Furthermore, corn husks clustered heavily on the left and posterior sides of the drum. The increase and accumulation of impurities greatly increased the cleaning load.
At present, the corn combine harvest is currently developing in the direction of high efficiency [42]. Many agricultural machinery companies in America and Europe, such as John Deere, CASE, and Fendt, developed the grain combine harvester with a large feed rate [43,44,45]. This poses a challenge for cleaning and threshing. For cleaning, the increased feed rate resulted in more threshing mixture being processed, greatly increasing the cleaning load. Li et al. [45] found the airflow velocity in the cleaning system decreased by 1.3–15.5% with every 1.0 kg/s increase in feed rate, causing the decline in cleaning performance. Moreover, the increased feed rate continuously intensified the inhomogeneity of the weight distribution. For the threshing, some kernels in the corn ears were discharged without being threshed, causing a large kernel loss. However, reducing the feed rate meant that the efficiency decreased, which did not meet the needs of the combine harvester. Therefore, a feed rate of around 7 kg/s was selected for corn harvesting. Under this condition, there were few impurities, and the weight distribution was relatively even.

3.3. Discussion

This study explored the particle size and weight distribution of the corn threshed mixture. In this study, the weight distribution pattern of corn kernels was a skateboard shape, the corn cobs weight distribution was a concave shape, and the weight distribution pattern of corn husks was a left posterior accumulated shape. In comparison with previous studies, there are some differences in the weight distribution pattern. Chai [23] found that the distribution pattern of threshed outputs in a combine harvester was saddle shaped. The reason why our distribution patterns are not completely the same is that Chai used a tangential-longitudinal axial drum. Yi [19] and Fu [22] analyzed the distribution of rice. Their results were partially the same as ours. Among them, the distribution patterns of kernels were similar, which first increased and then decreased along the axial. In the radial, the weight was greater on both sides and lower in the middle, as a result of the rotational centrifugal force. With the main difference, Yi concluded the weight distribution of impurity was decreased continuously in the axial. Corn cobs were exposed and were broken after kernels were threshed along the drum. Therefore, the weight of corn cobs gradually increased along the axial. For corn, Yang et al. [46]. studied the rule of threshing separation in a tangential flow–transverse axial threshing bench. The difference was that the structure of the threshing drum is different. In this paper, the distribution experiment was carried out on a longitudinal axial flow threshing drum. These two drums are two distinct threshing approaches. Moreover, the corn threshed mixture was not subdivided, and the particle size distribution was not considered. Therefore, this study of corn threshed mixture distribution is innovative.
In terms of particle size distribution, this research concludes that the number of particles is positively correlated with drum speed. The increase in drum speed increased the frequency of strikes to corn ears, resulting in more cobs and husks fragmentation and smaller size. The number of particles is negatively correlated with concave clearance. The reason for this was that the density of ears increased, resulting in a deficiency of rubbing. These views were consistent with that of Srison et al. [47,48,49]. The feed rate had less influence on the number of cobs and husks. A large feed rate represents high efficiency. Therefore, on the premise of ensuring high efficiency, the drum should be run at a lower speed to reduce loss. Qu et al. also confirmed this view [38,50].
In terms of weight distribution, this research concludes that the weight of the corn threshed mixture has an obvious uneven trend in the axial and radial direction. The uniformity of the threshed mixture distribution was worse with the increase in drum speed and feed rate and the decrease in concave clearance. In order to obtain a desirable distribution with maximum productivity and minimum loss, the process parameters were determined as a drum speed of 400 r/min, concave clearance of 40 mm, and feed rate of 7 kg/s.
There are still short comings in this study. It is worth noting that the drum speed, concave clearance, and feed rate had a limited impact on improving the evenness of the weight distribution. It is difficult to achieve complete uniformity of the mixture only by adjusting these three parameters in the threshing system. Therefore, reducing the cleaning load on the cleaning screen deserves further study. Then, the cleaning device will be modified to obtain an ideal cleaning performance. Exactly, this study provides the theoretical basis for the structural design of the cleaning system with lower impurities and loss.

4. Conclusions

In this study, we established a corn longitudinal axial flow threshing system. Additionally, we investigated the influence of different parameters on the particle size distribution and weight distribution of corn threshed mixtures. The results show that drum speed is the most significant factor in particle size. A larger drum speed leads to smaller particle sizes and more impurities. The weight distribution of corn kernels was more on both sides and less in the middle in the radial, and first increased and then decreased in the axial. The weight distribution of corn cobs was increasing continuously along the axial and was greater on both sides and lower in the middle in the radial. The weight distribution of corn husks was a clear left posterior distribution. With the decrease in drum speed and feed rate and the increase in concave clearance, the uniformity of the mixture distribution was improved, which is beneficial to reducing the cleaning load. Combined with the comprehensive judgment, the process parameters determined that drum speed was 400 r/min, concave clearance was 40 mm, and feed rate was 7 kg/s. Based on the uneven distribution, further research focuses on a method and device in the cleaning system to improve the local accumulation. We believe this study could provide the theoretical basis for this design.

Author Contributions

Conceptualization, J.F.; methodology, J.F.; validation, N.Z.; investigation, N.Z.; resources, J.F.; writing—original draft preparation, N.Z.; writing—review and editing, J.F.; supervision, R.W., Z.C., X.C. and Q.F.; project administration, J.F.; funding acquisition, Q.F. All authors have read and agreed to the published version of the manuscript.

Funding

This work was supported by the National Natural Science Foundation of China (No. 52105257).

Institutional Review Board Statement

Not applicable.

Data Availability Statement

Not applicable.

Acknowledgments

The authors are grateful for the frozen corn provided by the Experimental Base of Agriculture of Jilin University.

Conflicts of Interest

The authors declare no conflict of interest.

References

  1. Wang, K.; Xie, R.; Ming, B.; Hou, P.; Xue, J.; Li, S. Review of combine harvester losses for maize and influencing factors. Int. J. Agric. Biol. Eng. 2021, 14, 1–10. [Google Scholar] [CrossRef]
  2. Cui, T.; Fan, C.; Zhang, D.; Yang, L.; Li, Y.; Zhao, H. Research Progress of Maize Mechanized Harvesting Technology. Trans. Chin. Soc. Agric. Mach. 2019, 50, 1–3. [Google Scholar]
  3. Abdeen, M.A.; Salem, A.E.; Zhang, G.Z. Longitudinal Axial Flow Rice Thresher Performance Optimization Using the Taguchi Technique. Agriculture 2021, 11, 88. [Google Scholar] [CrossRef]
  4. Ezzatollah, A.A.-A.; Yousef, A.-G.; Saeid, A. Study of Performance Parameters of Threshing Unit in a Single Plant Thresher. Ardabil 2009, 4, 92–96. [Google Scholar]
  5. Yang, L.; Cui, T.; Qu, Z.; Li, K.; Yin, X.; Han, D.; Yan, B.X.; Zhao, D.; Zhang, D. Development and application of mechanized maize harvesters. Int. J. Agric. Biol. Eng. 2016, 9, 15–28. [Google Scholar]
  6. Petkevichius, S.; Shpokas, L.; Kutzbach, H.D. Investigation of the maize ear threshing process. Biosyst. Eng. 2008, 99, 532–539. [Google Scholar] [CrossRef]
  7. Wang, Z.; Cui, T.; Zhang, D.; Yang, L.; He, X.; Zhang, Z. Design and Experiment of Low Damage Corn Threshing Drum with Gradually Changing Diameter. Trans. Chin. Soc. Agric. Mach. 2021, 52, 98–105. [Google Scholar]
  8. Geng, D.; Sun, Y.; Wang, Z.; Wang, Q.; Ming, J.; Yang, H.; Xu, H. Design and experiment of plate tooth threshing device of corn grain direct harvester. J. Jilin Univ. Eng. Technol. Ed. 2022; accepted. [Google Scholar]
  9. Badretdinov, I.; Mudarisov, S.; Lukmanov, R.; Permyakov, V.; Ibragimov, R.; Nasyrov, R. Mathematical modeling and research of the work of the grain combine harvester cleaning system. Comput. Electron. Agric. 2019, 165, 104966. [Google Scholar] [CrossRef]
  10. Gebrehiwot, M.G.; De Baerdemaeker, J.; Baelmans, M. Effect of a cross-flow opening on the performance of a centrifugal fan in a combine harvester: Computational and experimental study. Biosyst. Eng. 2010, 105, 247–256. [Google Scholar] [CrossRef]
  11. Wang, L.; Wu, Z.; Feng, X.; Li, R.; Yu, Y. Design and experiment of curved screen for maize grain harvester. Trans. Chin. Soc. Agric. Mach. 2019, 50, 90–101. [Google Scholar]
  12. Liang, Z.; Li, Y.; De Baerdemaeker, J.; Xu, L.; Saeys, W. Development and testing of a multi-duct cleaning device for tangential-longitudinal flow rice combine harvesters. Biosyst. Eng. 2019, 182, 95–106. [Google Scholar] [CrossRef]
  13. Wang, L.; Yu, Y.; Ma, Y.; Feng, X.; Liu, T. Investigation of the Performance of Different Cleaning Devices in Maize Grain Harvesters Based on Field Tests. Trans. ASABE 2020, 63, 809–821. [Google Scholar] [CrossRef]
  14. Hou, L.; Wang, K.; Wang, Y.; Li, L.; Ming, B.; Xie, R.; Li, S. In-field harvest loss of mechanically-harvested maize grain and affecting factors in China. Int. J. Agric. Biol. Eng. 2021, 14, 29–37. [Google Scholar] [CrossRef]
  15. Huynh, V.M.; Powell, T.; Siddall, J.N. Threshing and Separating Process—A Mathematical Model. Trans. ASAE 1982, 25, 65–73. [Google Scholar] [CrossRef]
  16. Miu, P.I.; Kutzbach, H.-D. Mathematical model of material kinematics in an axial threshing unit. Comput. Electron. Agric. 2007, 58, 93–99. [Google Scholar] [CrossRef]
  17. Miu, P.I.; Kutzbach, H.-D. Modeling and simulation of grain threshing and separation in threshing units—Part I. Comput. Electron. Agric. 2008, 60, 96–104. [Google Scholar] [CrossRef]
  18. Miu, P.I.; Kutzbach, H.-D. Modeling and simulation of grain threshing and separation in axial threshing units: Part II. Application to tangential feeding. Comput. Electron. Agric. 2008, 60, 105–109. [Google Scholar] [CrossRef]
  19. Yi, S.; Tao, G.; Mao, X. Comparative experiment on the distribution regularities of threshed mixtures for two types of axial flow threshing and separating installation. Trans. CSAE 2008, 24, 154–156. [Google Scholar]
  20. Yuan, J.; Wang, C.; He, K.; Wan, X.; Liao, Q. Effect of components mass ratio under sieve on cleaning system performance for rape combine harvester. J. Jilin Univ. Eng. Technol. Ed. 2021, 51, 1897–1907. [Google Scholar]
  21. Chen, Y.; Kang, Y.; Wang, T.; Ning, X.; Jin, C.; Yin, X. Distribution regularities of the threshed mixtures in longitudinal axial flow flexible thresher of soybean harvester. J. China Agric. Univ. 2020, 15, 104–110. [Google Scholar]
  22. Fu, J.; Xie, G.; Ji, C.; Wang, W.; Zhou, Y.; Zhang, G.; Zha, X.; Abdeen, M.A. Study on the Distribution Pattern of Threshed Mixture by Drum-Shape Bar-Tooth Longitudinal Axial Flow Threshing and Separating Device. Agriculture 2021, 11, 756. [Google Scholar] [CrossRef]
  23. Chai, X.; Zhou, Y.; Xu, L.; Li, Y.; Li, Y.; Lv, L. Effect of guide strips on the distribution of threshed outputs and cleaning losses for a tangential-longitudinal flow rice combine harvester. Biosyst. Eng. 2020, 198, 223–234. [Google Scholar] [CrossRef]
  24. González-Montellano, C.; Fuentes, J.M.; Ayuga-Téllez, E.; Ayuga, F. Determination of the mechanical properties of maize grains and olives required for use in DEM simulations. J. Food Eng. 2012, 111, 553–562. [Google Scholar] [CrossRef]
  25. Fu, J.; Yuan, H.; Zhang, D.; Chen, Z.; Ren, L. Multi-Objective Optimization of Process Parameters of Longitudinal Axial Threshing Cylinder for Frozen Corn Using RSM and NSGA-II. Appl. Sci. 2020, 10, 1646. [Google Scholar] [CrossRef]
  26. Chen, Z.; Yu, J.; Xue, D.; Wang, Y.; Zhang, Q.; Ren, L. An approach to and validation of maize-seed-assembly modelling based on the discrete element method. Powder Technol. 2018, 328, 167–183. [Google Scholar] [CrossRef]
  27. Zhou, L.; Yu, J.; Liang, L.; Yu, Y.; Yan, D.; Sun, K.; Wang, Y. Study on key issues in the modelling of maize seeds based on the multi-sphere method. Powder Technol. 2021, 394, 791–812. [Google Scholar] [CrossRef]
  28. Zhao, B.; Kong, F.; Chen, X.; Liu, J.; Li, X.; Du, X.; Chen, M.; Yuan, J. Analysis of the relationship between grain impurity rate and cob characteristics of maize mechanical harvesting. Trans. Chin. Soc. Agric. Eng. 2021, 37, 33–39. [Google Scholar]
  29. Cheng, C.; Fu, J.; Hao, F.; Chen, Z.; Zhou, D.; Ren, L. Effect of motion parameters of cleaning screen on corn cob blocking law. J. Jilin Univ. Eng. Technol. Ed. 2020, 50, 351–360. [Google Scholar]
  30. Zamora-Cristales, R.; Sessions, J.; Smith, D.; Marrs, G. Effect of grinder configuration on forest biomass bulk density, particle size distribution and fuel consumption. Biomass Bioenergy 2015, 81, 44–54. [Google Scholar] [CrossRef]
  31. Fu, J.; Xue, Z.; Chen, Z.; Ren, L. Experimental study on specific grinding energy and particle size distribution of maize grain, stover and cob. Int. J. Agric. Biol. Eng. 2020, 13, 135–142. [Google Scholar] [CrossRef]
  32. Abdallah, R.; Auchet, S.; Méausoone, P.J. Experimental study about the effects of disc chipper settings on the distribution of wood chip size. Biomass Bioenergy 2011, 35, 843–852. [Google Scholar] [CrossRef]
  33. Li, Z.; Fu, J.; Luo, X. Tensile Properties and Fracture Mechanisms of Corn Bract for Corn Peeling Device Design. Agriculture 2021, 11, 796. [Google Scholar] [CrossRef]
  34. Zhao, C.S.; Xu, L.M.; Liu, J.; Zhang, D.X. Study on the corn bract mechanical properties-based on the skinning institution of corn harvester. J. Agric. Mech. Res. 2011, 33, 100–105. [Google Scholar]
  35. Xie, F.X.; Song, J.; Hou, H.P.; Hou, X.X. Experiment and mechanical characteristics on bract peeling of corn harvester. J. Agric. Mech. Res. 2018, 40, 129–133. [Google Scholar]
  36. Al Sharifi, S.K.A.; Aljibouri, M.A.; Taher, M.A. Effect of threshing machines, rotational speed and grain moisture on corn shelling. Bulg. J. Agric. Sci. 2019, 25, 243–255. [Google Scholar]
  37. Qu, Z.; Zhang, D.; Yang, L. Experimental Study on the discharge Rate and Cylinder Speed of the Longitudinal Axial Flow Threshing and Separating Device of Maize. Trans. Chin. Soc. Agric. Mach. 2018, 49, 58–65. [Google Scholar]
  38. Srison, W.; Chuan-udom, S.; Saengprachatanarug, K. Design factors affecting losses and power consumption of an axial flow corn shelling unit. Agric. Nat. Resour. 2016, 38, 421–425. [Google Scholar]
  39. Steponavičius, D.; Pužauskas, E.; Špokas, L.; Jotautienė, E.; Kemzūraitė, A.; Petkevičius, S. Concave Design for High-Moisture Corn Ear Threshing. Mechanics 2018, 24, 80–91. [Google Scholar] [CrossRef]
  40. Tang, Z.; Li, Y.; Xu, L.; Pang, J.; Li, H. Experimental study on wheat feed rate of tangential-axial combine harvester. Trans. Chin. Soc. Agric. Eng. 2012, 28, 26–31. [Google Scholar]
  41. Mao, X.; Yi, S. Study on Grain Fluid ’s Density Regularities of Distribution of Assembled Axial- Flow Installation. J. Heilongjiang August First Land Reclam. Univ. 2008, 20, 40–42. [Google Scholar]
  42. John Deere US. Available online: https://www.deere.com/en/index.html (accessed on 28 July 2022).
  43. CASE IH. Available online: https://www.caseih.com/apac/en-int/products/harvesters (accessed on 28 July 2022).
  44. FENDT.com. Available online: https://www.agcocorp.cn/brands/fendt.html (accessed on 28 July 2022).
  45. Li, Y.; Xu, L.; Zhou, Y.; Li, B.; Liang, Z.; Li, Y. Effects of throughput and operating parameters on cleaning performance in air-and-screen cleaning unit: A computational and experimental study. Comput. Electron. Agric. 2018, 152, 141–148. [Google Scholar] [CrossRef]
  46. Yang, L.; Lü, Q.; Zhang, H. Experimental Study on Direct Harvesting of Corn Kernels. Agriculture 2022, 12, 919. [Google Scholar] [CrossRef]
  47. Zhu, X.; Chi, R.; Du, Y. Experimental study on the key factors of low-loss threshing of high-moisture maize. Int. J. Agric. Biol. Eng. 2020, 13, 23–31. [Google Scholar] [CrossRef]
  48. Špokas, L.; Steponavičius, D.; Petkevičius, S. Impact of technological parameters of threshing apparatus on grain damage. Agron. Res. 2008, 6, 367–376. [Google Scholar]
  49. Khazaei, J.; Shahbazi, F.; Massah, J. Evaluation and modeling of physical and physiological damage to wheat seeds under successive impact loadings: Mathematical and neural networks modeling. Crop Sci. 2008, 48, 1532–1544. [Google Scholar] [CrossRef]
  50. Fu, J.; Chen, Z.; Han, L.; Ren, L. Review of grain threshing theory and technology. Int. J. Agric. Biol. Eng. 2018, 11, 12–20. [Google Scholar] [CrossRef]
Figure 1. Corn threshing and cleaning system. 1. threshing drum, 2. concave, 3. oscillating plate, 4. fan, 5. upper screen, 6. kernel transport auger, 7. lower screen, 8. impurity transport auger, 9. tailing screen.
Agriculture 12 01214 g001
Figure 2. Test bench of longitudinal axial threshing drum.
Agriculture 12 01214 g002
Figure 3. The arrangement of collection boxes.
Agriculture 12 01214 g003
Figure 4. Schematic diagram of axial (a) and radial (b) arrangement of collection boxes.
Agriculture 12 01214 g004
Figure 5. Components of corn threshed mixture. (a) Corn kernel, (b) Corn cob, (c) Corn husk.
Agriculture 12 01214 g005
Figure 6. Characteristic size of the corn cob.
Agriculture 12 01214 g006
Figure 7. Particle size distribution of corn cobs. (a,b): LC and α of corn cobs for different drum speeds; (c,d): LC and α of corn cobs for different concave clearances; (e,f): LC and α of corn cobs for different feed rates.
Agriculture 12 01214 g007
Figure 8. Characteristic size and particle size distribution of corn husks: (a) Characteristic size of corn husk; (b) B of corn husks for different drum speeds; (c) B of corn husks for different concave clearances; (d) B of corn husks for different feed rates.
Agriculture 12 01214 g008
Figure 9. Three-dimensional distribution of the weight. (a) Weight distribution pattern of corn kernels. (b) Weight distribution pattern of corn cobs. (c) Weight distribution pattern of corn husks.
Agriculture 12 01214 g009
Figure 10. Weight distribution of components for different feed rates. Weight distribution curves in the axial and radial direction of (a,b) corn kernels; (c,d) corn cobs; and (e,f) corn husks.
Agriculture 12 01214 g010
Figure 11. Weight distribution of components for different concave clearances. Weight distribution curves in the axial and radial directions of (a,b) corn kernels, (c,d) corn cobs, and (e,f) corn husks.
Agriculture 12 01214 g011
Figure 12. Weight distribution of components for different feed rates. Weight distribution curves in the axial and radial direction of (a,b) corn kernels; (c,d) corn cobs; and (e,f) corn husks.
Agriculture 12 01214 g012
Table 1. Experimental scheme design of single factor.
NumbersFactorsValuesCondition
1–5Drum speed
(r/min)
300, 400, 500,
600, 700
Concave clearance = 40 mm
Feed rate = 7 kg/s
6–10Concave clearance
(mm)
30, 35, 40, 45, 50Drum speed = 400 r/min
Feed rate = 7 kg/s
11–15Feed rate
(kg/s)
5, 6, 7, 8, 9Drum speed = 400 r/min
Concave clearance = 40 mm
Table 2. Particle size distribution of corn kernels.
ShapeCharacteristic SizesValueProportion (%)
Agriculture 12 01214 i001
Horse-toothed kernel
W1 (mm)4.40–6.6286.2
W2 (mm)7.32–9.61
Hh (mm)10.09–14.50
T (mm)3.98–6.59
Agriculture 12 01214 i002
Conical kernel
DC (mm)4.55–6.2510.3
HC (mm)9.25–13.65
Agriculture 12 01214 i003
Spherical kernel
DS (mm)3.85–6.253.5
HS (mm)3.60–6.54
Table 3. Effect of process parameters on Frequency (Lc) of corn cobs and repeated measures analysis of variance.
Influence
Factor
Frequency (Lc)
0–11 mm11–20 mm21–30 mm31–40 mm41–50 mm51–60 mm>60 mm
Mean ± SDCV (%)Mean ± SDCV (%)Mean ± SDCV (%)Mean ± SDCV (%)Mean ± SDCV (%)Mean ± SDCV (%)Mean ± SDCV (%)
300 r/min86 ± 7.09 e9.280 ± 5.00 d7.760 ± 11.23 d4.456 ± 4.58 c3.518 ± 2.08 e1.425 ± 5.50 d2.110 ± 2.51 e5.2
400 r/min144 ± 11.54 d16.4121 ± 8.72 c4.3116 ± 17.01 c6.2109 ± 10.01 b7.832 ± 6.56 d2.731 ± 3.61 d3.612 ± 4.04 d2.3
500 r/min231 ± 11.50 c5.0189 ± 22.61 b11.4130 ± 16.17 c5.6120 ± 12.12 b10.145 ± 5.01 c3.847 ± 5.13 c7.39 ± 5.51 c3.2
600 r/min465 ± 14.57 b3.5205 ± 17.51 b9.8160 ± 11.69 b4.3147 ± 14.01 a11.393 ± 3.00 b1.669 ± 12.52 b8.511 ± 11.23 b7.1
700 r/min805 ± 20.21 a19.4385 ± 12.12 a13.5215 ± 12.58 a7.1151 ± 12.52 a5.5102 ± 11.15 a6.997 ± 6.24 a4.920 ± 8.89 a2.6
F-value352.374 * 291.912 * 93.914 * 73.024 * 121.965 * 50.635 * 3.244
30 mm668 ± 17.86 e18.9425 ± 16.32 e3.3289 ± 5.07 e6.468 ± 10.66 d7.725 ± 6.54 d1.67 ± 10.37 c2.27 ± 9.88 c4.7
35 mm541 ± 15.32 d17.4473 ± 20.89 d7.8186 ± 10.78 d5.842 ± 12.55 c6.523 ± 2.17 c2.78 ± 9.22 c3.95 ± 4.23 b2.5
40 mm311 ± 10.11 c12.3380 ± 17.45 c4.9123 ± 14.49 c7.246 ± 13.12 c10.216 ± 3.65 b4.510 ± 6.45 b6.56 ± 7.15 a4.3
45 mm215 ± 12.37 b6.7406 ± 6.61 b5.294 ± 9.20 b4.434 ± 9.78 b6.313 ± 4.83 b6.04 ± 7.52 a7.17 ± 1.33 a1.9
50 mm189 ± 9.89 a5.5376 ± 7.53 a9.7112 ± 10.32 a5.030 ± 6.09 a4.512 ± 3.06 a6.75 ± 4.36 a1..86 ± 2.78 a2.6
F-value235.663 * 31.642 * 82.954 * 15.524 * 6.575 5.348 2.411
5 kg/s388 ± 17.45 d9.9402 ± 15.33 c8.5131 ± 10.89 d8.125 ± 7.89 e5.516 ± 7.78 d6.78 ± 3.64 d2.22 ± 1.50 c2.6
6 kg/s330 ± 20.11c6.7398 ± 14.29 c4.4164 ± 9.78 c8.042 ± 10.49 d6.717 ± 6.45 d2.26 ± 2.77 d4.57 ± 2.06 b1.3
7 kg/s321 ± 18.37 c8.5380 ± 11.98 b10.3153 ± 12.34 b6.556 ± 9.99 c4.426 ± 6.43 c1.915 ± 8.83 c6.86 ± 1.73 b4.5
8 kg/s264 ± 10.34 b4.3382 ± 10.57 b6.4202 ± 17.45a4.463 ± 8.45 b8.935 ± 4.37 b5.918 ± 9.45 b5.86 ± 1.22 bs5.7
9 kg/s241 ± 15.22 a6.1394 ± 14.52 a5.5211 ± 12.64 a7.980 ± 11.78 a10.352 ± 10.46 a4.325 ± 7.46 a4.216 ± 3.04 a4.4
F-value50.896 * 3.929 14.088 * 4.08 20.501 * 10.112 * 20.649 *
F = Fisher’s variance ratio; * Extreme significance (p < 0.01). Mean values with different letters in each column indicate that these values have statistically significant differences (p < 0.05). CV = coefficient of variation.
Table 4. Effect of process parameters on Frequency (α) of corn cobs and repeated measures analysis of variance.
Influence
Factor
Frequency (α)
0–45°46–90°91–135°136–180°181–225°226–270°271–315°316–360°
Mean
± SD
CV
(%)
Mean
± SD
CV
(%)
Mean
± SD
CV
(%)
Mean
± SD
CV
(%)
Mean
± SD
CV
(%)
Mean
± SD
CV
(%)
Mean
± SD
CV
(%)
Mean
± SD
CV
(%)
300 r/min45 ± 12.35 e7.756 ± 7.89 d4.443 ± 12.55 e7.432 ± 9.89 d4.518 ± 7.80 d2.215 ± 4.41 d6.620 ± 3.77 d5.427 ± 3.50 e1.7
400 r/min155 ± 17.48 d8.5127 ± 11.45 c8.890 ± 13.45 d6.679 ± 10.33 c9.047 ± 4.45 c1.732 ± 5.67 c4.522 ± 2.91 d6.611 ± 4.51 d3.6
500 r/min231 ± 19.44 c4.3214 ± 17.34 b5.6134 ± 17.42 c3.4137 ± 13.46 b8.940 ± 5.69 c4.554 ± 3.45 b6.739 ± 4.89 c5.055 ± 6.33 c4.5
600 r/min375 ± 10.32 b7.1205 ± 9.36 b7.9168 ± 11.12 a6.7127 ± 15.45 b6.793 ± 4.89 b4.760 ± 2.89 b3.155 ± 6.77 b3.267 ± 2.99 b6.6
700 r/min742 ± 20.37 a10.5426 ± 12.82 a11.3315 ± 10.38 a12.1240 ± 13.74 a4.3122 ± 10.35 a5.197 ± 3.05 a3.2109 ± 7.33 a2.2123 ± 7.35 a5.3
F-value323.975 * 204.196 * 57.894 * 171.267 * 46.340 * 46.175 * 93.197 * 106.613 *
30 mm551 ± 17.44 e7.1321 ± 17.19 d3.3231 ± 10.33 d10.3109 ± 16.55 e7.585 ± 7.78 b2.245 ± 5.45 d8.689 ± 10.44 d5.481 ± 9.11 d7.4
35 mm399 ± 12.39 d4.5264 ± 10.56 c4.6225 ± 9.77 c11.4173 ± 15.48 d4.655 ± 10.34 b3.942 ± 4.67 d6.774 ± 8.36 c6.670 ± 7.45 c5.5
40 mm231 ± 10.45 c5.6189 ± 12.45 b5.4170 ± 12.36 b5.5138 ± 13.35 c6.440 ± 8.84 a4.636 ± 5.12 c8.239 ± 5.54 b4.451 ± 5.59 b2.3
45 mm200 ± 9.99 b9.0200 ± 11.84 b3.3148 ± 15.01 a5.9120 ± 12.89 b5.537 ± 8.22 a5.130 ± 4.32 b3.332 ± 6.35 b3.244 ± 6.78 a2.0
50 mm150 ± 11.76 a6.3180 ± 18.88 a9.8156 ± 14.44 a3.2100 ± 10.11 a4.933 ± 7.35 a4.419 ± 3.78 a4.520 ± 4.55 a6.742 ± 8.81 a3.5
F-value202.815 * 59.772 * 68.067 * 21.419 * 31.511 * 24.966 * 183.697 * 79.38 *
5 kg/s314 ± 12.45 d7.5175 ± 14.56 d2.2195 ± 17.33 e4.5135 ± 7.89 d10.141 ± 4.56 c6.540 ± 4.55 d7.952 ± 3.98 c1.735 ± 3.79 c4.4
6 kg/s259 ± 13.01 c6.8240 ± 11.20 c4.3179 ± 10.06 d6.6146 ± 10.45 c8.945 ± 8.74 c6.145 ± 4.78 d8.336 ± 4.11 b5.331 ± 4.67 c3.0
7kg/s231 ± 15.44 b10.6219 ± 15.44 b5.7192 ± 11.14 c3.5145 ± 11.12 c7.643 ± 6.66 c5.339 ± 6.23 c3.239 ± 4.56 b2.444 ± 9.76 b3.9
8kg/s244 ± 12.89 b11.5257 ± 13.33 a8.8137 ± 13.78 b7.7167 ± 17.56 b5.550 ± 8.81 b4.348 ± 7.49 b2.147 ± 3.09 a3.465 ± 4.58 a2.0
9kg/s265 ± 18.90 a9.7264 ± 12.09 a9.0154 ± 12.11 a6.7142 ± 8.85 a6.141 ± 4.56 a6.765 ± 6.65 a4.550 ± 9.77 a3.062 ± 3.11 a1.5
F-value2.897 5.134 7.509 1.375 2.985 6.437 4.462 5.519
F = Fisher’s variance ratio; * Extreme significance (p < 0.01). Mean values with different letters in each column indicate that these values have statistically significant differences (p < 0.05). CV = coefficient of variation.
Table 5. Effect of process parameters on Frequency (B) of corn husks and repeated measures analysis of variance.
Influence
Factor
Frequency (B)
0–11 mm11–20 mm21–30 mm31–40 mm41–50 mm>50 mm
Mean ± SDCV (%)Mean ± SDCV (%)Mean ± SDCV (%)Mean ± SDCV (%)Mean ± SDCV (%)Mean ± SDCV (%)
300 r/min91 ± 13.37 e7.781 ± 8.39 e4.662 ± 18.44 e9.756 ± 12.34 e5.918 ± 8.79 d7.425 ± 6.46 e4.5
400 r/min124 ± 14.74 d2.2120 ± 13.45 d3.595 ± 15.33 d6.680 ± 14.56 d6.739 ± 10.45 c5.832 ± 6.39 d3.6
500 r/min231 ± 15.59 c3.5189 ± 16.37 c7.1130 ± 12.45 c4.5120 ± 11.89 c6.441 ± 7.22 c1.948 ± 7.33 c4.4
600 r/min465 ± 10.66 b4.6205 ± 17.56 b9.0167 ± 10.89 b3.2147 ± 17.32 b5.193 ± 5.12 b4.365 ± 5.99 b3.0
700 r/min525 ± 22.21 a9.8322 ± 18.88 a10.3214 ± 17.64 a6.1166 ± 16.45 a2.2102 ± 4.30 a2.997 ± 10.11 a7.1
F-value553.284 * 129.236 * 35.104 * 58.704 * 50.535 * 62.918 *
30 mm335 ± 12.45 d7.2324 ± 17.88 e5.6231 ± 17.15 e7.1154 ± 6.79 d2.085 ± 4.55 d10.945 ± 5.45 c5.8
35mm307 ± 15.55 c9.0261 ± 12.09 d7.2175 ± 14.32 d4.5149 ± 10.48 d4.945 ± 6.89 c7.841 ± 6.32 c4.3
40 mm231 ± 14.90 b5.6189 ± 17.11 c5.9136 ± 10.55 c6.6122 ± 9.09 c3.746 ± 6.48 c4.439 ± 9.83 c2.2
45 mm210 ± 16.03 b4.5209 ± 12.95 b6.0125 ± 17.89 b7.9109 ± 8.87 b4.657 ± 7.31 b6.330 ± 3.46 b1.9
50 mm143 ± 17.45 a6.3168 ± 10.44 a6.188 ± 9.89 a4.381 ± 8.01 a5.241 ± 8.49 a5.126 ± 7.42 a2.5
F-value65.073 * 51.895 * 46.555 * 15.678 * 11.012 * 11.819 *
5 kg/s106 ± 10.33 d5.495 ± 9.73 d5.7121 ± 8.89 e6.082 ± 6.79 e8.941 ± 10.33 d7.740 ± 4.33 d4.0
6 kg/s128 ± 12.67 c3.2184 ± 8.45 c8.8159 ± 9.03 d4.9100 ± 8.22 d10.340 ± 8.99 d4.745 ± 6.89 d5.0
7 kg/s231 ± 18.01 b9.6189 ± 10.43 c9.0131 ± 11.34 c2.7124 ± 9.39 c11.447 ± 7.47 c9.839 ± 5.01 c3.6
8 kg/s242 ± 19.98 b4.2218 ± 11.12 b4.7150 ± 14.55 b7.4158 ± 10.45 b3.552 ± 6.81 b4.055 ± 6.35 b7.9
9 kg/s265 ± 15.43 a7.1205 ± 12.23 a2.4163 ± 17.58 a6.3145 ± 14.01 a6.884 ± 10.41 a3.195 ± 6.78 a5.1
F-value56.626 * 40.203 * 13.056 * 26.265 * 7.608 * 22.014 *
F = Fisher’s variance ratio; * Extreme significance (p < 0.01). Mean values with different letters in each column indicate that these values have statistically significant differences (p < 0.05). CV = coefficient of variation.
Publisher’s Note: MDPI stays neutral with regard to jurisdictional claims in published maps and institutional affiliations.

