Article

Time-Course Transcriptome Landscape of Bursa of Fabricius Development and Degeneration in Chickens

1
Joint International Research Laboratory of Agriculture and Agri-Product Safety, the Ministry of Education of China, Yangzhou University, Yangzhou 225009, China
2
College of Animal Science, Xichang University, Xichang 615000, China
*
Author to whom correspondence should be addressed.
Agriculture 2022, 12(8), 1194; https://doi.org/10.3390/agriculture12081194
Submission received: 14 July 2022 / Revised: 3 August 2022 / Accepted: 8 August 2022 / Published: 10 August 2022
(This article belongs to the Special Issue Application of Genetics and Genomics in Livestock Production)

Abstract

:
The bursa of Fabricius (BF) is a target organ for various pathogenic microorganisms; however, the genes that regulate BF development and decline have not been fully characterized. Therefore, in this study, histological sections of the BF were obtained from black-boned chickens at 7 (N7), 42 (N42), 90 (N90) and 120 days (N120) of age, and the differential expression and expression trends of the BF at different stages were analyzed by transcriptome analysis. The results showed that the growth of the BF progressively matured with age, followed by gradual shrinkage and disappearance. Transcriptome differential analysis revealed 5914, 5513, 4575, 577, 530 and 66 differentially expressed genes (DEG) in six different comparison groups: N7 vs. N42, N7 vs. N90, N7 vs. N120, N42 vs. N90, N42 vs. N120 and N90 vs. N120, respectively. Moreover, we performed transcriptomic analysis of the time series of BF development and identified the corresponding stages of biological process enrichment. Finally, quantitative real-time polymerase chain reaction (qRT-PCR) was used to validate the expression of the 16 DEGs during bursal growth and development. These results were consistent with the transcriptome results, indicating that they reflect the expression of the BF during growth and development and that these genes reflect the characteristics of the BF at different times of development and decline. These findings reflect the characteristics of the BF at different time intervals.

1. Introduction

The bursa is the central organ of humoral immunity in birds and is a target organ for a variety of pathogenic microorganisms. The bursa is a unique immune tissue in birds that secretes immune cells (B lymphocytes) to produce specific antibodies and complete a specific immune response. In most poultry production, the bursa is mainly affected by immune diseases (e.g., Infectious Bursal Disease (IBD), Malignant Disease (MD), Avian Leukemia, etc.), resulting in a decrease in the immune status of the bird, which may even lead to the death of the bird as a result of the immune disease [1,2]. The BF was first discovered in 1621 by Italian anatomist Hieronymus Fabricius [3,4]. For a long time, it was thought that the BF was an organ associated with reproduction, until 1956, when Glick [5] discovered that it is a gut-associated lymphoid tissue with immune functions. As a primary immune organ, the BF provides the microenvironment necessary for the development and maturation of B cells in birds [6]. In both humans and mice, B-cell development occurs in the bone marrow. Bird B-cells develop in the BF, a unique organ located dorsal to the cloaca in birds [7] that is critical to early B-lymphocyte proliferation and differentiation [8,9,10]. Additionally, the BF contains a variety of polypeptides that improve both innate and acquired immune responses. The body’s immunological response is a requirement for normal BF growth [11].
The BF originates from hematopoietic stem cells [12], appears in the embryo, develops at a young age, reaches a peak of development at sexual maturity and then gradually degenerates until it disappear [13]. For example, in chickens, at approximately 8 day after embryonic development, the BF forms and B cells colonize it. Approximately 1 week after emergence, the medulla of the BF begins to proliferate. Until approximately 30 day of age, lymphocytes begin to transfer in large numbers to the peripheral lymphoid organs to perform their immune functions. The growth of the BF reaches its peak at approximately 60 day of age, and the adult BF is atrophied and the lymphocytes in the follicular medulla are largely empty at 130 day of age. In contrast to the biological process of growth and maturation followed by organ failure in many organisms, the BF naturally atrophies after maturation in the absence of pathology until it disappears. It is thought that BF degeneration is related to the apoptosis of lymphocytes and secretion of hormones after sexual maturation in birds [14]. To date, the molecular mechanisms underlying BF degeneration are poorly understood.
Most current research on the BF has focused on the relationship between avian diseases, attack toxins, and organs at the phenological and molecular levels, along with a small number of studies on the BF morphology. However, the immune function of the BF is closely related to its structural development, and apoptosis of the BF leads to the destruction of immune function and causes immune deficiency in the animal, which is detrimental to the economic efficiency and healthy development of poultry farming. Therefore, in order to fill the gaps in previous studies on the molecular mechanisms of BF degeneration, we performed transcriptomic analyses of the early developmental period (N7), the middle developmental period (N42), the peak developmental period, the early degeneration period (N90) and the late degeneration period (N120) of BFs to determine the changes in gene expression during the differentiation to atrophy of BF. The degenerative process of BF was dissected from a structural developmental perspective, and the unique developmental degenerative mechanisms of BFs were elucidated.

2. Materials and Methods

2.1. Ethics Statement

All samples were collected in accordance with the guidelines proposed by the China Council on Animal Care and Ministry of Agriculture of the People’s Republic of China. The study was approved by the Institutional Animal Care and Use Committee and the School of Animal Experiments Ethics Committee (license number: SYXK [Su] IACUC 2012–0029) of Yangzhou University.

2.2. Sampling

Jiuyuan Black chickens were obtained from the Laboratory of Poultry Genetic Resources Evaluation and Germplasm Utilization at Yangzhou University. All test individuals were hatched and raised under the same conditions. The chickens were sacrificed at 7, 42, 90 or 120 d by severing the jugular vein after anesthesia and were bled out for 5 min before dissection. The BFs were quickly isolated, washed twice with fresh ice-cold phosphate-buffered saline (PBS) and cut in half along the sagittal plane. One-half was fixed in 4% paraformaldehyde and the other was stored in liquid nitrogen.

2.3. Histological Observation

After fixation in a 4% paraformaldehyde solution for 24 h at room temperature, the BFs were trimmed, dehydrated with alcohol and embedded in paraffin. Then, 5 mm serial sections were prepared and stained with hematoxylin and eosin. Sections were mounted with neutral balsam and histopathological changes were observed and photographed under a Nikon Eclipse 90i microscope (Nikon, Tokyo, Japan).

2.4. RNA Extraction, cDNA Library Preparation and RNA Sequencing (RNA-Seq)

The total RNA was extracted using the RNAprep Pure Tissue Kit (TianGen, Beijing, China), according to the manufacturer’s protocol. RNA degradation and contamination were visualized on 1% agarose gels, RNA purity was checked using a NanoPhotometer spectrophotometer (Implen, Munich, Germany) and concentrations were determined using the Qubit RNA Assay Kit in a Qubit 2.0 Fluorometer (Life Technologies, Shanghai, China). The total RNA was depleted of ribosomal RNA (rRNA) using the Epicentre Ribo-Zero rRNA Removal Kit (Epicentre, Madison, WI, USA), and fragmented, purified and sequenced using the Illumina HiSeq system (Illumina, Inc., San Diego, CA, USA). Briefly, the mRNA was fragmented and strand cDNA synthesis was primed with random hexamers. After second-strand cDNA synthesis, the transcripts were poly A-tailed for ligation of the sequencing adaptors. The library fragments were size-selected for cDNA fragments 150–200 bp in length, and the pool of cDNA libraries was sequenced by paired-end sequencing on the Illumina HiSeq sequencer (Illumina, San Diego, CA, USA).

2.5. Bioinformatics Analysis

Bioinformatics analysis was performed on the OmicShare platform, a free online platform for data analysis (https://www.omicshare.com/tools, accessed on 11 May 2022). Raw reads were processed using Trimmomatic software. Reads containing poly-N and low-quality reads were removed to obtain clean reads. The clean reads were mapped to the Gallus gallus genome GRCg6a (https://asia.ensembl.org/Gallus_gallus/Info/Index, accessed on 11 April 2022) using HISAT2 (version: 2.0.2-beta, Baltimore, MD, USA) software [15]. Transcript abundances were determined using the fragments per kilobase of transcript per million mapped reads (FPKM) values, and genes with FPKM values ≥ 0.1 were retained for further analysis. Differentially expressed genes (DEG) were identified using DESeq2 (version: 3.15, http://www.bioconductor.org/packages/release/bioc/html/DESeq2.html, accessed on 19 April 2022) [16]. Values of p < 0.05 and log2 (fold change) > 1.5 were set as the thresholds for significantly differential expression levels. Hierarchical cluster analysis of the DEGs was performed to explore gene expression patterns.

2.6. Gene Expression Pattern Analysis

The Mfuzz R package was used to apply the fuzzy c-means algorithm to profile rhythmic genes according to their expression patterns [17]. The average FPKM (fragments per kilobase per million) value for each gene at different time points was clustered using the Mfuzz package. After standardization, each gene was assigned to a unique cluster according to its membership value. Additionally, ImpulseDE2, which is a Bioconductor R package specifically designed for time series data, was employed in the case-only mode to discern steadily increasing or decreasing expression trajectories from transiently up- or downregulated genes (false discovery rate-adjusted p < 0.01) [18].

2.7. Functional Annotation

Gene Ontology (GO) enrichment analysis of DEGs was implemented using clusterProfiler 4.0, in which gene length bias was corrected [19]. GO terms with corrected p-values less than 0.05 were considered significantly enriched among the DEGs. Additionally, we used KOBAS software to test the statistical enrichment of DEGs in KEGG pathways [20]. The OmicShare platform was also used for REACTOME enrichment.

2.8. Quantitative Real-Time Polymerase Chain Reaction (qRT-PCR)

The total RNA was isolated using the RNAprep Pure Tissue Kit (TianGen, Beijing, China), according to the manufacturer’s protocol. For quantification of gene expression, qRT-PCR was conducted using One-step RT-qPCR kit (TianGen, Beijing, China). The relative mRNA expression was quantified using the 2−ΔΔCT method. Beta-actin was used as an internal control. All experiments were repeated thrice. The primers used for qRT-PCR are listed in Table S1.

2.9. Statistical Analysis

Data are expressed as the mean ± standard error (SE). Significance was determined using one-way analysis of variance (ANOVA), as implemented in SPSS (version: 25, New York, NY, USA) software. Differences were considered statistically significant at p < 0.05.

3. Results

3.1. Histomorphological Changes in the BF at Different Developmental Times

To determine the changes during BF development, histological observations were performed at 7, 42, 90 and 120 d. The results show that the BFs at 7 d displayed thin and empty reticular submucosa (Figure 1a). The number of smooth muscle cells in the muscle layer was lower, the serosa was thinner, the volume of the lymph nodes was significantly increased and the cells were closely arranged. At 42 d, the follicular cortex was obvious, the boundary between the cortex and medulla was clear, and the medulla was well developed and filled with lymphocytes (Figure 1b). At 90 d, the lymphoid follicles of the BFs were trapped in the interstitium, the medullary lymphocytes decreased in number and the cortical cell walls were dense (Figure 1c). At 120 d, the lymphoid follicles of the BFs were trapped in the interstitium, and the medullary lymphocytes had almost disappeared completely. Significant fibrosis was observed in the foam component (Figure 1d).

3.2. Sequencing Quality Analysis

To ensure the quality and reliability of the data analysis, the raw data were first filtered, and then the reads with joints, reads containing N and low-quality reads were removed. After filtering the original data, the sequencing error rate and GC content distribution were determined. A total of 487,181,964 clean reads were obtained, accounting for 99.5% of the raw reads. The data are summarized in Table S2. In the 12 samples, the proportion of high-quality reads to original reads was greater than 97%, with 72.7 Gb of high-quality reads, and the GC content per sample was greater than 49.81%. Thus, the reads obtained were of high quality. High-quality reads with a quality score of Q20 exceeded 97.48%, and those with Q30 exceeded 93.86%. These data revealed the sequencing quality of the transcriptome. High-quality reads (high Q20 percentage) were selected from the 12 samples. After quality control, clean reads were compared with the Gallus gallus genome GRCg6a. HISAT2 (version: 2.0.2-beta, MD, USA) software was used to compare clean reads quickly and accurately with the reference genome to obtain the locational information of the reads on the reference genome. To calculate the respective mapping rates of read1 and read2, the total read number was calculated as the sum of read1 and read2, which are shown as clean reads in Table S2. A comparison between the samples and reference genomes is also shown in Table S2.

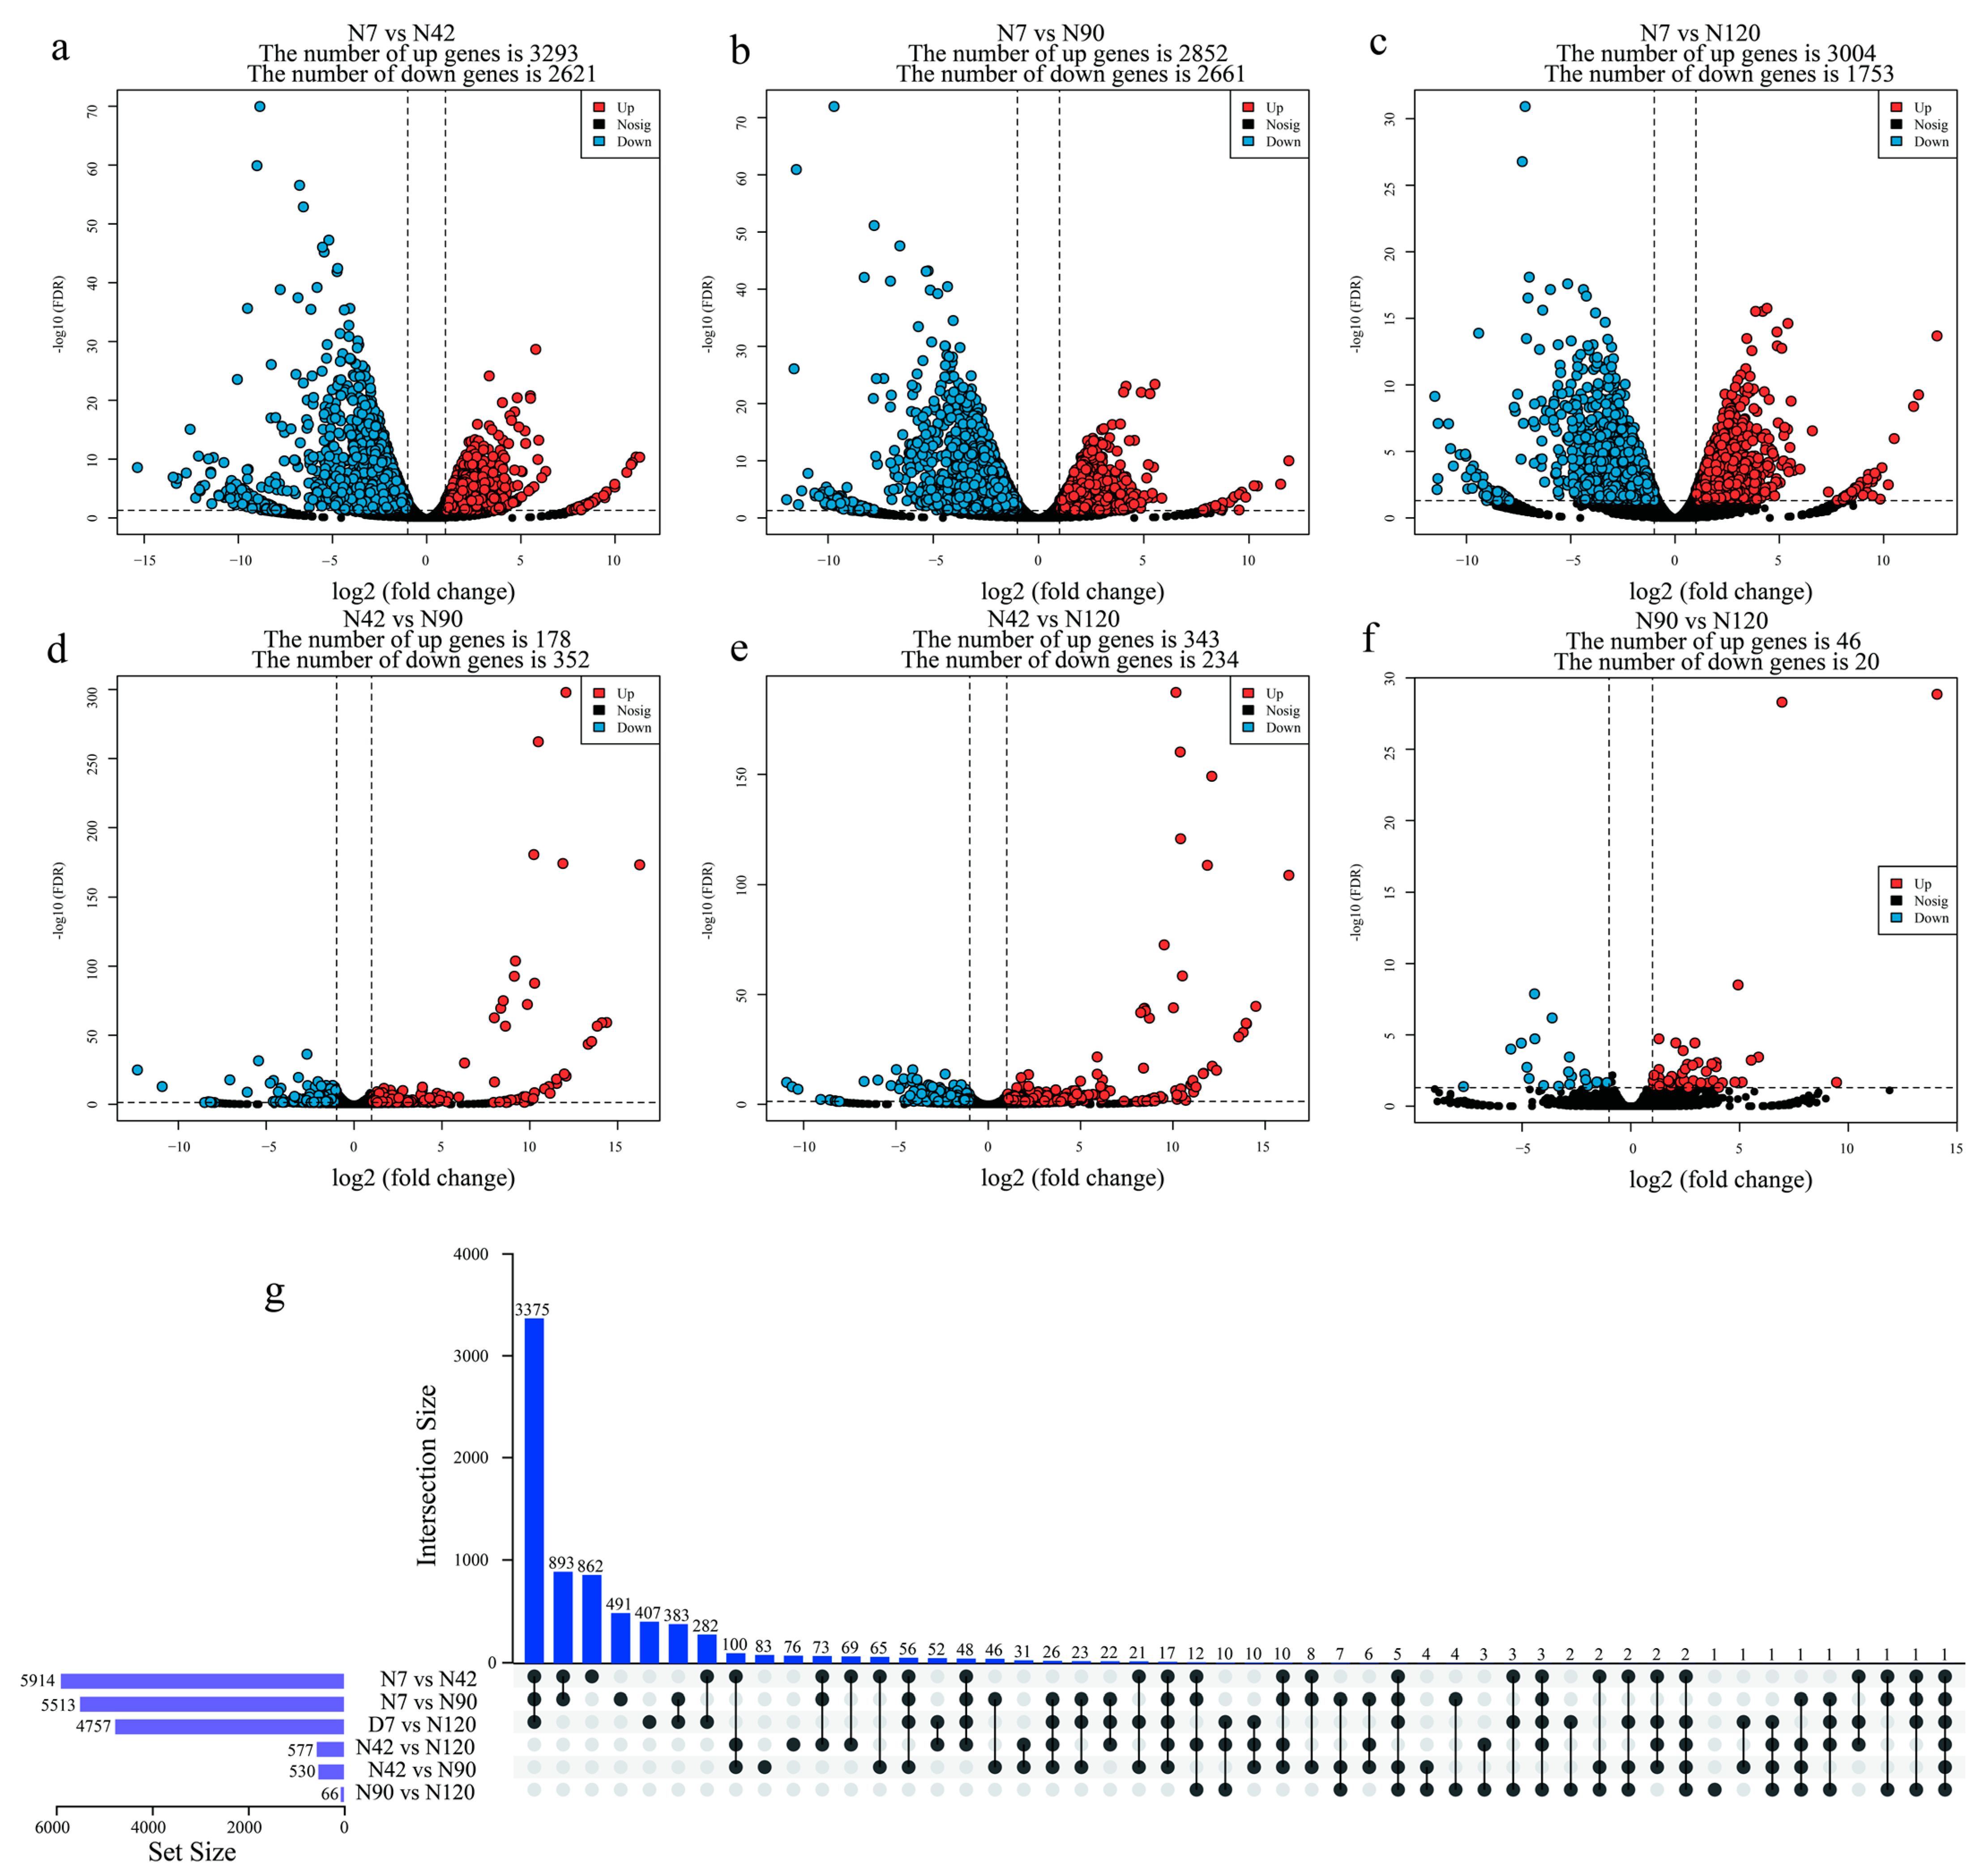
3.3. Identification and Functional Annotation of Differentially Expressed Genes (DEGs) during BF Development

To determine the changes in gene expression during BF development, we comparatively analyzed the expression levels of genes at different developmental stages. A total of 7605 DEGs were identified in six different comparison groups (N7 vs. N42, N7 vs. N90, N7 vs. N120, N42 vs. N90, N42 vs. N120, N90 vs. N120). According to the results, the number of DEGs tended to decrease as the BF developed. The numbers of DEGs for N7 vs. N42, N90 and N120 were 5914 (3293 upregulated genes and 2621 downregulated genes), 5513 (2852 and 2661) and 4575 (3004 and 1753), respectively (Figure 2a–c, Table S3). The results of Upset (Figure 2g) showed that N7 and the other three time points shared 3375 DEGs, while the number of DEGs for N42 vs. N90 and N120 was 530 (178 upregulated and 352 downregulated genes) and 577 (343 and 234), respectively (Figure 2d,e, Table S3). Moreover, 31 of these co-differentially expressed genes were in the N42, N90 and N120 comparison groups. Finally, we identified 66 DEGs (46 upregulated genes and 20 downregulated genes) in the N90 and N120 comparison groups (Figure 2f, Table S3). In all comparison groups, only one DEG showed differential expression between all comparison groups (Figure 2g).

3.4. Functional Analysis of DEGs Using the GO Database

To investigate the functional associations of common DEGs, we performed GO database analysis using the R clusterProfiler package. In the comparison group of N7 and the other three time points separately, we found that the cell cycle, chromosome, supramolecular complex and chromosomal region were significantly enriched (Figure 3a–c, Table S4). Thus, we suggest that at N7, BFs develop and the rapid development of lymphocytes during this period results in the formation of a complete BF structure. In the comparison groups of N42, N90 and N120, the terms extracellular region, response to endogenous stimulus and extracellular space were significantly enriched, respectively (Figure 3d,e, Table S4). Additionally, in the N90 and N120 comparison groups, we found that DEGs were significantly enriched in cell surface, external side of plasma membrane, extracellular region, extracellular region part, extracellular space, lipase inhibitor activity, phospholipase inhibitor activity, specific granule and other terms (Figure 3f, Table S4).

3.5. Functional Analysis of DEGs Using the Kyoto Encyclopedia of Genes and Genomes (KEGG) Database

To elucidate the pathways and metabolic pathways involved in DEGs in each comparator group, clusterProfiler was used for KEGG enrichment. Enrichment results based on DEGs in the N7 and three other time point comparison groups showed that the cell cycle, cellular senescence, focal adhesion, MAPK signaling pathway, AGE-RAGE signaling pathway in diabetic complications, C-type lectin receptor signaling pathway and VEGF signaling pathway were significantly enriched in tissue development-related pathways (Figure 4a–c, Table S5). The differential genes N42, N90 and N120 were mainly enriched in the relaxin signaling, cell adhesion molecules, ECM–receptor interaction, hematopoietic cell lineage and other pathways (Figure 4d,e, Table S5). In addition, differential genes for N90 and N120 were significantly enriched in the rheumatoid arthritis, epithelial cell signaling in Helicobacter pylori infection, NF-kappa B signaling, phagosome and phospholipase D signaling pathways (Figure 4f, Table S5). The IL-8, IGH and LBP, which are included in the NF-kappa B signaling pathway, show upregulation in the later stages of bursal development.

3.6. Functional Analysis of DEGs Using the REACTOME Pathway

REACTOME enrichment analysis of the up- and downregulated DEGs from the N7 and the other three time point comparison groups revealed that the enriched pathways were largely consistent with GO, with most of the upregulated genes involved in mitotic prometaphase, mitotic metaphase and anaphase, resolution of sister chromatid cohesion and other cell and tissue development-related pathways (Figure 5a–c, Table S6). The DEGs identified in N42, N90 and N120 were mainly enriched in the extracellular matrix organization, metabolism of angiotensinogen to angiotensins, activation of matrix metalloproteinases, degradation of the extracellular matrix and release of endostatin-like peptides pathways (Figure 5d,e, Table S6). The DEGs identified by N90 and N120 were enriched in the lactoferrin scavenges iron ions. BPI binds lipopolysaccharides (LPS) on the bacterial surface, complement factor H binds to C3b, factor H displaces Bb in the Cb:Bb complex and complement factor H binds to surface-bound C3b pathways. Factor H binds to the host cell surface and other immune system-related pathways (Figure 5f, Table S6).

3.7. Gene Expression during Different BF Development Stages

To investigate the gene expression patterns during BF development, we performed c-means clustering analysis for 24,357 expressed genes and generated 20 co-expression clusters. Genes in the same cluster showed similar expression patterns. The genes in clusters 1, 10, 3 and 6 were highly expressed at only one of the four developmental stages, indicating that they might have specific functions at the corresponding stages (Figure 6a). Moreover, to understand the kinetics of gene expression during BF development, we used the ImpulseDE2 model to identify the differential expression of all expressed genes at the four time points. This model produced results similar to the differential gene identification; the BFs tended to be similar over time, indicating that they were relatively more stable during the later stages of development (Figure 6b).

3.8. Validation of DEGs by QRT-PCR

To validate the accuracy of RNA-seq, we selected RT-PCR for 16 genes, of which SPP1 [21,22,23], CTNNB1 [24], BMF [25,26], IL10 [27,28], TUBB3 [29], TUBA8 [30], TUBA3E [31], LMNB2 [32,33], MYL9 [34,35], LITAF [36], CDH11 [37,38], MYBL1 [39] and TRAIL [40,41] were shown to be significantly associated with cell proliferation and apoptosis. In addition, BF2, B2M and BF1 are important members of the MHC, which has been shown to be significantly associated with the immune competence of the organism [42,43,44]. The qRT-PCR and RNA-seq results were consistent (Figure 7). Although the measured gene expression patterns differed slightly from those obtained from transcriptome analysis, the trends were essentially the same.

4. Discussion

Understanding physiological changes in the development of the BF is an important step in exploring its developmental process. In a previous study, the medullary lymphocytes of the BFs were largely empty at 4.5 months [13]. The results of this experiment were in accordance with this; the medullary lymphocytes of the BFs were largely empty at 120 d of age. In this study, observations of BF tissue at 7, 42, 90 and 120 d revealed the developmental state of the BF at the four time points.
RNA-seq allows the rapid exploration of key genes associated with specific phenotypes or important biological processes [45,46,47,48]. Therefore, RNA-seq was used in this study to identify a large number of DEGs that play an important role in the regulation of cell development during BF formation. The extracellular matrix (ECM) pathway plays an important role in tissue and organ morphogenesis and in the maintenance of cellular and tissue structure and function. The interaction of substances in the ECM signaling pathway leads to the direct or indirect control of cellular activity [49,50]. Moreover, the MAPK signaling pathway plays an important role in B-cell development [51,52,53,54], along with the Wnt signaling pathway [55]. Genes in the Wnt signaling pathway, including Wnt protein, Frizzled (Fzd) receptor and lymphatic enhancer factor (LEF), have been found to be highly expressed in the progenitor cells of B cells [56,57,58]. Additionally, Fzd-9 knockout mice exhibited a significant reduction in B cells [59]. In this study, the DEGs of the transcriptome by time series revealed that the key signaling pathways involved in cell growth, development and adhesion, such as the Wnt signaling pathway, MAPK signaling pathway and ECM receptor interaction, were significantly enriched. In addition, the category of cell cycle was significant enriched in the early stage of BF development. The previous study showed that the relationship between cell cycle processes and development is complex and characterized by interdependence. At the level of the individual cell, this interrelationship has an impact on pattern formation and cell morphogenesis. At the supracellular level, this interrelationship affects hyphal tissue function and organ growth. In general, developmental signals not only guide cell cycle progression, but also set the framework for cell cycle regulation by identifying cell type-specific cell cycle patterns [60]. At the same time, the enrichment of differentially expressed genes showed that the category of NF-kappa B pathway was significantly enriched in the later stages of bursal development, a result that suggests that the NF-kappa B pathway plays an important role in the degenerative stage of bursal development. Analysis of the genes in the NF-kappa B pathway revealed that IL-8 [61,62], IGH and LBP [63,64,65] showed upregulated expression in the later stages. In addition, the key cell cycle pathway related to development [66] was significantly enriched in the comparison group at N7 compared to other time points, demonstrating that the development of the BF predominantly occurs early in the bursa.
Interestingly, the expression levels of some genes, including SPP1, BMP, IL10, TUBB3 and MYL9, also appear to be different between the four BF development stages. Among the DEGs, SPP1, which is a secreted protein, may mediate the expression of interferon and interleukin-12 [67,68]. Moreover, SPP1, also known as early type 1 T lymphocyte activating protein (ETA-1), may be involved in early BF development through the Toll-like receptor signaling pathway [69,70]. Furthermore, we found that the MHC superfamily members B2M, BF2 and BF1 are also differentially expressed during BF development; however, the exact role they play in BF development requires further study.
The degeneration of the BF is gradually initiated after sexual maturation in birds and is caused by the mature differentiation of B lymphocytes in the BF. SPP1, a gene involved in early BF development, is mainly involved in BF development through the Toll-like receptor signaling pathway [71,72]. It is involved in the regulation of BF development by mediating the expression of interferon and interleukin-12 [73]. In this study, SPP1 was also found to be involved in BF development, mainly through the Toll-like receptor signaling pathway in the early stage of BF development. In addition, the BMF gene, a member of the Bcl-2 family, is an important regulatory factor. The protein includes a BH3-only structural domain, which binds to and releases the anti-apoptotic proteins Bax and Bak, which in turn activate apoptosis [74]. In this study, we found that the expression of BMF continued to increase as the developmental time progressed, and BMF may induce apoptosis in BF cells by participating in the biological process of anoikis.
In conclusion, in this study, we observed the tissue structure of the BF at different developmental stages at the tissue level and found that the growth of the BF showed a process of gradual shrinkage after continued maturation with increasing age. Second, transcriptomic analysis of the time sequences identified a series of genes associated with the development and decline of the BF. However, the specific regulatory mechanisms require further research, and this study lays the foundation for the development and decline of the BF. Overall, this study elucidates the regulatory role of differential genes throughout the process of BF development and atrophy and provides a theoretical basis for selecting more immunocompetent birds through molecular breeding.

Supplementary Materials

The following supporting information can be downloaded at: https://www.mdpi.com/article/10.3390/agriculture12081194/s1, Table S1: Information of RNA-seq data; Table S2: The list of primers used in the present study; Table S3: All DEG expression changes in each comparison group; Table S4: The list of DEGs enriched by KEGG; Table S5: The list of DEGs enriched by GO; Table S6: The list of DEGs enriched by REACTOME.

Author Contributions

L.H., formal analysis, writing—original draft; Y.H., H.B. and G.C., writing—review and editing; Q.G., visualization; H.B. and G.C., funding acquisition. All authors submitted comments on the draft. All authors have read and agreed to the published version of the manuscript.

Funding

This research was supported by the earmarked fund for CARS (grant no. CARS-41-G26) and Open Project of Key Laboratory for Poultry Genetics and Breeding of Jiangsu Province (grant no. JQLAB-KF-202102).

Institutional Review Board Statement

All samples were collected in accordance with the guidelines proposed by the China Council on Animal Care and Ministry of Agriculture of the People’s Republic of China. The study was approved by the Institutional Animal Care and Use Committee and the School of Animal Experiments Ethics Committee (license number: SYXK [Su] IACUC 2012-0029) of Yangzhou University.

Acknowledgments

The authors thank to the supported by the earmarked fund for CARS (grant no. CARS-41-G26) and Open Project of Key Laboratory for Poultry Genetics and Breeding of Jiangsu Province (grant no. JQLAB-KF-202102).

Conflicts of Interest

The authors declare there was no conflict of interest.

References

  1. Paramithiotis, E.; Ratcliffe, M.J. B cell emigration directly from the cortex of lymphoid follicles in the bursa of Fabricius. Eur. J. Immunol. 1994, 24, 458–463. [Google Scholar] [CrossRef] [PubMed]
  2. Islam, M.N.; Khan, M.Z.I.; Jahan, M.; Fujinaga, R.; Yanai, A.; Kokubu, K.; Shinoda, K. Histomorphological study on prenatal development of the lymphoid organs of native chickens of Bangladesh. Pak. Vet. J. 2012, 32, 175–178. [Google Scholar]
  3. Schat, K.A.; Kaspers, B.; Kaiser, P. Avian Immunology, 2nd ed.; Elsevier: Amsterdam, The Netherlands, 2012. [Google Scholar]
  4. Ribatti, D.; Porzionato, A.; Emmi, A.; de Caro, R. The bursa of Hieronymus Fabricius ab Aquapendente: From original iconography to most recent research. Rom. J. Morphol. Embryol. 2020, 61, 583–585. [Google Scholar] [CrossRef] [PubMed]
  5. Glick, B.; Chang, T.S.; Jaap, R.G. The Bursa of Fabricius and Antibody Production. Poult. Sci. 1956, 35, 224–225. [Google Scholar] [CrossRef]
  6. Monson, M.S.; van Goor, A.G.; Ashwell, C.M.; Persia, E.M.; Rothschild, M.F.; Schmidt, C.J.; Lamont, S.J. Immunomodulatory effects of heat stress and lipopolysaccharide on the bursal transcriptome in two distinct chicken lines. BMC Genom. 2018, 19, 643. [Google Scholar] [CrossRef]
  7. Kaspers, B.; Schat, K.; Göbel, T.; Vervelde, L. Avian Immunology, 3rd ed.; Elsevier: Amsterdam, The Netherlands, 2021. [Google Scholar]
  8. Cooper, M.D.; Raymond, D.A.; Peterson, R.D.; South, M.A.; Good, R.A. The functions of the thymus system and the bursa system in the chicken. J. Exp. Med. 1966, 123, 75–102. [Google Scholar] [CrossRef] [Green Version]
  9. Salvi, E.; Buffa, R.; Renda, T.G. Ontogeny, distribution and amine/peptide colocalization of chromogranin A- and B-immunoreactive cells in the chicken gizzard and antrum. Anat. Embryol. 1995, 192, 547–555. [Google Scholar] [CrossRef]
  10. Lassila, O.; Eskola, J.; Toivanen, P. Prebursal stem cells in the intraembryonic mesenchyme of the chick embryo at 7 days of incubation. J. Immunol. 1979, 123, 2091–2094. [Google Scholar]
  11. Otsubo, Y.; Chen, N.; Kajiwara, E.; Horiuchi, H.; Matsuda, H.; Furusawa, S. Role of bursin in the development of B lymphocytes in chicken embryonic Bursa of Fabricius. Dev. Comp. Immunol. 2001, 25, 485–593. [Google Scholar] [CrossRef]
  12. Le Douarin, N.M.; Houssaint, E.; Jotereau, F.V.; Belo, M. Origin of Hemopoietic Stem Cells in Embryonic Bursa of Fabricius and Bone Marrow Studied through Interspecific Chimeras. Proc. Natl. Acad. Sci. USA 1975, 72, 2701–2705. [Google Scholar] [CrossRef] [Green Version]
  13. Pike, K.A.; Baig, E.; Ratcliffe, M.J. The avian B-cell receptor complex: Distinct roles of Igalpha and Igbeta in B-cell development. Immunol. Rev. 2004, 197, 10–25. [Google Scholar] [CrossRef] [PubMed]
  14. Makino, K.; Omachi, R.; Suzuki, H.; Tomobe, K.; Kawashima, T.; Nakajima, T.; Kawashima-Ohya, Y. Apoptosis Occurs during Early Development of the Bursa of Fabricius in Chicken Embryos. Biol. Pharm. Bull. 2014, 37, 1982–1985. [Google Scholar] [CrossRef] [PubMed] [Green Version]
  15. Kim, D.; Langmead, B.; Salzberg, S.L. HISAT: A fast spliced aligner with low memory requirements. Nat. Methods 2015, 12, 357–360. [Google Scholar] [CrossRef] [PubMed] [Green Version]
  16. Love, M.I.; Huber, W.; Anders, S. Moderated estimation of fold change and dispersion for RNA-seq data with DESeq2. Genome Biol. 2014, 15, 550. [Google Scholar] [CrossRef] [PubMed] [Green Version]
  17. Kumar, L.; Futschik, M.E. Mfuzz: A software package for soft clustering of microarray data. Bioinformation 2007, 2, 5–7. [Google Scholar] [CrossRef]
  18. Fischer, D.S.; Theis, F.J.; Yosef, N. Impulse model-based differential expression analysis of time course sequencing data. Nucleic Acids Res. 2018, 46, e119. [Google Scholar] [CrossRef] [Green Version]
  19. Wu, T.; Hu, E.; Xu, S.; Chen, M.; Guo, P.; Dai, Z.; Feng, T.; Zhou, L.; Tang, W.; Zhan, L.; et al. clusterProfiler 4. 0: A universal enrichment tool for interpreting omics data. Innovation 2021, 2, 100141. [Google Scholar]
  20. Bu, D.; Luo, H.; Huo, P.; Wang, Z.; Zhang, S.; He, Z.; Wu, Y.; Zhao, L.; Liu, J.; Guo, J.; et al. KOBAS-i: Intelligent prioritization and exploratory visualization of biological functions for gene enrichment analysis. Nucleic Acids Res. 2021, 49, W317–W325. [Google Scholar] [CrossRef]
  21. Tu, Y.; Chen, C.; Fan, G. Association between the expression of secreted phosphoprotein-related genes and prognosis of human cancer. BMC Cancer 2019, 19, 1230. [Google Scholar] [CrossRef] [Green Version]
  22. Saleh, S.; Thompson, D.E.; McConkey, J.; Murray, P.; Moorehead, R.A. Osteopontin regulates proliferation, apoptosis, and migration of murine claudin-low mammary tumor cells. BMC Cancer 2016, 16, 359. [Google Scholar] [CrossRef] [Green Version]
  23. Dalal, S.; Zha, Q.; Singh, M.; Singh, K. Osteopontin-stimulated apoptosis in cardiac myocytes involves oxidative stress and mitochondrial death pathway: Role of a pro-apoptotic protein BIK. Mol. Cell Biochem. 2016, 418, 22683–22690. [Google Scholar] [CrossRef] [Green Version]
  24. Ming, M.; Wang, S.; Wu, W.; Senyuk, V.; le Beau, M.M.; Nucifora, G.; Qian, Z. Activation of Wnt/β-catenin protein signaling induces mitochondria-mediated apoptosis in hematopoietic progenitor cells. J. Biol. Chem. 2012, 287, 22683–22690. [Google Scholar] [CrossRef] [PubMed] [Green Version]
  25. Grespi, F.; Soratroi, C.; Krumschnabel, G.; Sohm, B.; Ploner, C.; Geley, S.; Hengst, L.; Häcker, G.; Villunger, A. BH3-only protein Bmf mediates apoptosis upon inhibition of CAP-dependent protein synthesis. Cell Death Differ. 2010, 17, 1672–1683. [Google Scholar] [CrossRef] [PubMed]
  26. Piñon, J.D.; Labi, V.; Egle, A.; Villunger, A. Bim and Bmf in tissue homeostasis and malignant disease. Oncogene 2008, 27, S41–S52. [Google Scholar] [CrossRef] [PubMed] [Green Version]
  27. Schmidt, M.; Lügering, N.; Pauels, H.G.; Schulze-Osthoff, K.; Domschke, W.; Kucharzik, T. IL-10 induces apoptosis in human monocytes involving the CD95 receptor/ligand pathway. Eur. J. Immunol. 2000, 30, 1769–1777. [Google Scholar] [CrossRef]
  28. Wang, Z.Q.; Bapat, A.S.; Rayanade, R.J.; Dagtas, A.S.; Hoffmann, M.K. Interleukin-10 induces macrophage apoptosis and expression of CD16 (FcgammaRIII) whose engagement blocks the cell death programme and facilitates differentiation. Immunology 2001, 102, 331–337. [Google Scholar] [CrossRef]
  29. Sadeghi, I.; Behmanesh, M.; Chashmi, N.A.; Sharifi, M.; Soltani, B.M. 6-Methoxy Podophyllotoxin Induces Apoptosis via Inhibition of TUBB3 and TOPIIA Gene Expressions in 5637 and K562 Cancer Cell Lines. Cell J. 2015, 17, 502–509. [Google Scholar]
  30. Di Donato, N.; Timms, A.E.; Aldinger, K.A.; Mirzaa, G.M.; Bennett, J.T.; Collins, S.; Olds, C.; Mei, D.; Chiari, S.; Carvill, G.; et al. Analysis of 17 genes detects mutations in 81% of 811 patients with lissencephaly. Genet. Med. 2018, 20, 1354–1364. [Google Scholar] [CrossRef]
  31. Wu, I.; Shin, S.C.; Cao, Y.; Bender, I.K.; Jafari, N.; Feng, G.; Lin, S.; Cidlowski, J.A.; Schleimer, R.P.; Lu, N.Z. Selective glucocorticoid receptor translational isoforms reveal glucocorticoid-induced apoptotic transcriptomes. Cell Death Dis. 2013, 4, e453. [Google Scholar] [CrossRef]
  32. Zhao, C.-C.; Chen, J.; Zhang, L.-Y.; Liu, H.; Zhang, C.-G.; Liu, Y. Lamin B2 promotes the progression of triple negative breast cancer via mediating cell proliferation and apoptosis. Biosci. Rep. 2021, 41, BSR20203874. [Google Scholar] [CrossRef]
  33. Dong, C.-H.; Jiang, T.; Yin, H.; Song, H.; Zhang, Y.; Geng, H.; Shi, P.-C.; Xu, Y.-X.; Gao, H.; Liu, L.-Y.; et al. LMNB2 promotes the progression of colorectal cancer by silencing p21 expression. Cell Death Dis. 2021, 12, 331. [Google Scholar] [CrossRef] [PubMed]
  34. Feng, M.; Dong, N.; Zhou, X.; Ma, L.; Xiang, R. Myosin light chain 9 promotes the proliferation, invasion, migration and angiogenesis of colorectal cancer cells by binding to Yes-associated protein 1 and regulating Hippo signaling. Bioengineered 2022, 13, 96–106. [Google Scholar] [CrossRef] [PubMed]
  35. Martin, K.; Pritchett, J.; Llewellyn, J.; Mullan, A.F.; Athwal, V.S.; Dobie, R.; Harvey, E.; Zeef, L.; Farrow, S.; Streuli, C.; et al. PAK proteins and YAP-1 signalling downstream of integrin beta-1 in myofibroblasts promote liver fibrosis. Nat. Commun. 2016, 7, 12502. [Google Scholar] [CrossRef] [PubMed]
  36. Shi, Y.; Kuai, Y.; Lei, L.; Weng, Y.; Berberich-Siebelt, F.; Zhang, X.; Wang, J.; Zhou, Y.; Jiang, X.; Ren, G.; et al. The feedback loop of LITAF and BCL6 is involved in regulating apoptosis in B cell non-Hodgkin’s-lymphoma. Oncotarget 2016, 7, 77444–77456. [Google Scholar] [CrossRef] [Green Version]
  37. Alimperti, S.; Andreadis, S.T. CDH2 and CDH11 act as regulators of stem cell fate decisions. Stem. Cell Res. 2015, 14, 270–282. [Google Scholar] [CrossRef] [PubMed] [Green Version]
  38. Li, L.; Ying, J.; Li, H.; Zhang, Y.; Shu, X.; Fan, Y.; Tan, J.; Cao, Y.; Tsao, S.W.; Srivastava, G.; et al. The human cadherin 11 is a pro-apoptotic tumor suppressor modulating cell stemness through Wnt/β-catenin signaling and silenced in common carcinomas. Oncogene 2012, 31, 3901–3912. [Google Scholar] [CrossRef] [Green Version]
  39. Bolcun-Filas, E.; Bannister, L.A.; Barash, A.; Schimenti, K.J.; Hartford, S.A.; Eppig, J.J.; Handel, M.A.; Shen, L.; Schimenti, J.C. A-MYB (MYBL1) transcription factor is a master regulator of male meiosis. Development 2011, 138, 3319–3330. [Google Scholar] [CrossRef] [Green Version]
  40. Allen, J.E.; El-Deiry, W.S. Regulation of the human TRAIL gene. Cancer Biol. Ther. 2012, 13, 1143–1151. [Google Scholar] [CrossRef]
  41. Dai, X.; Zhang, J.; Arfuso, F.; Chinnathambi, A.; Zayed, M.E.; Alharbi, S.A.; Kumar, A.P.; Ahn, K.S.; Sethi, G. Targeting TNF-related apoptosis-inducing ligand (TRAIL) receptor by natural products as a potential therapeutic approach for cancer therapy. Exp. Biol. Med. 2015, 240, 760–773. [Google Scholar] [CrossRef] [Green Version]
  42. Jongsma, M.L.M.; Guarda, G.; Spaapen, R.M. The regulatory network behind MHC class I expression. Mol. Immunol. 2019, 113, 16–21. [Google Scholar] [CrossRef]
  43. Dunon, D.; Salomonsen, J.; Skjødt, K.; Kaufman, J.; Imhof, B.A. Ontogenic appearance of MHC class I (B-F) antigens during chicken embryogenesis. Dev. Immunol. 1990, 1, 127–135. [Google Scholar] [CrossRef] [Green Version]
  44. Cheng, S.; Liu, X.; Mu, J.; Yan, W.; Wang, M.; Chai, H.; Sha, Y.; Jiang, S.; Wang, S.; Ren, Y.; et al. Intense Innate Immune Responses and Severe Metabolic Disorders in Chicken Embryonic Visceral Tissues Caused by Infection with Highly Virulent Newcastle Disease Virus Compared to the Avirulent Virus: A Bioinformatics Analysis. Viruses 2022, 14, 911. [Google Scholar] [CrossRef] [PubMed]
  45. Jax, E.; Wink, M.; Kraus, R.H.S. Avian transcriptomics: Opportunities and challenges. J. Ornithol. 2018, 159, 599–629. [Google Scholar] [CrossRef] [Green Version]
  46. Shah, A.U.; Li, Y.; Ouyang, W.; Wang, Z.; Zuo, J.; Shi, S.; Yu, Q.; Lin, J.; Yang, Q. From nasal to basal: Single-cell sequencing of the bursa of Fabricius highlights the IBDV infection mechanism in chickens. Cell Biosci. 2021, 11, 212. [Google Scholar] [CrossRef] [PubMed]
  47. Zhang, Y.; Zhou, Y.; Sun, G.; Li, K.; Li, Z.; Su, A.; Liu, X.; Li, G.; Jiang, R.; Han, R.; et al. Transcriptome profile in bursa of Fabricius reveals potential mode for stress-influenced immune function in chicken stress model. BMC Genom. 2018, 19, 918. [Google Scholar] [CrossRef]
  48. Rai, M.F.; Cai, L.; Tycksen, E.D.; Chamberlain, A.; Keener, J. RNA-Seq analysis reveals sex-dependent transcriptomic profiles of human subacromial bursa stratified by tear etiology. J. Orthop. Res. 2022. [Google Scholar] [CrossRef]
  49. Lu, P.; Takai, K.; Weaver, V.M.; Werb, Z. Extracellular matrix degradation and remodeling in development and disease. Cold Spring Harb. Perspect. Biol. 2011, 3, a005058. [Google Scholar] [CrossRef]
  50. Poltavets, V.; Kochetkova, M.; Pitson, S.M.; Samuel, M.S. The Role of the Extracellular Matrix and Its Molecular and Cellular Regulators in Cancer Cell Plasticity. Front. Oncol. 2018, 8, 431. [Google Scholar] [CrossRef] [Green Version]
  51. Khiem, D.; Cyster, J.G.; Schwarz, J.J.; Black, B.L. A p38 MAPK-MEF2C pathway regulates B-cell proliferation. Proc. Natl. Acad. Sci. USA 2008, 105, 17067–17072. [Google Scholar] [CrossRef] [Green Version]
  52. Kotelnikova, E.; Kiani, N.A.; Messinis, D.; Pertsovskaya, I.; Pliaka, V.; Bernardo-Faura, M.; Rinas, M.; Vila, G.; Zubizarreta, I.; Pulido-Valdeolivas, I.; et al. MAPK pathway and B cells overactivation in multiple sclerosis revealed by phosphoproteomics and genomic analysis. Proc. Natl. Acad. Sci. USA 2019, 116, 9671–9676. [Google Scholar] [CrossRef] [Green Version]
  53. McLaurin, J.D.; Weiner, O.D. Multiple sources of signal amplification within the B-cell Ras/MAPK pathway. Mol. Biol. Cell 2019, 30, 1610–1620. [Google Scholar] [CrossRef] [PubMed]
  54. Zhang, W.; Liu, H.T. MAPK signal pathways in the regulation of cell proliferation in mammalian cells. Cell Res. 2002, 12, 9–18. [Google Scholar] [CrossRef] [PubMed]
  55. Yu, Q.; Quinn, W.J., 3rd; Salay, T.; Crowley, J.E.; Cancro, M.P.; Sen, J.M. Role of beta-catenin in B cell development and function. J. Immunol. 2008, 181, 3777–3783. [Google Scholar] [CrossRef] [PubMed] [Green Version]
  56. Wu, Q.L.; Zierold, C.; Ranheim, E.A. Dysregulation of Frizzled 6 is a critical component of B-cell leukemogenesis in a mouse model of chronic lymphocytic leukemia. Blood 2009, 113, 3031–3039. [Google Scholar] [CrossRef] [PubMed] [Green Version]
  57. Ljungberg, J.K.; Kling, J.C.; Tran, T.T.; Blumenthal, A. Functions of the WNT Signaling Network in Shaping Host Responses to Infection. Front. Immunol. 2019, 10, 2521. [Google Scholar] [CrossRef]
  58. Pai, S.G.; Carneiro, B.A.; Mota, J.M.; Costa, R.; Leite, C.A.; Barroso-Sousa, R.; Kaplan, J.B.; Chae, Y.K.; Giles, F.J. Wnt/beta-catenin pathway: Modulating anticancer immune response. J. Hematol. Oncol. 2017, 10, 101. [Google Scholar] [CrossRef] [Green Version]
  59. Ranheim, E.A.; Kwan, H.C.K.; Reya, T.; Wang, Y.-K.; Weissman, I.L.; Francke, U. Frizzled 9 knock-out mice have abnormal B-cell development. Blood 2005, 105, 2487–2494. [Google Scholar] [CrossRef]
  60. Coffman, J.A. Cell Cycle Development. Dev. Cell 2004, 6, 321–327. [Google Scholar] [CrossRef] [Green Version]
  61. Hagimoto, N.; Kuwano, K.; Kawasaki, M.; Yoshimi, M.; Kaneko, Y.; Kunitake, R.; Maeyama, T.; Tanaka, T.; Hara, N. Induction of interleukin-8 secretion and apoptosis in bronchiolar epithelial cells by Fas ligation. Am. J. Respir. Cell Mol. Biol. 1999, 21, 436–445. [Google Scholar] [CrossRef] [Green Version]
  62. Kettritz, R.; Gaido, M.L.; Haller, H.; Luft, F.C.; Jennette, C.J.; Falk, R.J. Interleukin-8 delays spontaneous and tumor necrosis factor-alpha-mediated apoptosis of human neutrophils. Kidney Int. 1998, 53, 84–91. [Google Scholar] [CrossRef] [Green Version]
  63. Yu, Y.; Wu, X.; Pu, J.; Luo, P.; Ma, W.; Wang, J.; Wei, J.; Wang, Y.; Fei, Z. Lycium barbarum polysaccharide protects against oxygen glucose deprivation/reoxygenation-induced apoptosis and autophagic cell death via the PI3K/Akt/mTOR signaling pathway in primary cultured hippocampal neurons. Biochem. Biophys. Res. Commun. 2018, 495, 1187–1194. [Google Scholar] [CrossRef] [PubMed]
  64. Li, D.; Wang, W.J.; Wang, Y.Z.; Wang, Y.B.; Li, Y.L. Lobaplatin promotes (125)I-induced apoptosis and inhibition of proliferation in hepatocellular carcinoma by upregulating PERK-eIF2α-ATF4-CHOP pathway. Cell Death Dis. 2019, 10, 744. [Google Scholar] [CrossRef] [PubMed] [Green Version]
  65. Lou, L.; Chen, G.; Zhong, B.; Liu, F. Lycium barbarum polysaccharide induced apoptosis and inhibited proliferation in infantile hemangioma endothelial cells via down-regulation of PI3K/AKT signaling pathway. Biosci. Rep. 2019, 39, BSR20191182. [Google Scholar] [CrossRef] [PubMed] [Green Version]
  66. Duronio, R.J.; Xiong, Y. Signaling pathways that control cell proliferation. Cold Spring Harb. Perspect. Biol. 2013, 5, a008904. [Google Scholar] [CrossRef]
  67. Shan, M.; Yuan, X.; Song, L.Z.; Roberts, L.; Zarinkamar, N.; Seryshev, A.; Zhang, Y.; Hilsenbeck, S.; Chang, S.H.; Dong, C.; et al. Cigarette smoke induction of osteopontin (SPP1) mediates T(H)17 inflammation in human and experimental emphysema. Sci. Transl. Med. 2012, 4, 117ra9. [Google Scholar] [CrossRef] [PubMed] [Green Version]
  68. Poole, D.H.; Ndiaye, K.; Pate, J.L. Expression and regulation of secreted phosphoprotein 1 in the bovine corpus luteum and effects on T lymphocyte chemotaxis. Reproduction 2013, 146, 527–537. [Google Scholar] [CrossRef] [Green Version]
  69. Ashkar, S.; Weber, G.F.; Panoutsakopoulou, V.; Sanchirico, M.E.; Jansson, M.; Zawaideh, S.; Rittling, S.R.; Denhardt, D.T.; Glimcher, M.J.; Cantor, H. Eta-1 (osteopontin): An early component of type-1 (cell-mediated) immunity. Science 2000, 287, 860–864. [Google Scholar] [CrossRef]
  70. Castello, L.M.; Raineri, D.; Salmi, L.; Clemente, N.; Vaschetto, R.; Quaglia, M.; Garzaro, M.; Gentilli, S.; Navalesi, P.; Cantaluppi, V.; et al. Osteopontin at the Crossroads of Inflammation and Tumor Progression. Mediat. Inflamm. 2017, 2017, 4049098. [Google Scholar] [CrossRef]
  71. Prince, C.W.; Oosawa, T.; Butler, W.T.; Tomana, M.; Bhown, A.S.; Bhown, M.; Schrohenloher, R.E. Isolation, characterization, and biosynthesis of a phosphorylated glycoprotein from rat bone. J. Biol. Chem. 1987, 262, 2900–2907. [Google Scholar] [CrossRef]
  72. van Rooij, E.; Sutherland, L.B.; Thatcher, J.E.; DiMaio, J.M.; Naseem, R.H.; Marshall, W.S.; Hill, J.A.; Olson, E.N. Dysregulation of microRNAs after myocardial infarction reveals a role of miR-29 in cardiac fibrosis. Proc. Natl. Acad. Sci. USA 2008, 105, 13027–13032. [Google Scholar] [CrossRef] [Green Version]
  73. Heinemeier, K.M.; Skovgaard, D.; Bayer, M.L.; Qvortrup, K.; Kjaer, A.; Kjaer, M.; Magnusson, S.P.; Kongsgaard, M. Uphill running improves rat Achilles tendon tissue mechanical properties and alters gene expression without inducing pathological changes. J. Appl. Physiol. 2012, 113, 827–836. [Google Scholar] [CrossRef] [PubMed] [Green Version]
  74. Sjöblom, B.; Salmazo, A.; Djinović-Carugo, K. Alpha-actinin structure and regulation. Cell Mol. Life Sci. 2008, 65, 2688–2701. [Google Scholar] [CrossRef] [PubMed]
Figure 1. Histomorphological image of a BF at 4 different stages: 7 d (a), 42 d (b), 90 d (c) and 120 d (d). Magnification = 200×.
Agriculture 12 01194 g001
Figure 2. Volcano plot of differentially expressed genes (DEG) identified by comparison groups. (a) D7 vs. D42; (b) D7 vs. D90, (c) D7 vs. D120, (d) D42 vs. D90, (e) D42 vs. D120, and (f) D90 vs. D120. “Up” and “Down” indicate that the expression levels of the DEGs were significantly (FDR p < 0.05 and |log2FoldChange| > 1) higher and lower in the different comparison groups, respectively. “Nosig” indicates that the expression levels of the genes are not significantly different in the different comparison groups; (g) UpSet plot of the differentially expressed genes (DEGs) of RNA-Seq.
Agriculture 12 01194 g002
Figure 3. Dot plot of DEGs enriched by the GO database. (a) Dot plot of DEGs in the N7 vs. N42 comparison group; (b) dot plot of DEGs in the N7 vs. N90 comparison group; (c) dot plot of DEGs in the N7 vs. N120 comparison group; (d) dot plot of DEGs in the N42 vs. N90 comparison group; (e) dot plot of DEGs in the N42 and N120 comparison group; and (f) dot plot of DEGs in the N90 vs. N120 comparison group.
Agriculture 12 01194 g003
Figure 4. Dot plots of DEGs enriched by KEGG. (a) Dot plot of DEGs in the N7 vs. N42 comparison group; (b) dot plot of DEGs in the N7 vs. N90 comparison group; (c) dot plot of DEGs in the N7 vs. N120 comparison group; (d) dot plot of DEGs in the N42 vs. N90 comparison group; (e) dot plot of DEGs in the N42 vs. N120 comparison group; (f) dot plot of DEGs in the N90 vs. N120 comparison group.
Agriculture 12 01194 g004
Figure 5. Circular plot of DEGs enriched by REACTOME database analysis. (a) Circular plot of DEGs in the N7 vs. N42 comparison group; (b) circular plot of DEGs in the N7 vs. N90 comparison group; (c) circular plot of DEGs in the N7 vs. N120 comparison group; (d) circular plot of DEGs in the N42 vs. N90 comparison group; (e) circular plot of DEGs in the N42 vs. N120 comparison group; (f) circular plot for DEGs in the N90 vs. N120 comparison group.
Agriculture 12 01194 g005
Figure 6. Transcriptome-wide time series cluster of DEGs. (a) Cluster analysis of DEGs based on Mfuzz. (b) The dynamic changes in RNA sequencing (RNA-seq) are sequentially correlated.
Agriculture 12 01194 g006
Figure 7. Expression levels of immune genes verified by both quantitative real-time polymerase chain reaction (qRT-PCR) and RNA sequencing (RNA-seq).
Agriculture 12 01194 g007
Publisher’s Note: MDPI stays neutral with regard to jurisdictional claims in published maps and institutional affiliations.

