Article

Positive Selection and Adaptive Introgression of Haplotypes from Bos indicus Improve the Modern Bos taurus Cattle

by
Qianqian Zhang
1,2,*,
Anna Amanda Schönherz
2,3,
Mogens Sandø Lund
2 and
Bernt Guldbrandtsen
2,4
1
Institute of Biotechnology Research, Beijing Academy of Agriculture and Forestry Sciences, Beijing 100097, China
2
Center for Quantitative Genetics and Genomics, Aarhus University, 8000 Aarhus, Denmark
3
Department of Animal Science, Aarhus University, 8000 Aarhus, Denmark
4
Department of Veterinary and Animal Sciences, Copenhagen University, 1165 Copenhagen, Denmark
*
Author to whom correspondence should be addressed.
Agriculture 2022, 12(6), 844; https://doi.org/10.3390/agriculture12060844
Submission received: 7 April 2022 / Revised: 11 May 2022 / Accepted: 12 May 2022 / Published: 11 June 2022
(This article belongs to the Special Issue Application of Genetics and Genomics in Livestock Production)

Abstract

:
Complex evolutionary processes, such as positive selection and introgression can be characterized by in-depth assessment of sequence variation on a whole-genome scale. Here, we demonstrate the combined effects of positive selection and adaptive introgression on genomes, resulting in observed hotspots of runs of homozygosity (ROH) haplotypes on the modern bovine (Bos taurus) genome. We first confirm that these observed ROH hotspot haplotypes are results of positive selection. The haplotypes under selection, including genes of biological interest, such as PLAG1, KIT, CYP19A1 and TSHB, were known to be associated with productive traits in modern Bos taurus cattle breeds. Among the haplotypes under selection, we demonstrate that the CYP19A1 haplotype under selection was associated with milk yield, a trait under strong recent selection, demonstrating a likely cause of the selective sweep. We further deduce that selection on haplotypes containing KIT variants affecting coat color occurred approximately 250 generations ago. The study on the genealogies and phylogenies of these haplotypes identifies that the introgression events of the RERE and REG3G haplotypes happened from Bos indicus to Bos taurus. With the aid of sequencing data and evolutionary analyses, we here report introgression events in the formation of the current bovine genome.

1. Introduction

Whole-genome sequencing technology and genomic tools provide opportunities to investigate and understand the interplay between complex evolutionary processes, such as positive selection, introgression and inbreeding [1,2,3]. Using genome-wide or genomic region-specific analyses with single base pair resolution, an in-depth understanding of the selective processes shaping patterns of genetic variation in a population can be achieved [4,5,6]. Among these complex processes, positive selection has played a very important role in changing genomes through adaptation driven by frequency changes of favorable alleles in the modern population. Strong selection on favorable alleles often happens in response to environmental changes or diseases. An example of the former is the selection at the lactase locus in humans for the ability to digest milk [7]. In farm animals, strong drivers of adaptation include domestication and recent strong artificial selection for desired phenotypes. Signatures of selection in the genome can be detected through high levels of linkage disequilibrium resulting in extended haplotypes, deviations of allele frequencies from the neutral model and reduced local heterozygosity [8,9]. However, the process of positive selection has its own complexity as it interacts with other evolutionary processes, resulting in distinct patterns of genetic variation. Thus far, there is a poor understanding of the interaction between different complex evolutionary processes on the observed genomic phenomenon for haplotypes on a genome-wide scale, such as the distribution of homozygosity [10]. Here, we study the impact of selection resulting in genomic homozygous haplotypes, known as runs of homozygosity (ROH), in connection to the candidate target regions for positive selection and adaptive introgression.
Domestic cattle is an appealing model to study the effects of demography and positive selection on their genomes resulting in extreme patterns of ROH distribution, because of the known selection history, detailed records and controlled environments. Since domestication from wild aurochs ~10,000 years ago [11,12,13], the bovine genome has been heavily shaped by intensive artificial selection. Selection has been especially strong during the most recent 60 years [14,15], resulting in a significant improvement in milk and meat production as well as changes in disease resistance [1,16,17]. The extreme use of the genetically best sires has left many and clear signals of selection in the cattle genome. It provides opportunities for detecting haplotypes not only under strong positive selection, but also resulting from introgression from other species. These important haplotypes have largely contributed to the improvement of the modern taurine cattle breeds. Evidence already shows that there is pervasive introgression aiding in domestication and adaptation in the Bos species [18]. Hence, these unique conditions make the genome of domestic cattle an excellent model to study how long-term intensive positive selection together with introgression shapes their genomes.
This study used large-scale genome sequencing data from domestic cattle as a model to demonstrate that positive selection can cause uniform ROH haplotype patterns at the population level. We first characterized and compared the distribution of polymorphisms with single-base resolution to quantify genetic diversity in different breeds. We next examined the effects of positive selection on the distribution of ROH in the current domestic cattle population. Based on the length distribution of ROH in the population, we inferred the time-scale of positive selection on specific ROH haplotypes in the population. Finally, we identified introgression events from Bos indicus to Bos taurus by examining the phylogenetics of ROH hotspot haplotypes under positive selection. Overall, we utilized the bovine genome as an excellent and unique model system to demonstrate the effects of demography and positive selection in shaping the occurrence and distribution of ROH in cattle genomes, and provide important and novel insights in inferring genomic footprints from demographic history and positive selection using ROH as a tool from large-scale genomes.
We confirmed these candidate regions under selection using other statistics, such as the integrated haplotype score (iHS), and its interplay with demography, shaping the genomes of modern species.

2. Materials and Methods

2.1. Sequencing and SNP Discovery

A total of 684 bulls with high genetic contributions to the current cattle populations, including 267 Holstein, 102 Fleckvieh, 89 Angus, 34 Jersey, 30 Simmental, 29 Brown Swiss, 26 Charolais, 25 Hereford, 25 Gelbvieh, 17 Finnish Ayrshire, 16 Swedish Red, 15 Danish Red and 9 Belgium Blue, were obtained from the 1000 Bull Genomes Project’s Run4 [19]. Among these, the Danish Red cattle are from the Old Danish Red cattle population [20], and Principal Component analysis (PCA) showed that Simmental and Fleckvieh are separated as different breeds (unpublished results). Animals were selected following the same criteria as Boitard et al. [21]. Sequences of Bos indicus, Gaur, Bison, Wisent, Banteng and Gayal individuals were downloaded from NCBI (for accession numbers, see Data Availability) [5,18].
Sequence reads from sequenced individuals were aligned to the cattle reference genome assembly UMD3.1 [22] using bwa [23]. Duplicate reads were marked using samtools [24]. Local realignment and quality recalibration was performed using the Genome Analysis Toolkit (GATK) [25] following the Human 1000 Genome guidelines, incorporating information from dbSNP [26]. Subsequently, variants were called using HaplotypeCaller from GATK [25] and annotated using information from dbSNP [26]. Only variants with PHRED scores above 100 were kept and indels were excluded from further analyses. Nucleotide diversity was calculated using a sliding window of 10 kbp over the whole genome in all sequenced individuals, following Bosse et al. [27]. We corrected the SNP counts per 10 kbp bin for the number of bases within each 10 kbp bin proportionally to 10,000 covered bases, i.e., bases with coverage between half and twice the average genome coverage. The correction factor was calculated as DP/bin size, where DP = coverage in bp/bin.

2.2. Runs of Homozygosity

ROH were identified on all autosomes of the sequenced individuals using the method developed by Bosse et al. [27]. We set the threshold to declare an ROH as an SNP count maximum of 0.25 times the genome coverage in a window of 10 kbp. Detected ROH were classified into three size categories: (1) short ROH smaller than 100 kbp (size class S); (2) medium ROH between 0.1 and 5 Mbp (size class M); and (3) long ROH longer than 5 Mbp (size class L). For each breed analyzed, the number of ROH in each individual was plotted against the total sum of lengths of the ROH detected in that individual. The number of individuals within each breed and across all breeds sharing an ROH in a sliding window of 100 kb were counted across the whole genome (i.e., ROH hotspot score). Genomic regions where the fraction of individuals sharing an ROH exceeded the 99th percentile of the empirical distribution were defined as ROH hotspots.

2.3. QTL Enrichment

Quantitative trait loci (QTLs) in cattle were extracted from the Animal QTL Database [28]. QTLs on the X chromosome or without locations were excluded. QTLs without references in the Animal QTL Database were excluded [28]. The remaining QTLs were then classified from the Animal QTL Database into six groups by the type of associated trait, i.e., milk, reproduction, production, health, meat and carcass, and exterior traits. The QTLs located within detected ROH hotspots were identified. When two QTLs were found to have the same exact genomic interval or to be in the same associated trait group, they were counted as one QTL. To test whether the enrichment of QTLs in the candidate ROH hotspots was random or not, a permutation test was applied where ROH hotspot regions are simulated in each permutation. Briefly, candidate ROH hotspot regions were randomly distributed across the whole genome 10,000 times. Relative proportion and length of ROH hotspot regions were kept constant to preserve their correlation structure. Next, we repeated trait group assignment of QTLs located within the permuted ROH hotspot regions and computed the number of QTLs in each of the six trait groups. The distribution of numbers of QTLs observed in the permutated ROH hotspot regions was treated as the null distribution, from which we computed the significance levels of the number of QTLs observed in the real data. Moreover, genes located in the candidate ROH hotspots were annotated to the Ensembl Genes 89 Database using BioMart [29] and GO enrichment analysis was performed. The PANTHER classification system [30] was used to identify over-represented biological process-related GO terms. We used the human one-to-one orthologues for all cattle genes, because human genes are annotated more comprehensively. Significance levels were adjusted based on the Benjamini and Hochberg correction [31] for multiple comparisons, implemented in the PANTHER classification system (FDR < 0.05). Finally, the haplotype structure of ROH hotspots was examined among different breeds and species using haplostrips (version 1.1) [32], and phylogenetic trees of genomic sequences in ROH hotspots were constructed using Neighbor-Joining and bootstrapping methods, implemented in MEGA (version X) [33].

2.4. Detection of Selection Signatures

The Integrated Extended Haplotype Homozygosity (EHH) and Integrated Haplotype Score (iHS) statistics [8], as well as the posterior probabilities from the hidden Markov model (HMM) [21], were calculated and obtained within Holstein, Fleckvieh and Angus populations with relatively large sample size. The integrated EHH is a metric to identify genomic regions of excess haplotype homozygosity. It measures the excess of homozygosity due to identity by descent around an ancestral or derived allele of interest [8]. Consequently, an SNP at a very high allele frequency with strong and long-range LD and thus excessive integrated EHH scores indicates recent positive selection that has rapidly brought the haplotype close to fixation in a population. The iHS test identifies chromosome segments where the derived allele occurs at unusually high frequencies, indicating hitchhiking with a selectively favored variant. Unlike the EHH, it requires the definition of ancestral alleles. Integrated EHH statistics, hence, identify genomic regions under selection which have been fixed or are close to fixation, while iHS has high power to identify haplotypes under selection which have not yet been fixed [8]. The posterior probabilities from HMM are a measure of hard-sweep within breed and reported in [21], and were transformed in the following way: log10(p/(1-p)), where p is the posterior probability following [21].
Since the ancestral state of SNPs is usually used for detecting selection, for the dbSNPs from the sequence data, we inferred the ancestral alleles in Bos taurus using the method of Rocha et al. [34], in which the variants in dbSNPs were compared with sheep, water buffalo and yak. In this study, the allele was assigned as ancestral if it was observed at least twice in either sheep, water buffalo or yak. In total, there were 4,839,909 dbSNPs with inferred ancestral states and this information was used to estimate the integrated EHH and iHS scores. Finally, we calculated both the correlations between the integrated EHH scores and the number of individuals sharing an ROH, and the correlations between the iHS scores and the number of individuals sharing an ROH in a window of 100 kb for Holstein, Fleckvieh and Angus populations. The p values of correlations were calculated to determine whether they were significantly different from 0 using the R (http://www.r-project.org/, accessed 20 May 2019) cor and cor.test functions.

2.5. Association Mapping of Haplotypes from the ROH Hotspot Containing the CYP19A1 Gene

Due to its role in mammary gland development [35], we hypothesized that there is a phenotypic effect of the ROH hotspot containing CYP19A1. To test the phenotypic effect, we implemented a haplotype-based mixed linear model test for the effect of haplotypes on milk yield in ROH hotspot haplotypes containing CYP19A1 variants. A total number of 5,199 Holstein individuals with HD genotypes were used to test the haplotype association with de-regressed proofs (DRP) of milk yield. The genotypes from gene CYP19A1 were extracted and phased using Beagle [36]. The following haplotype-based mixed linear model was used: y = 1 μ + Z a + h 1 + h 2 + e , where y was a vector of phenotypes (milk yield); 1 was a vector of ones; μ was the intercept; a was a vector of random polygenic effects following a multivariate normal distributed as a ~ N(0, A σ a 2 ); A was the pedigree-based additive relationship matrix; σ a 2 was the polygenic variance; h1 and h2 were vectors of random haplotype effects, assumed to follow hi~N(0, I σ h 2 ); Z was an incidence matrix, relating phenotypes to the corresponding random polygenic effects; e was the vector of random individual error terms, where e~N(0, I σ e 2 ); I was an identity matrix; and σ h 2 and σ e 2 were the variance of haplotype effects and error variance, respectively. We quantified the significance of the haplotype substitution effect by using the likelihood ratio test, comparing the full haplotype-based association mixed linear model with a null model with mean, polygenic effect and random error term, but without haplotype effects.

3. Results

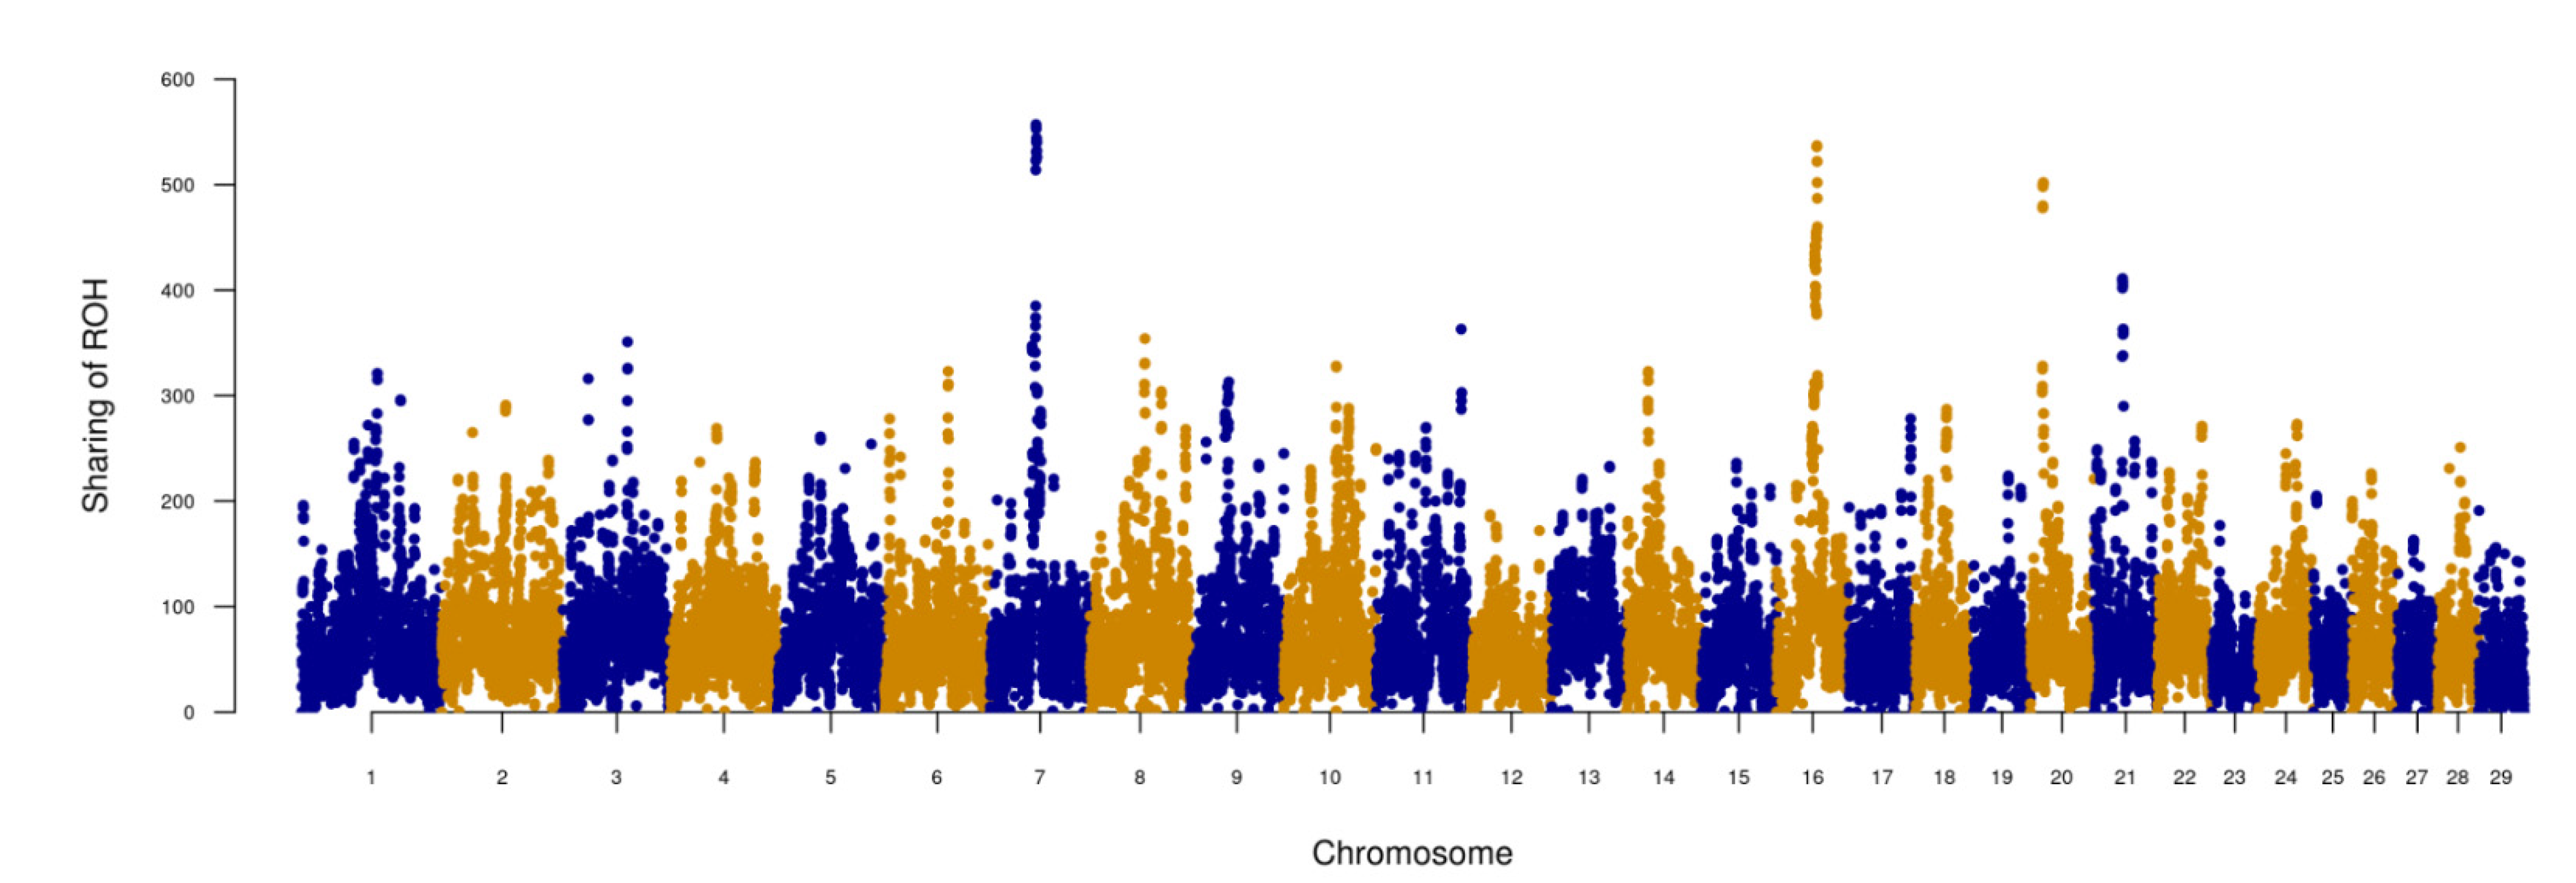
3.1. The Distribution of ROH on Genomes Shaped by Demography

Runs of homozygosity on autosomes were determined for the sequenced cattle individuals from different breeds with a high genetic contribution to the current domestic cattle populations. The samples were grouped based on their breed origin, with Holstein, Jersey, Brown Swiss, Ayrshire Finnish Red, Swedish Red and Danish Red being dairy breeds, Angus, Charolais, Hereford, Gelbvieh and Belgium Blue being beef breeds and Fleckvieh and Simmental being dual-purpose breeds. There was an average number of 1221 ROH per genome, with an average size of 202 kbp across all individuals. The mean number and size of ROH varied from breed to breed, which reflects the different population histories and levels of inbreeding in these populations (Figure 1). The highest mean ROH size of 460 kbp was observed in the Danish Red population, while the lowest mean ROH size of 106 kbp was observed in the Swedish Red population. The highest average number of 2199 ROH was found in Jersey and the lowest average number of 641 ROH was observed in Charolais. On average, across all the populations, 9.39% of the genome was contained in ROH, ranging from 3.59% in Swedish Red cattle to 22.4% in Danish Red cattle, in which the proportion of ROH in the genome is defined as the ROH length divided by the total length of the cattle genome. The proportion of ROH is relatively moderate for Hereford, Jersey and Angus compared with Swedish Red and Danish Red. ROH segments were grouped into three classes (S, M, L) by length. S ROH were the most abundant in number, followed by M ROH and L ROH segments. Clusters of S ROH, i.e., many individuals with ROH at a site, indicate sites of low haplotype diversity, which may result from past or ongoing selection. However, the average total length of S ROH segments across the genome was small compared to the total length of M ROH segments. M ROH were fewer in number, but their average total length across the genome was longest among S, M and L ROH.
To reveal the demographic history of the sequenced populations, we plotted the numbers of ROH against the sum lengths of ROH (Figure 2). Out of 13 cattle breeds, Angus, Jersey, Ayrshire Finnish Red and Simmental showed a medium number of ROH and medium total length in ROH, with most points locating in the middle of the plot (Figure 2). Fleckvieh, Charolais, Brow Swiss and Swedish Red had most points in the lower left corner of the plot, indicating a small number of ROH with a small sum of total ROH length. Danish Red was an extreme case, with a small number of ROH and large total ROH length. For the Holstein population, no clear patterns were observed. Instead, the ROH distribution between Holstein individuals was characterized by large variation, with a few Holstein individuals from the Netherlands showing extreme levels of inbreeding.

3.2. Effect of Positive Selection on ROH Occurrence

The correlations between ROH occurrence and selection signatures were firstly calculated by using integrated EHH, iHS and HMM tests, and ROH hotspot scores for the breeds with large sample size (i.e., Holstein, Angus, and Fleckvieh). Generally, we observed significantly high, positive correlations between the integrated EHH scores for the ancestral and the derived alleles and ROH hotspot scores (Figure S1) (0.54, 0.56 and 0.34 for ancestral alleles for Holstein, Angus and Fleckvieh; 0.47, 0.42 and 0.25 for derived alleles for Holstein, Angus and Fleckvieh, p < 0.01). Similarly, a significantly positive correlation was observed between the transformed posterior probabilities from HMM tests detecting hard sweeps [21] and the ROH hotspot scores on the genome (Figure S2) (0.20 and 0.23 for Holstein and Angus, p < 0.01). In contrast, much smaller, but still significant, correlations were observed between the proportion of SNPs with |iHS| > 2 and ROH hotspot scores in a window of 100 kbp (Figure S3) (0.07, 0.05 and 0.14 for Holstein, Angus and Fleckvieh, p < 0.01). Compared with selective sweeps detected from integrated EHH, HMM and iHS tests, a large proportion of the ROH hotspots were validated as candidate regions under positive selection in either Holstein, Angus or Fleckvieh (Tables S1–S3). For example, the integrated EHH test identified selective sweeps around ROH hotspots including the genes TSHB, RERE and CTNNA1. We confirmed the hypothesis that ROH hotspot scores can be used to detect candidate regions under positive selection.
We next examined the effect of positive selection on ROH occurrence in a genome-wide scale. Several ROH hotspots were observed in the genome (Figure 3). In total, 31 ROH hotspots were identified across the whole genome and a number of annotated genes were located in these ROH hotspots (Table S4). The most pronounced ROH hotspots were observed on chromosomes 7 and 16. They contained the genes RERE and CTNNA1, which were previously found to be under positive selection [37]. The genes CAV1 and TSHB, which are related to mammary gland development, were also located in ROH hotspots, while CAV1 and TSHB have not previously been found to be associated with selective sweeps. Other genes in ROH hotspots, such as PLAG1 and KIT, were associated with well-known signatures of selection [38,39]. Genes such as CYP19A1, CHCHD7, CLSTN1 and SLC25A33 in ROH hotspots were previously identified as candidate genes in hard selective sweep regions in cattle using sequencing data [21]. The GO enrichment analysis of genes located in ROH hotspots revealed a significant over-representation of GO terms related to cellular component organization, including the cellular process and cellular component organization or biogenesis (FDR < 3.35 × 10⁻²). Moreover, enriched QTLs were identified in these ROH hotspots. However, only QTLs associated with health-related traits were significantly enriched in the ROH hotspot regions (p < 0.01).
We further deduced the time-scale of selection of the ROH hotspot candidates under positive selection based on the length of the ROH hotspots (Figure 4). The ROH hotspot around the KIT gene was selected to infer the time-scale of selection due to the role of the KIT gene in the coloring pattern in cattle [40]. The mean length of ROH around KIT was 988 kbp (N = 362). The length (in unit of 100 kbp) of ROH around the KIT gene fitted a chi-squared distribution with 8.2 degrees of freedom corresponding to a mean of 820 kbp. The expected length of shared ROH in the population is 2/Tc, where Tc is the length of ROH haplotypes in Morgan. Therefore, this haplotype seems to have become a target of selection on the order of 250 generations ago.

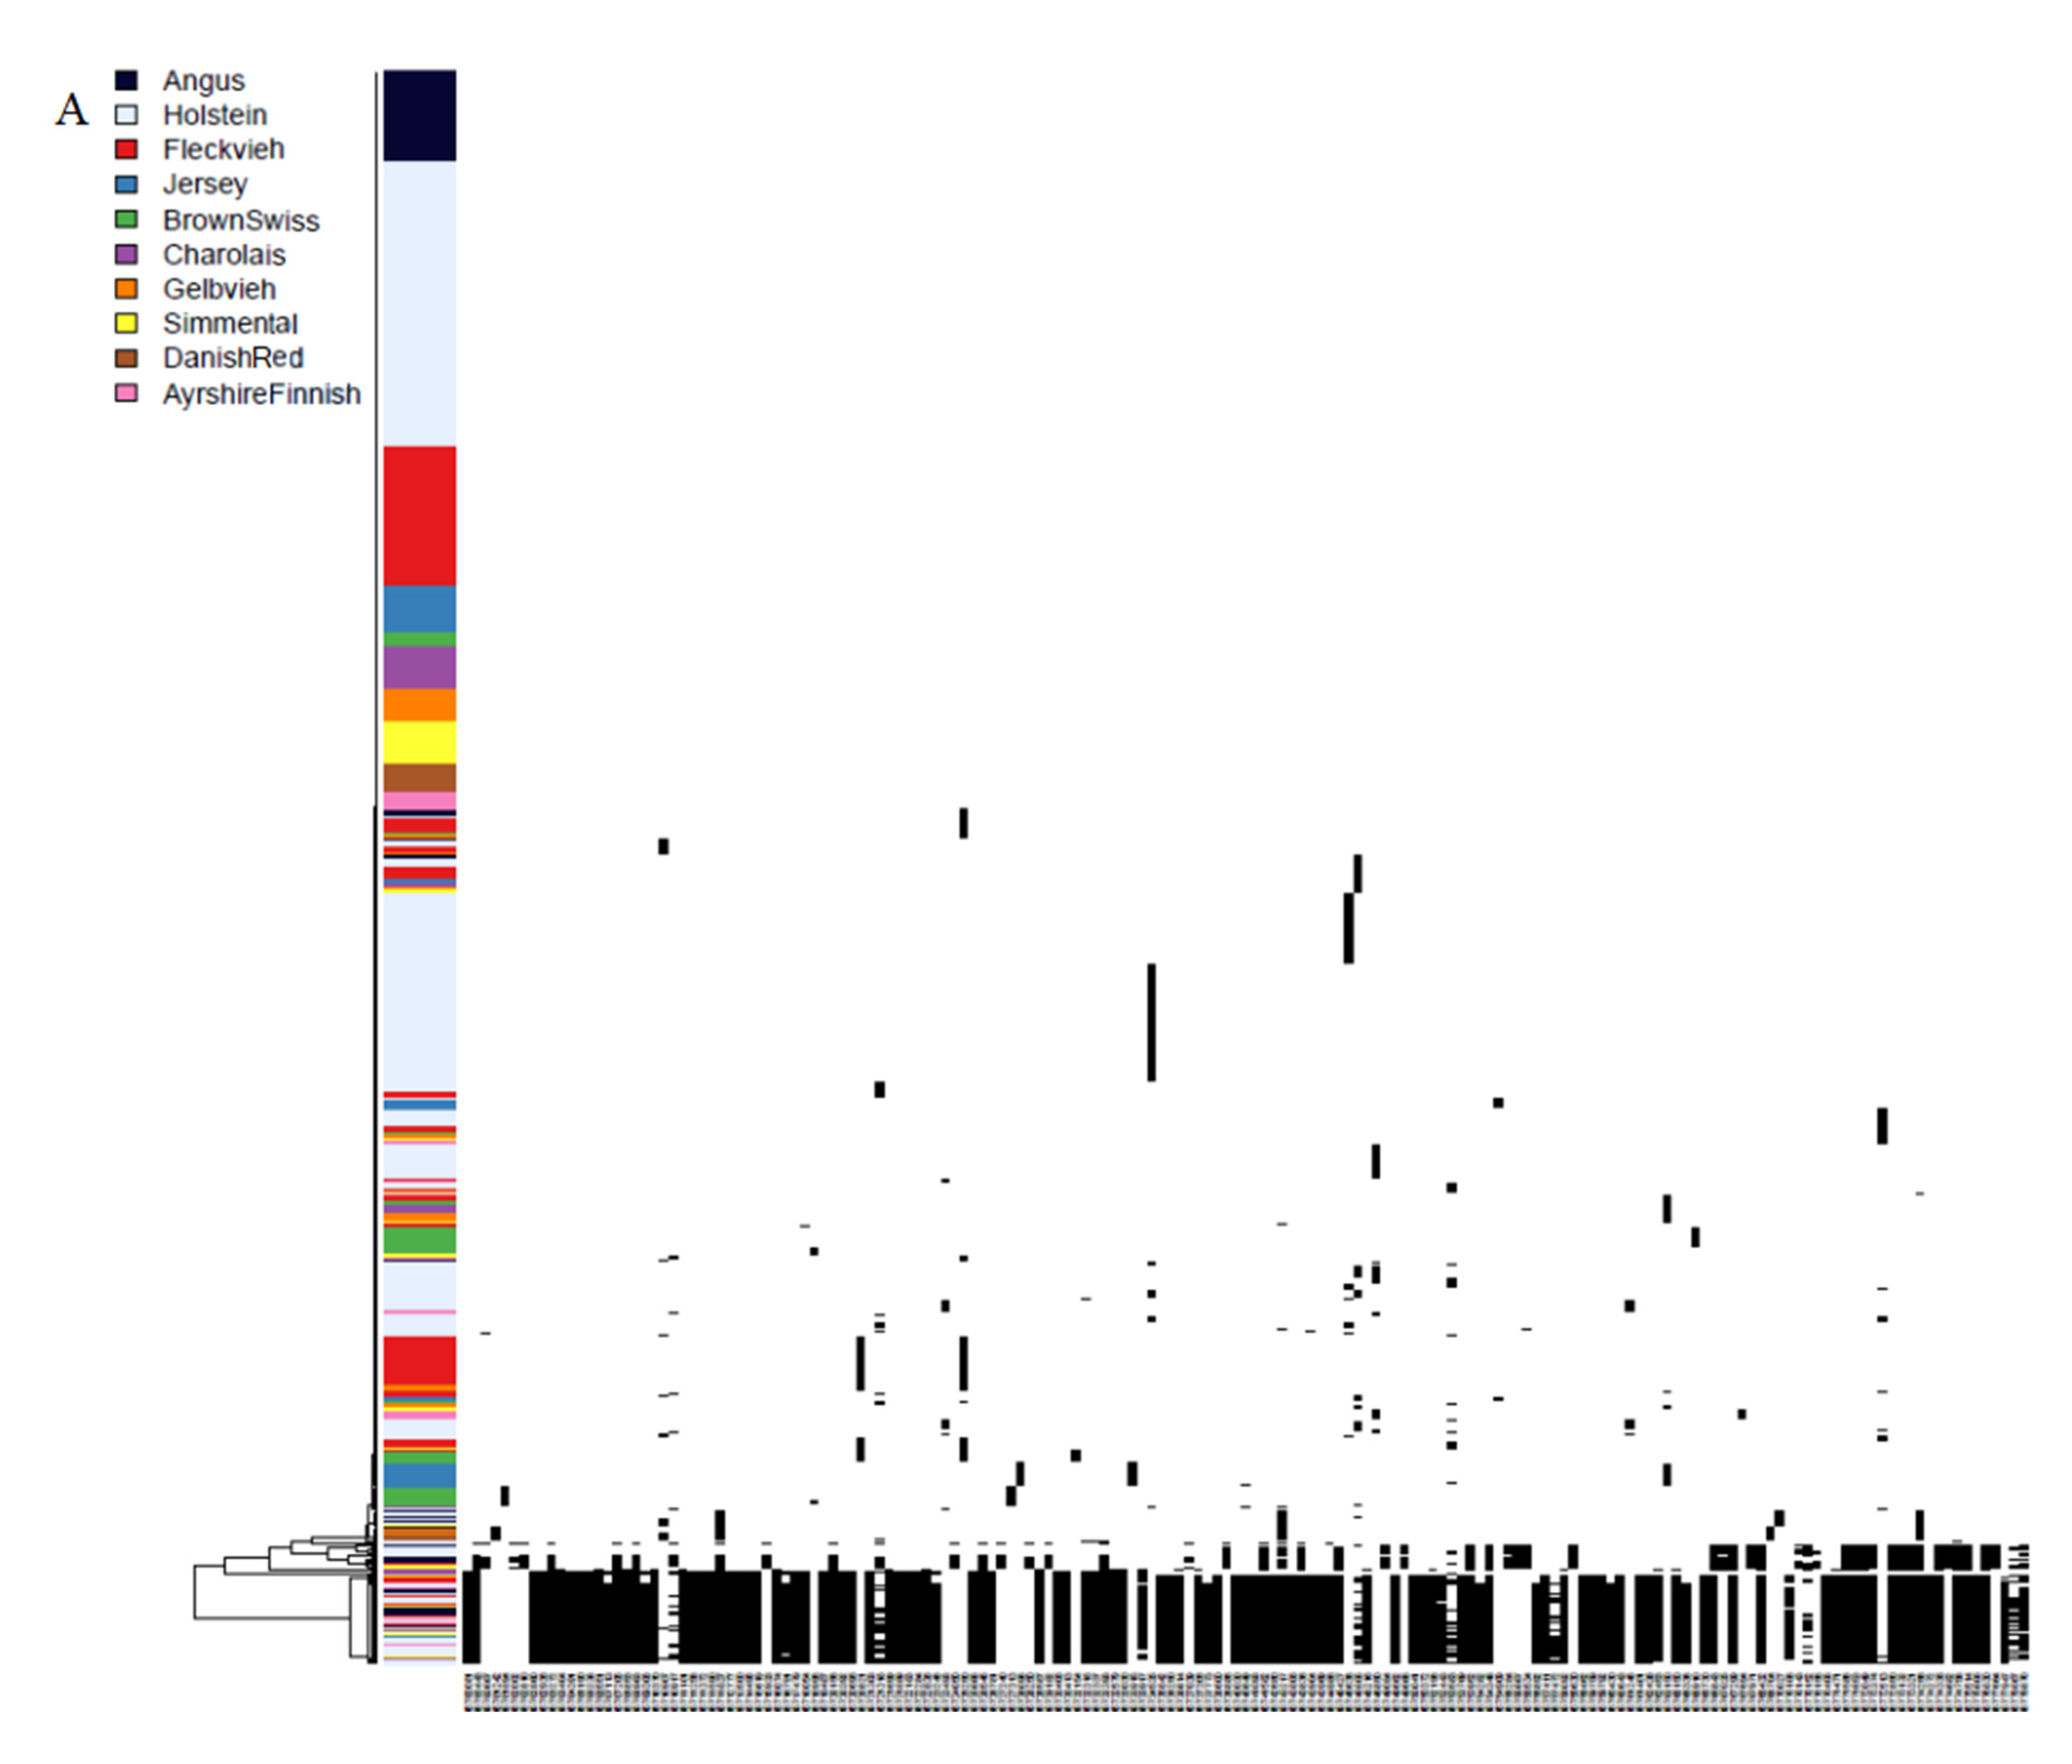
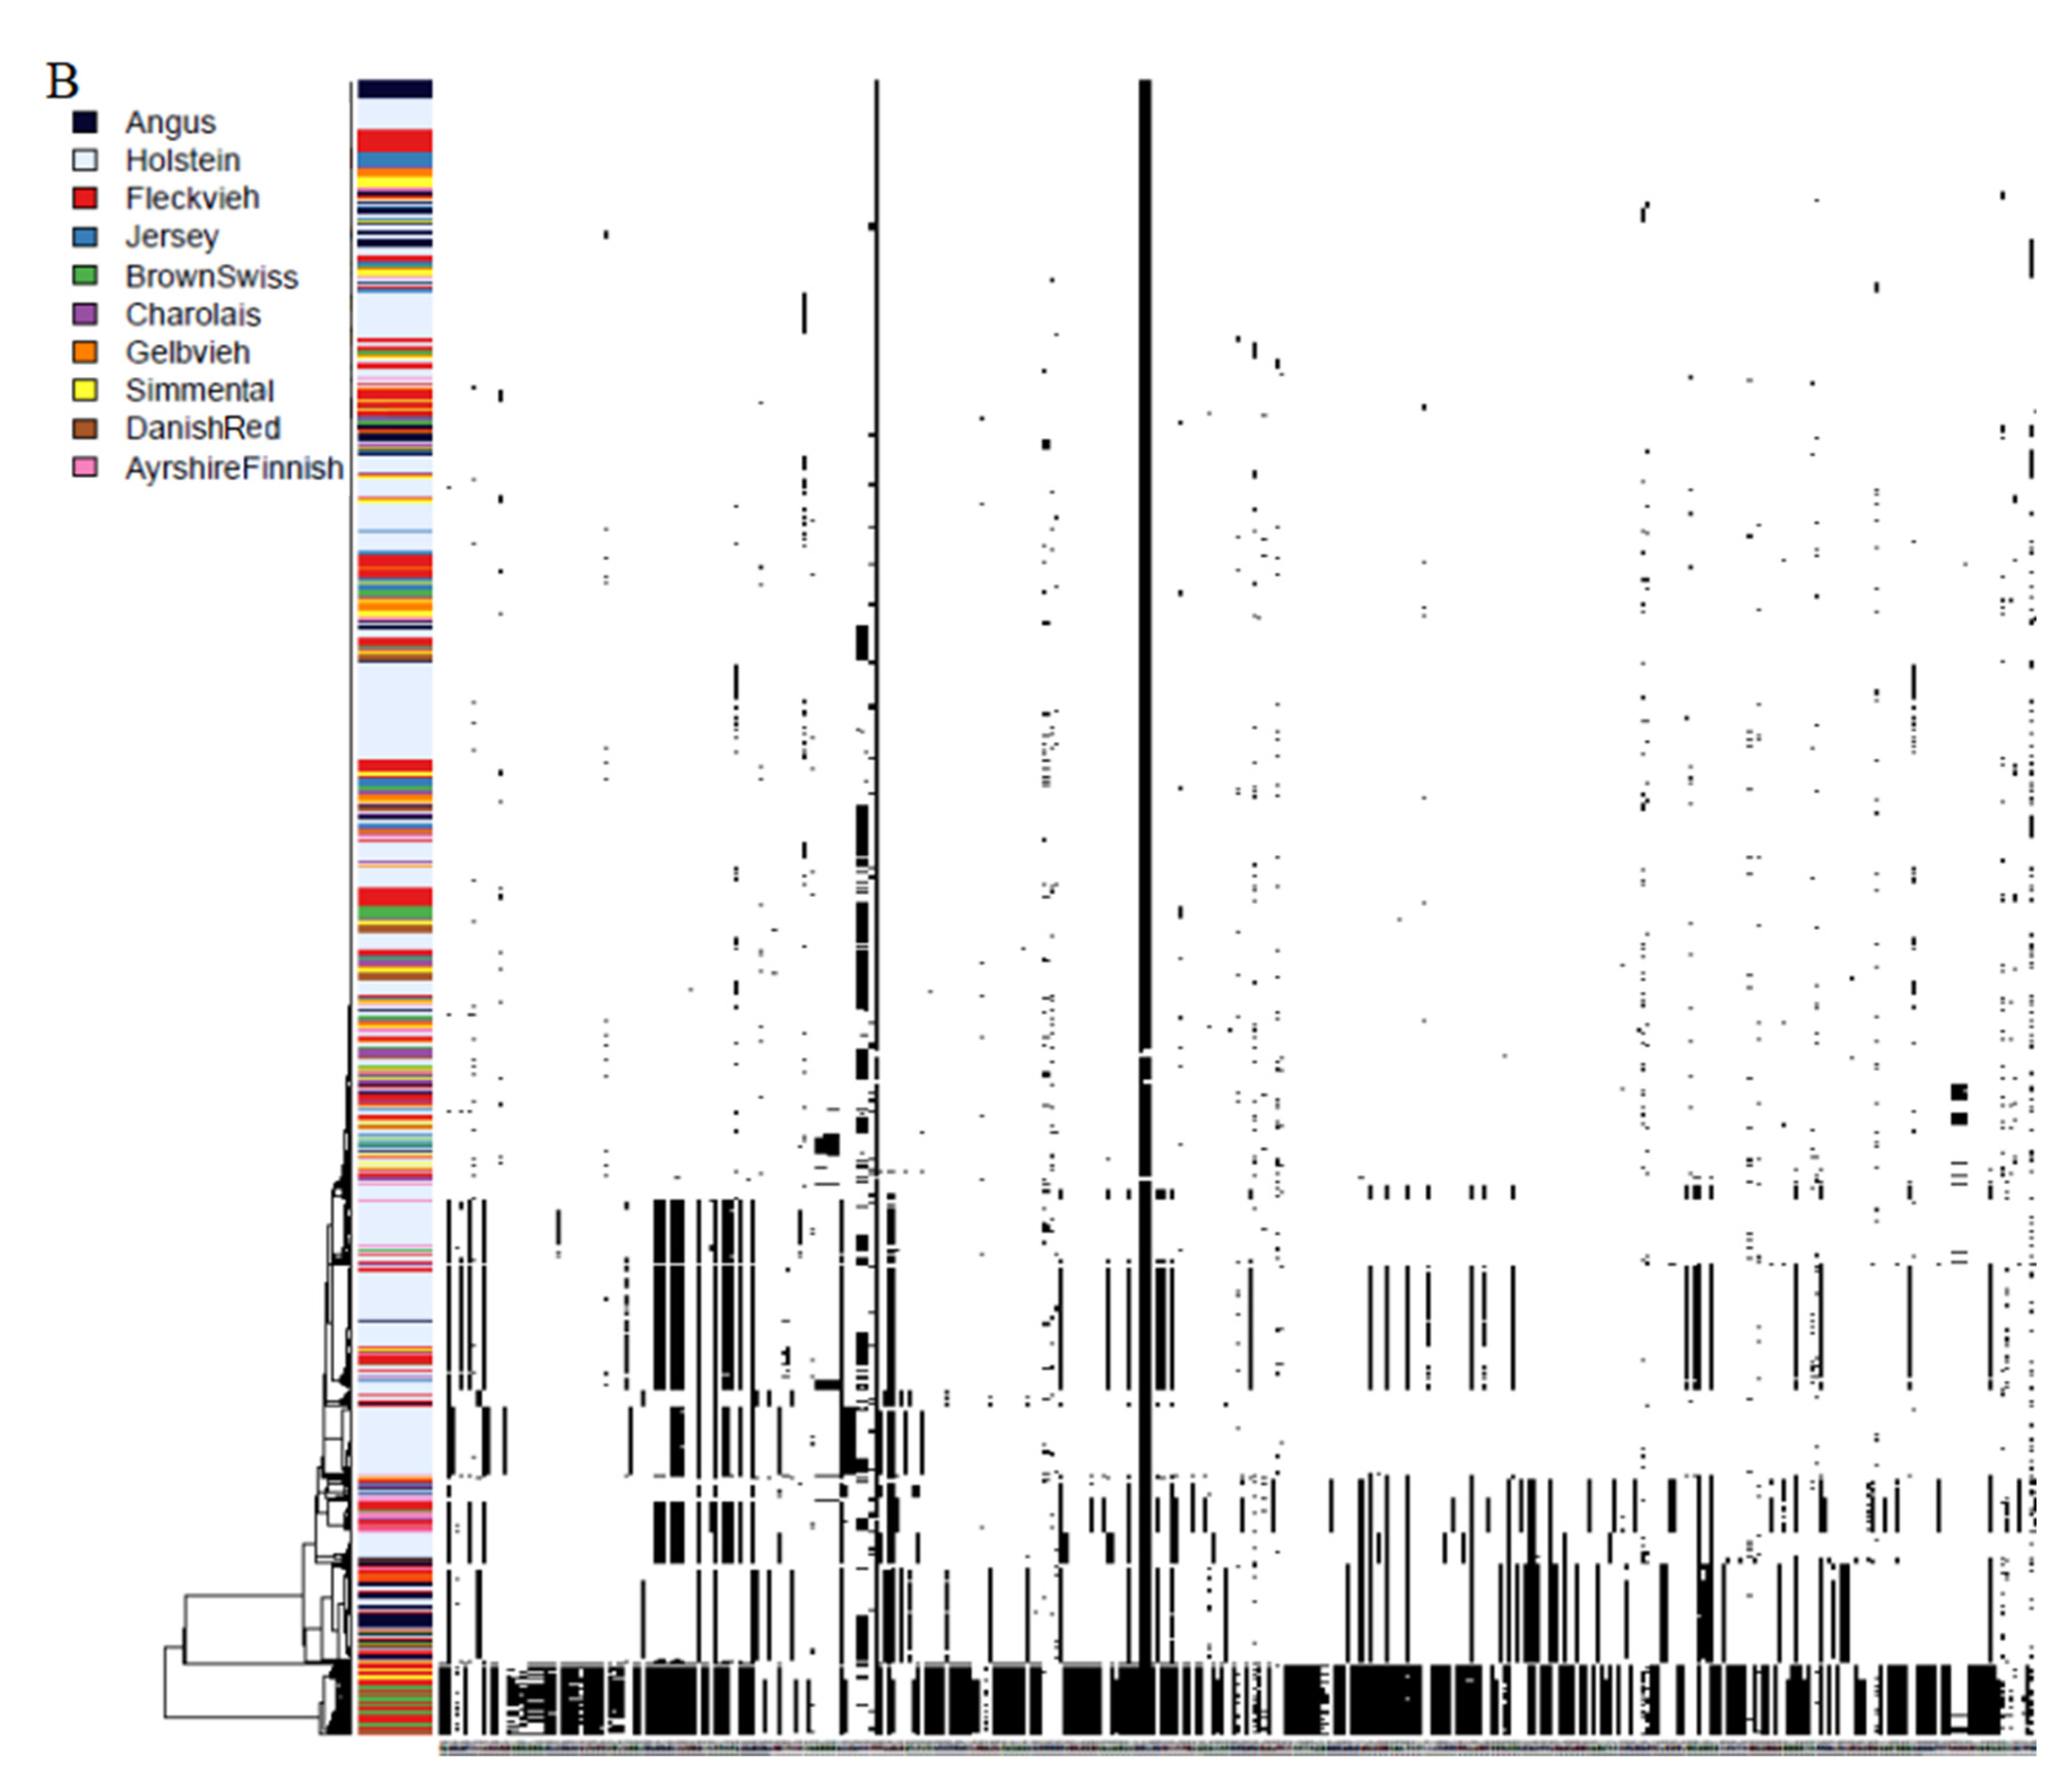
3.3. Phylogenies and Genealogies in ROH Hotspots

We examined the phylogenies and genealogies of haplotype structures in ROH hotspot regions, comparing between different cattle breeds and species including Zebu (Bos indicus), Gaur (Bos gaurus), Bison (Bison bison), Wisent (Bison bonasus), Banteng (Bos javanicus) and Gayal (Bos frontalis). Comparison of Bos taurus genealogies revealed the striking difference between a tree topology with shallow branches for a random haplotype and a tree topology with a very deep branch for a haplotype under selection (Figure 5). Patterns were especially pronounced for the ROH hotspot containing the RERE gene, a selection signature in most Bos taurus breeds (Figure 5A and Figure S5). The genealogy in a non-ROH hotspot is shown for comparison (Figure 5B). The difference in genealogies around RERE compared to the non-ROH region is quite striking. In the ROH hotspot region, the majority of animals, independent of breed origin, clustered within one group of very closely related haplotypes. A few distantly related and rare haplotypes segregate in some Bos taurus breeds. In order to trace the origin of the haplotypes under selection, we examined the haplotype structure across species close to Bos taurus (Figure 6). Some of the haplotypes in the group dominant in Bos taurus RERE were found to be identical to haplotypes observed in Bos indicus, but very different from the haplotypes of Gaur, Bison, Wisent, Banteng and Gayal, as well as the alternative haplotypes in Bos taurus. This suggests that an introgression event happened in the RERE haplotype from Bos indicus to Bos taurus.

3.4. Effect of Haplotype in the ROH Hotspot around the CYP19A1 Gene on Milk Yield

The phenotypic effect of an ROH hotspot potentially under positive selection was examined. We tested the effects of haplotypes in an ROH hotspot containing the CYP19A1 gene on milk yield using 5,199 Holstein individuals under the hypothesis of the important biological role of CYP19A1 in mammary gland development [35]. Four different haplotypes were observed. Haplotypes had significant substitution effects for milk yield in Holstein (p < 0.05) (Table 1). Interestingly, we observed a frequency of 94% of the selectively favored haplotype, with an effect of 0.629 in the Holstein population, while the frequency of the alternative homozygous haplotype with an effect of −0.846 was 5%. This suggested that this selectively favored haplotype with a positive effect on milk yield is under positive selection and nearly fixed in the Holstein population.

4. Discussion

Signatures of positive selection and demographic history in domestic cattle can be studied by examining ROH hotspot scores in their genomes. This makes domestic cattle an excellent model to demonstrate the interplay between positive selection and demography. Studies have shown that the distribution and burden of ROH is highly related to the current or previous population sizes [41,42]. It is expected that there are more and longer ROH segments distributed in populations with non-random mating, while in admixed populations, the number of ROH is reduced and ROH remain short due to the introgression of different haplotypes. Bottlenecks result from increased numbers of short ROH [43,44]. On the other hand, mating of close relatives increases the number of long ROH, while the variance of sum of length of ROH increases [45,46].
Different demographic histories result in the diverse locations of points when plotting the number of ROH and the sum lengths of ROH (Figure 2). In most breeds, we see that most of the animals roughly lie on a line. The slope of this line reflects the average length of ROH. A steep slope corresponds to a short average ROH length, while a shallow slope reflects a long average ROH length. The shorter the average ROH, the longer ago we find their origin. Out of 13 cattle breeds in this study, Angus and Jersey have relatively small populations and have experienced bottlenecks, as indicated by the high fraction of the genome in ROH. Nonetheless, even in Jersey, we find individuals with a very low level of ROH. Fleckvieh, Charolais, Brown Swiss and Swedish Red show very low amounts of ROH. This is consistent with recent admixture in the sequenced individuals [1]. Danish Red exhibits a very shallow line corresponding to very long ROH combined with a very large fraction of the genome in ROH. This reflects a pattern of strong recent inbreeding in Danish Red. In most populations, we see individuals with a low amount of ROH in terms of both total sum and number of ROH, except in Danish Red and Belgian Blue. This probably reflects an absence of admixture in these two breeds. Brown Swiss, Jersey and Hereford contain individuals to the right of the slope, which is evidence of consanguinity among their parents. The Holstein population looks heterogeneous. Points cluster on two lines, one steep and one shallow, reflecting the population structure, with subpopulations being characterized by different ROH patterns and different amounts of inbreeding. However, there are many individuals with points in between the two slopes. Finnish Ayrshire and Simmental probably had larger population sizes in the past, as shown by a steep slope and moderate total length of ROH. The distribution of ROH numbers and lengths illustrates the demographic diversity among cattle breeds.
We observed an abundance of short and medium-sized ROH in cattle genomes in different breeds (Figure 1 and Figure 2). The high occurrence of ROH sites among individuals may be the result of intensive artificial selection, nowadays performed by animal breeders. Selection enacted in the population results in a less diverse haplotype distribution, and thereby more non-randomly distributed ROH in cattle populations are observed. Genomic regions located in an ROH region might be a result of close inbreeding and skewed haplotype spectra [47]. We confirmed the effect of positive selection on most of the ROH hotspots by examining the integrated EHH scores, iHS scores and the posterior probabilities from HMM tests for hard selective sweeps, and correlating them with ROH hotspot scores in these genomic regions. As a whole, these tests confirmed genes PLAG1, KIT, RERE, CAV1, TSHB, CYO19A1, CHCHD7, CLSTN1 and SLC25A33 as likely targets of selection in ROH hotspots. Among these genes, RERE plays an important role in development and in cell survival [48], and histone methyl transferases in regulating gene expression [49], so the different haplotypes in Bos taurus populations in gene RERE might cause different expression levels associated with production or disease. CTNNA1 may play a role in disease susceptibility [50]. CAV1 could regulate the release of milk from the mammary gland during lactation and progress the mammary gland to a mature structure [35], while TSHB was found to be associated with milk fat percentage [51,52]. PLAG1 is associated with calving ease and stature, while KIT is associated with coat color patterning and pigmentation in cattle [40,53].
These results suggest that the occurrence of ROH hotspots is highly positively associated with selective sweeps close to fixation due to the high prevalence of the ROH hotspot haplotypes, but less so with ongoing selection. The relatively lower correlation between integrated EHH scores and ROH hotspot scores in the Fleckvieh population compared with the Holstein population suggests a difference in selection, such as selection intensity, in Holstein compared with the Fleckvieh population. To correlate the ROH hotspots with phenotypes, we performed a QTL enrichment analysis and we observed a significant enrichment of health-related QTLs in ROH hotspots in bovine genomes. This suggests that ROH hotspot regions in cattle are more associated with health-related traits. Furthermore, an overrepresentation of GO terms related to cellular component organization was observed. It implies that the different haplotypes in genes located in ROH hotspots might result in an abnormality within a specific cell component, thereby causing a disease [54,55]. However, it is noticeable that the ROH hotspot regions are probably more related to selective sweeps close to fixation through positive selection. Hence, SNPs located in ROH hotspots are no longer segregating in the populations and are therefore difficult to detect in a QTL mapping study. CYP19A1 plays a biological role in female gonad development, mammary gland development and the development of male sexual characteristics [35]. The widespread occurrence of ROH around CYP19A1 agrees with strong artificial selection on the milk- or fertility-related traits in dairy cattle.
We examined and reported the time-scale of positive selection, phylogenies and genealogies and phenotypic effects in one ROH hotspot. The time-scale of selection in ROH hotspots can be inferred by examining the length distribution of ROH hotspots across individuals. The mean length of ROH from the common ancestor is inversely proportional to the number of generations since the most recent common ancestor giving rise to the ROH [56]. Thereby, we are able to deduce an approximate selection time-scale based on the length distribution of the ROH across individuals. The haplotype containing KIT variants was used as an example to demonstrate the time-scale in an ROH hotspot. The selection acting on the haplotype containing KIT variants seems to have started around 250 generations or 1250 years ago, assuming a generation interval of 5 years. Haplotypes containing KIT variants are associated with the color patterns. This suggests an onset of selection around the 7th century CE.
Our observed result suggests a possible introgression from Bos indicus to Bos taurus for a haplotype of the ROH hotspot region containing the RERE gene (Figure 6), where we identified that the RERE haplotype of Bos indicus is identical to a haplotype in Bos taurus. A second potential introgression event from Bos indicus to Bos taurus was detected for the ROH hotspot containing the REG3G gene (Figure S4). Gene REG3G is associated with the immune response to pathogens and bacteria by stimulating toll-like receptors (TLRs) [57], suggesting that this possible introgression, followed by subsequent selection, improved the fitness and disease resistance in Bos taurus. The widespread distribution of nearly identical haplotypes in Bos taurus demonstrates that this haplotype has been under recent intensive selection in Bos taurus. The introgressed haplotype is highly represented in several cattle breeds; thus, it is a strong indication of adaptive introgression. However, very different haplotypes are still present in some Bos taurus breeds. This supports that the direction of introgression is from Bos indicus to Bos taurus—and not vice versa. Finally, we observed that an ROH hotspot containing CYP19A1 was associated with a signal of positive selection. Haplotypes in this region were associated with effects on milk yield. This provides a likely explanation for the selective force creating the selection signature.

5. Conclusions

Our study demonstrates that the formation and distribution of ROH in bovine populations is highly influenced by demography and positive selection. We illustrate that strong positive selection strongly shapes the occurrence of ROH and, for the first time, show the phylogenies in ROH hotspots, timing of selection on ROH hotspots and the phenotypic haplotype effects of ROH hotspots under strong selection in bovine populations. These ROH hotspots are very likely to significantly influence the fitness and economic traits of individuals in the population. We demonstrate that ROH hotspots are positively correlated with selective sweeps close to fixation. This highlights the importance of positive selection on shaping ROH distributions across individuals. Moreover, it sheds light on the importance of including effects of positive selection when estimating inbreeding from ROH using whole-genome sequence data. We provide an example with strong evidence of a significant association between ROH haplotypes under positive selection and milk yield in cattle populations, strongly supporting our findings. Furthermore, we show ROH as a tool to study the effects of demography, introgression and positive selection in the bovine population; however, it is generally applicable for any species. We highlight the importance of effects of positive selection and demography on shaping ROH localization on genomes in a domestic population under strong artificial selection for long time.

Supplementary Materials

The following supporting information can be downloaded at: https://www.mdpi.com/article/10.3390/agriculture12060844/s1. Figure S1: The ROH hotspots scores plot against integrative extended haplotype homozygosity (EHH) scores for ancestral and derived alleles in Holstein population. a. ancestral alleles; b. derived alleles; Figure S2: The ROH hotspots scores plot against the posterior probabilities from the hidden Markov model (HMM) measuring hard sweeps for holstein and angus populations. a. Holstein population; b. Angus population; Figure S3: The ROH hotspots scores plot against integrated haplotype scores (iHS) for Holstein and angus populations. a. Holstein population; b. Angus population; Figure S4: Haplotype structure and phylogenies of haplotypes from an ROH hotspot region containing the REG3G gene for Bos taurus (Holstein, Angus and Fleckvieh), Bos indicus (Zebu), Gaur, Bison, Banteng, Wisent and Gayal. Left panel: the genealogy of REG3G haplotypes. Right panel: the haplotype structure around the REG3G gene. Colored blocks indicate the origin of haplotypes. The two alleles at each bi-allelic SNP are shown as black or white lines. Figure S5: The genealogies tree of RERE haplotypes from MEGA. Table S1: Candidate selective sweep regions comparing between the ROH hotspots scores and integrative extended haplotype homozygosity (EHH) scores for Holstein and angus and fleckvieh populations; Table S2: Candidate selective sweep regions comparing between the ROH hotspots scores and integrated haplotype scores (iHS) for Holstein and angus and fleckvieh populations; Table S3: Candidate selective sweep regions comparing between the ROH hotspots scores and the posterior probabilities from the hidden Markov model (HMM) measuring hard sweeps for Holstein and angus populations; Table S4: ROH hotspots candidate regions and annotated genes in the regions.

Author Contributions

Q.Z. developed and planned the design of the study, coordinated the study, performed data analyses and drafted the manuscript. A.A.S. and B.G. participated in the design of the study and drafting of the manuscript. M.S.L. participated in the design of the study. All authors have read and agreed to the published version of the manuscript.

Funding

We are grateful to the Nordic Cattle Genetic Evaluation (NAV, Aarhus, Denmark) for providing the phenotypic data used in this study and 1000 Bull Genome Project for providing sequence data. Qianqian Zhang benefited from a joint grant from the European Commission within the framework of the Erasmus-Mundus joint doctorate “EGS-ABG”. This research was supported by the Center for Genomic Selection in Animals and Plants (GenSAP) funded by Innovation Fund Denmark (grant 0603-00519B) and Beijing Nova program from Beijing Academy of Science and Technology, Beijing, China (grant Z20110000682091).

Institutional Review Board Statement

Not applicable.

Informed Consent Statement

Not applicable.

Data Availability Statement

The data used in this study originated from the 1000 Bull Genome Project (Daetwyler et al. 2014 Nature Genet. 46:858-865). Whole-genome sequence data of individual bulls of the 1000 Bull Genomes Project are available at NCBI using SRA no. SRP039339 (http://www.ncbi.nlm.nih.gov/bioproject/PRJNA238491, access 10 January 2022). The whole-genome sequence data from Bos indicus, Gaur, Bison, Wisent, Banteng and Gayal individuals were download from NCBI with SRA number: SRR6423855, SRR6448720, SRR6448721, SRR6448737, SRR6448738, SRR6448739, SRR6448740, SRR6448732, SRR6448733, SRR6448734, SRR6448735, SRR6448580, SRR6448581, SRR6448670, SRR6448682, SRR6448683, SRR6448684.

Acknowledgments

We thank Simon Biotard and Marlies Dolezal for the help in sample data selection and helpful discussions, Thomas Bataillon and Doug Speed for helpful discussions and Amanda Chamberlain for the help in running the script to process the bam files.

Conflicts of Interest

The authors declare that they have no competing interests.

References

  1. Zhang, Q.; Calus, M.P.L.; Bosse, M.; Sahana, G.; Lund, M.S.; Guldbrandtsen, B. Human-Mediated Introgression of Haplotypes in a Modern Dairy Cattle Breed. Genetics 2018, 209, 1305–1317. [Google Scholar] [CrossRef] [PubMed] [Green Version]
  2. Figueiró, H.V.; Li, G.; Trindade, F.J.; Assis, J.; Pais, F.; Fernandes, G.; Santos, S.H.D.; Hughes, G.M.; Komissarov, A.; Antunes, A.; et al. Genome-wide signatures of complex introgression and adaptive evolution in the big cats. Sci. Adv. 2017, 3, e1700299. [Google Scholar] [CrossRef] [PubMed] [Green Version]
  3. Jones, E.R.; Gonzalez-Fortes, G.; Connell, S.; Siska, V.; Eriksson, A.; Martiniano, R.; McLaughlin, R.; Llorente, M.G.; Cassidy, L.M.; Gamba, C.; et al. Upper Palaeolithic genomes reveal deep roots of modern Eurasians. Nat. Commun. 2015, 6, 8912. [Google Scholar] [CrossRef] [PubMed] [Green Version]
  4. Pearson, R.D.; Amato, R.; Auburn, S.; Miotto, O.; Almagro-Garcia, J.; Amaratunga, C.; Suon, S.; Mao, S.; Noviyanti, R.; Trimarsanto, H.; et al. Genomic analysis of local variation and recent evolution in Plasmodium vivax. Nat. Genet. 2016, 48, 959–964. [Google Scholar] [CrossRef]
  5. Chen, N.; Cai, Y.; Chen, Q.; Li, R.; Wang, K.; Huang, Y.; Hu, S.; Huang, S.; Zhang, H.; Zheng, Z.; et al. Whole-genome resequencing reveals world-wide ancestry and adaptive introgression events of domesticated cattle in East Asia. Nat. Commun. 2018, 9, 1–13. [Google Scholar] [CrossRef]
  6. Pool, J.E.; Hellmann, I.; Jensen, J.D.; Nielsen, R. Population genetic inference from genomic sequence variation. Genome Res. 2010, 20, 291–300. [Google Scholar] [CrossRef] [Green Version]
  7. Bersaglieri, T.; Sabeti, P.C.; Patterson, N.; Vanderploeg, T.; Schaffner, S.F.; Drake, J.A.; Rhodes, M.; Reich, D.E.; Hirschhorn, J.N. Genetic signatures of strong recent positive selection at the lactase gene. Am. J. Hum. Genet. 2004, 74, 1111–1120. [Google Scholar] [CrossRef] [Green Version]
  8. Voight, B.F.; Kudaravalli, S.; Wen, X.Q.; Pritchard, J.K. A map of recent positive selection in the human genome. PLoS Biol. 2006, 4, 446–458. [Google Scholar]
  9. Sabeti, P.C.; Varilly, P.; Fry, B.; Lohmueller, J.; Hostetter, E.; Cotsapas, C.; Xie, X.; Byrne, E.H.; McCarroll, S.A.; Gaudet, R. Genome-wide detection and characterization of positive selection in human populations. Nature 2007, 449, 913–918. [Google Scholar] [CrossRef]
  10. Ellegren, H.; Galtier, N. Determinants of genetic diversity. Nat. Rev. Genet. 2016, 17, 422–433. [Google Scholar] [CrossRef] [Green Version]
  11. Loftus, R.T.; MacHugh, D.E.; Bradley, D.G.; Sharp, P.M.; Cunningham, P. Evidence for two independent domestications of cattle. Proc. Natl. Acad. Sci. USA 1994, 91, 2757–2761. [Google Scholar] [CrossRef] [PubMed] [Green Version]
  12. Bollongino, R.; Burger, J.; Powell, A.; Mashkour, M.; Vigne, J.-D.; Thomas, M. Modern Taurine Cattle Descended from Small Number of Near-Eastern Founders. Mol. Biol. Evol. 2012, 29, 2101–2104. [Google Scholar] [CrossRef] [PubMed]
  13. Götherström, A.; Anderung, C.; Hellborg, L.; Galil, R.; Smith, E.C.; Bradley, D.G.; Ellegren, H. Cattle domestication in the Near East was followed by hybridization with aurochs bulls in Europe. Proc. R. Soc. B Boil. Sci. 2005, 272, 2660. [Google Scholar] [CrossRef] [Green Version]
  14. Flori, L.; Fritz, S.; Jaffrézic, F.; Boussaha, M.; Gut, I.; Heath, S.; Foulley, J.-L.; Gautier, M. The Genome Response to Artificial Selection: A Case Study in Dairy Cattle. PLoS ONE 2009, 4, e6595. [Google Scholar] [CrossRef] [Green Version]
  15. Pryce, J.E.; Daetwyler, H.D. Designing dairy cattle breeding schemes under genomic selection: A review of international research. Anim. Prod. Sci. 2012, 52, 107–114. [Google Scholar] [CrossRef] [Green Version]
  16. Hayes, B.; Bowman, P.; Chamberlain, A.; Goddard, M. Invited review: Genomic selection in dairy cattle: Progress and challenges. J. Dairy Sci. 2009, 92, 433–443. [Google Scholar] [CrossRef] [Green Version]
  17. Berglund, B. Genetic improvement of dairy cow reproductive performance. Reprod. Domest. Anim. 2008, 43, 89–95. [Google Scholar] [CrossRef]
  18. Wu, D.-D.; Ding, X.-D.; Wang, S.; Wójcik, J.; Zhang, Y.; Tokarska, M.; Li, Y.; Wang, M.-S.; Faruque, O.; Nielsen, R.; et al. Pervasive introgression facilitated domestication and adaptation in the Bos species complex. Nat. Ecol. Evol. 2018, 2, 1139–1145. [Google Scholar] [CrossRef]
  19. Daetwyler, H.D.; Capitan, A.; Pausch, H.; Stothard, P.; van Binsbergen, R.; Brøndum, R.F.; Liao, X.; Djari, A.; Rodriguez, S.C.; Grohs, C.; et al. Whole-genome sequencing of 234 bulls facilitates mapping of monogenic and complex traits in cattle. Nat. Genet. 2014, 46, 858–865. [Google Scholar] [CrossRef]
  20. Zhang, Q.; Guldbrandtsen, B.; Bosse, M.; Lund, M.S.; Sahana, G. Runs of homozygosity and distribution of functional variants in the cattle genome. BMC Genom. 2015, 16, 542. [Google Scholar] [CrossRef] [Green Version]
  21. Boitard, S.; Boussaha, M.; Capitan, A.; Rocha, D.; Servin, B. Uncovering Adaptation from Sequence Data: Lessons from Genome Resequencing of Four Cattle Breeds. Genetics 2016, 203, 433–450. [Google Scholar] [CrossRef] [PubMed] [Green Version]
  22. Zimin, A.V.; Delcher, A.L.; Florea, L.; Kelley, D.R.; Schatz, M.C.; Puiu, D.; Hanrahan, F.; Pertea, G.; van Tassell, C.P.; Sonstegard, T.S.; et al. A whole-genome assembly of the domestic cow, Bos taurus. Genome Biol. 2009, 10, R42. [Google Scholar] [CrossRef] [PubMed] [Green Version]
  23. Li, H.; Durbin, R. Fast and accurate short read alignment with Burrows–Wheeler transform. Bioinformatics 2009, 25, 1754–1760. [Google Scholar] [CrossRef] [PubMed] [Green Version]
  24. Li, H.; Handsaker, B.; Wysoker, A.; Fennell, T.; Ruan, J.; Homer, N.; Marth, G.; Abecasis, G.; Durbin, R.; Proc GPD. The Sequence Alignment/Map format and SAMtools. Bioinformatics 2009, 25, 2078–2079. [Google Scholar] [CrossRef] [PubMed] [Green Version]
  25. McKenna, A.; Hanna, M.; Banks, E.; Sivachenko, A.; Cibulskis, K.; Kernytsky, A.; Garimella, K.; Altshuler, D.; Gabriel, S.; Daly, M.; et al. The Genome Analysis Toolkit: A MapReduce framework for analyzing next-generation DNA sequencing data. Genome Res. 2010, 20, 1297–1303. [Google Scholar] [CrossRef] [PubMed] [Green Version]
  26. Sherry, S.T.; Ward, M.-H.; Kholodov, M.; Baker, J.; Phan, L.; Smigielski, E.M.; Sirotkin, K. dbSNP: The NCBI database of genetic variation. Nucleic Acids Res. 2001, 29, 308–311. [Google Scholar] [CrossRef] [PubMed] [Green Version]
  27. Bosse, M.; Megens, H.-J.; Madsen, O.; Paudel, Y.; Frantz, L.A.F.; Schook, L.B.; Crooijmans, R.P.M.A.; Groenen, M.A.M. Regions of Homozygosity in the Porcine Genome: Consequence of Demography and the Recombination Landscape. PLoS Genet. 2012, 8, e1003100. [Google Scholar] [CrossRef] [Green Version]
  28. Hu, Z.-L.; Park, C.A.; Reecy, J.M. Developmental progress and current status of the Animal QTLdb. Nucleic Acids Res. 2016, 44, D827–D833. [Google Scholar] [CrossRef] [Green Version]
  29. Kinsella, R.J.; Kähäri, A.; Haider, S.; Zamora, J.; Proctor, G.; Spudich, G.; Almeida-King, J.; Staines, D.; Derwent, P.; Kerhornou, A.; et al. Ensembl BioMarts: A hub for data retrieval across taxonomic space. Database 2011, 2011, bar030. [Google Scholar] [CrossRef]
  30. Mi, H.; Huang, X.; Muruganujan, A.; Tang, H.; Mills, C.; Kang, D.; Thomas, P.D. PANTHER version 11: Expanded annotation data from Gene Ontology and Reactome pathways, and data analysis tool enhancements. Nucleic Acids Res. 2017, 45, D183–D189. [Google Scholar] [CrossRef] [Green Version]
  31. Benjamini, Y.; Yekutieli, D. The control of the false discovery rate in multiple testing under dependency. Ann. Stat. 2001, 29, 1165–1188. [Google Scholar] [CrossRef]
  32. Marnetto, D.; Huerta-Sánchez, E. Haplostrips: Revealing population structure through haplotype visualization. Methods Ecol. Evol. 2017, 8, 1389–1392. [Google Scholar] [CrossRef] [Green Version]
  33. Tamura, K.; Dudley, J.; Nei, M.; Kumar, S. MEGA4: Molecular evolutionary genetics analysis (MEGA) software version 4.0. Mol. Biol. Evol. 2007, 24, 1596–1599. [Google Scholar] [CrossRef] [PubMed]
  34. Rocha, D.; Billerey, C.; Samson, F.; Boichard, D.; Boussaha, M. Identification of the putative ancestral allele of bovine single-nucleotide polymorphisms. J. Anim. Breed. Genet. 2014, 131, 483–486. [Google Scholar] [CrossRef] [PubMed]
  35. Uyttendaele, H.; Soriano, J.V.; Montesano, R.; Kitajewski, J. Notch4 and Wnt-1 proteins function to regulate branching morphogenesis of mammary epithelial cells in an opposing fashion. Dev. Biol. 1998, 196, 204–217. [Google Scholar] [CrossRef] [Green Version]
  36. Browning, S.R.; Browning, B.L. Rapid and accurate haplotype phasing and missing-data inference for whole-genome association studies by use of localized haplotype clustering. Am. J. Hum. Genet. 2007, 81, 1084–1097. [Google Scholar] [CrossRef] [Green Version]
  37. Gutiérrez-Gil, B.; Arranz, J.J.; Wiener, P. An interpretive review of selective sweep studies in Bos taurus cattle populations: Identification of unique and shared selection signals across breeds. Front. Genet. 2015, 6, 167. [Google Scholar] [CrossRef] [Green Version]
  38. Pausch, H.; Flisikowski, K.; Jung, S.; Emmerling, R.; Edel, C.; Götz, K.-U.; Fries, R. Genome-Wide Association Study Identifies Two Major Loci Affecting Calving Ease and Growth-Related Traits in Cattle. Genetics 2011, 187, 289–297. [Google Scholar] [CrossRef] [Green Version]
  39. Karim, L.; Takeda, H.; Lin, L.; Druet, T.; Arias, J.A.C.; Baurain, D.; Cambisano, N.; Davis, S.R.; Farnir, F.; Grisart, B.; et al. Variants modulating the expression of a chromosome domain encompassing PLAG1 influence bovine stature. Nat. Genet. 2011, 43, 405–413. [Google Scholar] [CrossRef]
  40. Hou, L.; Panthier, J.-J.; Arnheiter, H. Signaling and transcriptional regulation in the neural crest-derived melanocyte lineage: Interactions between KIT and MITF. Development 2000, 127, 5379–5389. [Google Scholar] [CrossRef]
  41. Kirin, M.; McQuillan, R.; Franklin, C.S.; Campbell, H.; McKeigue, P.M.; Wilson, J.F. Genomic Runs of Homozygosity Record Population History and Consanguinity. PLoS ONE 2010, 5, e13996. [Google Scholar] [CrossRef] [PubMed] [Green Version]
  42. Purfield, D.C.; Berry, D.P.; McParland, S.; Bradley, D.G. Runs of homozygosity and population history in cattle. BMC Genet. 2012, 13, 70. [Google Scholar] [CrossRef] [PubMed] [Green Version]
  43. Pemberton, T.J.; Absher, D.; Feldman, M.W.; Myers, R.M.; Rosenberg, N.A.; Li, J.Z. Genomic Patterns of Homozygosity in Worldwide Human Populations. Am. J. Hum. Genet. 2012, 91, 275–292. [Google Scholar] [CrossRef] [PubMed] [Green Version]
  44. Von Holdt, B.M.; Pollinger, J.P.; Earl, D.A.; Knowles, J.C.; Boyko, A.R.; Parker, H.; Geffen, E.; Pilot, M.; Jedrzejewski, W.; Jedrzejewska, B.; et al. A genome-wide perspective on the evolutionary history of enigmatic wolf-like canids. Genome Res. 2011, 21, 1294–1305. [Google Scholar] [CrossRef] [PubMed] [Green Version]
  45. Ferenčaković, M.; Hamzic, E.; Gredler, B.; Solberg, T.R.; Klemetsdal, G.; Curik, I.; Sölkner, J. Estimates of autozygosity derived from runs of homozygosity: Empirical evidence from selected cattle populations. J. Anim. Breed. Genet. 2013, 130, 286–293. [Google Scholar] [CrossRef] [PubMed]
  46. Curik, I.; Ferenčaković, M.; Sölkner, J. Inbreeding and runs of homozygosity: A possible solution to an old problem. Livest. Sci. 2014, 166, 26–34. [Google Scholar] [CrossRef]
  47. Qanbari, S.; Simianer, H. Mapping signatures of positive selection in the genome of livestock. Livest. Sci. 2014, 166, 133–143. [Google Scholar] [CrossRef]
  48. Fregeau, B.; Kim, B.J.; Hernandez-Garcia, A.; Jordan, V.K.; Cho, M.T.; Schnur, R.E.; Monaghan, K.G.; Juusola, J.; Rosenfeld, J.A.; Bhoj, E.; et al. De Novo Mutations of RERE Cause a Genetic Syndrome with Features that Overlap Those Associated with Proximal 1p36 Deletions. Am. J. Hum. Genet. 2016, 98, 963–970. [Google Scholar] [CrossRef] [Green Version]
  49. Kim, B.J.; Scott, D.A. Mouse Model Reveals the Role of RERE in Cerebellar Foliation and the Migration and Maturation of Purkinje Cells. PLoS ONE 2014, 9, e87518. [Google Scholar] [CrossRef] [Green Version]
  50. Sheikh, F.; Chen, Y.; Liang, X.; Hirschy, A.; Stenbit, A.E.; Gu, Y.; Dalton, N.D.; Yajima, T.; Lu, Y.C.; Knowlton, K.U.; et al. Alpha-E-Catenin inactivation disrupts the cardiomyocyte adherens junction, resulting in cardiomyopathy and susceptibility to wall rupture. Circulation 2006, 114, 1046–1055. [Google Scholar] [CrossRef]
  51. Cochran, S.D.; Cole, J.B.; Null, D.J.; Hansen, P.J. Discovery of single nucleotide polymorphisms in candidate genes associated with fertility and production traits in Holstein cattle. BMC Genet. 2013, 14, 49. [Google Scholar] [CrossRef] [PubMed] [Green Version]
  52. Ortega, M.S.; Denicol, A.C.; Cole, J.B.; Null, D.J.; Taylor, J.F.; Schnabel, R.D.; Hansen, P.J. Association of single nucleotide polymorphisms in candidate genes previously related to genetic variation in fertility with phenotypic measurements of reproductive function in Holstein cows. J. Dairy Sci. 2017, 100, 3725–3734. [Google Scholar] [CrossRef] [PubMed]
  53. Hayes, B.J.; Pryce, J.; Chamberlain, A.J.; Bowman, P.J.; Goddard, M.E. Genetic Architecture of Complex Traits and Accuracy of Genomic Prediction: Coat Colour, Milk-Fat Percentage, and Type in Holstein Cattle as Contrasting Model Traits. PLoS Genet. 2010, 6, e1001139. [Google Scholar] [CrossRef] [PubMed] [Green Version]
  54. Christofidou, P.; Nelson, C.; Nikpay, M.; Qu, L.; Li, M.; Loley, C.; Debiec, R.; Braund, P.S.; Denniff, M.; Charchar, F.; et al. Runs of Homozygosity: Association with Coronary Artery Disease and Gene Expression in Monocytes and Macrophages. Am. J. Hum. Genet. 2015, 97, 228–237. [Google Scholar] [CrossRef] [Green Version]
  55. Ghani, M.; Reitz, C.; Cheng, R.; Vardarajan, B.N.; Jun, G.; Sato, C.; Naj, A.C.; Rajbhandary, R.; Wang, L.-S.; Valladares, O.; et al. Association of Long Runs of Homozygosity with Alzheimer Disease Among African American Individuals. JAMA Neurol. 2015, 72, 1313–1323. [Google Scholar] [CrossRef] [Green Version]
  56. Fisher, R.A. A Fuller Theory of Junctions in Inbreeding. Heredity 1954, 8, 187–197. [Google Scholar] [CrossRef]
  57. Abreu, M.T. Toll-like receptor signalling in the intestinal epithelium: How bacterial recognition shapes intestinal function. Nat. Rev. Immunol. 2010, 10, 131–143. [Google Scholar] [CrossRef]
Figure 1. General statistics of ROH distribution in sequenced populations. (A) The proportion of the genome in ROH, the average ROH size and the number of ROH segments in the genome. (B) The number of ROH segments classified as short (S; red), medium (M; green) and long (L; blue) ROH. (C) The sum length of ROH segments classified as short (S), medium (M) and long (L) ROH.
Agriculture 12 00844 g001aAgriculture 12 00844 g001b
Figure 2. The number of ROH plotted against the sum of ROH in sequenced populations. The x axis shows the total length of ROH in bp. The y axis shows the total number of ROH in the genome. Each dot represents one individual.
Agriculture 12 00844 g002
Figure 3. The ROH hotspot scores across all the sequenced individuals. The x axis shows the chromosome location on the 29 bovine autosomes. The y axis shows the number of animals with an ROH at this position (i.e., ROH hotspot scores). The total number of animals examined was 684. Each dot represents the count in windows of 100 kb.
Agriculture 12 00844 g003
Figure 4. The distribution of ROH hotspot haplotype length in the KIT gene. The x axis is the length of ROH in units of 100 kbp. The red curve indicates the density function for a chi-squared distribution with parameter of degrees of freedom of 8.2 fitted to the distribution of lengths of ROH.
Agriculture 12 00844 g004
Figure 5. Haplotype structure and genealogies of haplotypes containing RERE variants located in ROH hotspots in different Bos taurus populations. (A) The structure and genealogies of haplotypes containing RERE gene. (B) The haplotype structure and genealogies in a non-ROH hotspot (chromosome 7:21,100,000–21,180,000 bp). The two alleles at each bi-allelic SNP are shown as black or white lines. Haplotypes are clustered based on based on the Manhattan distance, bringing together similar haplotypes and ordered by decreasing similarity. Breed association is indicated by the dendrogram on the left side.
Agriculture 12 00844 g005aAgriculture 12 00844 g005b
Figure 6. Haplotype structure and phylogenies of haplotypes from an ROH hotspot region containing the RERE gene for Bos taurus (Holstein, Angus and Fleckvieh), Zebu (Bos indicus), Gaur, Bison, Banteng, Wisent and Gayal. (A) Left panel: the phylogeny of RERE haplotypes. Haplotypes are clustered based on based on the Manhattan distance, bringing together similar haplotypes and ordered by decreasing similarity. Right panel: the haplotype structure around the RERE gene. Colored blocks indicate the origin of haplotypes. The two alleles at each bi-allelic SNP are shown as black or white lines. (B) Left panel: the genealogy of SLC25A51 haplotypes. Right panel: the haplotype structure around the SLC25A51 gene. Colored blocks indicate the origin of haplotypes. The two alleles at each bi-allelic SNP are shown as black or white lines.
Agriculture 12 00844 g006aAgriculture 12 00844 g006b
Table 1. Haplotype effects from CYP19A1 locus on milk yield in Holstein population. * refers to p value < 0.05.
HaplotypeEffect SizeStandard ErrorSignificance (p Value) of Substitution Effects between Haplotypes
11,1110.6290.7300.010 *
12,1110.1350.984
22,2110.0810.971
22,222−0.8460.740
Publisher’s Note: MDPI stays neutral with regard to jurisdictional claims in published maps and institutional affiliations.

