Article

Optimization of Dairy Cattle Breeding Programs with Genotype by Environment Interaction in Kenya

by
Peter K. Wahinya
1,2,*,
Gilbert M. Jeyaruban
1,
Andrew A. Swan
1 and
Julius H. J. van der Werf
3
1
Animal Genetics & Breeding Unit, University of New England, Armidale, NSW 2351, Australia
2
Department of Agricultural Sciences, Karatina University, P.O. Box 1957-10101, Karatina 10101, Kenya
3
School of Environmental and Rural Science, University of New England, Armidale, NSW 2351, Australia
*
Author to whom correspondence should be addressed.
Agriculture 2022, 12(8), 1274; https://doi.org/10.3390/agriculture12081274
Submission received: 7 June 2022 / Revised: 17 August 2022 / Accepted: 18 August 2022 / Published: 21 August 2022
(This article belongs to the Special Issue Application of Genetics and Genomics in Livestock Production)

Abstract

:
Genotype by environment interaction influences the effectiveness of dairy cattle breeding programs in developing countries. This study aimed to investigate the optimization of dairy cattle breeding programs for three different environments within Kenya. Multi-trait selection index theory was applied using deterministic simulation in SelAction software to determine the optimum strategy that would maximize genetic response for dairy cattle under low, medium, and high production systems. Four different breeding strategies were simulated: a single production system breeding program with progeny testing bulls in the high production system environment (HIGH); one joint breeding program with progeny testing bulls in three environments (JOINT); three environment-specific breeding programs each with testing of bulls within each environment (IND); and three environment-specific breeding programs each with testing of bulls within each environment using both phenotypic and genomic information (IND-GS). Breeding strategies were evaluated for the whole industry based on the predicted genetic response weighted by the relative size of each environment. The effect of increasing the size of the nucleus was also evaluated for all four strategies using 500, 1500, 2500, and 3000 cows in the nucleus. Correlated responses in the low and medium production systems when using a HIGH strategy were 18% and 3% lower, respectively, compared to direct responses achieved by progeny testing within each production system. The JOINT strategy with one joint breeding program with bull testing within the three production systems produced the highest response among the strategies using phenotypes only. The IND-GS strategy using phenotypic and genomic information produced extra responses compared to a similar strategy (IND) using phenotypes only, mainly due to a lower generation interval. Going forward, the dairy industry in Kenya would benefit from a breeding strategy involving progeny testing bulls within each production system.

1. Introduction

Animal breeders are often challenged to carry out selection in the presence of genotype by environmental interaction (GxE). GxE affects sire and dam rankings among environments, consequently impacting on selection across environments and the optimal design of breeding programs [1]. GxE is also important among the dairy industries in developing countries where, to a large extent, genetic improvement relies on imported semen and herds vary in terms of input and output [2]. Often, the breeding goals of local dairy farmers and the breeding organizations that control semen supply are not always well aligned, ultimately affecting the rate of genetic progress in semen importing countries [3,4,5,6]. In this situation, local breeding programs involving genetic evaluation and progeny testing of sires within the country are advisable.
An effective genetic improvement program is lacking in Kenya due to various constraints, including small herd size, inadequate animal performance and pedigree recording, organizational challenges, and a lack of standardized methods of genetic evaluation [5,7]. A functional local breeding scheme would provide motivation to achieve higher participation of dairy farmers in pedigree and performance recording [8]. This would also facilitate farmers to select their breeding stock and produce replacement stock through a genetic evaluation within production systems. A breeding program with large-scale farms as the nucleus has been recommended as a solution to the small herd sizes, recording, and organizational challenges in Kenya [8,9]. However, this strategy could result in biased selection as is suggested by Wahinya [2], and Ombura [10], due to the fact that the large-scale farms are intensive with high input and output production systems. Under intensive systems, the scaling effect due to the spread in breeding values influences sire and index rankings [11]. Wahinya [2], recommended selection among animals evaluated within the target production systems as an alternative to the current selection based on intensive production systems. To maximize the overall gains, three strategies including: selection in one environment, selection within each environment, and selection on an index combining information in each environment were evaluated to determine the optimum strategy. These strategies have been applied in different studies to optimize dairy cattle breeding programs for different environments while accounting for GxE [1,12,13,14,15]. The local dairy cattle breeding program in Kenya has not been optimized for the different environments with genotype by environment interaction. Genomic information is not considered in the current national selection scheme and the potential of a multiple-trait genomic index to optimize genetic improvement for multiple environments with the presence of GxE in Kenya is not known.
Using selection index theory, different strategies based on sire proving can be evaluated to identify an optimum strategy to maximize the overall genetic gain in the three production systems. A deterministic simulation was therefore used in this study to evaluate and recommend an optimum dairy cattle breeding strategy to maximize the overall genetic gain for low, medium and high dairy production systems in Kenya.

2. Materials and Methods

2.1. Breeding Objective

A single dairy cattle breeding program with three production systems represented in the overall breeding objective was simulated to optimize genetic gain. The production systems were defined as low, medium, and high production systems, categorized based on milk yield occurring within a standard lactation [2]. The low, medium, and high production systems differ in terms of inputs and outputs as detailed in Wahinya [16]. Genetic improvement was defined by the selection of six traits including milk yield (MY, kg) which was the total milk yield in a lactation, butterfat yield (FY, kg), the total butterfat yield in a lactation, age at first calving (AFC, days), the age in days at the time of first calving, calving interval (CI, days), the time interval between subsequent calving events, mature weight (MWT, kg), the live weight at maturity, and survival rate (SR) which is the average probability of an animal to survive between lactations. The economic importance of these traits has been shown by Wahinya [16]. Revenue from dairy cattle is mainly derived from milk and the sale of animals. Fat yield influences the energy requirements, thus the amount of feed required. Fertility traits, including age at first calving and calving intervals have an influence on the days in milk and the number of calves for replacement or sale in the productive lifetime of a cow. Cull for age cows and cull heifers are also marketed based on their live weight. Cow survival between lactations is of economic importance in the tropics where disease and significant mortality rates are a constraint [17]. These traits were chosen to account for the current situation in Kenya, characterized by minimal recording within the dairy industry. To account for G x E, each trait was considered as a different trait in the three production systems.

2.2. Population Structure

The population consisted of a nucleus where elite dams and sires are selected and used as parents for the next generation of selection candidates. All dams in the nucleus were assumed to have phenotypes to provide information for genetic evaluation of the selection candidates. The nucleus consisted of three populations including dams in low, medium, and high production systems. To evaluate the effect of different nucleus sizes, we simulated nucleus populations with 500, 1500, 2500 and 5000 dams, of which the performances were recorded annually in each of the three production systems. Two-hundred and nineteen test bulls were assumed across the three production systems.
The population consisted of overlapping generations. Dams and test bulls were spread across eight age classes. Annually, 10 bulls and 300 cows (100 in each production system) were selected to produce the next generation. Each of the 10 selected bulls was progeny tested with 5, 10, 15, and 30 daughters per year. The daughters were considered to attain sexual maturity in their second year and therefore their first offspring were born in the third year (36 months) with a lifetime period of eight years (up to the sixth lactation). Therefore, progeny information was available when the bulls were five years and above. A 50:50 sex ratio was assumed for calves at birth while the calving rates were assumed to be 0.67, 0.74, and 0.77 under the low, medium, and high production systems, respectively. The survival rates under low (0.90), medium (0.93), and high (0.94) production systems were used to calculate the number of dams available for selection at different age classes up to eight years. The commercial population was assumed to have non-recorded dams and it relied on the sires selected in the nucleus for genetic improvement.

2.3. Breeding Strategies

Sires and dams were selected annually by truncation selection using multi-trait index selection. Progeny and existing sires and dams were used as selection candidates to produce the next selection of candidates. Candidates were considered for selection after all the information needed for selection decisions was available. In the simulation, we assumed an animal model for genetic evaluation considering all the genetic relationships. Male selection candidates were evaluated based on their half-sib sisters, daughters and dams information while females were evaluated on their own performance records, half-sib sisters and parent’s information. To reduce bull maintenance cost and loss of selection candidates due to involuntary culling, we assumed a situation where semen was collected and stored. Bulls were therefore culled after two years. Genetic evaluation and selection of male and female candidates was varied to represent different selection strategies. We considered several strategies to maximize genetic gain in the overall objective with three production systems.
The breeding program aimed to maximize genetic gain in the overall objective ( Δ H ) with genetic gains in each of the three production systems:
Δ H = Δ H Low + Δ H Medium + Δ H High
where Δ H Low , Δ H Medium and, Δ H High are the genetic gains in the low, medium, and high production systems, respectively. The proportions of cows in the low (0.30), medium (0.33), and high (0.37) production systems in Wahinya [2], were used to weight the gains in the respective production systems for the population size. The breeding goal ( H i ) within each (Low, Medium, and High) breeding program was defined as:
H i = v a
where v and a are vectors with economic weights and true breeding values for the six traits in the breeding objective under the ith production system: low, medium, and high production systems, respectively. Four different breeding strategies were simulated in this study: (1) one breeding program with progeny testing all bulls in the high production system only (HIGH), (2) one joint breeding program with progeny testing all bulls in each of three environments (JOINT), (3) and three environment-specific breeding programs (sub-programs) each with testing of bulls only within each environment (IND). A fourth strategy similar to IND was simulated to evaluate the effect of genomic information on genetic improvement (IND-GS).
HIGH strategy consisted of one breeding program with progeny testing of bulls in the high production system. The aim was to improve the breeding objective with the six traits in the high production system. Selection of candidate sires was therefore based on the selection index under the high production system. The economic weights for the traits under the low and medium production system were therefore set to zero. The low and medium production systems obtained a correlated response from selection in the high production system.
JOINT strategy consisted of one breeding program with progeny testing of all test bulls in the three production systems. The aim was to improve the breeding objective with eighteen traits representing the six traits in all three production systems simultaneously. Economic weights specific for each production system were obtained from Wahinya [16].
IND strategy consisted three separate breeding sub-programs, one for each production system. Test bulls were progeny tested and selected within their sub-program of origin. The aim was to improve the breeding objective with six traits within each breeding program separately. The number of test bulls used in each production system was equated to the relative proportion of the population of cows under each production system multiplied by the total number of test bulls. Proportions of 0.30, 0.33, and 0.37 were assumed for the low, medium, and high production systems, respectively [2].
IND-GS strategy was similar to IND. The only difference was that phenotypic and genomic information were used to select males and females. The breeding objective therefore had twelve traits, one extra trait for each of the six traits in the IND strategy to represent the genomic information. All dams within the three production systems were assumed to be genotyped and phenotyped to form the reference population.

2.4. Prediction of Genetic Gain

Response to selection was predicted by deterministic simulation based on selection index theory using the SelAction software. SelAction predicts genetic gains at equilibrium accounting for overlapping generations, a build-up of pedigree information [18], and reduction of genetic variance due to selection [19]. Further details about the features and the theoretical background of the software are described in Rutten [20]. Selection was simulated by truncation with overlapping generations, while the annual genetic gain due to selection was estimated as in Ducrocq and Quaas [21]. Genomic selection was simulated by adding an extra trait to represent the marker information [22,23]. Marker information was modelled using a trait with a heritability of 0.999, correlated to each trait. The genetic correlation between the marker and each trait was the accuracy of genomic EBV ( r g g ^ ). The accuracy of genomic information depends on the size of the reference population ( n p ), the effective number of loci for which the effects have to be estimated ( n G ), and the correlation between the true breeding value of a genotyped individual with its phenotypic record (r). This was calculated as [22,24]:
r g g ^ = λ r 2 λ r 2 + 1
where λ = n p / n G , n p is the number of individuals in the reference population with both phenotypic records and genotypic information and n G depends on the historical effective population size ( N E ) and was estimated as n G = 2 N E L , where L is the size of the genome in Morgan. Since individuals in the reference population are genotyped and phenotyped, r is equal to the square root of heritability of the trait and therefore, r 2 =   h 2 . The environmental correlation between the marker information and the original trait was set to zero based on the assumption that genotypes can be observed without error, the marker information is fully heritable and has no residual variance [23]. Genetic and phenotypic correlations ( r Q ^ 1 Q ^ 2 ) between the genomic EBVs were calculated as in Dekkers [22].
Table 1 shows the assumed genetic and phenotypic standard deviations, economic weights, heritabilities, genetic, and phenotypic correlations for traits under the low, medium and high production systems. The estimated accuracy of the genomic information for the breeding objective traits with different reference populations under the low, medium, and high production systems is shown in Table 2.

3. Results

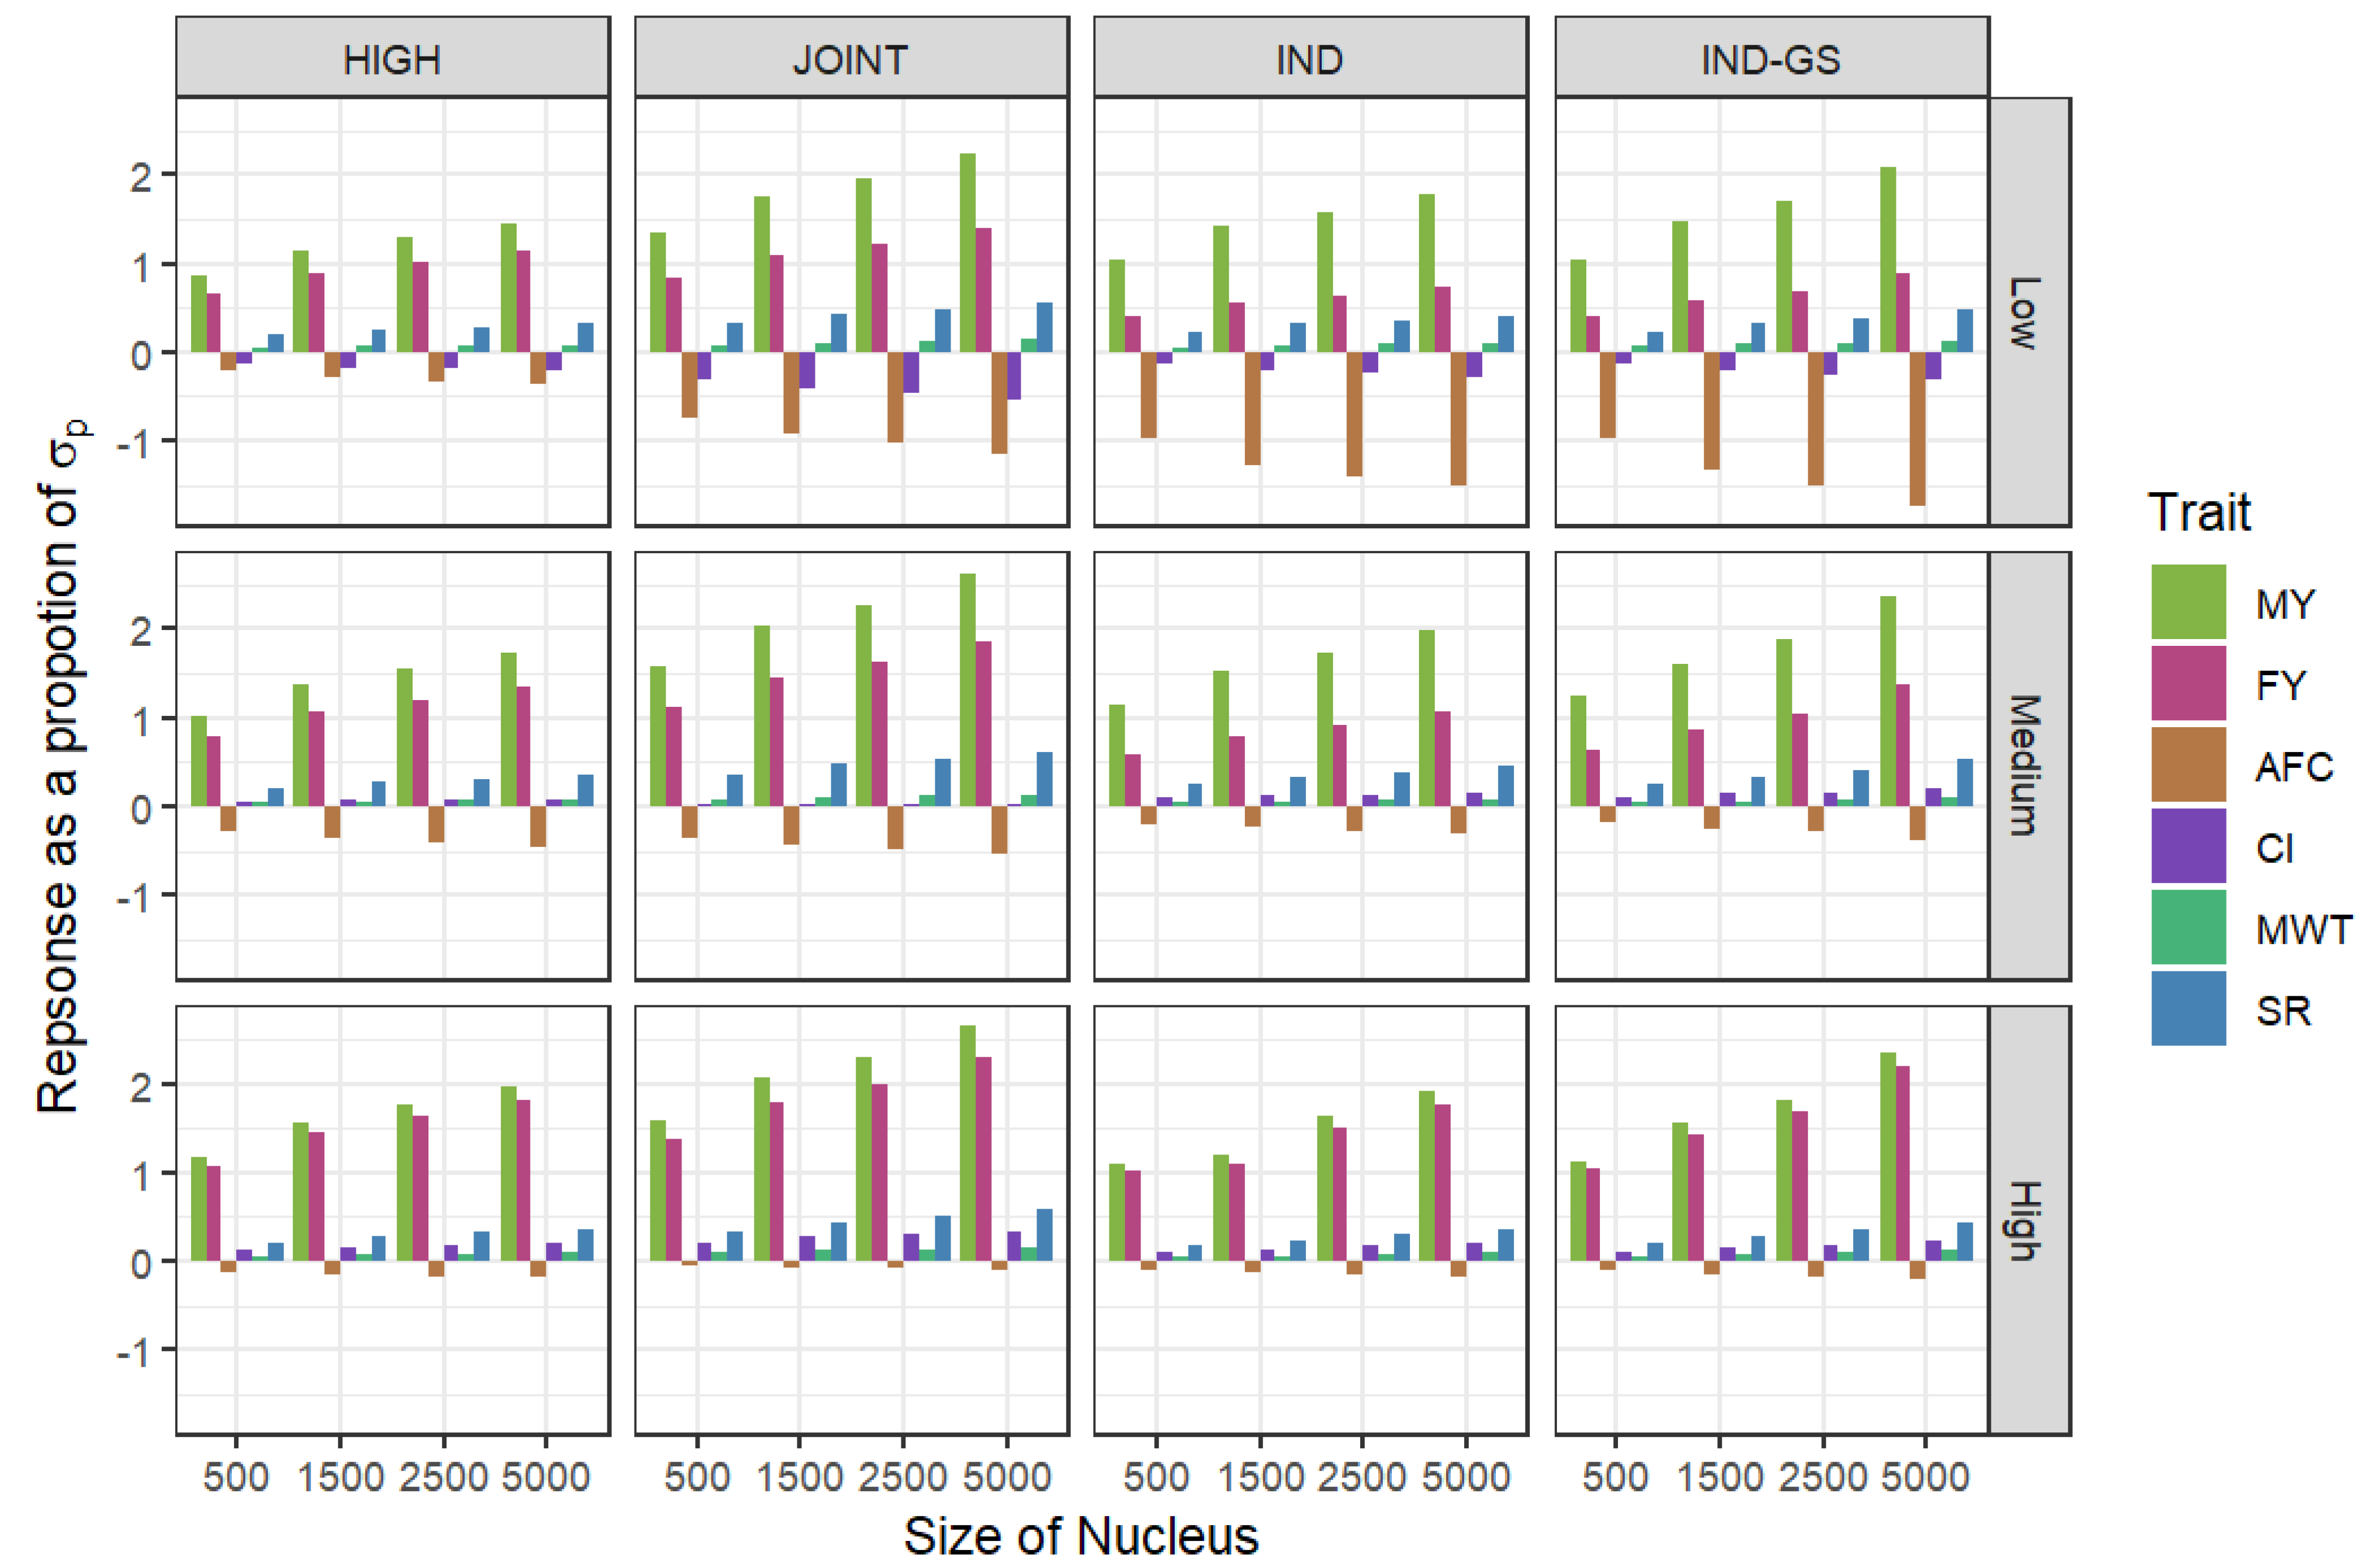
3.1. Response to Selection

The responses to selection per year under the low, medium, and high production systems for each of the different breeding strategies for six traits assuming a nucleus with 500 dams are shown in Table 3. A positive response was predicted for lactation milk yield (5.37 to 19.49 kg), lactation fat yield (0.12 to 0.78 kg), mature weight (0.02 to 0.05 kg), and survival rate (0.002 to 0.004%) within all breeding strategies and production systems. Age at first calving (−0.03 to −1.53 days) under all production systems and calving interval (−0.18 to −0.41 days) under the low production system had negative responses, which is desirable according to their economic weight. Responses in lactation milk yield, fat yield, mature weight, and survival rate increased across production systems with the level of production. There was no clear trend for the fertility traits (age at first calving and calving interval). Relying on one breeding program based on the high production system (HIGH) generated less responses under the low and medium production systems compared to the strategies based on evaluating bulls and cows within each of the production systems. The JOINT strategy with one joint breeding program with bull testing within the three production systems had the highest responses observed for most of the traits under all production systems. The IND-GS strategy involving the use of genomic information to test bulls within each of the production systems had slightly higher responses compared to a similar strategy that did not use genomic information (IND).

3.2. Effect of Nucleus Size and Number of Progeny per Sire on Response

The effects of increasing the size of the nucleus from 500 to 5000 in response to selection are shown in Figure 1. Response for all the traits under the three production systems increased (−1.74 to 2.65 phenotypic standard deviations) for all strategies with an increase in the size of nucleus. However, the rate of increase in response is not linear.

4. Discussion

A joint breeding program with bull testing within each of the three production systems (JOINT) produced the highest response among all the three strategies using progeny testing due to higher accuracy of the index and higher variance of the overall breeding objective. The response predicted under the low and medium production systems from selection in the high production system (HIGH) is lower compared to other strategies where bull testing is carried out within each of the three production systems (Table 3). The JOINT strategy is a favorable strategy compared to having separate breeding programs. The extent to which the three production systems would select the same sire(s) is dependent on the genetic correlations between the breeding objectives of the three production systems. The correlations between the breeding objectives under the low and medium, low and high, and medium and high production systems are 0.79, 0.66, and 0.77, respectively [16]. A strategy where bulls are tested within each of the production systems would help selection of more robust animals to maintain diversity without necessarily developing specialized lines. This would also lead to an increase in the effective population size [31].
Genomic selection has greatly transformed animal breeding and significantly impacted dairy cattle genetic improvement, especially in developed countries. This has widened the gap between countries implementing genomic selection and semen importing countries [32]. Several studies have recommended the potential of a genomic selection scheme to provide a higher rate of genetic improvement for small-sized nucleus breeding programs in developing countries [33,34,35]. Combining phenotypic and genomic information had a minimal effect on the response compared with the use of progeny phenotype only (Table 3). This shows that genomic selection cannot compete with traditional selection when the number of phenotypic records is limited, unless in a situation where the generation interval is significantly reduced by using genomic selection only [23,33]. The reduction of the generation interval, however, comes at a cost of reduced accuracies. The accuracies of genomic breeding values predicted in this study could be low due to the low to moderate heritabilities (Table 2) for the traits used in this study [36], and the small reference population. Regardless of this, genomic selection schemes are still attractive and could be beneficial for multi-trait selection with limited phenotypic records considering that traditional breeding schemes still need many phenotypes and long generation intervals for progeny testing. This is shown in Wahinya [37], where using correlated genomic information lead to a higher overall economic response compared to progeny testing for a nucleus with 5000 dams. Correlated genomic information could not be implemented in this study due to a limitation of number of traits in SelAction software. Genomic information could also be used for parentage assignment and breed composition determination, which is particularly beneficial to enhance the pedigree for genetic evaluation [35,38].
The dairy industry in Kenya would benefit from a higher response achieved by increasing the size of the nucleus. A large nucleus allows a higher selection intensity, young bulls can also be evaluated with more daughters, and it also minimizes inbreeding. A large nucleus would also help to address the structural weakness of the current breeding program due to a few herds contributing breeding males [39]. To create a larger nucleus it would require a considerable effort to persuade many herds to participate by providing pedigree and performance records to the recording organization. This has been a constant challenge in the developing dairy industries where pedigree and performance recording is already minimal and erratic. One of the main reasons linked to this is the failure of the recording scheme to meet the farmer’s expectations and to offer noticeable returns [7]. Nevertheless, in practice, farmers still need records within their herds to make management decisions. As shown in this study, the current performance recording herds can be used to drive genetic gain for the commercial herds and the national dairy herd. This however, requires an efficient way to evaluate animal performance including as much information provided by the farmers [2]. A platform that is conspicuously missing for the current performance recording system also needs to be developed to provide feedback and quality information. Good examples can be learnt from other developed dairy industries that have applied digital strategies and education to provide quality information and tools for better herd improvement decisions.

5. Conclusions

This study shows that a strategy based on bull testing within production systems would be more beneficial compared to bull testing solely in high production environments. A higher rate of genetic improvement would also be achieved by increasing the size of the nucleus and the number of progeny per sire. A selection strategy using genomic information is promising with a large reference population. Application of these recommendations will be difficult but possible with the right level of investment, backed by innovative solutions, digital strategies, and education to encourage pedigree, and performance recording in developing countries.

Author Contributions

Conceptualization, P.K.W.; methodology, P.K.W.; validation, P.K.W.; formal analysis, P.K.W.; writing—original draft preparation, P.K.W.; writing—review and editing, P.K.W., G.M.J., A.A.S. and J.H.J.v.d.W.; supervision, G.M.J., A.A.S. and J.H.J.v.d.W. All authors have read and agreed to the published version of the manuscript.

Funding

P.K.W. was financially supported by the University of New England (Armidale, Australia) International Postgraduate Research Awards (IPRA) to pursue PhD studies at the Animal Genetics and Breeding Unit.

Institutional Review Board Statement

Not applicable.

Informed Consent Statement

Not applicable.

Acknowledgments

The authors thank the Dairy Recording Services of Kenya (DRSK, Nakuru) in Kenya for providing data and Kim Bunter for reviewing the paper. This work was conducted as part of a PhD thesis titled: “Wahinya, P.K. (2020). Strategies for genetic improvement of dairy cattle under low, medium and high production systems in Kenya. (PhD thesis), University of New England, Armidale, Australia.

Conflicts of Interest

The authors declare no conflict of interest.

References

  1. Mulder, H.A.; Bijma, P. Benefits of Cooperation Between Breeding Programs in the Presence of Genotype by Environment Interaction. J. Dairy Sci. 2006, 89, 1727–1739. [Google Scholar] [CrossRef]
  2. Wahinya, P.K. Estimation of genetic parameters for milk and fertility traits within and between low, medium and high dairy production systems in Kenya to account for genotype-by-environment interaction. J. Anim. Breed. Genet. 2020, 137, 423–519. [Google Scholar] [CrossRef] [PubMed]
  3. Ojango, J.; Pollott, G. The relationship between Holstein bull breeding values for milk yield derived in both the UK and Kenya. Livest. Prod. Sci. 2002, 74, 1–12. [Google Scholar] [CrossRef]
  4. Muasy, T.; Peters, K.; Kahi, A. Effect of diverse sire origins and environmental sensitivity in Holstein-Friesian cattle for milk yield and fertility traits between selection and production environments in Kenya. Livest. Sci. 2014, 162, 23–30. [Google Scholar] [CrossRef]
  5. Musani, S.; Mayer, M. Genetic and environmental trends in a large commercial Jersey herd in the Central Rift Valley, Kenya. Trop. Anim. Health Prod. 1997, 29, 108–116. [Google Scholar] [CrossRef]
  6. Bichard, M. Genetic improvement in dairy cattle—An outsider’s perspective. Livest. Prod. Sci. 2002, 75, 1–10. [Google Scholar] [CrossRef]
  7. Wasike, C.B. Factors that influence the efficiency of beef and dairy cattle recording system in Kenya: A SWOT-AHP analysis. Trop. Anim. Health Prod. 2011, 43, 141–152. [Google Scholar] [CrossRef]
  8. Kariuki, C.M. Multiple criteria decision-making process to derive consensus desired genetic gains for a dairy cattle breeding objective for diverse production systems. J. Dairy Sci. 2017, 100, 4671–4682. [Google Scholar] [CrossRef]
  9. Kahi, A.K.; Nitter, G. Developing breeding schemes for pasture based dairy production systems in Kenya I. Derivation of economic values using profit functions. Livest. Prod. Sci. 2004, 88, 161–177. [Google Scholar] [CrossRef]
  10. Ombura, J. An assessment of the efficiency of the dairy bull dam selection methodology in Kenya. Livest. Res. Rural. Dev. 2007, 19, 10. [Google Scholar]
  11. Santos, B. Factors Affecting Rankings of Dairy Bulls across New Zealand Dairy Farm Systems. In Proceedings of the World Congress on Genetics Applied to Livestock Production, Vancouver, BC, Canada, 17–22 August 2014; p. 4. [Google Scholar]
  12. James, J.W. Selection in two environments. Heredity 1961, 16, 145–152. [Google Scholar] [CrossRef]
  13. Mulder, H.A.; Bijma, P. Effects of genotype × environment interaction on genetic gain in breeding programs1. J. Anim. Sci. 2005, 83, 49–61. [Google Scholar] [CrossRef] [PubMed]
  14. Slagboom, M. Genomic selection improves the possibility of applying multiple breeding programs in different environments. J. Dairy Sci. 2019, 102, 8197–8209. [Google Scholar] [CrossRef] [PubMed]
  15. Smith, C.; Banos, G. Selection within and across populations in livestock improvement. J. Anim. Sci. 1991, 69, 2387–2394. [Google Scholar] [CrossRef] [PubMed]
  16. Wahinya, P.K. Breeding objectives for dairy cattle under low, medium and high production systems in the tropics. Animal 2022, 16, 100513. [Google Scholar] [CrossRef] [PubMed]
  17. Bebe, B.O. Smallholder dairy systems in the Kenya highlands: Cattle population dynamics under increasing intensification. Livest. Prod. Sci. 2003, 82, 211–221. [Google Scholar] [CrossRef]
  18. Dekkers, J.C.M. Structure of Breeding Programs to Capitalize on Reproductive Technology for Genetic Improvement. J. Dairy Sci. 1992, 75, 2880–2891. [Google Scholar] [CrossRef]
  19. Bulmer, M. The effect of selection on genetic variability. Am. Nat. 1971, 105, 201–211. [Google Scholar] [CrossRef]
  20. Rutten, M.J.M. SelAction: Software to Predict Selection Response and Rate of Inbreeding in Livestock Breeding Programs. J. Hered. 2002, 93, 456–458. [Google Scholar] [CrossRef]
  21. Ducroco, V.; Quaas, R. Prediction of Genetic Response to Truncation Selection across Generations. J. Dairy Sci. 1988, 71, 2543–2553. [Google Scholar] [CrossRef]
  22. Dekkers, J.C.M. Prediction of response to marker-assisted and genomic selection using selection index theory. J. Anim. Breed. Genet. 2007, 124, 331–341. [Google Scholar] [CrossRef] [PubMed]
  23. Van Grevenhof, E.M.; van Arendonk, J.A.; Bijma, P. Response to genomic selection: The Bulmer effect and the potential of genomic selection when the number of phenotypic records is limiting. Genet. Sel. Evol. 2012, 44, 26. [Google Scholar] [CrossRef] [PubMed]
  24. Daetwyler, H.D.; Villanueva, B.; Woolliams, J.A. Accuracy of Predicting the Genetic Risk of Disease Using a Genome-Wide Approach. PLoS ONE 2008, 3, e3395. [Google Scholar] [CrossRef] [PubMed]
  25. Kahi, A.K.; Nitter, G.; Gall, C.F. Developing breeding schemes for pasture based dairy production systems in Kenya II. Evaluation of alternative objectives and schemes using a two-tier open nucleus and young bull system. Livest. Prod. Sci. 2004, 88, 179–192. [Google Scholar] [CrossRef]
  26. Musingi, B.M.; Muasya, T.K.; Kahi, A.K. Genetic Parameters for Measures of Longevity in Kenyan Sahiwal Cattle. Livest. Res. Rural. Dev. 2018, 30, 96. Available online: http://www.lrrd.org/lrrd30/6/muasy30096.html (accessed on 24 February 2020).
  27. Ilatsia, E.D. Sahiwal cattle in semi-arid Kenya: Genetic aspects of growth and survival traits and their relationship to milk production and fertility. Trop. Anim. Health Prod. 2011, 43, 1575. [Google Scholar] [CrossRef] [PubMed]
  28. Haile-Mariam, M.; Bowman, P.J.; Goddard, E.M. Genetic and environmental relationship among calving interval, survival, persistency of milk yield and somatic cell count in dairy cattle. Livest. Prod. Sci. 2003, 80, 189–200. [Google Scholar] [CrossRef]
  29. Higham, N.J. Computing a nearest symmetric positive semidefinite matrix. Linear Algebra Its Appl. 1988, 103, 103–118. [Google Scholar] [CrossRef]
  30. R Core Team. R: A Language and Environment for Statistical Computing; R Foundation for Statistical Computing: Vienna, Austria, 2021. [Google Scholar]
  31. Goddard, M. Optimal Effective Population Size for the Global Population of Black and White Dairy Cattle. J. Dairy Sci. 1992, 75, 2902–2911. [Google Scholar] [CrossRef]
  32. Ducrocq, V. Development of genomic selection in dairy cattle in two emerging countries: South Africa and India. In Proceedings of the Annual Meeting of the European Association for Animal Production (EAAP), Tallinn, Estonia, 28 August–1 September 2017. [Google Scholar]
  33. Kariuki, C.M. Optimizing the design of small-sized nucleus breeding programs for dairy cattle with minimal performance recording. J. Dairy Sci. 2014, 97, 7963–7974. [Google Scholar] [CrossRef]
  34. Marshall, K. Marker-based selection within smallholder production systems in developing countries. Livest. Sci. 2011, 136, 45–54. [Google Scholar] [CrossRef]
  35. Marshall, K. Livestock Genomics for Developing Countries—African Examples in Practice. Front. Genet. 2019, 10, 297. [Google Scholar] [CrossRef] [PubMed]
  36. Hayes, B. Accuracy of genomic selection: Comparing theory and results. Proc. Assoc. Adv. Anim. Breed. Genet. 2009, 18, 34–37. [Google Scholar]
  37. Wahinya, P.K.; Swan, A.A.; Jeyaruban, M.G. Proposed genetic improvement strategies for dairy cattle in Kenya. In Proceedings of the Association for the Advancement of Animal Breeding and Genetics, Adelaide, Australia, 2–4 November 2021; pp. 414–418. [Google Scholar]
  38. Ojango, J.M.K. Genetic evaluation of test-day milk yields from smallholder dairy production systems in Kenya using genomic relationships. J. Dairy Sci. 2019, 102, 5266–5278. [Google Scholar] [CrossRef]
  39. Muasya, T.K.; Peters, K.J.; Kahi, A.K. Breeding structure and genetic variability of the Holstein Friesian dairy cattle population in Kenya. Anim. Genet. Resour. Ressour. Génétiques Anim. Recur. Genéticos Anim. 2013, 52, 127–137. [Google Scholar] [CrossRef]
Figure 1. Comparison of response to selection per year as a proportion of the phenotypic standard deviations expressed as a percentage under the low, medium and high production systems with different strategies. MY—lactation milk yield (kg); FY—lactation fat yield (kg); CI—calving interval (days); MWT—mature weight (kg); SR—survival rate (%). HIGH—one production system breeding program with bull testing in one environment; JOINT—one joint breeding program with bull testing in three environments; IND—three environment-specific breeding programs each with testing of bulls within each environment; IND-GS—three environment-specific breeding programs each with testing of bulls within each environment using genomic information.
Agriculture 12 01274 g001
Table 1. Genetic (σa) and phenotypic standard deviations (σp), economic weights (EW) and genetic parameters; heritabilities—diagonal, genetic—below diagonal and phenotypic—above diagonal correlations for traits under the low, medium and high production systems.
Trait 1σaσpEW 2LowMediumHigh
MYFYAFCCIMWTSRMYFYAFCCIMWTSRMYFYAFCCIMWTSR
LowMY285.94626.120.430.210.830.02−0.010.310.16
FY9.9429.7051.440.650.11−0.090.080.000.16
AFC77.73156.48−4.62−0.38−0.220.250.00−0.11−0.04
CI33.3130.85−114.69−0.110.020.030.060.030.00
MWT14.5331.97−5.950.230.11−0.09−0.410.210.00
SR0.361.11399.260.240.20−0.01−0.220.010.02
MediumMY467.32923.1218.350.420.56−0.22−0.530.160.260.260.840.020.020.310.16
FY26.9760.4756.840.560.33−0.090.030.100.200.540.200.150.080.000.16
AFC66.58129.67−5.73−0.14−0.12−0.060.24−0.15−0.01−0.050.340.260.03−0.11−0.04
CI15.8197.56−180.42−0.46−0.010.290.05−0.40−0.030.34−0.04−0.120.030.030.00
MWT29.6554.14−6.480.230.10−0.09−0.400.06−0.260.160.10−0.15−0.400.300.00
SR0.341.06486.40.270.19−0.01−0.250.010.500.260.190.01−0.230.010.02
HighMY613.031226.3820.310.640.66−0.25−0.070.120.220.750.65−0.210.140.120.260.250.81−0.010.040.310.16
FY28.6656.8461.410.620.84−0.120.060.110.210.610.58−0.100.030.110.210.730.250.010.080.000.16
AFC13.6160.75−7.88−0.05−0.12−0.640.51−0.13−0.04−0.47−0.150.32−0.44−0.130.00−0.28−0.140.050.03−0.11−0.04
CI13.7268.01−298.590.000.15−0.500.08−0.350.030.510.150.060.62−0.34−0.010.430.140.090.040.030.00
MWT29.6554.14−7.80.210.11−0.11−0.450.510.010.170.11−0.16−0.420.510.000.160.12−0.13−0.390.300.00
SR0.341.06605.560.260.210.02−0.240.030.500.220.200.00−0.250.030.500.220.22−0.01−0.190.010.02
1 MY—lactation milk yield (kg); FY—butterfat yield (kg); AFC—age-at-first calving (days); CI—calving interval (days); MWT—mature weight (kg); SR—cow survival (%). Source of genetic parameters: [2,16,25,26,27,28]. The standard errors for the genetic parameters ranged between 0—0.5. Source of economic weights: [16]. 2 EV—economic weights (Kenya Shillings). The genetic correlation matrices were bended to make them positive definite using the Higham [29], algorithm in R software [30].
Table 2. Accuracies of genomic information for the breeding objective traits depending on the size of the reference populations under the low, medium and high production systems.
SystemReference PopulationTrait 1
MYFYAFCCIMWTSR
Low5000.100.080.120.060.110.03
15000.180.130.200.100.180.06
25000.230.170.250.130.230.07
50000.310.240.340.180.320.10
Medium5000.120.100.120.040.100.03
15000.200.180.200.070.180.06
25000.260.230.260.090.230.07
50000.350.310.350.130.320.10
High5000.120.120.050.050.100.03
15000.200.200.090.080.180.06
25000.250.250.120.100.230.07
50000.340.340.160.140.320.10
1 MY—lactation milk yield (kg); FY—butterfat yield (kg); AFC—age-at-first calving (days); CI—calving interval (days); MWT—mature weight (kg); SR—cow survival (%).
Table 3. Response to selection per year for six traits under the low, medium, and high production systems: total economic gain within each system and overall gain with four selection strategies and a nucleus with 500 dams.
Traits 1HIGH2 JOINT 2 IND 2 IND-GS 2
LowMediumHighLowMediumHighLowMediumHighLowMediumHigh
MY5.379.4414.268.4814.5319.496.4810.6013.396.5911.4513.69
FY0.200.480.610.250.670.780.120.360.580.120.390.59
AFC−0.33−0.36−0.07−1.15−0.46−0.03−1.51−0.28−0.07−1.53−0.25−0.07
CI−0.170.050.08−0.410.020.15−0.180.090.08−0.180.110.08
MWT0.010.020.030.030.040.050.020.020.030.020.020.03
SR0.0020.0020.0020.0040.0040.0040.0020.0020.0020.0020.0020.002
TEG 1 (KES)141.57194.41304.28240.35305.38402.49166.92200.04285.93169.67214.92292.13
OG 1 (KES)640.25948.22652.89676.72
1 MY—lactation milk yield (kg); FY—lactation fat yield (kg); AFC—age at first calving (days); CI—calving interval (days); MWT—mature weight (kg); SR—survival rate (%). 2 HIGH—one production system breeding program with bull testing in High environment only; JOINT—one joint breeding program with bull testing in three environments; IND—three environment-specific breeding programs each with testing of bulls within each environment; IND-GS—three environment-specific breeding programs each with testing of bulls within each environment using genomic information; TEG—total economic gain; OG—overall objective gain.
Publisher’s Note: MDPI stays neutral with regard to jurisdictional claims in published maps and institutional affiliations.

