Article

Analysis and Experiment on the Seed Metering Mechanism of Multi-Grain Cluster Air Suction Type Rice (Oryza sativa L.) Hill Direct Seed Metering Device

1
College of Engineering, Northeast Agricultural University, Harbin 150030, China
2
School of Water Conservancy & Civil Engineering, Northeast Agricultural University, Harbin 150030, China
*
Author to whom correspondence should be addressed.
Agriculture 2022, 12(8), 1094; https://doi.org/10.3390/agriculture12081094
Submission received: 1 July 2022 / Revised: 23 July 2022 / Accepted: 25 July 2022 / Published: 26 July 2022

Abstract

:
This paper aims to solve the problem of high reseeding rates and mis-seeding rates in the rice multi-grain hole direct seeding process. A multi grain cluster air suction type rice hill direct seed metering device was developed, and its seeding mechanism was analyzed. Based on CFD-DEM coupling simulation and bench tests, this study explored and optimized the performance of the seed metering device, and carried out the seeding adaptability test. The simulation results were as follows: when the negative pressure was −5 kPa, the static pressure, dynamic pressure and velocity of the flow field reached the maximum. When the negative pressure was −4 kPa, the qualification index was 89.62%, the reseeding index was 4.36%, and the mis-seeding index was 6.02%. The results of the orthogonal rotation combination test of three factors and five levels showed that when the rotation speed, negative pressure and the length of stirring brush were 20.70 rpm, −4.0 kPa and 10.50 mm respectively, the seed metering performance was the best, the qualification index was 90.85%, the reseeding index was 4.41% and the mis-seeding index was 4.74%. The seed metering device had strong adaptability to the sowing of different rice varieties, and met the agronomic requirements of direct seeding and seeding in rice holes.

1. Introduction

Rice is one of the most important crops, for which production is of great importance to ensure world food security and economic stability [1,2,3]. Sowing is the initial stage of agricultural production and the most basic and critical link, which plays a decisive role in rice green production [4]. Rice seeds are accurately sown to the field by the precision hill direct seed metering device according to the required hole spacing, row spacing and number of hole seeds, without the need for complicated steps such as seedling cultivation and transplanting in the early stage. The research and development of a precision hill direct seed metering device is of great significance to promote the green production of rice that saves time, labor and costs and creates efficiency [5].
At present, seed metering devices are mostly applied to the few-grain strip sowing of super rice and hybrid rice, and a large number of scholars have conducted in-depth and extensive research on different seed rowing methods. Prasanna et al. [6] designed a roller-type rice seeding device and used an artificial neural network to optimize the structure of the seeder, but the device was only applicable to rice strip sowing and prone to seed wastage. Tian et al. [7] designed an ejection ear scoop type rice seeder, which can realize rice direct seeding in hole, but the number of grains per hole was difficult to guarantee uniformity. Zhang et al. [8] designed a multi-suction pneumatic rice precision metering device and added a stirring device on the metering plate, which improved the metering accuracy and had a good applicability for hybrid rice. The working principle and seed row pattern of the above study are not applicable to the practical production application of conventional rice multigrain hill direct seeding. Therefore, there is an urgent need for a breakthrough in the innovative design of a rice hill direct seed metering device.
With the development of modern mechanics, numerical methods, computer visualization techniques and computational methods, computational fluid dynamics (CFD) has become an effective tool for simulating fluid flow, characterizing fluid fields and revealing mechanisms for sustainable development of fluid phases [9]. CFD methods have been successfully applied to various mechanical structures [10,11,12]. As the most effective method for studying the fundamental dynamics of particle flow applications, the discrete element method (DEM) has been widely studied in the field of agricultural engineering, such as modeling and calibration of field crops [13,14], interaction of tillage components on soil [15,16,17], movement of materials in combined harvest threshing and scavenging [18,19,20] and grain production and processing [21,22]. Therefore, the quantitative study of fluid flow and particle motion behavior by CFD-DEM coupling method can become an effective way to explore the mechanism of pneumatic seed metering and experimental research.
In order to meet the practical needs of multi-grain cavity seeding of rice, a multi-grain cluster air suction type rice seed metering device was designed, and the seeding mechanism was deeply analyzed; the influence of flow field distribution on a seed metering plate of qualification index, reseeding index and mis-seeding index were explored by using CFD-DEM. The effects of various factors on seed metering performance were analyzed based on the orthogonal rotation combination test.

2. Materials and Methods

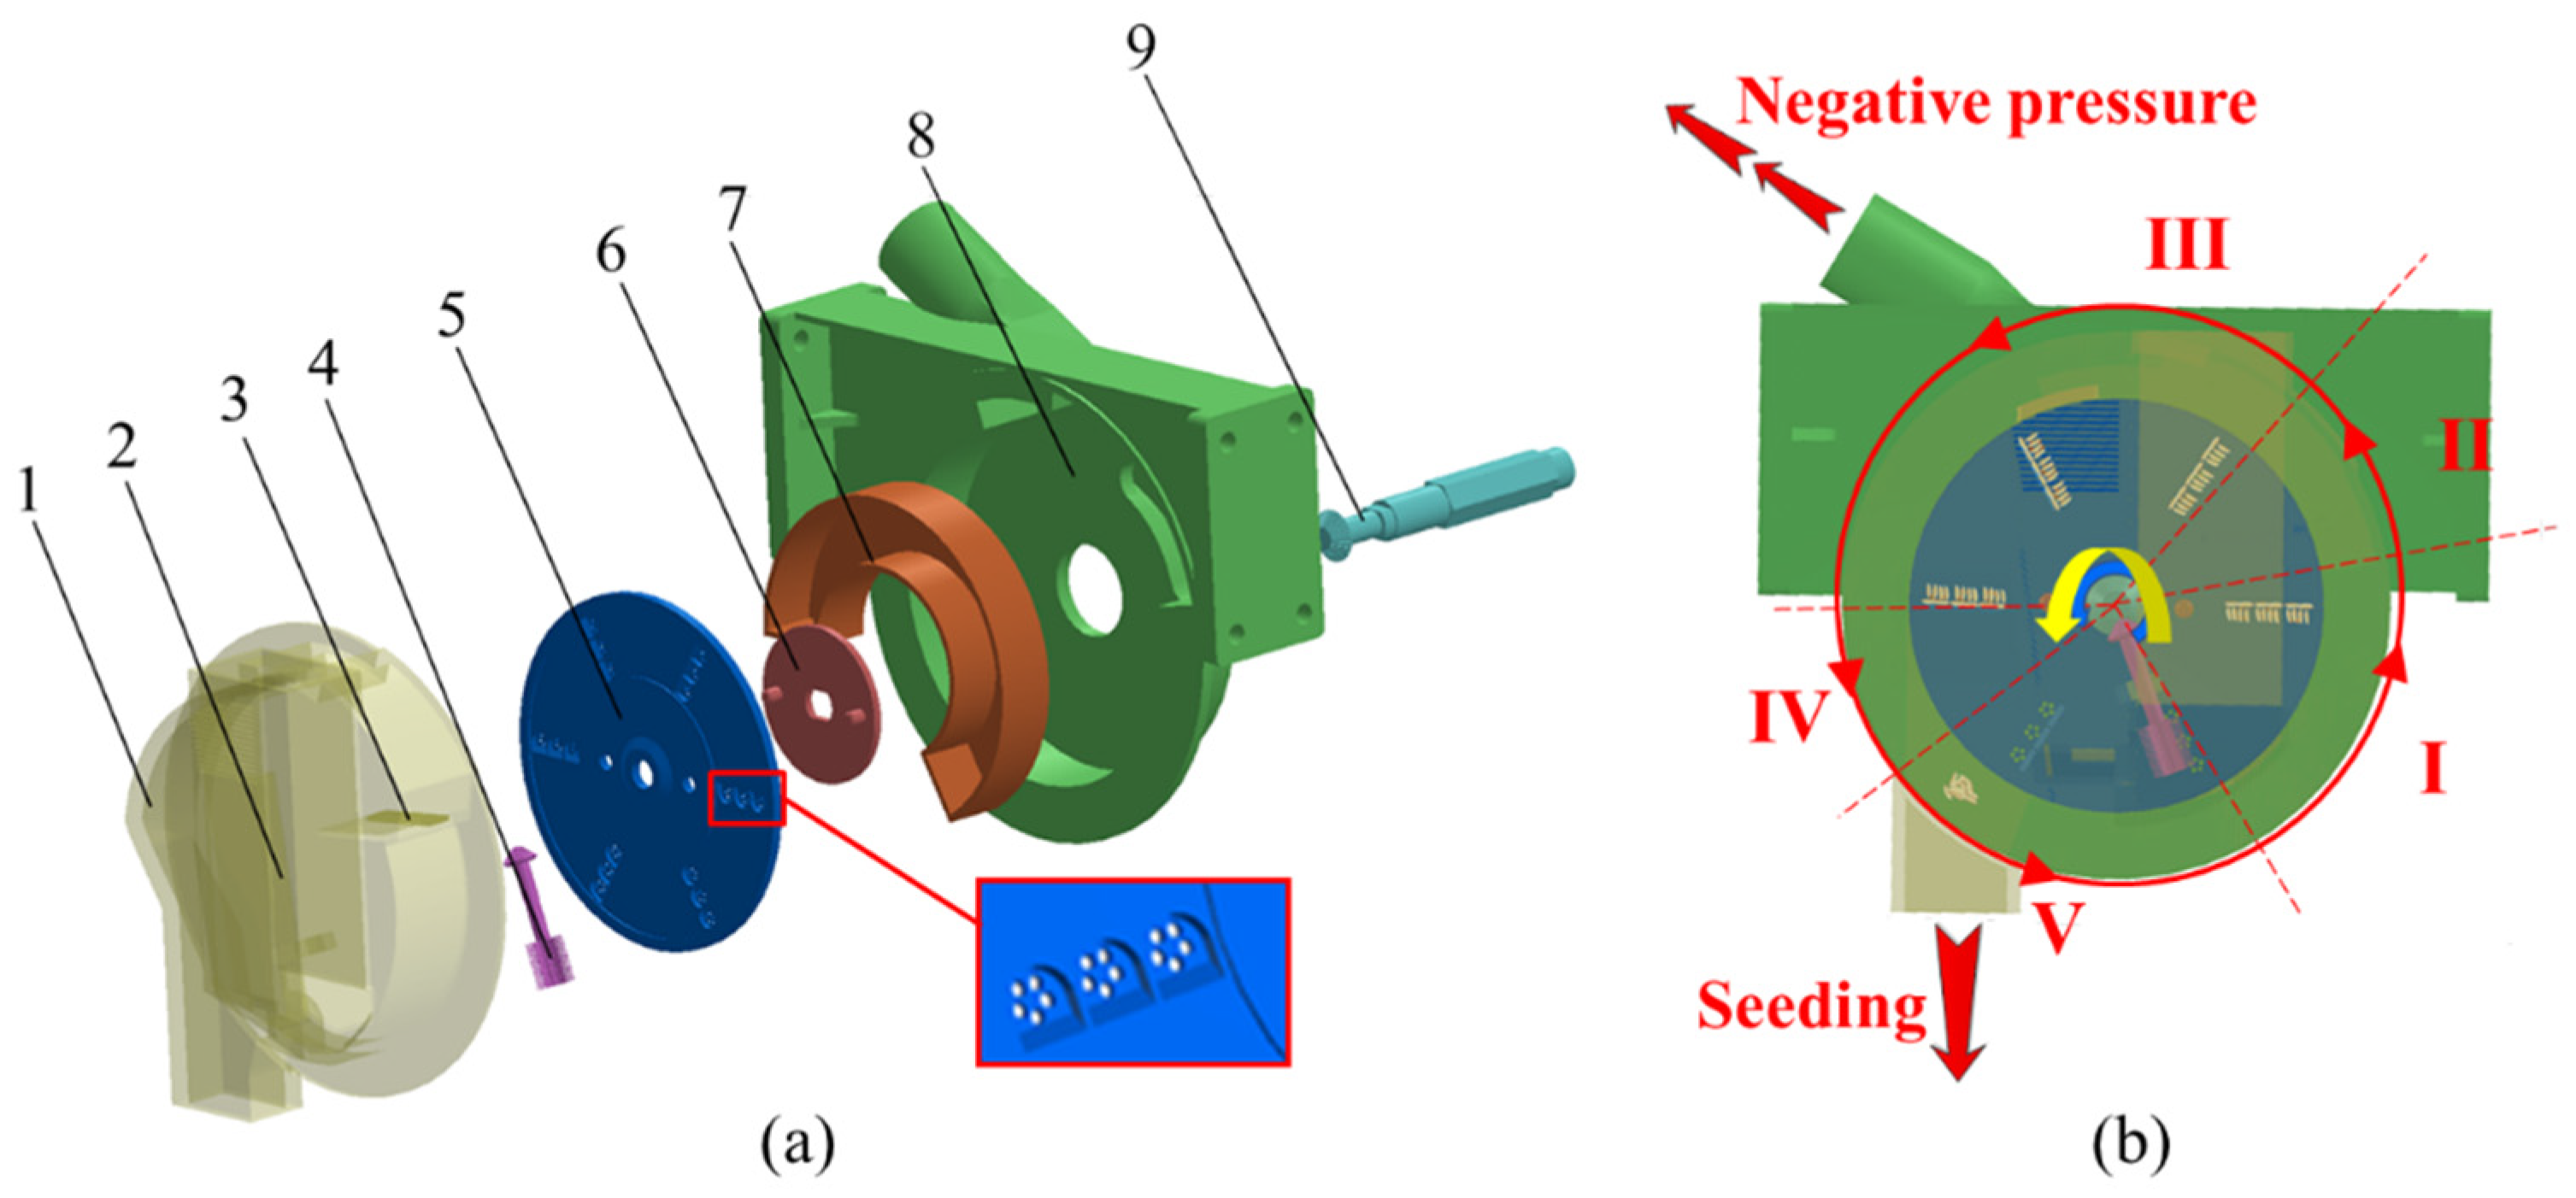
2.1. Overall Structure and Working Principle of the Multi-Grain Cluster Air Suction Type Rice Hill Direct Seed Metering Device

As shown in Figure 1a, the multi-grain cluster air suction type rice hill direct seed metering device is mainly composed of a front shell, back shell, negative pressure chamber, seed metering plate, cleaning brush, stirring brush, transmission shaft and other components. Multiple groups of holes are arranged in a concave circumferential pattern and distributed in an inline pattern on the seed metering plate. Both the cleaning brush and the stirring brush are made of pig bristles. The cleaning brush is set on the front shell to avoid missing seeding caused by removing more seeds while clearing seeds flexibly. The stirring brush is located in the middle of the seed box and seed metering plate, which can effectively disturb the seeds and change the movement attitude at the same time, and this arrangement is conducive to the seed adsorption on the seed metering plate. The structural parameters of key components are shown in Table 1.
As shown in Figure 1b, the seed metering device is divided into five zones according to different functions and operation order. These different zones are the filling area, clearing area, carrying area, unloading area and transitioning area. The seed metering plate was nested on the transmission plate, which was fixed on the transmission shaft and rotated counterclockwise driven by the transmission shaft. A negative pressure air chamber was installed between the seed metering plate and the rear shell. In order to simplify the structure of the seed metering device, the seed box and the front shell were designed as a whole. During operation, the seed metering plate rotated counterclockwise driven by the transmission shaft to separate the seeds from the seed box and carry the seeds to the filling area. Rice seeds enter the seed filling area from the bottom of the seed box. Under the action of negative pressure and disturbance of the stirring brush, they were adsorbed in the hole and rotated with the seed metering plate. In the seed clearing area, the seeds with weak adsorption force were removed by the seed cleaning brush. The seeds with strong adsorption force continued to rotate with the seed plate and were stably transported in the carrying area. When the seed tray carried the seeds into the unloading area, the negative pressure in the unloading area was blocked by the negative pressure cavity wall, and the seeds lost their role of adsorption. Under the combined action of gravity and centrifugal force, the seeds left the hole and fell into the seed feeding port, completing a seed metering operation.

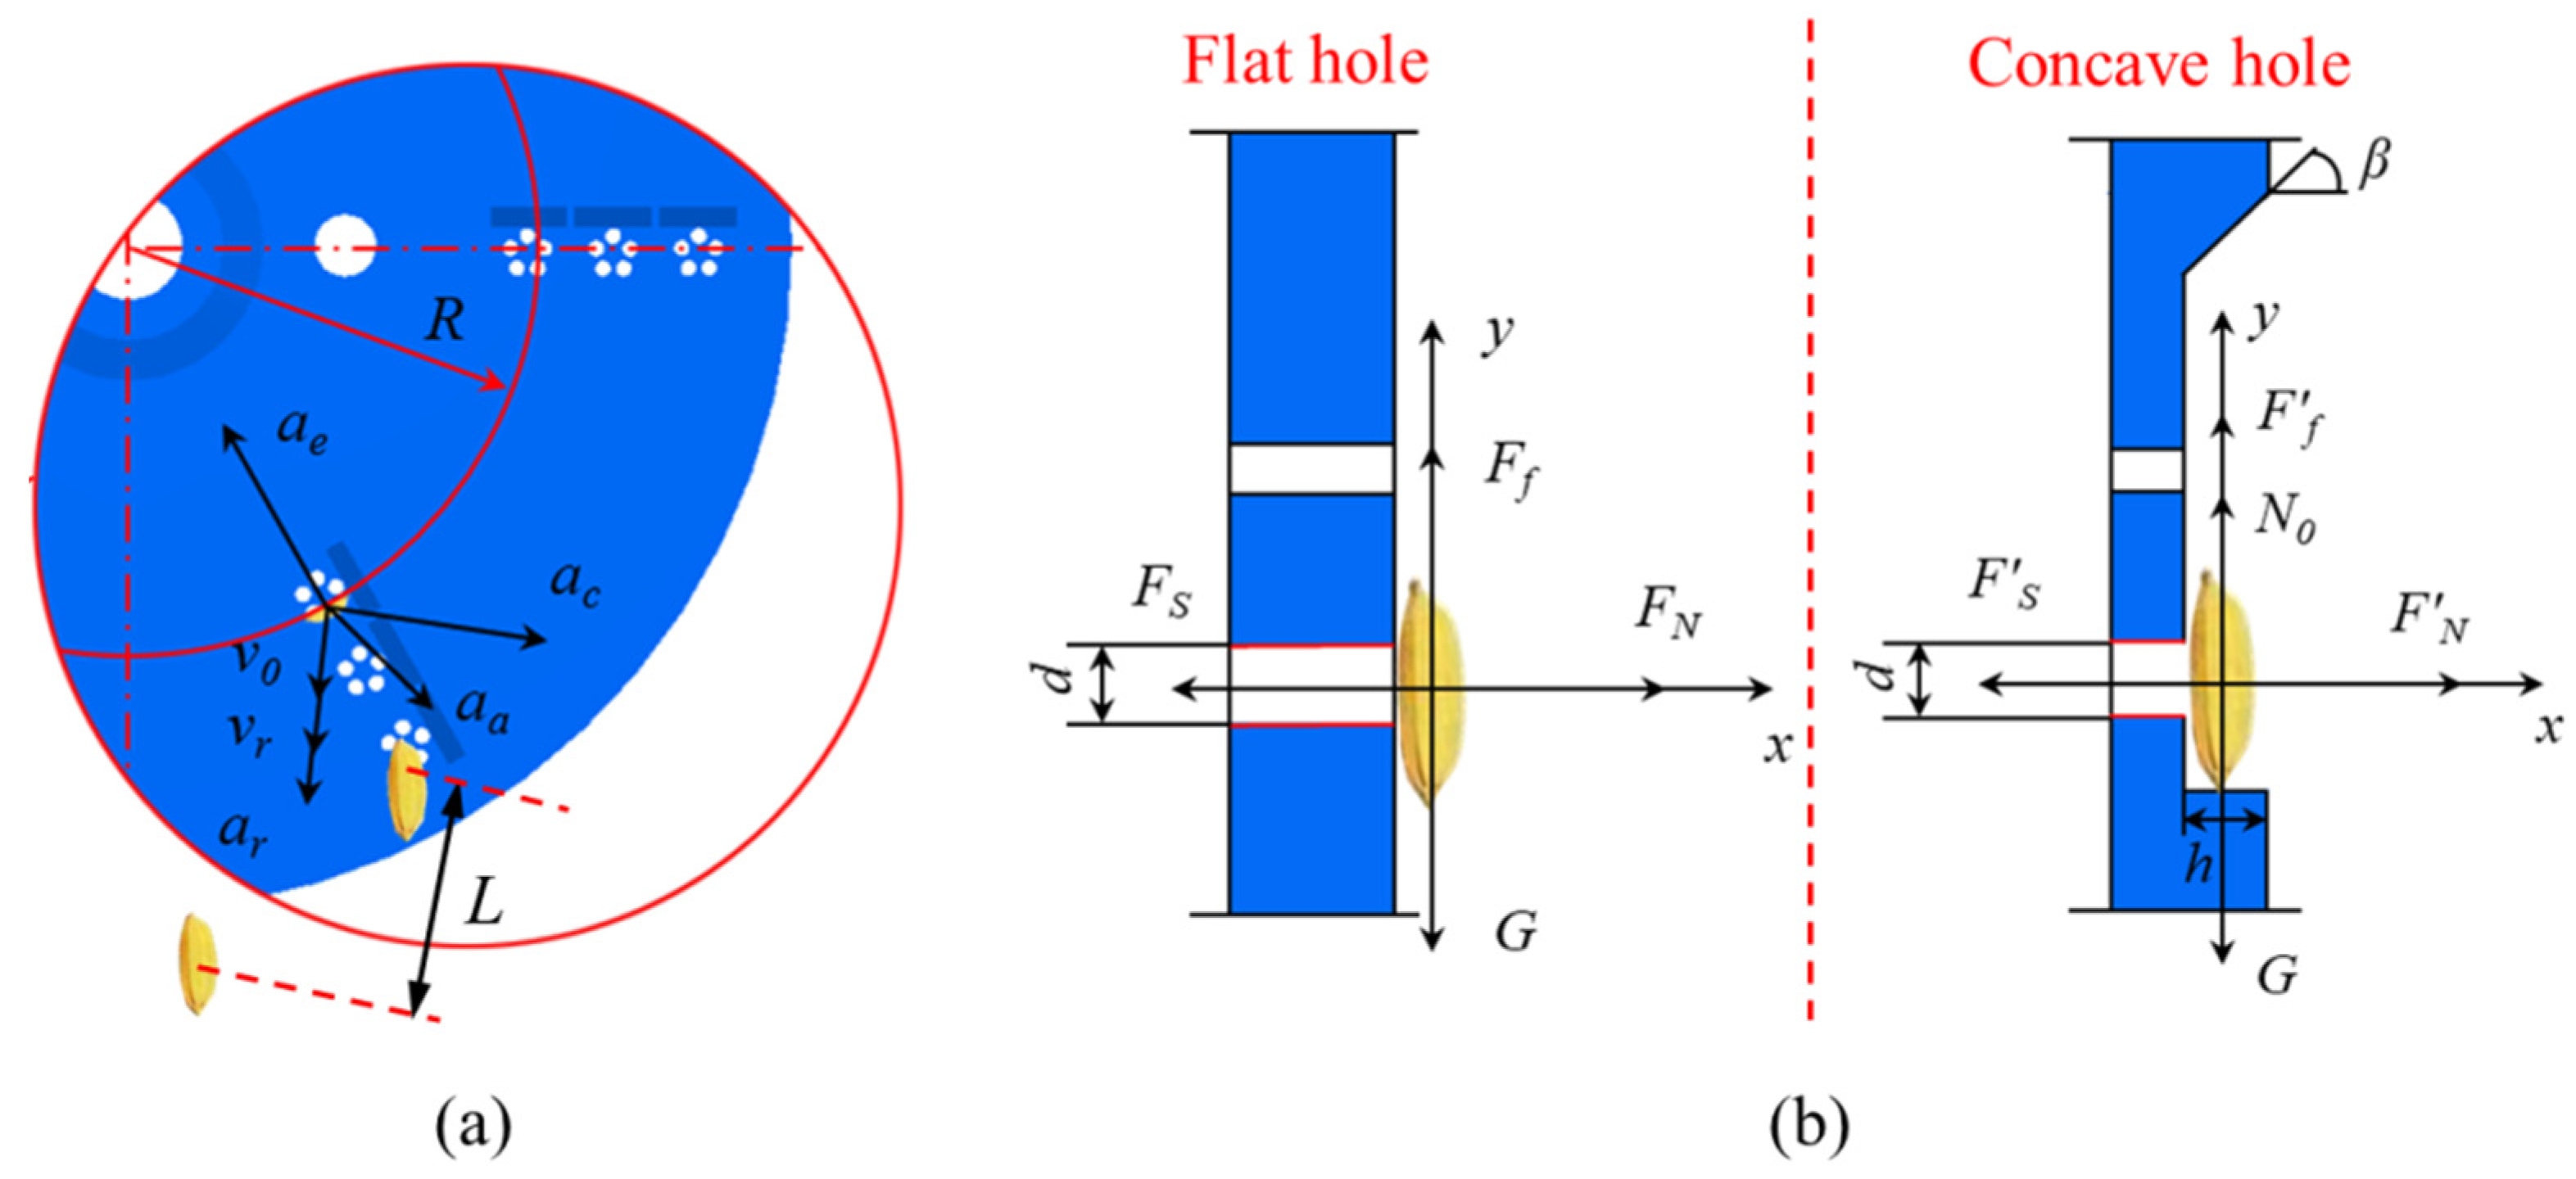
2.2. Analysis on the Seed Metering Mechanism

The seed metering plate is the core working part of the multi-grain cluster air suction type rice hill direct seed metering device, which can effectively ensure that the hole can absorb quantitative seeds and move steadily in a uniform order. The analysis of the force state and motion characteristics of seeds during seed metering can provide a reference for the optimal design of relevant parameters and the response mechanism of reseeding and mis-seeding.
At the moment when the rice seed is completely adsorbed in the type hole, its motion can be regarded as a linear motion with respect to the seed metering plate, and the velocity direction is arbitrary. As shown in Figure 2a, the absolute acceleration aa of the seed motion is composed of the implicated acceleration ae, the relative acceleration ar and the Coriolis acceleration ac.
The following equation can be obtained from the kinematic relationship:
{ v r = v 0 + a r t 1 a e = ω 2 R a r = 2 L t 1 2 a c = 2 ω v r s i n 90 ° = 2 ω ( v 0 + 2 L t 1 )
where vr is the seed relative velocity, m/s; v0 is instantaneous initial velocity of seeds before entering the seed filling area, m/s; ar is relative acceleration of seeds, m/s2; ae is absolute acceleration of seeds, m/s2; ac is the Coriolis acceleration of seeds, m/s2; t1 is instantaneous time before seeds are adsorbed, s; L is the vertical movement distance from the beginning of seed adsorption to the relative speed of 0 (i.e., complete adsorption) with the seed metering plate, mm.
The absolute acceleration aa of rice seeds can be obtained from Equation (2):
a a = ( a e 2 + a r 2 + a c 2 ) 1 2
Substituting Equation (2) into Equation (1) yields the following equation:
a a = { ( ω 2 R ) 2 + ( 2 L t 1 2 ) 2 + [ 2 ω ( v 0 + 2 L t 1 ) ] 2 } 1 2
From Equation (3), we can get: aa increases with the increase of v0. The larger the aa, the more “active” the motion state of rice seeds is, making the seeds easier to be adsorbed on the pores. It can reduce the rate of mis-seeding. That means that the stirring brush makes it easier to for the seed to adsorb on the hole.
In order to compare and analyze the rationality of the concave hole design, the force analysis of the seed adsorption process was carried out with the plane hole type seed metering plate as the reference object, as shown in Figure 2b.
For the planar hole type seed metering plate, when the seed metering plate adsorbed the seeds and moved in a uniform circular motion, the seed balance equation was established as follows:
{ F x F S = F N F y = m ω 2 R F f G = m ω 2 R
F f = μ f F N
P = 4 π d 2 F S = 4 π d 2 μ f ( m ω 2 R + G )
where FS is the adsorption force of the seeds on the seed metering plate by the seed metering plate, N; FN is the support force of the seeds on the seed metering plate by the seed metering plate, N; Ff is the internal friction force of the seeds on the seed metering plate by the seed metering plate and the seed population, N; m is the mass of the seeds, g; G is the gravity force of the seeds, N; ω is the rotational speed of the seed metering plate, rad/s; R is the radius where the suction hole is located, mm; μf is the sliding friction coefficient; P is the negative pressure of the seed metering plate without hole, Pa; d is the diameter of the suction hole, mm.
For the concave hole type seed metering plate, the seed balance equation is as follow:
{ F x F S = F N F y = m ω 2 R F f + N 0 G = m ω 2 R
P = 4 π d 2 F S = 4 π d 2 μ f ( m ω 2 R + G N 0 )
where FS′ is the adsorption force of the seeds on the seed metering plate by the seed metering plate, N; FN′ is the support force of the seeds on the seed metering plate by the seed metering plate, N; Ff′ is the internal friction force of the seeds on the seed metering plate by the seed metering plate and the seed population, N; N0 is the support force of the seeds by the type hole, N; P′ is the negative pressure of the seed metering plate, Pa.
It can be seen from Equations (6) and (8) that the concave in the hole will support the seed, which can partially offset the friction Ff on the seed. This makes it easier for the relative vacuum degree of the negative pressure air chamber required by the seed metering plate lower, that is, under the same conditions, to adsorb seeds and reduce the mis-seeding rate. In the seed carrying area, the mechanical model of seed suction is similar to that in the seed suction area. The seeds are supported by the side wall of the concave hole or the seeds in the same hole, which also reduces the vacuum requirements in the negative pressure area and improves the seed metering accuracy. To sum up, this study chose to set the hole as the concave type.

2.3. Simulation

During the working process of the air suction seed metering device, the seeds are in the joint action of compound forces inside the seed discharger. Traditional mechanical methods can not completely solve the complex flow problem of rice seeds. Therefore, the CFD-DEM coupling method is used to study and analyze the working process and flow field characteristics of the seed metering device.

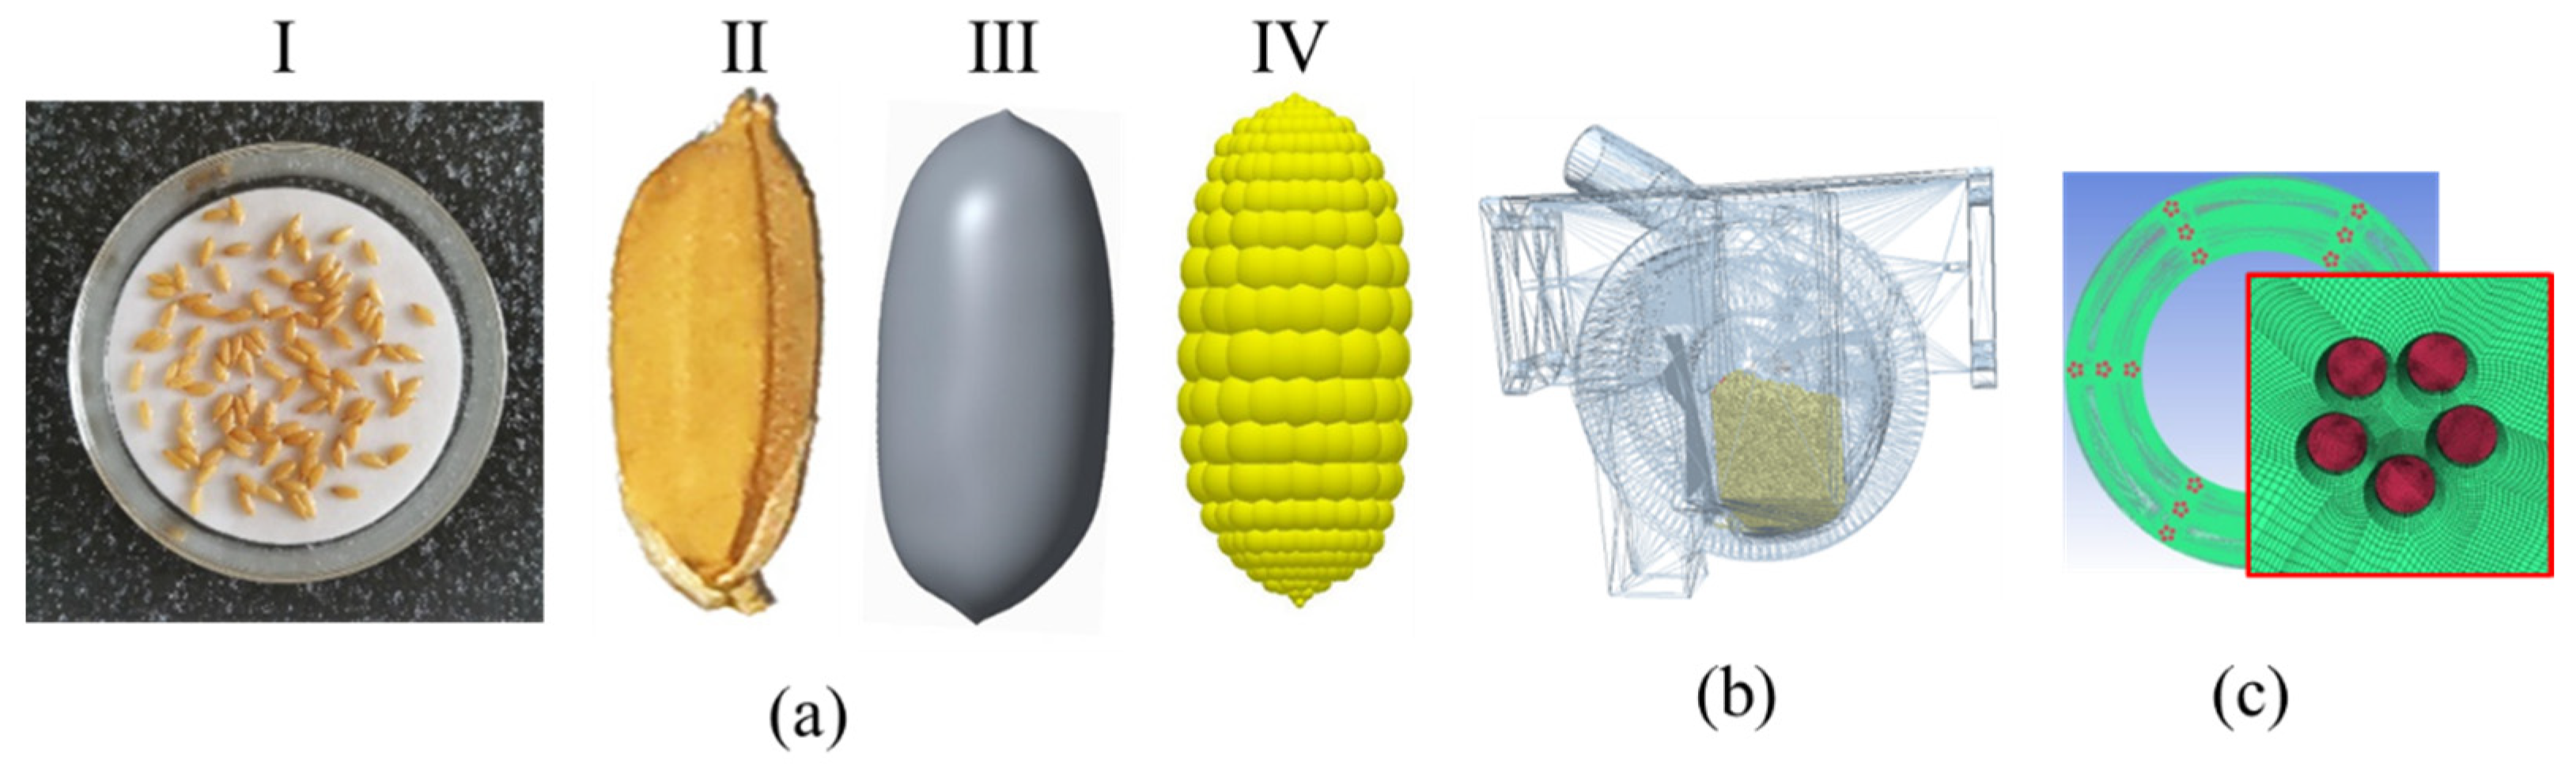
2.3.1. Simulation Model Establishment

Establish the simulation model of “Suijing 18”, which is widely planted in Northeast China, the main rice producing area in China. The triaxial size of “Suijing 18” seed was 5.8 mm × 1.8 mm × 1.3 mm, 1000 grain weight of 25.8 g, long grain type. A 3D scanner (Nanjing Weibu 3D Technology Co., Ltd., Nanjing, China) was used to scan and reverse-engineer the rice seeds established by the spherical element particle aggregation method, as shown in Figure 3a.
The simulation model was imported into EDEM, as shown in Figure 3b. The model was meshed in ICEM and set the global size as 10 mm and the seed metering plate hole local size as 0.5 mm. The overall quality of the mesh was more than 0.48, as shown in Figure 3c. Then, the mesh model was imported in msh format for numerical simulation.

2.3.2. Simulation Parameters and Boundary Settings

According to the relevant reference literature [23,24] and the preliminary material parameter test calibration, the simulation parameters between each material and component were set as shown in Table 2.
All surfaces in contact with the suction hole were defined as INTERFACE and the rest of the boundaries as WALL. The mesh file was imported into Fluent, the k-ε turbulence model and standard model were chosen in the parameter settings. The boundary conditions were set as pressure inlet and pressure outlet, respectively.
To simulate the actual seeding state, EDEM particle factory was set to generate particles with zero initial velocity at the rate of 1500 particles/s, with a total amount of 3000 particles. The total simulation time was 10 s, the fixed time step was 3.9 × 10⁶ s, and the total time to produce the particles was 2 s.
CFD-DEM coupling simulation needs to ensure that the rotational speed of the seed metering plate set in EDEM is the same as the rotational speed of the hole in the matching fluid region set in Fluent. The time step in EDEM was set to 1.0 × 10⁻⁵ s, and the time step in Fluent was usually 50~100 times that of EDEM, and 5 × 10⁻⁴ s was chosen as the time step in Fluent. A set of data was saved every 0.01 s.

2.3.3. Test Factors and Indicators
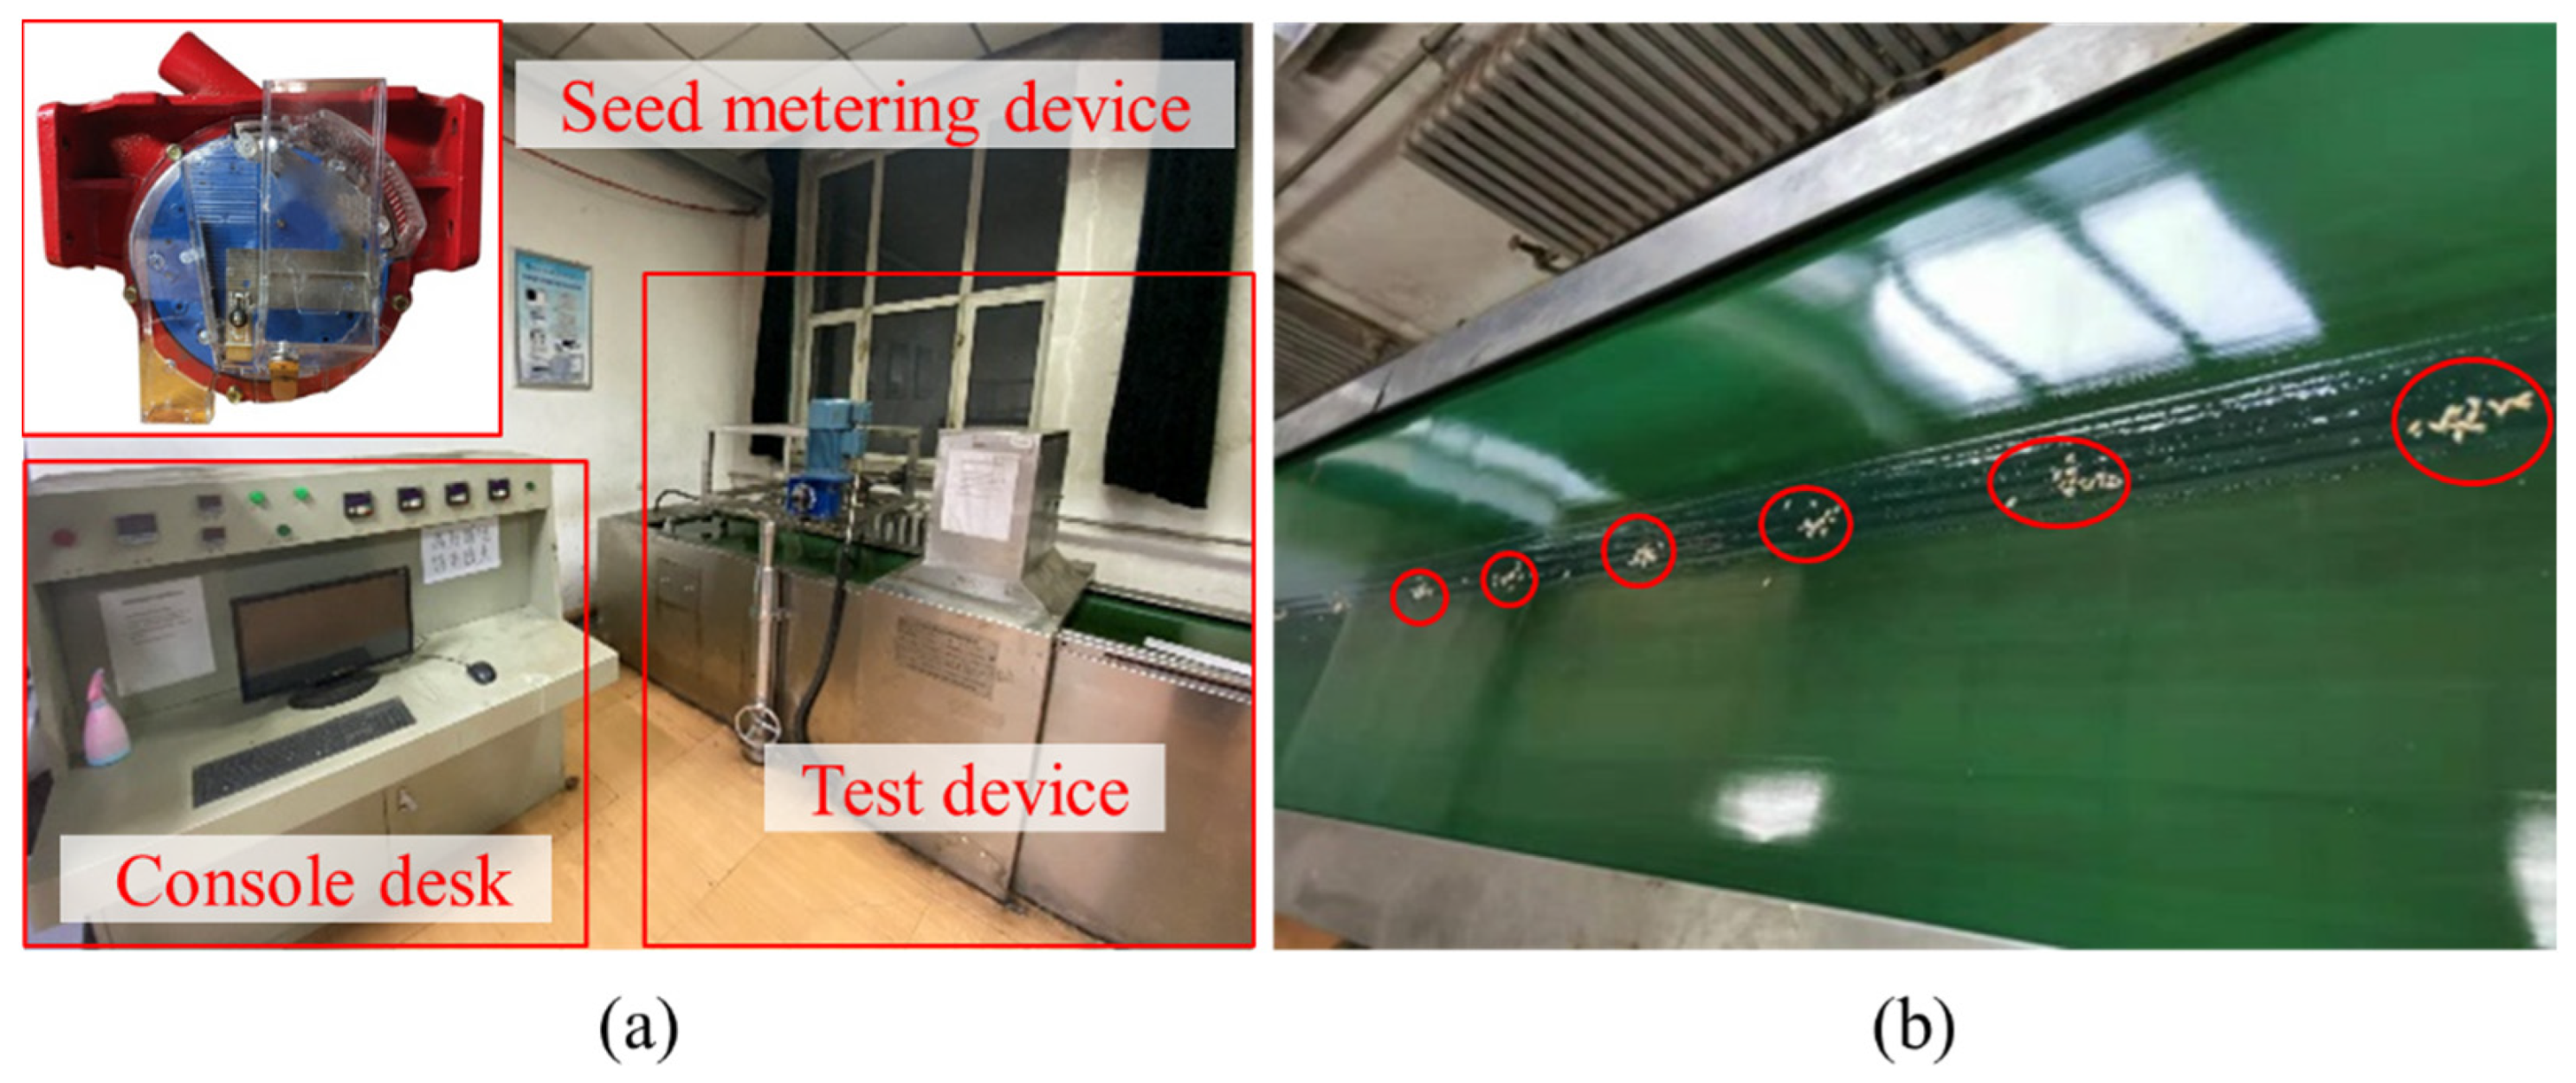
The airflow pressure mainly affects the airflow distribution in the seeding tray. In order to visually analyze the flow field distribution of the seeding tray at different pressures, a single-factor simulation test was conducted at −3 kPa, −4 kPa and −5 kPa (the speed of the seeding tray was 22 rpm). The seed metering qualification index, reseeding index and mis-seeding index were explored through simulation test. The calculation method of each index is shown in Equation (9).
{ Q n = n 1 N n × 100 % R n = n 2 N n × 100 % M n = n 3 N n × 100 %
where Q n is the qualification index; n 1 is the number of holes with 13–17 rice seeds per hole; N n is the number of statistical row holes; R n is the reseeding index; n 2 is the number of holes with 17 rice seeds per hole; M n is the missing index; n 3 is the number of holes with 13 rice seeds per hole.

2.4. Bench Test

For verifying the accuracy of the virtual simulation test parameters and to investigate the effects of various factors on seed row performance, a bench test was conducted in the seed metering performance laboratory of Northeast Agricultural University in Harbin, Heilongjiang Province, as shown in Figure 4. “Suijing 18” rice seed was selected as the test material. The test device was a JPS-12 seed metering device performance test-bench developed by Heilongjiang Academy of Agricultural Machinery Engineering. The test design was carried out with reference to “GB/T6973—2005 test methods for single seed (precision) seed metering device”.
The negative pressure and working rotating speed of the air suction seed metering device are the most important factors affecting the performance of the seed metering device. Combined with the key components and overall structure designed in this study, the three-factor and five-level orthogonal rotational combination test was carried out with the rotating speed of the seed metering plate, the negative pressure and the stirring brush length as the test factors, and the qualification index, reseeding index and mis-seeding index as the test indicators. The effects of various experimental factors on seed metering performance and the best parameter combination of experimental factors were explored. The coding table of test factor level is shown in Table 3.
During the test, the seed metering device was fixed on the bench and the seed bed belt was moved in reverse relative to the seed metering device to simulate the forward motion of the planter. The oil spray pump sprayed oil on the seed bed belt, and the seeds fell from the seed discharge port onto the seed bed belt coated with oil layer, and the data was collected through the camera processing device for real-time detection to achieve accurate measurement of each seed discharge performance index.
In order to verify the accuracy of the multi-factor optimization test on the metering performance of the multi-grain cluster air suction type rice hill direct seed metering device, and to test the suitable sowing range of the metering device for different varieties of rice seeds, “Suijing 18” and “Longjing 31” (triaxial size of 5.9 mm × 1.9 mm × 1.5 mm, thousand grain weight of 26.3 g), “Longqing 5” (triaxial size of 6.6 mm × 2.5 mm × 1.5 mm, thousand grain weight of 27.0 g) and “Wuyou 4” (triaxial size of 6.3 mm × 2.3 mm × 1.6 mm, thousand grain weight of 26.8 g) were selected for the test, and the qualification index, reseeding index and mis-seeding index were used as test indexes for the validation test. The experimental factors were the best combination of working parameters obtained from the orthogonal rotation combination test of three factors and five levels. Each group of tests was repeated five times, then averaged the results.

3. Results and Discussion

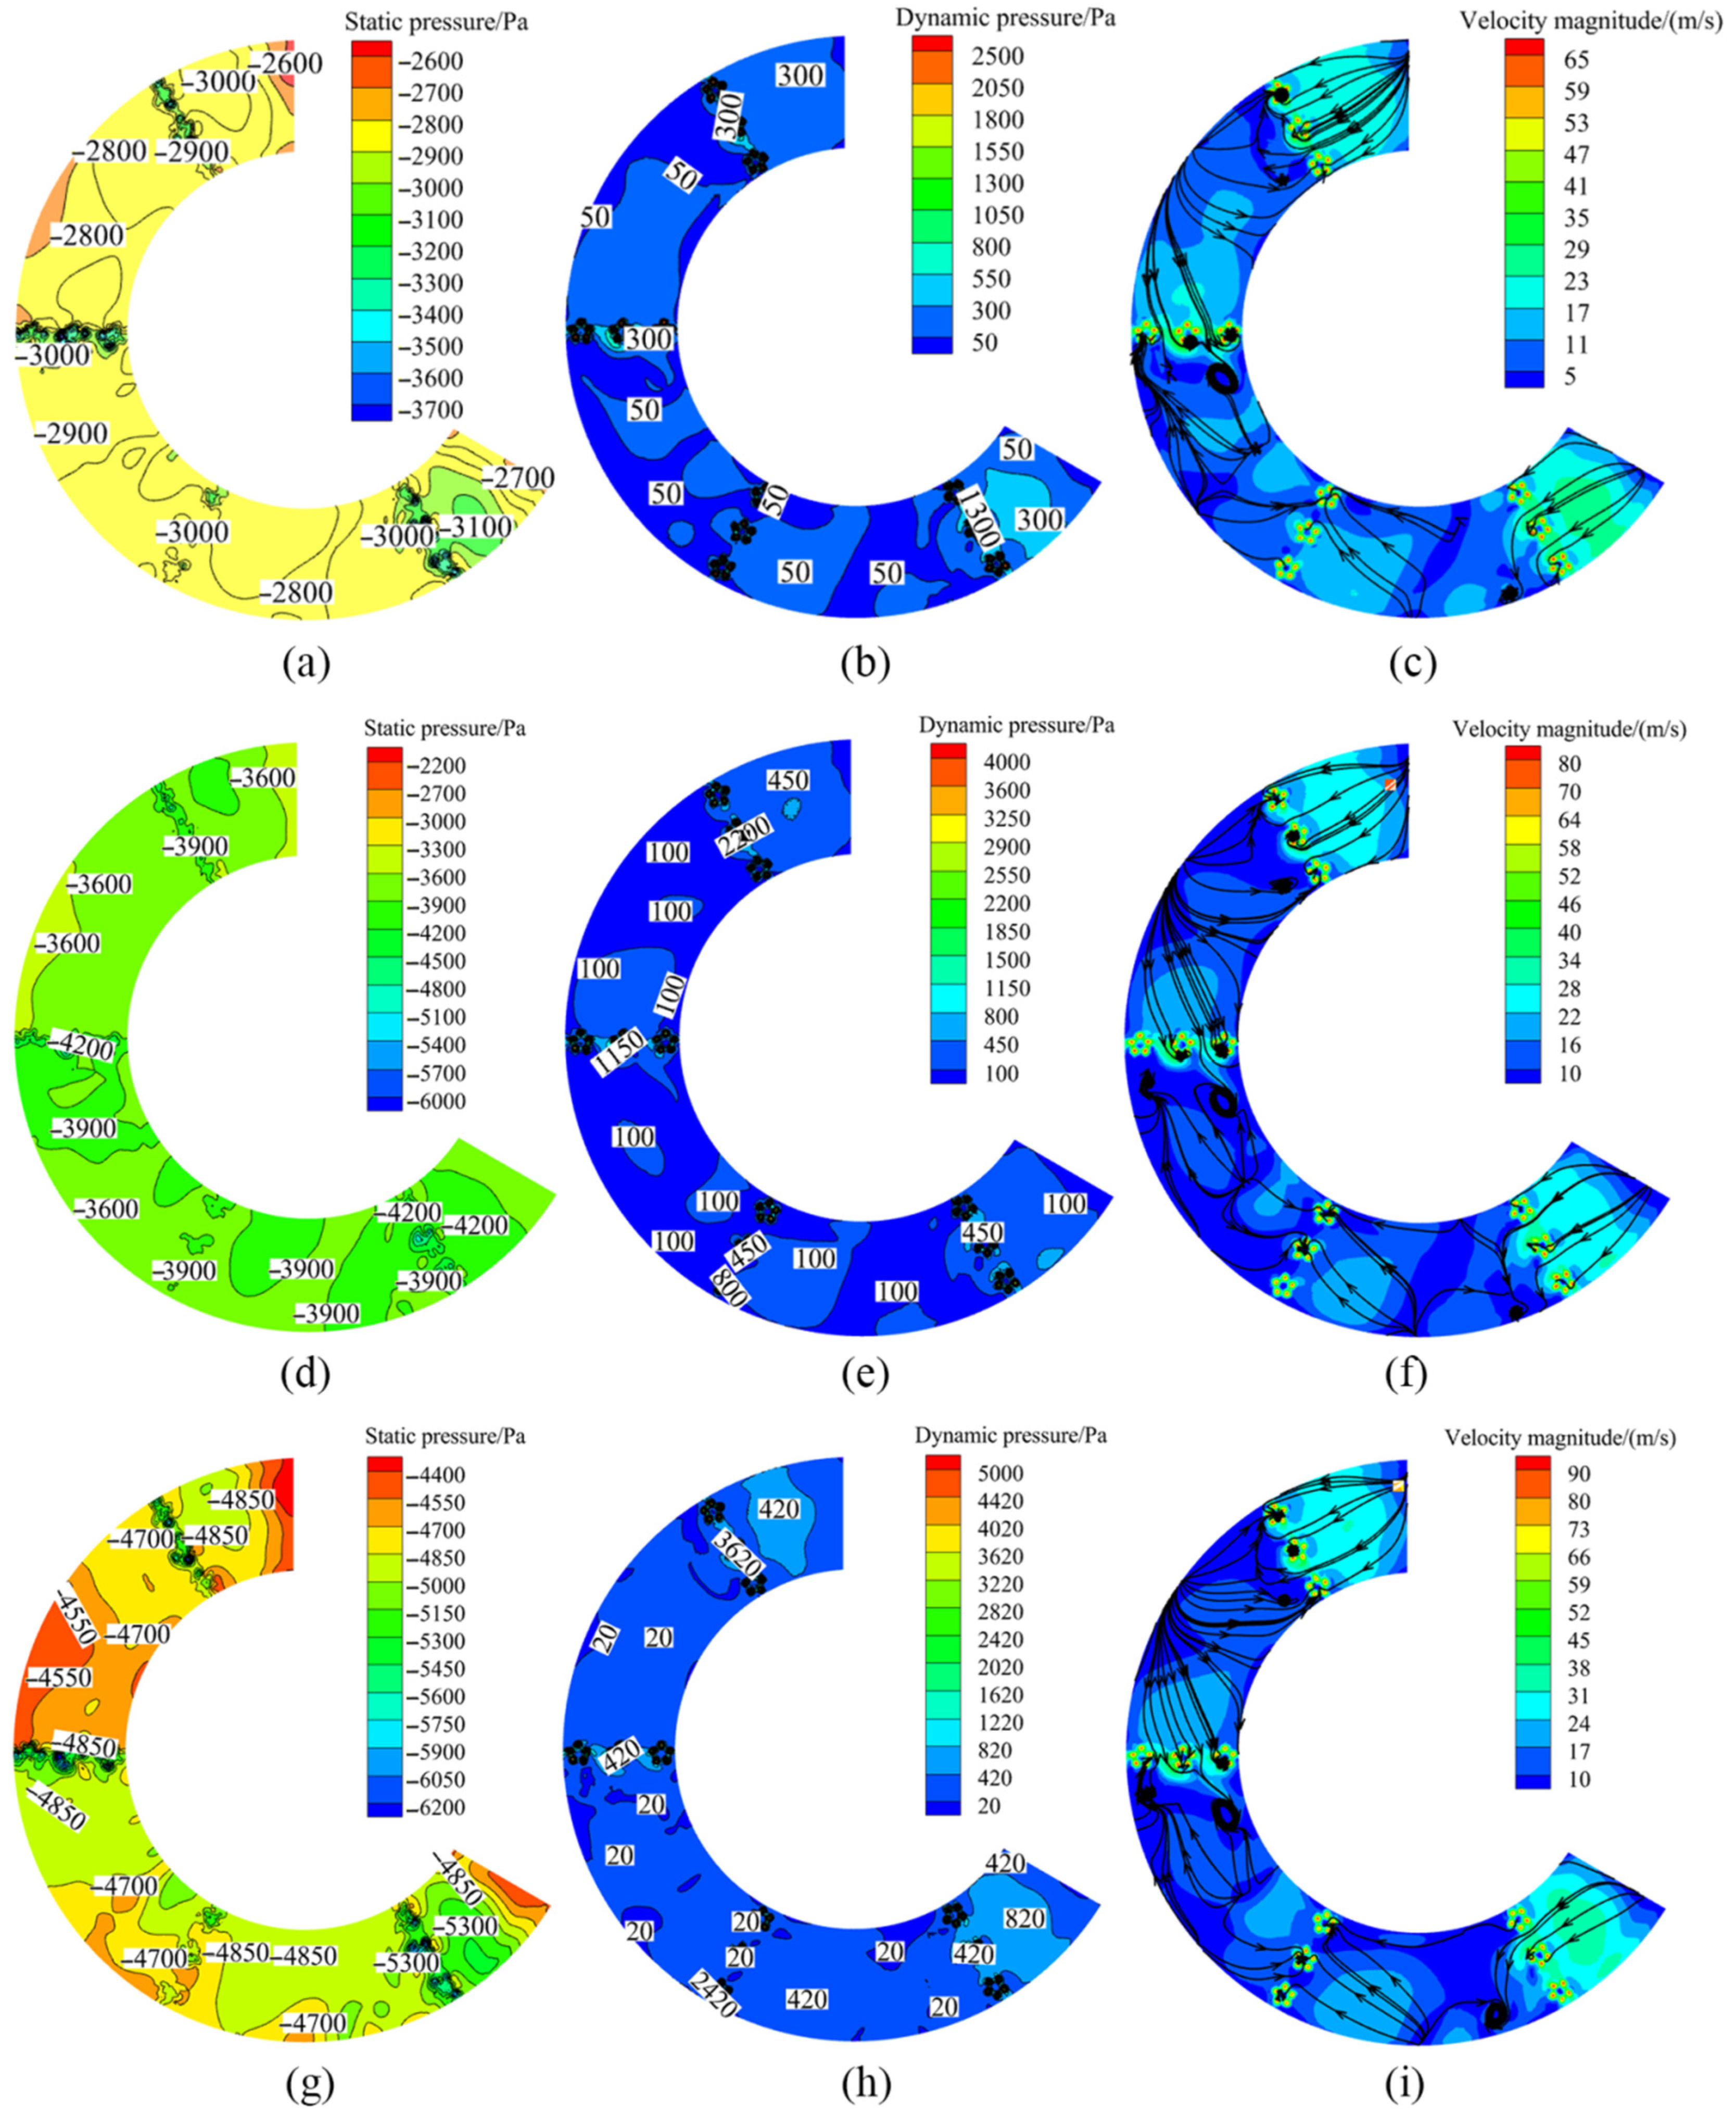
3.1. Simulation Results

The simulation analysis of the flow field of the seed metering plate is shown in Figure 5. When the negative pressure was −3 kPa, the static pressure reached its maximum value at the pressure outlet, which meant the surface force of the airflow on the pressure outlet reached the maximum. With the pressure outlet as the center, the static pressure value gradually decreased outward radiation. Dynamic pressure referred to the pressure that drove the gas movement, that was, the maximum dynamic pressure at the pressure outlet was 2500 Pa. In the area outside the pressure outlet, the dynamic pressure decreased rapidly, indicating that the kinetic energy of the gas flow was mainly concentrated near the pressure outlet. The air velocity reached a maximum of 65 m/s at the pressure outlet, and due to the negative pressure, the airflow mainly entered the air hole from the area near the pressure outlet, and formed a circular decreasing airflow gradient around the air hole, whereas the airflow vortex was formed near the air hole due to the large change in the velocity difference of the airflow. At the intersection of the airflow direction change, the airflow velocity reached a minimum value of 5 m/s.
When the negative pressure was −4 kPa, the static pressure reached maximum value at the pressure outlet, and its maximum static pressure value was greater than the maximum static pressure value when the negative pressure was −3 kPa. With the pressure outlet as the center, the static pressure value gradually decreased outward. The dynamic pressure reached the maximum value of 4000 Pa at the pressure outlet. In the area outside the pressure outlet, the dynamic pressure value decreased rapidly, indicating that the kinetic energy of the airflow was mainly concentrated near the pressure outlet. The velocity of airflow reached the maximum value of 80 m/s at the pressure outlet. Due to the negative pressure, the airflow mainly entered the air hole from the area near the pressure outlet region and formed a circular decreasing airflow gradient around the air hole, whereas the airflow vortex was formed near the air hole due to the large change in the velocity difference of the airflow. At the intersection of the airflow direction change, the airflow velocity reached a minimum value of 10 m/s.
When the negative pressure was −5 kPa, the static pressure reached the maximum value at the pressure outlet. With the pressure outlet as the center, the static pressure value gradually decreased outward. Dynamic pressure at the pressure outlet reached the maximum value of 5 kPa; in the area outside the pressure outlet, the dynamic pressure value decreased rapidly, indicating that the kinetic energy of the airflow was mainly concentrated near the pressure outlet. Due to the negative pressure, the airflow mainly entered the air hole from the area near the pressure outlet and formed a circular decreasing airflow gradient around the air hole, whereas the airflow vortex was formed in the vicinity of the air hole due to the large change in the velocity difference of the airflow. At the intersection of the airflow direction change, the airflow velocity reached a minimum value of 10 m/s.
Through comparative analysis, it can be concluded that as the negative pressure increased, the static pressure, dynamic pressure and velocity all gradually increased, whereas the velocity of the airflow around the pressure outlet (air hole) also gradually increased, and the “additional effect” of this circular airflow adjacent to each other was beneficial to the effective adsorption of seeds. To further investigate the effect of seed adsorption by the seed metering plate within the airflow field, the coupled simulation of the seed metering process and the seed discharge performance are shown in Figure 6.
The qualification index of seed discharge first increased and then decreased, and the qualification index was the largest at −4 kPa with the increase of negative pressure, and the average value was 89.62%. The reseeding index decreased and then increased, and its minimum value was 4.36% at −4 kPa. The mis-seeding index first decreased and then increased, reached smallest at −4 kPa and its average value was 6.02%. The simulation results showed that the seed metering performance did not increase gradually with the increasing of negative pressure. The reason was mainly due to the fact that the higher the negative pressure, the stronger the air hole adsorption capacity of seeds, resulting in seed adsorption between air hole and air hole, not a one-to-one relationship between the number of stomata and the number of seeds. During the rotation of the plate, the seeds between the air hole were not closely adsorbed, resulting in the seeds falling early. The excessive adsorption force of the air hole on the seeds led to delayed seed falling; the disturbance of the seeds’ posture on the air hole during the fall of the seeds between the air hole can also cause the seeds to fall early or with a lag.

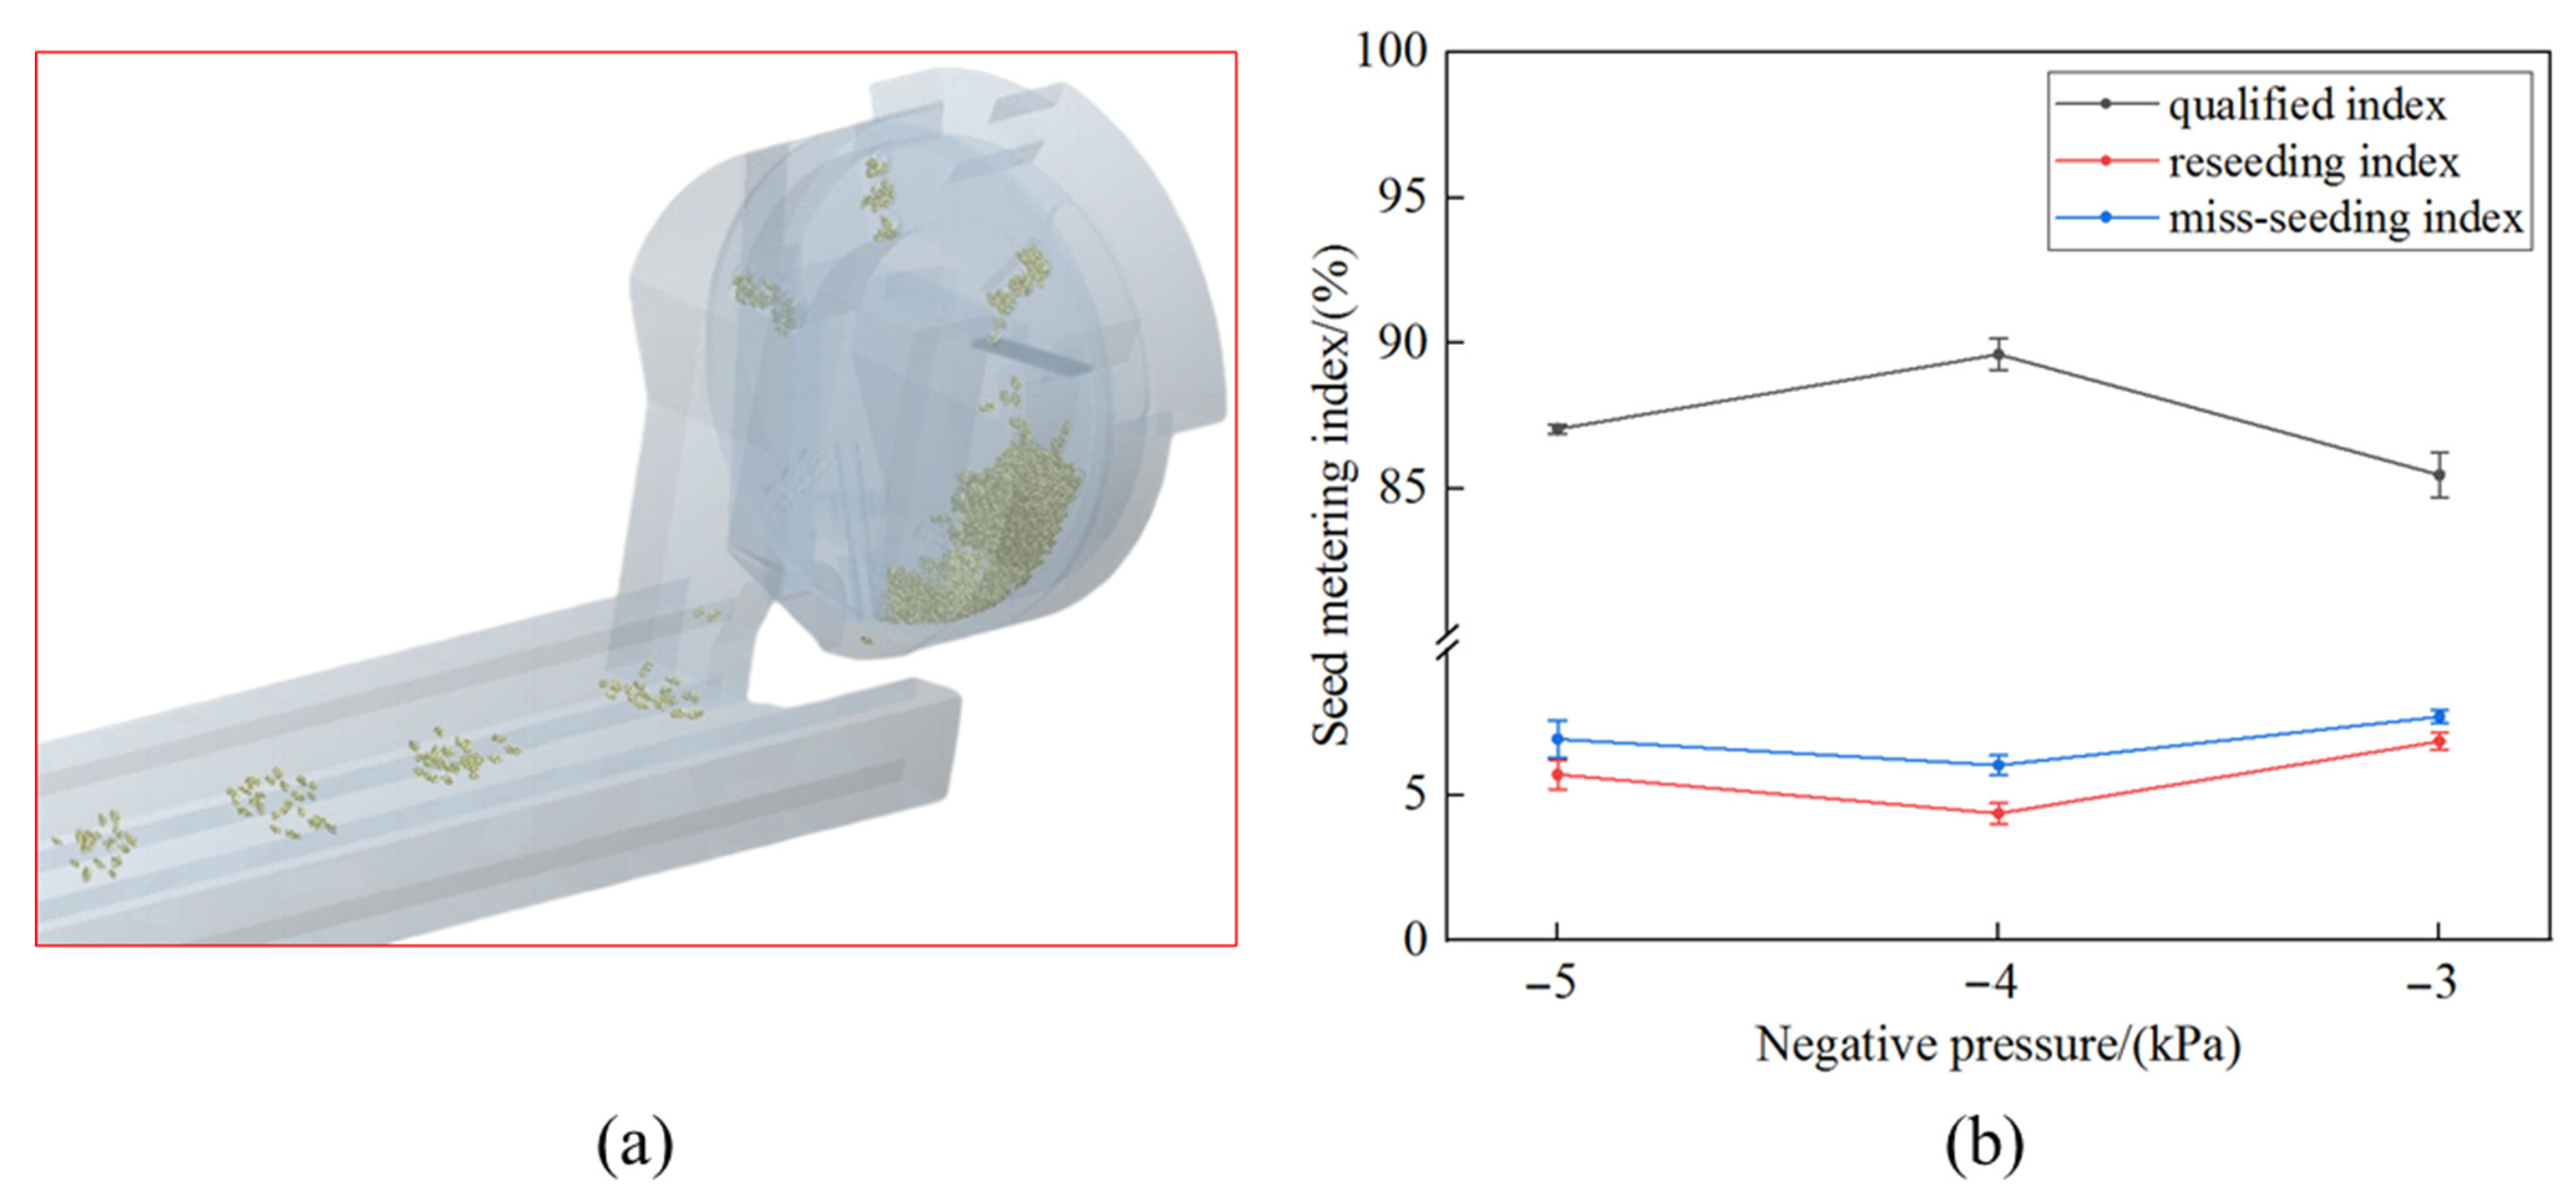
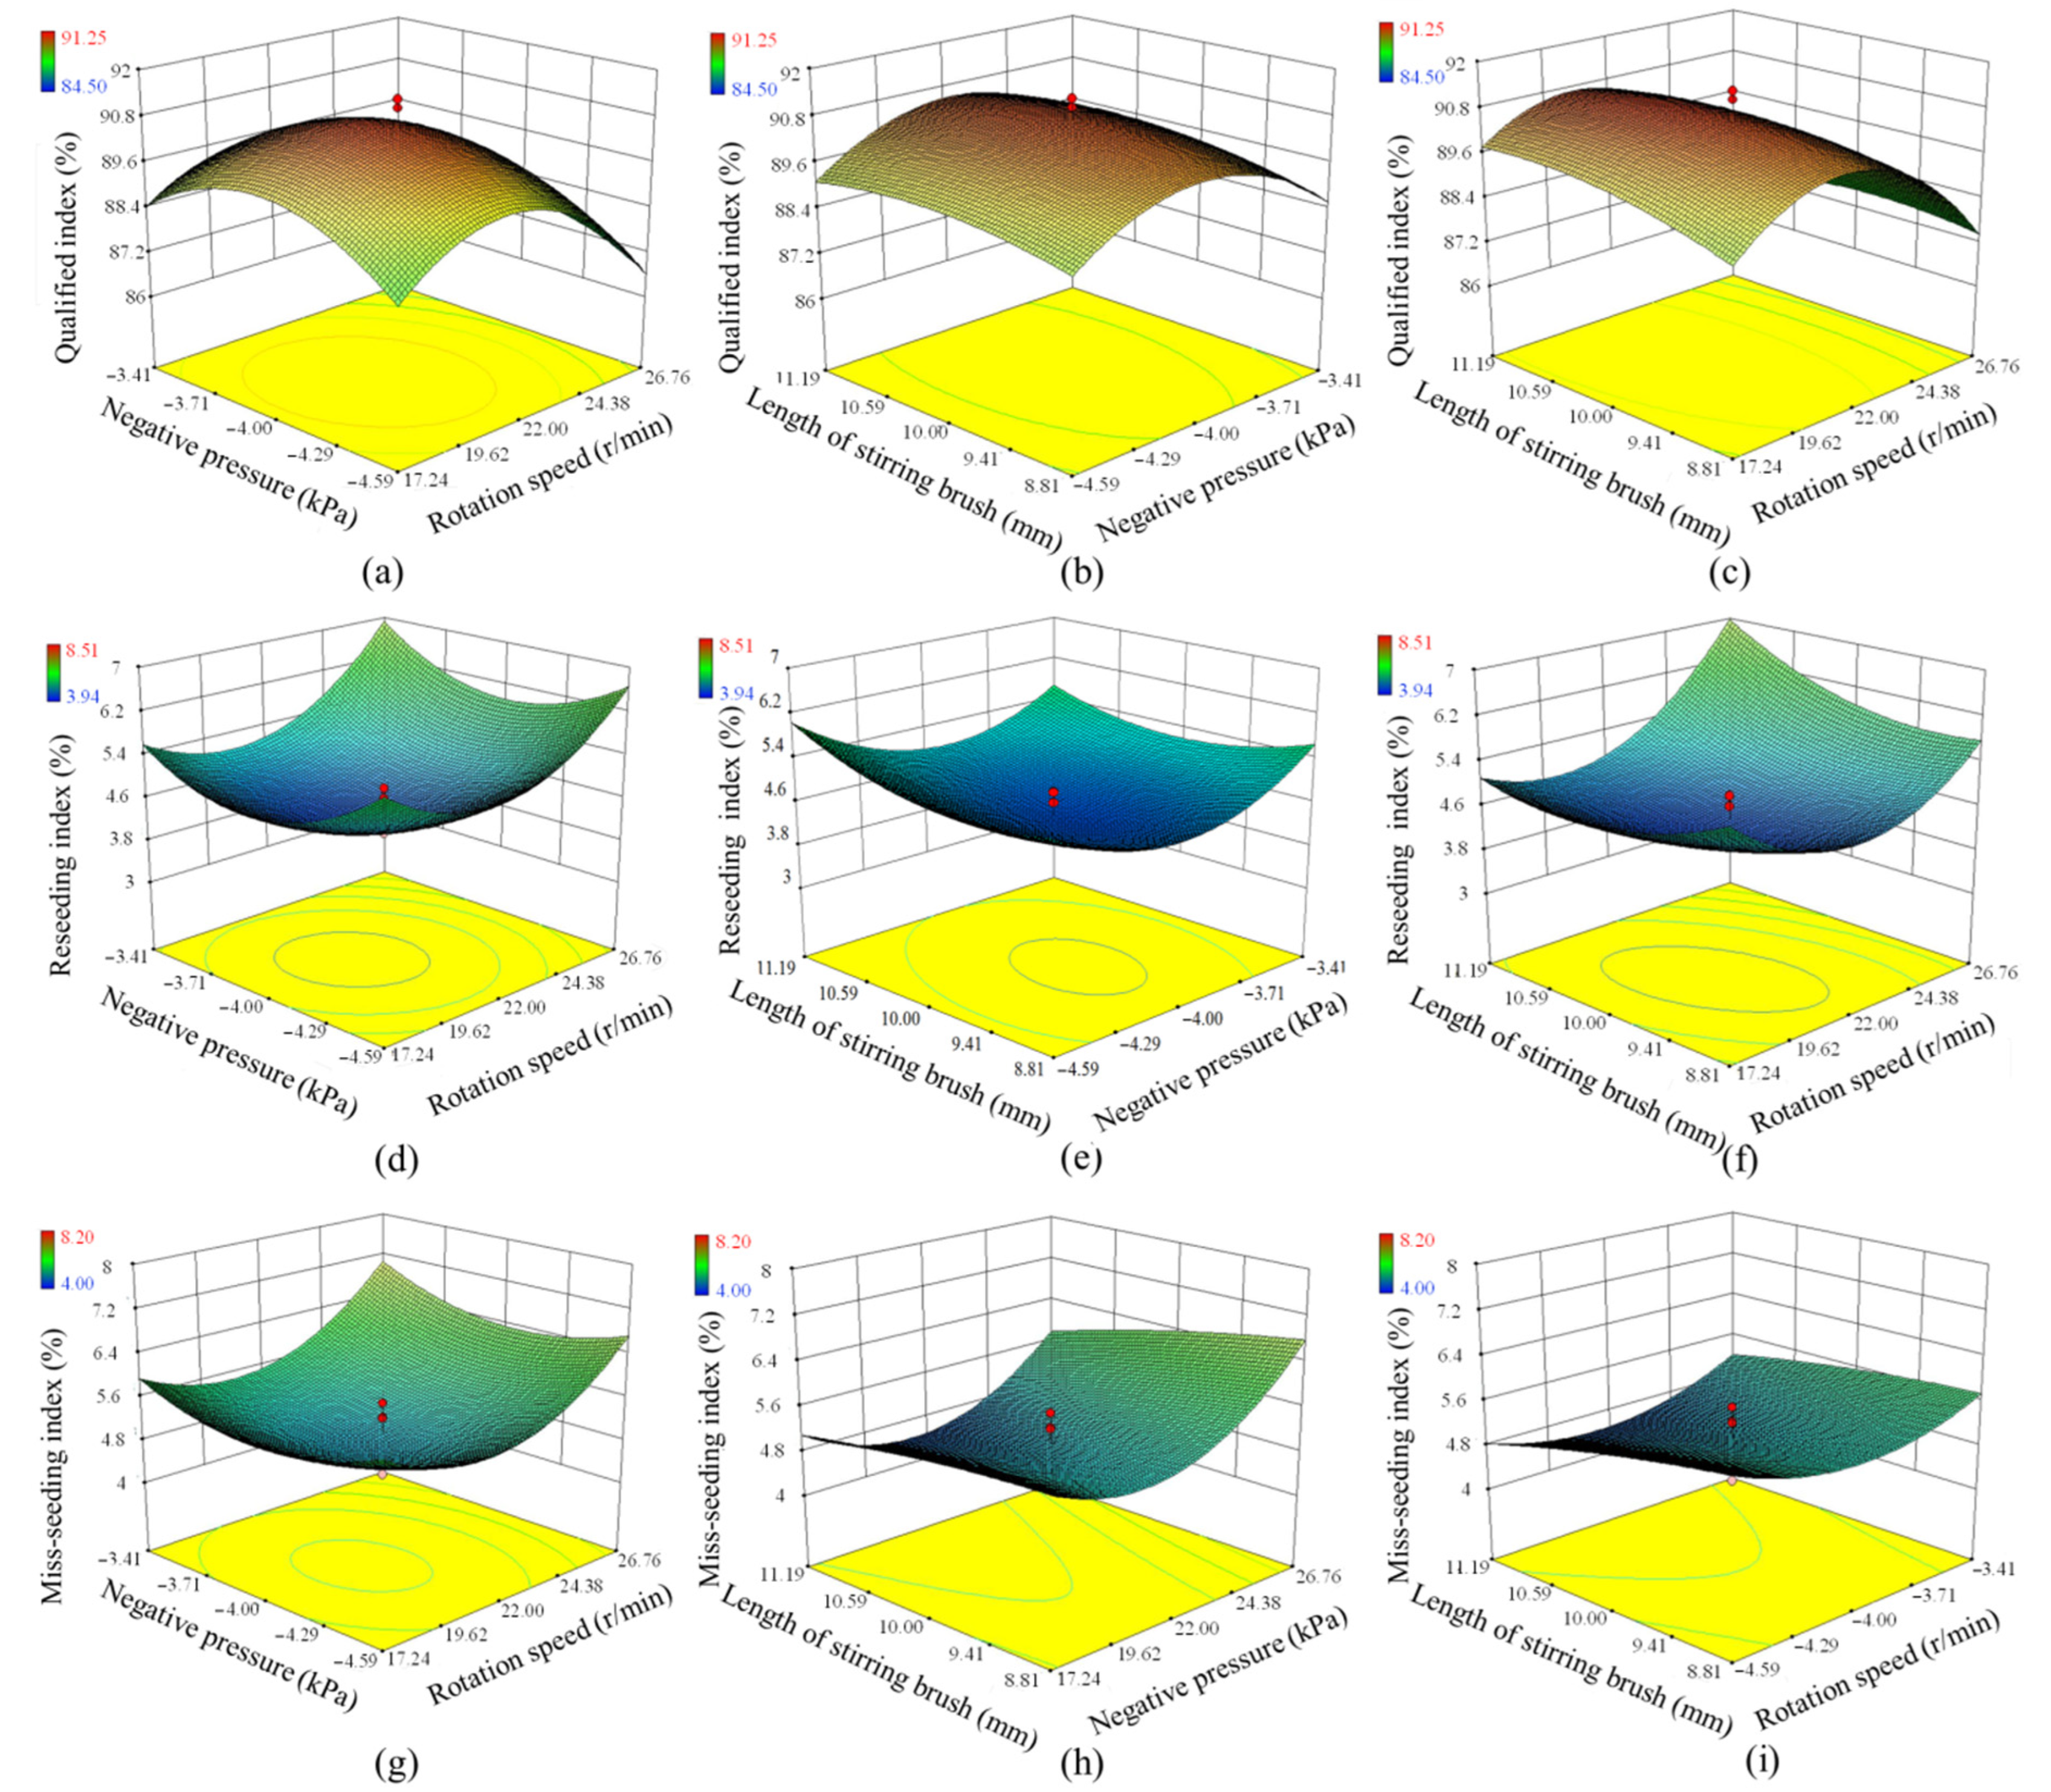
3.2. Bench Test Results

The test protocol and results of the three-factor and five-level orthogonal rotational combination test are shown in Table 4.
Design Expert 8.0.6 software (Stat-Ease, Inc., Minneapolis, MN, USA) was applied to analyze the test results and explore the effects of the three test factors on the qualification index, reseeding index and mis-seeding index, respectively. The variance analysis table of test factors is shown in Table 5.
Analysis of variance of each factor on the qualification index: the factor x 1 2 and x 2 2 significance level was less than 0.01, indicating that these parameters were highly significant; the factor x 1 and x 2 significance level was less than 0.05, indicating that these parameters were significant; and thew factor x 3 , x 1 x 2 and x 2 x 3 significance las evel less than 0.1, indicating that these parameters were relatively significant.
Analysis of variance of each factor on reseeding index: factors x 1 , x 1 2 and x 2 2 significance levels were less than 0.01, indicating that these parameters were highly significant; factors x 1 x 3 and x 3 2 significance levels were less than 0.05, indicating that these parameters were significant; and factors x 1 x 2 and x 3 significance levels were lss than 0.1, indicating that these parameters were relatively significant.
Analysis of variance of each factor on the mis-seeding index: x 1 , x 1 2 and x 2 2 significance levels were less than 0.01, indicating that these parameters were highly significant; x 3 and x 1 x 3 significance levels were less than 0.05, indicating that these parameters were significant; and x 2 significance levels were less than 0.1, indicating that this parameter was relatively significant.
The regression models of qualification index, reseeding index and mis-seeding index were very significant, indicating that the fitting effect was good. Taking the qualification index y1’, reseeding index y2’ and y3’ mis-seeding index as the response function and the level value of each factor as the independent variable, the fitted regression equation is as follows:
{ y 1 = 90.68 0.98 x 1 0.07 x 2 + 0.19 x 3 1.99 x 1 2 1.39 x 2 2 0.24 x 1 x 2 + 0.07 x 2 x 3 y 2 = 57.26 2.12 x 1 7.48 x 3 + 0.05 x 1 2 + 0.05 x 2 2 + 0.32 x 3 2 + 0.17 x 1 x 2 + 0.08 x 1 x 2 0.04 x 1 x 3 y 3 = 7.43 0.99 x 1 0.21 x 2 + 1.23 x 3 + 0.04 x 1 2 + 0.03 x 2 2 + 0.32 x 3 2 0.02 x 1 x 3
where y1’ is the qualification index, %; y2’ is the reseeding index, %; y3’ is the mis-seeding index, %; x 1 is the rotation speed of seed metering device, rpm; x 2 is the negative pressure of seed metering device, kPa; x 3 is the length of stirring brush, mm.
On this basis, Design Expert 8.0.6 software was used to establish the response surface diagram of the effects of working rotating speed, negative pressure and stirring brush length on the qualification index, reseeding index and mis-seeding index, as shown in Figure 7.
Figure 7a–c shows that when the rotation speed is fixed, the qualification index increases slowly with increasing of the length of the stirring brush; it first increased and then decreased with increasing of negative pressure. When the length of stirring brush is fixed, the qualification index increases first and then decreases with the increase of rotation speed and then decreases with the increasing negative pressure. When the negative pressure is fixed, the qualification index first increases and then decreases with the increasing speed, and basically remains unchanged with the increasing length of the stirring brush. When the rotation speed and negative pressure change at the same rate, the qualification index changes greatly with the rotation speed, so the rotation speed has a more significant influence on the reseeding index than the negative pressure. When the negative pressure and the length of stirring brush change at the same rate, the qualification index changes greatly with the negative pressure, so the negative pressure has more significant influence on the reseeding index than the length of stirring brush. When the rotation speed and the length of stirring brush change at the same rate, the qualification index changes greatly with the rotation speed, so the rotation speed has more significant influence on the qualification index than the length of stirring brush. In conclusion, the order of significant impact on seed metering qualification index is: rotation speed > negative pressure > length of stirring brush.
Figure 7d–f shows that when the rotation speed is fixed, the reseeding index increases with the absolute value of negative pressure and slowly with increasing length of the stirrer brush. When the negative pressure is fixed, the reseeding index increases slowly with the increasing of rotation speed, but does not change significantly with the increasing length of stirring brush. When the length of stirring brush is fixed, the reseeding index increases rapidly with the absolute value of negative pressure and slowly with increasing rotation speed. When the rotation speed and negative pressure change at the same rate, the reseeding index changes greatly with the rotation speed, so the rotation speed has more significant influence on the reseeding index than the negative pressure. When the negative pressure and the length of stirring brush change at the same rate, the seeding index changes greatly with the negative pressure, so the negative pressure has more significant influence on the seeding index than the length of stirring brush. When the rotation speed and the length of stirring brush change at the same rate, the reseeding index changes greatly with the rotation speed, so the rotation speed has more significant influence on the reseeding index than the length of stirring brush. In conclusion, the order of significant impact on reseeding index is: rotation speed > negative pressure > length of stirring brush.
Figure 7g–i shows that when the rotation speed is fixed, the mis-seeding index first decreases and then increases with the absolute value of negative pressure, and then decreases with the increasing length of stirring brush. At a certain negative pressure, the mis-seeding index increases with increasing rotation speed and decreases with increasing length of stirring brush. When the length of stirring brush is fixed, the mis-seeding index decreases slowly with the increasing absolute negative pressure and increases rapidly with the increase of rotation speed. When the rotation speed and negative pressure change at the same rate, the mis-seeding index changes greatly with the rotation speed, so the rotation speed has a more significant influence on the mis-seeding index than the negative pressure. When the negative pressure and the length of stirring brush change at the same rate, the mis-seeding index changes greatly with the length of stirring brush, so the length of stirring brush has more significant influence on the mis-seeding index than the negative pressure. When the rotation speed and the length of stirring brush change at the same rate, the mis-seeding index changes greatly with the rotation speed, so the rotation speed has more significant influence on the mis-seeding index than the length of stirring brush. In conclusion, the order of significant impact on the mis-seeding index is: rotation speed > length of stirring brush > negative pressure.
To maximize the qualification index and minimize the reseeding index and the mis-seeding index, the combination of parameters is optimized, and the parameter model of nonlinear programming is established as shown in Equation (11).
{ max y 1 min y 2 min y 3 s . t . 14.0   r / min x 1 30.0   r / min 5   kPa x 2 - 3   kPa 8   mm x 3 12   mm   0 y 2 1 0 y 3 1
According to the significance of each factor affecting the seeding performance index, the parameter optimization contour map was established with the minimum significant factor as the fixed value, as shown in Figure 8. When the rotation speed, negative pressure and mixing brush length were 20.70 rpm, −4.0 kPa and 10.50 mm respectively, the seeding performance is the best, with aqualification index of 90.85%, reseeding index of 4.41% and missed index of 4.74%.

3.3. Analysis of Sowing Suitability Test Results

The results of a sowing suitability test for four rice varieties are shown in Table 6. There was no significant difference between “Suijing 18” and “Longjing 31” in the rice seed qualification index (p < 0.05). The seed qualification index of “Suijing 18” was significantly higher than that of “Longqing 5” and “Wuyou 4” (p < 0.05), but the maximum difference between the three was only 1.82%. The main reason for this phenomenon is that the overall sizes of “Longqing 5” and “Wuyou 4” are larger than that of “Suijing 18”. During filling, it was easy to cause the squeezing between grains, which resulted in the insecurity of seed adsorption. During the process of transportation and seeding, the seed fell off the plate, resulting in reseeding and missed seeding, which led to the decrease of qualification index. Comparing the reseeding index and mis-seeding index of “Suijing 18” and “Longqing 5”, which had the largest size difference, the indexes between the two rice varieties also had significant differences (p < 0.05), which supported the above analysis conclusion.
According to the overall analysis of performance indexes of four rice varieties, the qualification index ranged from 89.52% to 91.34%, and it had strong seeding adaptability to different rice varieties and meets the agronomic requirements of rice hill direct seeding (qualification index > 75%).

3.4. Discussion

Traditional rice seed metering devices were mostly mechanical seed metering devices, which are transferred and discharged by a fixed scoop or outer groove wheel. Although this operation method can achieve the purpose of seed metering, the mechanical seed metering device made full contact with the seed, which easily caused seed injury problems. Meanwhile, this method cannot be used universally for multi-grain and multi-seeding of different varieties and types of rice. For example, seeds with large differences in seeding sizes will significantly reduce the rate of qualified seeding. At present, an air-suction seed metering device is mostly used for single-grain single-seeding seed types, such as corn, soybean, etc. The research applied to rice is also multi-grain seeding according to the characteristics of single-grain adsorption, which is suitable for super-rice with a small number of seeding grains [25].
This paper innovatively designed a single-hole and multi-grain cluster-type seed metering method, which was suitable for multi-grain rice metering through the principle of air suction, avoiding seed injury caused by mechanical metering devices, and achieving the effects of stable filling, smooth transport and effective seed delivery. Through bench test, it was verified that the seed metering qualification index (89.52~91.34%) satisfies the agronomic requirements of rice seeding, which is higher than 87.04% [8] of the mechanical rice metering device currently studied, and has good adaptability to different rice varieties. In this study, a disturbance filling mechanism was established, which can effectively improve the filling rate of multi-grain seeds. The disturbance is not a traditional vibration but an attempt to maximize surface area adsorption by changing the movement posture of the seed in the seed box. Because the vibration is irregular, and it occurs in the whole process of filling, transporting, clearing and planting, it is easy to cause the seeds of each process not to fall down in advance in the planting area.
The seed metering device with good seeding performance can effectively reduce the time cost of rice seedlings and the labor cost of replenishing seedlings, and achieve the purpose of green production and cost-saving and efficiency increase. However, there are still shortcomings in this study. For example, the rotation speed of the plate is lower than that of the high-speed seed metering device (the rotation speed of the plate is 32 rpm) [26]. In the later stage, the research on optimizing different hole patterns and arrangements will be carried out. Through CFD-DEM coupling comparison analysis and field tests, the optimum shape and arrangement of different hole patterns will be explored to achieve high-speed and high-precision seeding effect. Meanwhile, from the perspective of rice seeds, the stress, maximum effective adsorption area and throwing posture of seeds during filling, transportation and delivery stage will be deeply analyzed to effectively improve the seeding performance. In addition, the reliability of machinery is also an important index to measure the operating performance of a seed metering device [27]. This study did not consider the reliability and durability of the seed metering device in depth. In the later stage, we will deeply explore the static and vibration characteristics of the structure through the finite element analysis software, focusing on the comprehensive evaluation of the performance of the seed metering device from the reliability of the seed metering device, and provide a reference for the later optimization design.
Agricultural technology is developing towards automation and intelligence, but some sensors and advanced sensing devices need to be carried on new agricultural machinery and equipment that are constantly being developed. Therefore, agricultural machinery is the basic equipment and carrier to realize intelligent agriculture. The automation and intelligence of the seed metering device are mainly reflected in the sowing quality monitoring and automatic reseeding equipment. In the later stage, we will carry appropriate sensors according to the structure and characteristics of the seed metering device designed in this study, so as to realize the visualization and intelligence in the process of seed metering and improve the quality and efficiency of seed metering.

4. Conclusions

The study analyzed the seeding mechanism of multi-grain cluster air suction type rice hill direct seed metering device and explored its performance through CFD-DEM coupling simulation and bench test. The conclusions are as follows:
(1)
When the negative pressure was −5 kPa, the static pressure, dynamic pressure and velocity of the flow field reach maximum values. When negative pressure was −4 kPa, the seed metering qualification index reached the maximum value, which was 89.62%, the reseeding index was 4.36% and the mis-seeding index was 6.02%. Under these conditions, the performance of the seed metering device met the agronomic requirements of paddy hole direct seeding.
(2)
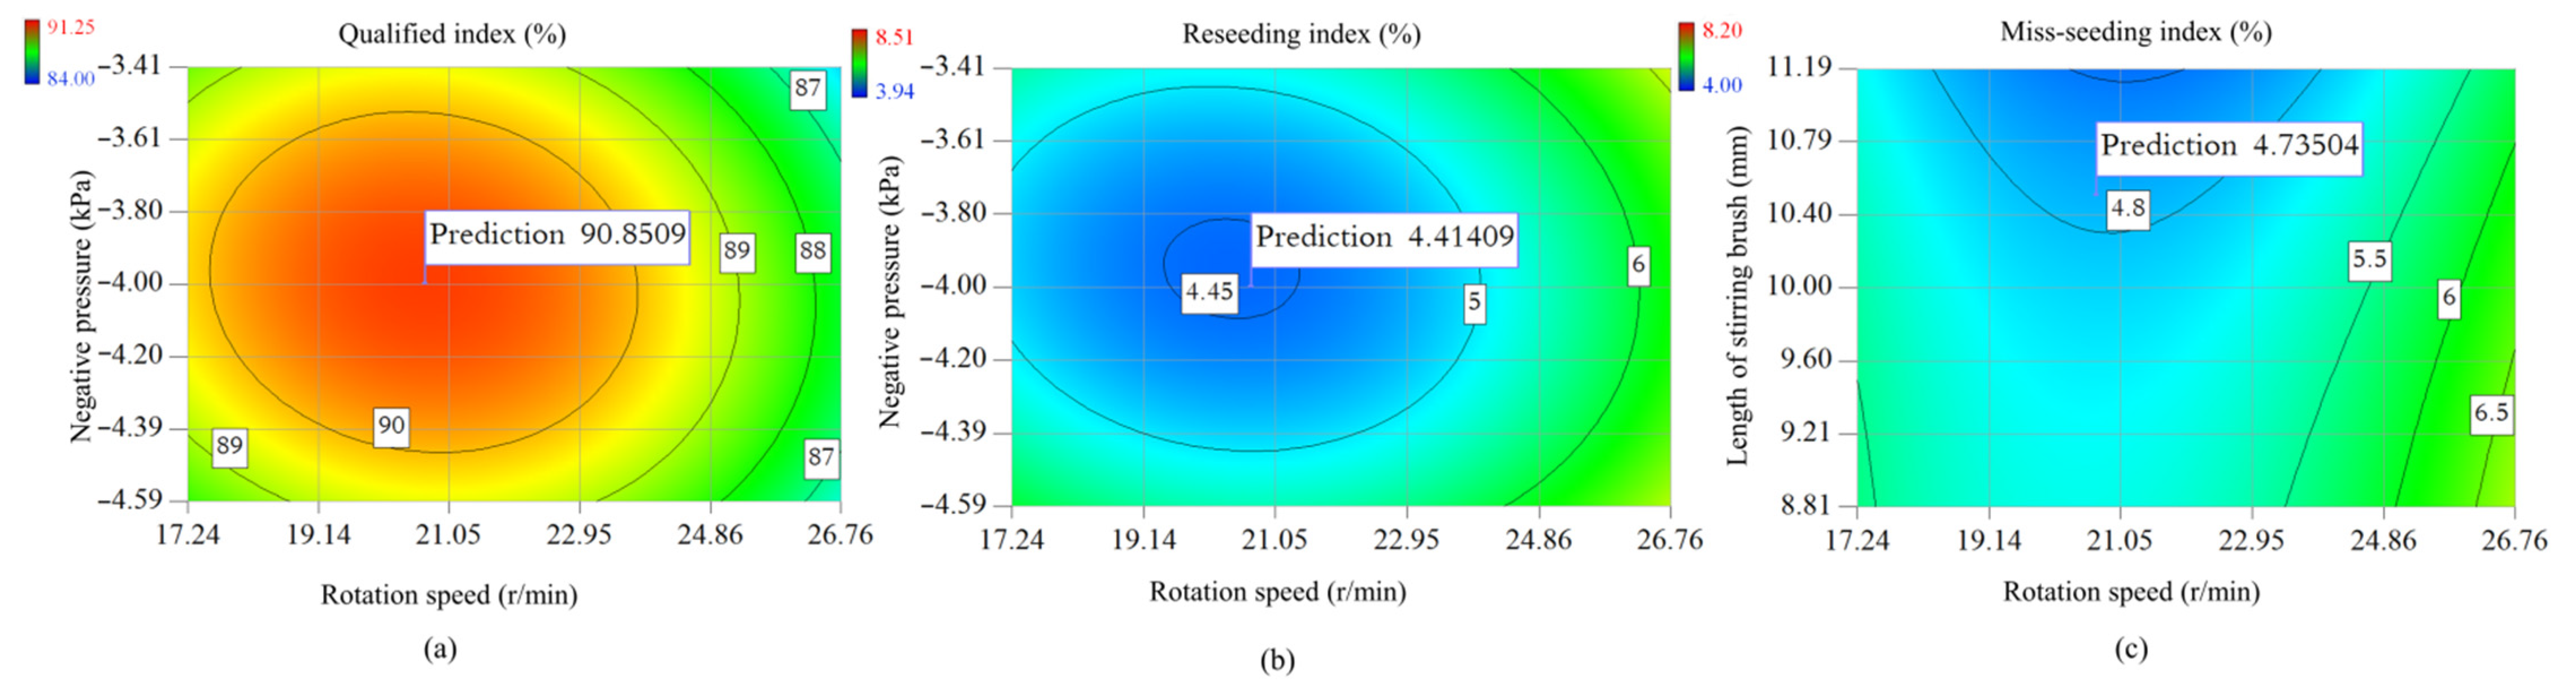
When the rotation speed, negative pressure and the length of stirring brush are 20.70 rpm, −4.0 kPa and 10.50 mm, respectively, the seeding performance was the best, with the qualification index of 90.85%, the reseeding index of 4.41% and the mis-seeding index of 4.74%. Under these conditions, the performance of the seed metering device met the agronomic requirements of paddy hole direct seeding.
(3)
The multi-grain cluster air suction type rice hill direct seed metering device had strong seeding adaptability to different rice varieties and met the agronomic requirements of paddy hole direct seeding.
(4)
This study provides ideas for innovative development and high-effect application of a rice direct seeding and metering device, and provides a reference for the green mechanized production of rice.

Author Contributions

Conceptualization, J.W., H.T. and C.X.; methodology, H.T., Y.J. and C.X.; software, F.G., Z.Y. and R.G.; validation, C.X. and X.S.; investigation, F.G. and Y.J.; resources, J.W. and H.T.; data curation, H.T., R.G. and C.X.; writing—original draft preparation, H.T. and C.X.; writing—review and editing, J.W., F.G. and Y.J.; visualization, Z.Y.; supervision, J.W.; funding acquisition, J.W. and H.T. All authors have read and agreed to the published version of the manuscript.

Funding

This research was funded by the National Natural Science Foundation of China (NSFC), grant number: 31901414; Natural Science Foundation of Heilongjiang Province of China for Excellent Youth Scholars, grant number: YQ2021E003; and the Program on Industrial Technology System of National Rice (CN), grant number: CARS-01-48.

Institutional Review Board Statement

Not applicable.

Informed Consent Statement

Not applicable.

Data Availability Statement

All data are presented in this article in the form of figures and tables.

Acknowledgments

The authors would like to acknowledge the College of Engineering, Northeast Agricultural University.

Conflicts of Interest

The authors declare no conflict of interest.

References

  1. Wassmann, R.; Van-Hung, N.; Yen, B.T.; Gummert, M.; Nelson, K.M.; Gheewala, S.H.; Sander, B.O. Carbon Footprint Calculator Customized for Rice Products: Concept and Characterization of Rice Value Chains in Southeast Asia. Sustainability 2022, 14, 315. [Google Scholar] [CrossRef]
  2. Jirapornvaree, I.; Suppadit, T.; Kumar, V. Assessing the economic and environmental impact of jasmine rice production: Life cycle assessment and Life Cycle Costs analysis. J. Clean. Prod. 2021, 303, 127079. [Google Scholar] [CrossRef]
  3. Hu, Q.; Jiang, W.-Q.; Qiu, S.; Xing, Z.-P.; Hu, Y.-J.; Guo, B.-W.; Liu, G.-D.; Gao, H.; Zhang, H.-C.; Wei, H.-Y. Effect of wide-narrow row arrangement in mechanical pot-seedling transplanting and plant density on yield formation and grain quality of japonica rice. J. Integr. Agric. 2020, 19, 1197–1214. [Google Scholar] [CrossRef]
  4. Deng, F.; Zhang, C.; He, L.; Liao, S.; Li, Q.; Li, B.; Zhu, S.; Gao, Y.; Tao, Y.; Zhou, W.; et al. Delayed sowing date improves the quality of mechanically transplanted rice by optimizing temperature conditions during growth season. Field Crop. Res. 2022, 281, 108493. [Google Scholar] [CrossRef]
  5. Xing, H.; Wang, Z.; Luo, X.; He, S.; Zang, Y. Mechanism modeling and experimental analysis of seed throwing with rice pneumatic seed metering device with adjustable seeding rate. Comput. Electron. Agric. 2020, 178, 105697. [Google Scholar] [CrossRef]
  6. Prasanna Kumar, G.V.; Srivastava, B.; Nagesh, D.S. Modeling and optimization of parameters of flow rate of paddy rice grains through the horizontal rotating cylindrical drum of drum seeder. Comput. Electron. Agric. 2009, 65, 26–35. [Google Scholar] [CrossRef]
  7. Tian, L.; Tang, H.; Wang, J.; Li, S.; Zhou, W.; Yan, D. Design and Experiment of Rebound Dipper Hill-drop Precision Direct Seed-metering Device for Rice. Nongye Jixie Xuebao/Trans. Chin. Soc. Agric. Mach. 2017, 48, 65–72. [Google Scholar] [CrossRef]
  8. Zhang, G.; Zhang, S.; Yang, W.; Lu, K.; Lei, Z.; Yang, M. Design and experiment of double cavity side-filled precision hole seed metering device for rice. Nongye Gongcheng Xuebao/Trans. Chin. Soc. Agric. Eng. 2016, 32, 9–17. [Google Scholar] [CrossRef]
  9. Brunhart, M.; Soteriou, C.; Gavaises, M.; Karathanassis, I.; Koukouvinis, P.; Jahangir, S.; Poelma, C. Investigation of cavitation and vapor shedding mechanisms in a Venturi nozzle. Phys. Fluids 2020, 32, 083306. [Google Scholar] [CrossRef]
  10. Maldar, N.R.; Ng, C.Y.; Ean, L.W.; Oguz, E.; Fitriadhy, A.; Kang, H.S. A comparative study on the performance of a horizontal axis ocean current turbine considering deflector and operating depths. Sustainability 2020, 12, 3333. [Google Scholar] [CrossRef] [Green Version]
  11. Lee, J.; Cho, J. Combined effects of inlet shape and angle of incidence on flow uniformity in a subsonic diffusing S-shaped intake. J. Mech. Sci. Technol. 2020, 34, 165–173. [Google Scholar] [CrossRef]
  12. Francesconi, M.; Silei, T.; Gamannossi, A.; Provasi, R.; Antonelli, M. A CFD analysis on using a standardized blade in different mechanical draft cooling towers for geothermal power plants. Geothermics 2021, 97, 102260. [Google Scholar] [CrossRef]
  13. Markauskas, D.; Ramírez-Gómez, Á.; Kačianauskas, R.; Zdancevičius, E. Maize grain shape approaches for DEM modelling. Comput. Electron. Agric. 2015, 118, 247–258. [Google Scholar] [CrossRef]
  14. Adajar, J.B.; Alfaro, M.; Chen, Y.; Zeng, Z. Calibration of discrete element parameters of crop residues and their interfaces with soil. Comput. Electron. Agric. 2021, 188, 106349. [Google Scholar] [CrossRef]
  15. Kešner, A.; Chotěborský, R.; Linda, M.; Hromasová, M.; Katinas, E.; Sutanto, H. Stress distribution on a soil tillage machine frame segment with a chisel shank simulated using discrete element and finite element methods and validate by experiment. Biosyst. Eng. 2021, 209, 125–138. [Google Scholar] [CrossRef]
  16. Schramm, F.; Kalácska; Pfeiffer, V.; Sukumaran, J.; De Baets, P.; Frerichs, L. Modelling of abrasive material loss at soil tillage via scratch test with the discrete element method. J. Terramech. 2020, 91, 275–283. [Google Scholar] [CrossRef]
  17. Ucgul, M.; Saunders, C. Simulation of tillage forces and furrow profile during soil-mouldboard plough interaction using discrete element modelling. Biosyst. Eng. 2020, 190, 58–70. [Google Scholar] [CrossRef]
  18. Li, H.; Li, Y.; Gao, F.; Zhao, Z.; Xu, L. CFD-DEM simulation of material motion in air-and-screen cleaning device. Comput. Electron. Agric. 2012, 88, 111–119. [Google Scholar] [CrossRef]
  19. Wang, L.; Ma, Y.; Feng, X.; Song, L.; Chai, J. Design and Experiment of Segmented Vibrating Screen in Cleaning Device of Maize Grain Harvester. Nongye Jixie Xuebao/Trans. Chin. Soc. Agric. Mach. 2020, 51, 89–100. [Google Scholar] [CrossRef]
  20. Yu, Y.; Fu, H.; Yu, J. DEM-based simulation of the corn threshing process. Adv. Powder Technol. 2015, 26, 1400–1409. [Google Scholar] [CrossRef]
  21. Hu, C.; Luo, K.; Wang, S.; Sun, L.; Fan, J. Influences of operating parameters on the fluidized bed coal gasification process: A coarse-grained CFD-DEM study. Chem. Eng. Sci. 2019, 195, 693–706. [Google Scholar] [CrossRef]
  22. Schnorr Filho, E.A.; Lima, N.C.; Franklin, E.M. Resolved CFD-DEM simulations of the hydraulic conveying of coarse grains through a very-narrow elbow. Powder Technol. 2022, 395, 811–821. [Google Scholar] [CrossRef]
  23. Lu, F.; Ma, X.; Tan, S.; Chen, L.; Zeng, L.; An, P. Simulative Calibration and Experiment on Main Contact Parameters of Discrete Elements for Rice Bud Seeds. Nongye Jixie Xuebao/Trans. Chin. Soc. Agric. Mach. 2018, 49, 93–99. [Google Scholar] [CrossRef]
  24. Wang, J.; Xu, C.; Xu, Y.; Wang, Z.; Qi, X.; Wang, J.; Zhou, W.; Tang, H.; Wang, Q. Influencing Factors Analysis and Simulation Calibration of Restitution Coefficient of Rice Grain. Appl. Sci. 2021, 11, 5884. [Google Scholar] [CrossRef]
  25. Xing, H.; Zang, Y.; Wang, Z.; Luo, X.; Pei, J.; He, S.; Xu, P.; Liu, S. Design and parameter optimization of rice pneumatic seed metering device with adjustable seeding rate. Nongye Gongcheng Xuebao/Trans. Chin. Soc. Agric. Eng. 2019, 35, 20–28. [Google Scholar] [CrossRef]
  26. Li, Y.; Yang, L.; Zhang, D.; Cui, T.; He, X.; Hu, H. Design and Test of Double-side Cleaning Mechanism for Air-suction Maize Seed-metering Device. Nongye Jixie Xuebao/Trans. Chinese Soc. Agric. Mach. 2021, 52, 29–39. [Google Scholar] [CrossRef]
  27. Durczak, K.; Selech, J.; Ekielski, A.; Żelaziński, T.; Waleński, M.; Witaszek, K. Using the Kaplan–Meier Estimator to Assess the Reliability of Agricultural Machinery. Agronomy 2022, 12, 1364. [Google Scholar] [CrossRef]
Figure 1. Multi-grain cluster air suction type rice hill direct seed metering device: (a) overall Scheme; (b) working principle. 1. front shell; 2. unloading brush; 3. cleaning brush; 4. stirring brush; 5. seed metering plate; 6. transmission plate; 7. negative pressure chamber; 8. back shell; 9. transmission shaft. I. filling area; II. clearing area; III. carrying area; IV. unloading area; V. transitioning area.
Agriculture 12 01094 g001
Figure 2. Analysis of seed mechanism in seed metering process: (a) characteristics of seed movement during seed filling; (b) force analysis of seeds in the process of carrying seeds with plane and concave holes.
Agriculture 12 01094 g002
Figure 3. Simulation model: (a) rice seed model, I is overall “Suijing 18” seed, II is single “Suijing 18” seed, III is rice seed model established by reverse engineering, IV is discrete element model of rice seed; (b) model of seed metering device discrete element; (c) seed metering plate mesh model.
Agriculture 12 01094 g003
Figure 4. Bench test: (a) test device; (b) test result.
Agriculture 12 01094 g004
Figure 5. Simulation analysis of the flow field of the seed metering plate: (ac) show the static pressure, dynamic pressure and velocity of the flow field when the negative pressure is −3 kPa; (df) show the static pressure, dynamic pressure and velocity of the flow field when the negative pressure is −4 kPa; (gi) show the static pressure, dynamic pressure and velocity of the flow field when the negative pressure is −5 kPa respectively.
Agriculture 12 01094 g005
Figure 6. seed metering performance of CFD-DEM coupling simulation: (a) seed metering process of CFD-DEM coupling simulation; (b) seed metering results of CFD-DEM coupling simulation.
Agriculture 12 01094 g006
Figure 7. Response surface diagram of influence of various test factors on test indexes: (ac) denotes the influence of negative pressure and rotating speed, negative pressure and length of stirring brush, length of stirring brush and rotating speed on the qualification index respectively; (df) denotes the effects of negative pressure and rotating speed, negative pressure and stirring brush length, stirring brush length and rotating speed on the reseeding index respectively; (gi) denotes the effects of negative pressure and rotating speed, negative pressure and stirring brush length, stirring brush length and rotating speed on the mis-seeding index.
Agriculture 12 01094 g007
Figure 8. Optimized regional contour map: (a) contour map of the optimized area of negative pressure and rotation speed for pass index; (b) contour map of the optimized area of negative pressure and rotation speed for reseed index; (c) contour map of the optimized area of stirring brush length and rotation speed for missed index.
Agriculture 12 01094 g008
Table 1. The structural parameters of key components.
ParameterValueUnit
Diameter of seed metering plate170mm
Number of hole groups6/
Size of hole (diameter × depth)12 × 2.6mm × mm
Suction hole rotation radius/R55mm
Diameter of suction hole/d2mm
Size of seed inlet (diameter × width)60 × 40mm × mm
Table 2. Simulation parameter setting.
Materials and ComponentsMaterial CompositionPoisson’s RatioShear Modulus/PaDensity/(kg/m3)Static Friction CoefficientDynamic Friction CoefficientRestitution
Coefficient
rice seed/0.251.81 × 10810980.30 *0.01 *0.60 *
shellorganic glass0.372.5 × 101011800.44 *0.01 *0.50 *
seed metering plateABS plastic0.501.80 × 10811760.30 *0.09 *0.48 *
seeding rate adjusting plate
stirring brushpig bristles0.401.0 × 10811500.50 *0.30 *0.30 *
Note: * shown as the value of the interaction between rice seeds and the material.
Table 3. Coding table of test factor level.
Level CodeTest Factor
Rotating Speed x1/rpmNegative Pressure x2/kPaStirring Brush Length x3/mm
1.68230.00−3.0012.00
126.76−3.4111.19
022.00−4.0010.00
−117.24−4.598.81
−1.68214.00−5.008.00
Table 4. Test protocol and results.
NO.Experiment FactorsPerformance Indexes
Rotating Speed x1/rpmNegative Pressure
x2/kPa
Stirring Brush Length
x3/mm
Qualification Index
y1’/%
Reseeding Index y2’/%Mis-Seeding Index y3’/%
1−1 (17.24)−1 (−4.59)−1 (8.81)86.456.906.65
21 (26.76)−1−185.696.417.90
3−11 (−3.41)−186.326.667.02
411−184.507.308.20
5−111 (11.19)87.626.805.58
61−1185.598.515.90
7−11187.656.395.96
811184.778.237.00
9−1.628 (14.00)0 (−4.00)0 (10.00)88.005.806.20
101.628 (30.00)0084.507.707.80
110 (22.00)−1.628 (−5.00)087.606.306.10
1201.628 (−3.00)088.306.155.55
1300−1.628 (8.00)90.855.154.00
14001.628 (12.00)90.824.984.20
1500091.024.054.93
1600089.974.805.23
1700090.564.235.21
1800091.254.604.15
1900090.563.945.50
2000090.334.794.88
2100090.254.055.70
2200091.024.604.38
2300091.334.234.44
Table 5. Analysis of variance of each factor on the test index.
Test IndexSource of VarianceSum of Offset SquaresDegree of FreedomF ValueSignificance
y 1 Regression model92.9496.16***
x 1 13.1017.81**
x 2 0.0610.04**
x 3 0.5010.30*
x 1 x 2 0.4610.46*
x 1 x 3 0.6810.68N
x 2 x 3 0.03510.035*
x 1 2 57.27157.27***
x 2 2 27.94127.94***
x 3 2 2.0012.00N
Error1.0750.21
Total109.7219
y 2 Regression model31.2093.47***
x 1 3.4813.48***
x 2 0.006310.0063N
x 3 0.4110.41*
x 1 x 2 0.2010.20*
x 1 x 3 1.4511.45**
x 2 x 3 0.2210.22N
x 1 2 15.87115.87***
x 2 2 10.75110.75***
x 3 2 2.9712.97**
Error0.7250.14
Total36.0119
y 3 Regression model21.5692.40**
x 1 3.0813.08***
x 2 0.1110.11*
x 3 1.8311.83**
x 1 x 2 0.05310.053N
x 1 x 3 0.1410.14**
x 2 x 3 0.08210.082N
x 1 2 12.84112.84***
x 2 2 4.0314.03***
x 3 2 0.09510.095N
Error1.0950.22
Total28.9119
Note: *** is highly significant, ** is significant, * is relatively significant, and N is not significant.
Table 6. Mean values (± standard error) of measuring results of parameters at different rice varieties.
ParameterRice Variety
Suijing 18Longjing 31Longqing 5Wuyou 4
Qualification index/%91.34 ± 0.70 a90.49 ± 0.74 ab89.52 ± 0.68 b89.75 ± 0.86 b
Reseeding index/%4.36 ± 0.61 b4.65 ± 0.18 ab5.27 ± 0.71 a4.78 ± 0.82 ab
Mis-seeding index/%4.30 ± 0.31 b4.86 ± 0.81 ab5.21 ± 0.71 a5.47 ± 0.48 a
Note: different letters within the same row indicate a statistically significant difference (p < 0.05).
Publisher’s Note: MDPI stays neutral with regard to jurisdictional claims in published maps and institutional affiliations.

