Article

Characterizing Droplet Retention in Fruit Tree Canopies for Air-Assisted Spraying

1
College of Engineering, South China Agricultural University, Guangzhou 510642, China
2
Guangdong Laboratory for Lingnan Modern Agriculture, Guangzhou 510642, China
*
Author to whom correspondence should be addressed.
Agriculture 2022, 12(8), 1093; https://doi.org/10.3390/agriculture12081093
Submission received: 26 June 2022 / Revised: 18 July 2022 / Accepted: 21 July 2022 / Published: 26 July 2022
(This article belongs to the Special Issue Advances in Crop Protection in Organic Farming System)

Abstract

:
As a mainstream spraying technology, air-assisted spraying can increase the penetration and droplet deposition in the tree canopy; however, there seems to be less research on the maximum deposition volume of leaves. In this paper, the maximum deposition volume of a single leaf and the attenuation characteristics of droplets in the canopy were studied. By coupling them, the prediction equation of the total canopy droplet retention volume was obtained. The single-leaf test results showed that too small a surface tension reduced the total volume of droplet deposition on the leaf. In this paper, when the Weber number was equal to 144.3, the deposition form changed from particles to a water film, yielding the best deposition effect. The canopy droplet penetration test results show that the air velocity at the outlet increased first and then decreased, and the best effect was achieved when the air velocity at the outlet was 10 m/s. At the same time, when the surface tension of pesticides was 50 mN/m, the effect of canopy droplet deposition was better, which was consistent with the results of the single-leaf test. An average relative error of prediction equation of the total canopy droplet retention volume with 15.6% was established.

1. Introduction

The use of chemical pesticides is essential for the healthy and stable production of high-quality and high-yielding fruit in large-scale orchards. Air-assisted spraying technology is currently a common approach for atomizing droplets into smaller droplets by using high-speed airflow before being delivering to the canopy of fruit trees. This technology can improve the effective utilization rate of pesticides with characteristics of good droplet penetration and high operating efficiency [1]; a low air flow rate treatment significantly reduced drift by 55–93%. In addition, the airflow generated by air-assisted spraying can impel leaves to turn so that both sides of the leaves can be evenly coated, improving the uniformity of droplet deposition [2]. Since the deposition effect of the droplet during air-assisted spraying is affected by many factors such as the structure of the nozzle, the properties of the spraying liquid, the properties of the target leaves, and the physical properties of the canopy [3], characterizing the droplet deposition could be helpful for optimizing the operation parameters of air-assisted spraying.
The deposition and distribution of droplets directly affect the pesticide utilization rate. Numerous studies have been conducted on the effects of deposition and distribution of droplets, which helped to reduce pesticide pollution and residues in crops [4]. The authors of [5] tested the atomization characteristics of three nozzles and found that the initial droplet velocity was significantly correlated with droplet size and spraying pressure, and the properties of the spray also impacted the atomization characteristics of nozzles. The authors of [6] conducted experiments on artificial fruit-hanging plants using an air-assisted sprayer. They found that the volume ratio had a significant effect on the spray deposition and distribution uniformity; reducing the volume ratio reduced the spray deposition but improved the distribution uniformity of the droplets, whereas reducing the airflow velocity could increase the spray deposition within a certain range of airflow velocities. The authors of [7] revealed the effect of different diverter structures on the outlet airflow velocity and pressure loss of the air duct flow field using the simulation method and optimized the structural form of the diverter. Afterward, they optimized the parameters of the diversion structure of a tower-type air-assisted sprayer. The obtained the inlet wind speed, the height of the fan from the ground, the installation angle of the guide plate, the installation angle of the inner baffle, and the average outlet airflow velocity for evenly distributing the speed of each outlet of the tower sprayer. Finally, they achieved the purpose of uniformly coating the canopy of different heights of fruit trees [8].
Whether pesticide droplets can fully contact and spread on target leaves is greatly affected by the difficulty of wettability of crop leaves, which also affects pesticide retention [9]. The authors of [10] found that the wettability was related to the thickness of the waxy layer and the villi in the leaf structure of plants. The authors of [11] found that, for leaves without trichomes, the dropping behavior depended on the wettability of the leaves, and an increase in hydrophobicity resulted in a decrease in the maximum number of residual droplets on the leaves after the droplets hit the leaves. The authors of [12] determined that rough leaves covered with crystals of the waxy layer were difficult to wet, and the deposition amount on the surface of nonpolar artificial targets was high. To increase droplet deposition, the authors of [13] formed hydrophilic surface defects to obstruct droplet movement after impact. They also developed a physical model to predict droplet movement from bouncing to bonding by studying defect dissipation. When a droplet hit a surface, the contact time determined how much mass, momentum, and energy were exchanged. Redistribution of the droplet mass through a superhydrophobic surface can reduce the contact time between the droplet and the surface [14]. In addition to the influence of the leaf properties, reducing the surface tension of droplets by adding additives can not only result in the droplets spreading but also reduce splashing [15].
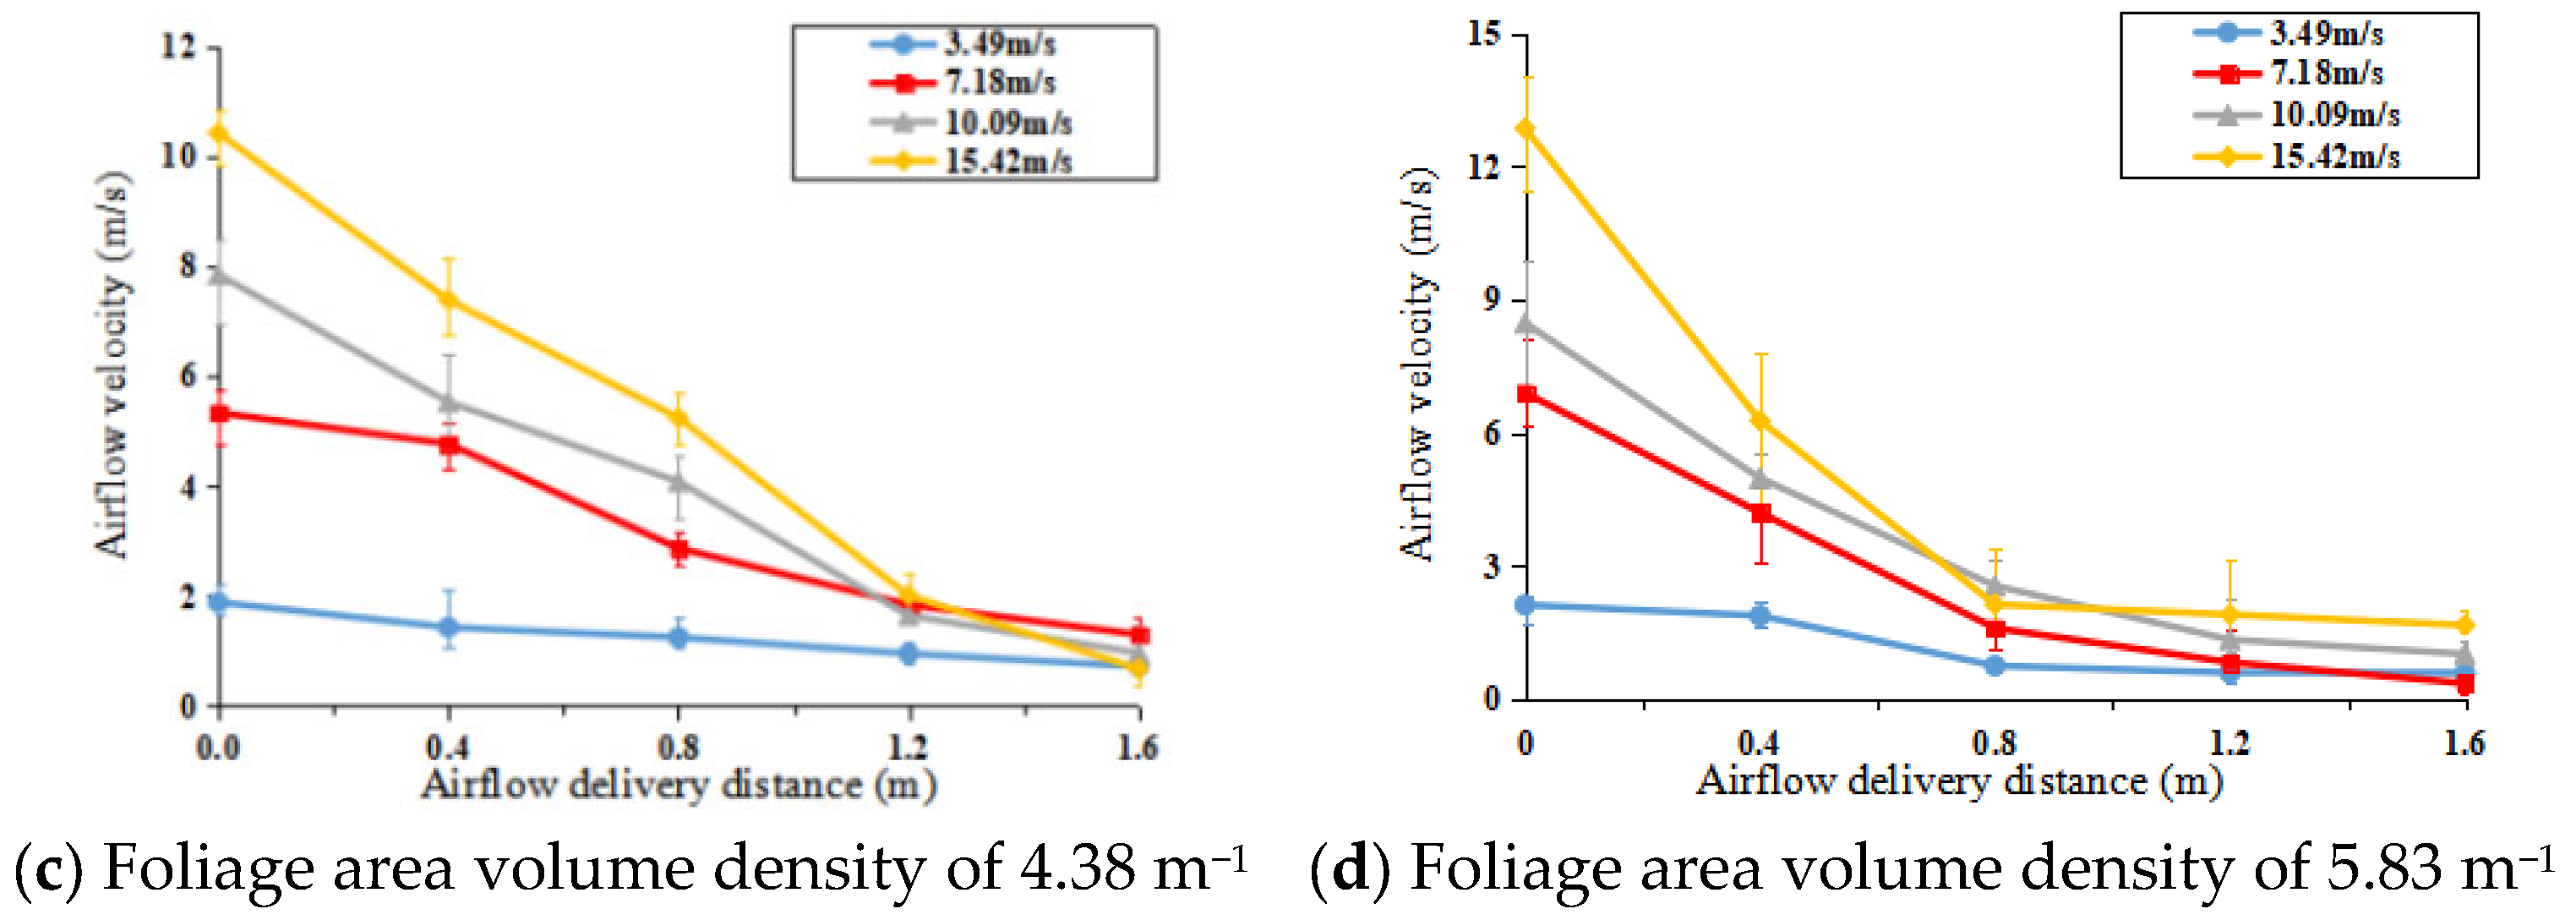
Due to the barrier of the dense outer leaf curtain layer, the deposition of fog droplets is also affected by the structure of the plant canopy, including the height, width, leaf inclination, area index, and porosity. The authors of [16] found that canopy shape and canopy density had a significant influence on the droplet deposition rate. The maximum velocity of the droplet on the surface increased with increasing plane inclination and droplet size. The leaf inclination increases the lateral gravity component of the droplet; however, due to the contact angle hysteresis, the lateral gravity component is canceled, resulting in an increase in the adhesion force [16]. According to a study [17] that examined how canopy density and canopy stripe shape affected canopy deposition, a denser canopy and a more uniform canopy stripe resulted in a greater total deposition. On the basis of an analysis of the porosity of the canopy distribution in combination with a Gaussian process model, the authors of [18] created a model for predicting spray deposition in a cotton canopy and proposed a feasible method for quantitatively analyzing the influence of leaf density on fog drop distribution. The authors of [19] mentioned that global agriculture faces challenges, and that renewable and sustainable agriculture still needs to be vigorously developed. The authors of [20] mentioned the variation in spray quality over the range investigated did not greatly affect the efficiency or macro-distribution of deposition from the axial fan sprayer. The authors of [21] mentioned that the use of two adjuvants can improve spray surface retention.
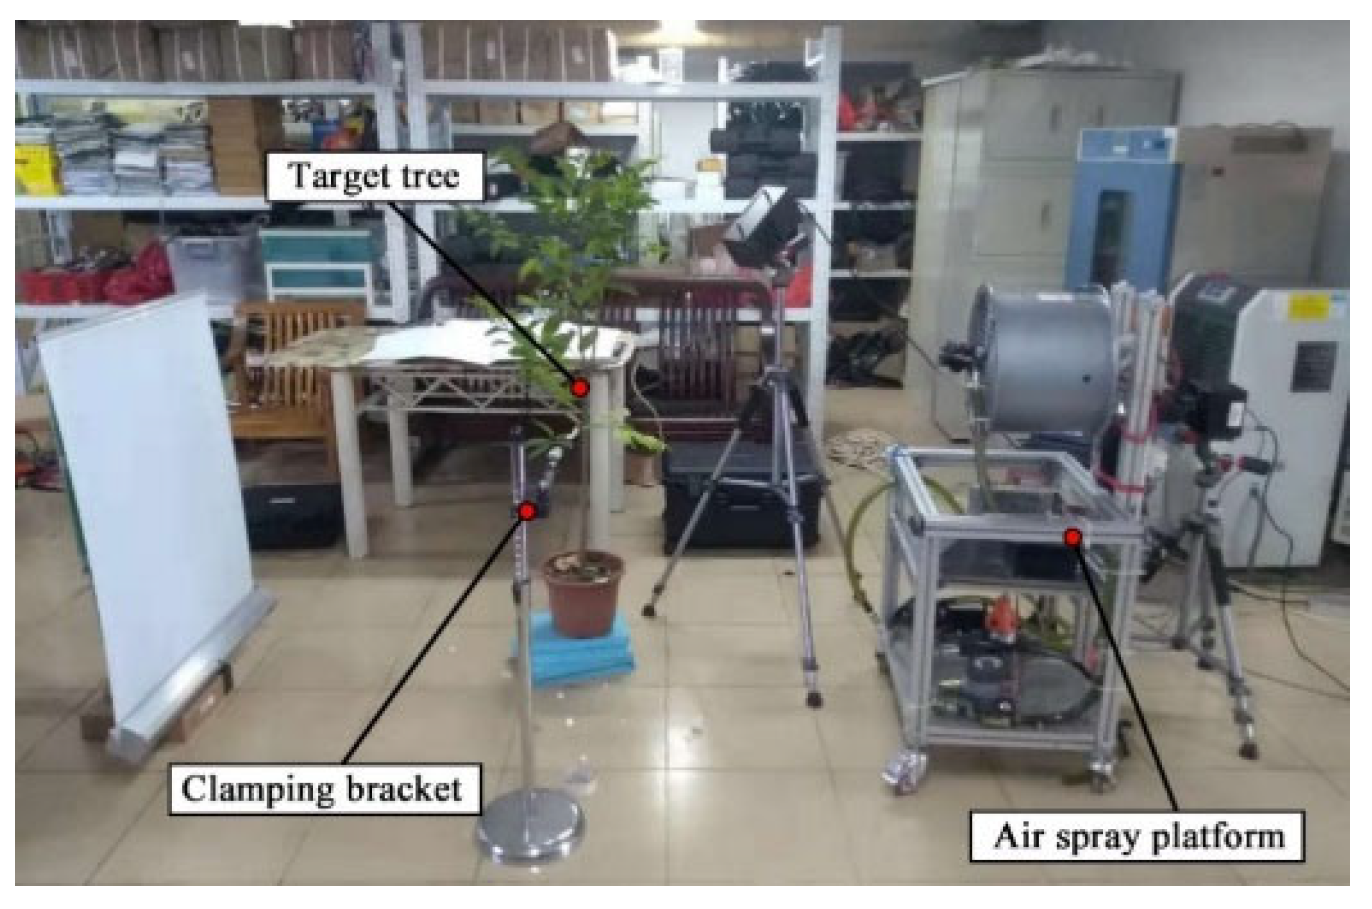
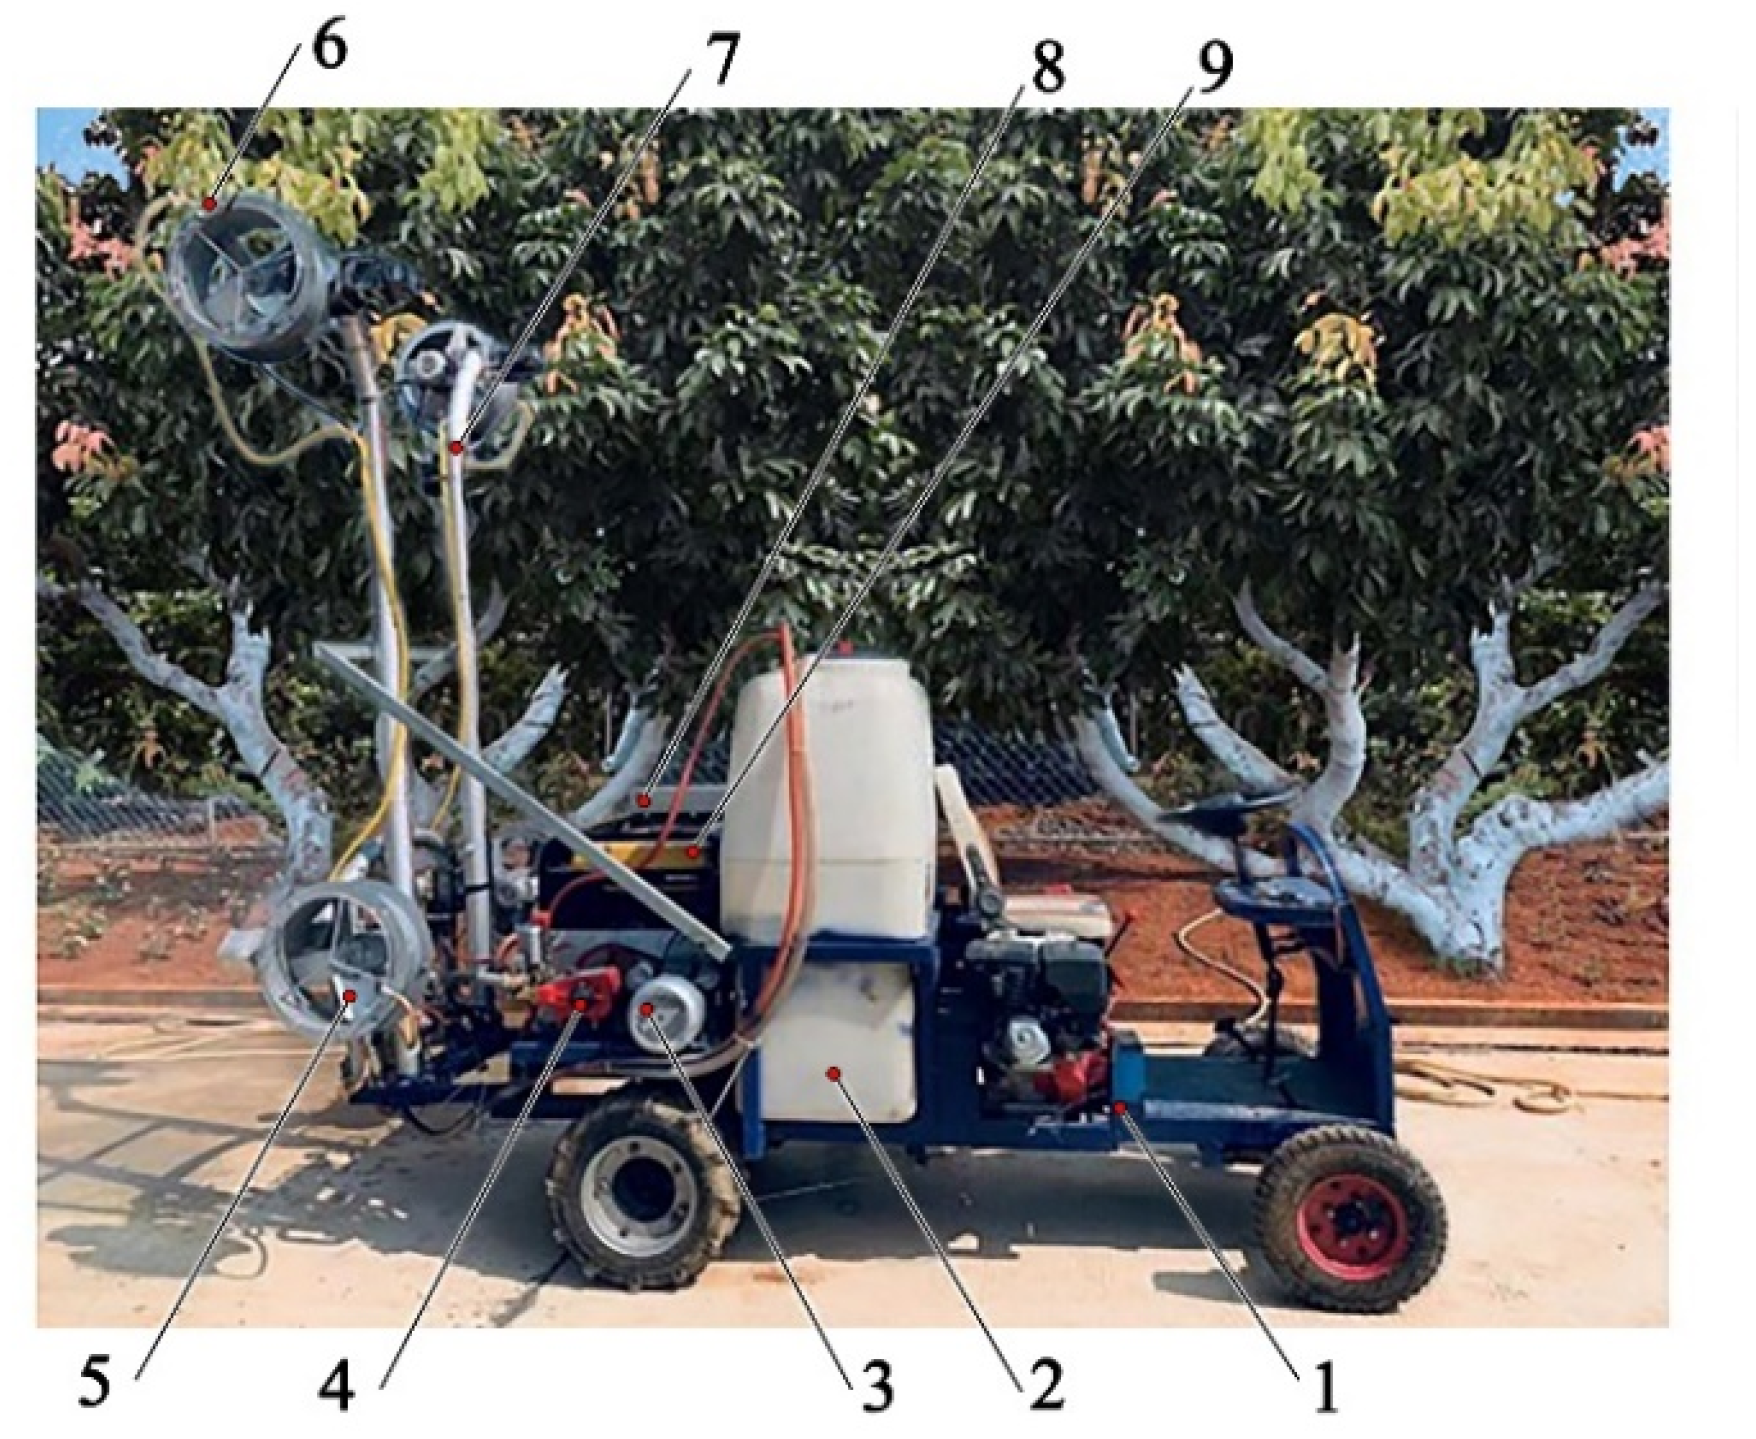
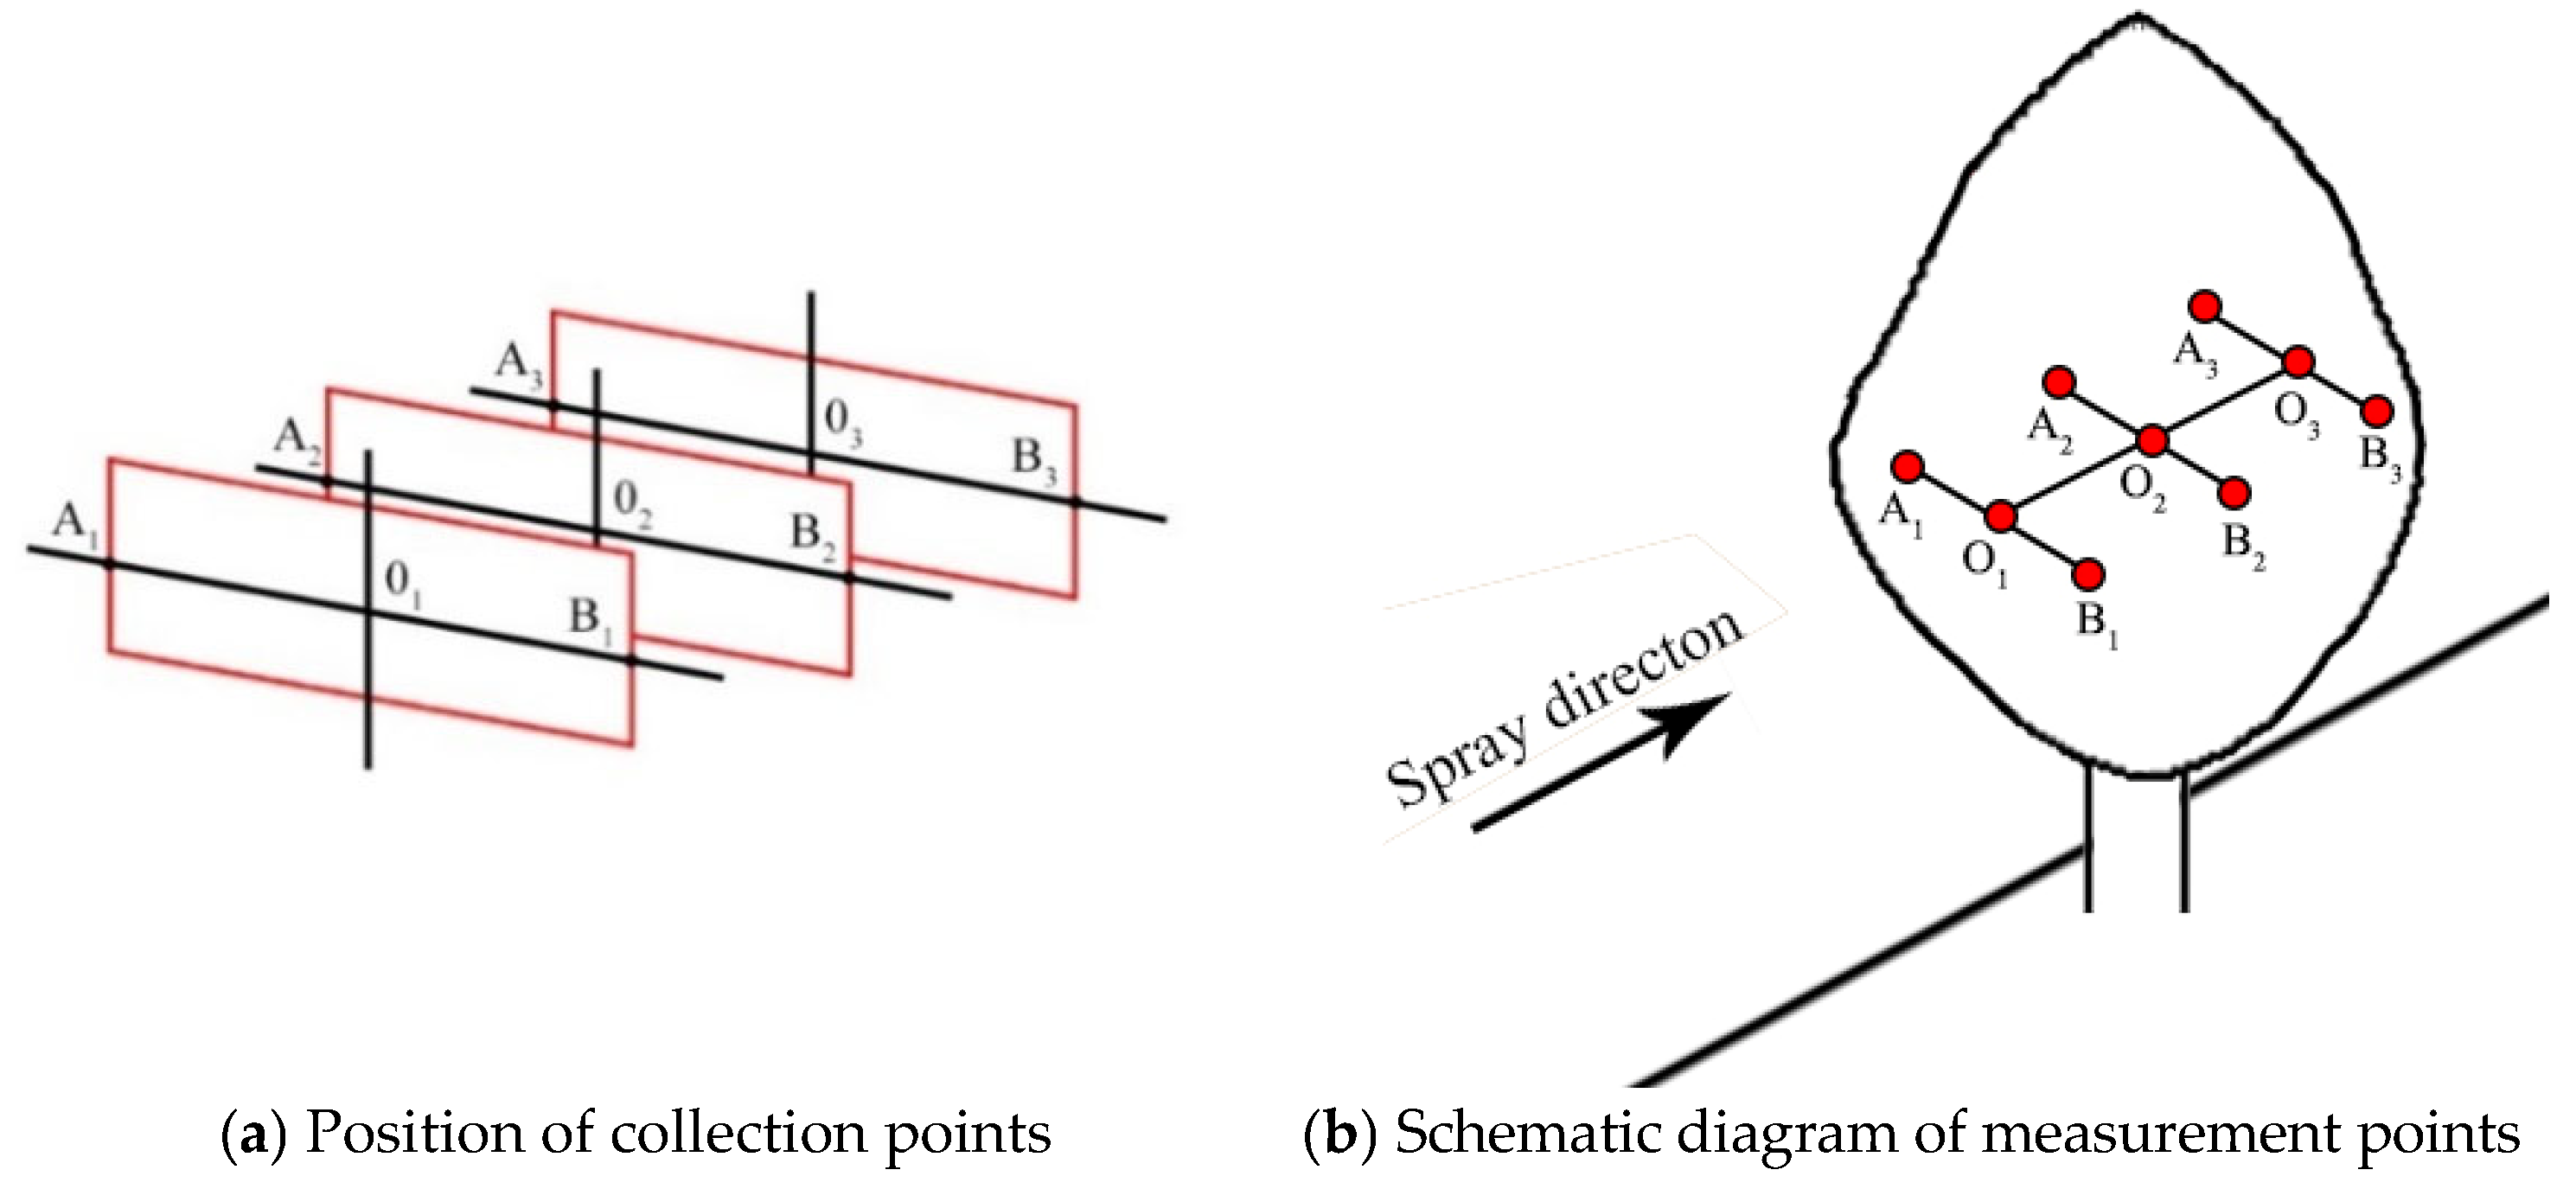
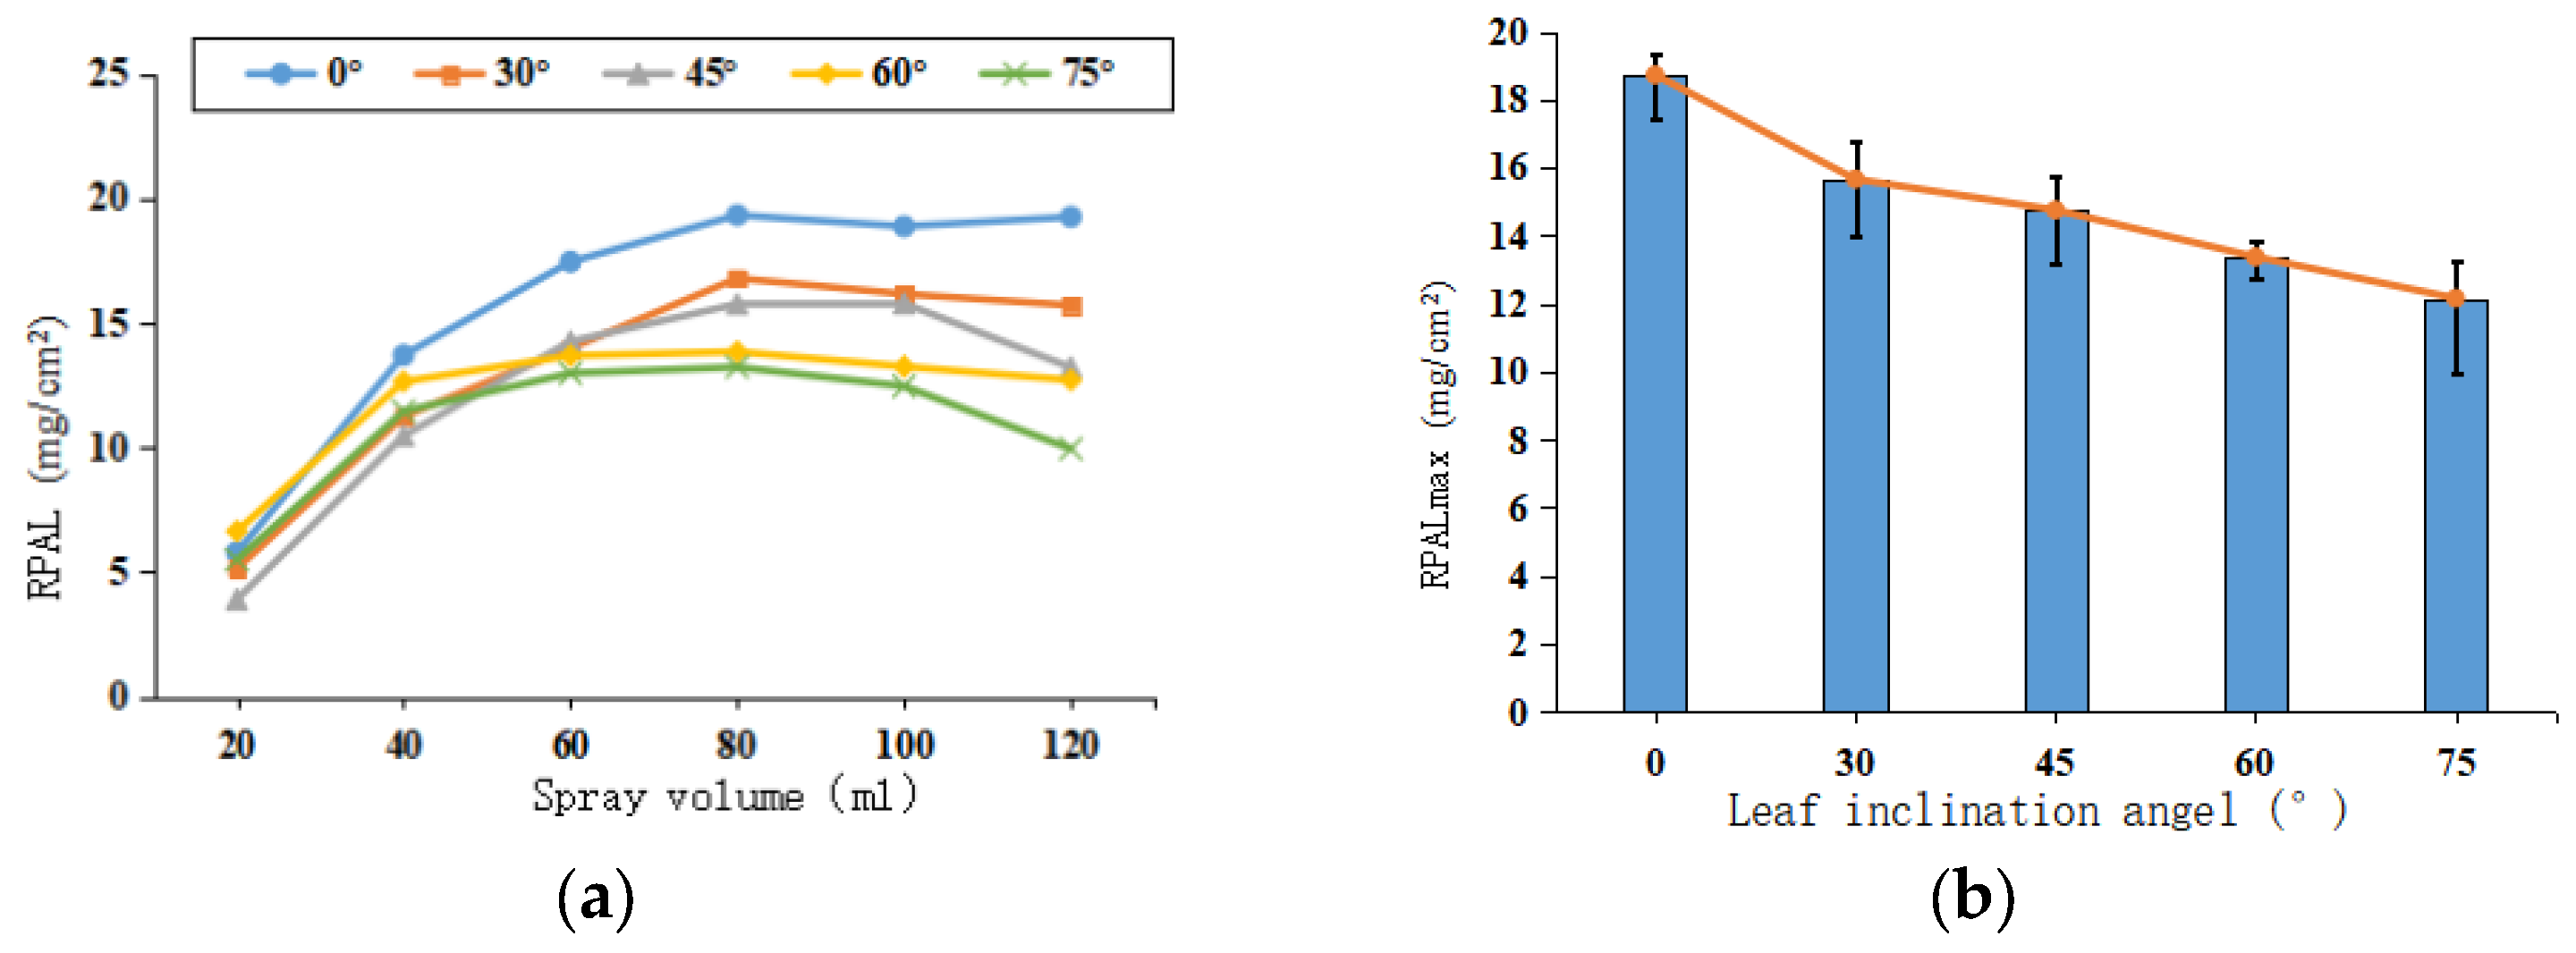
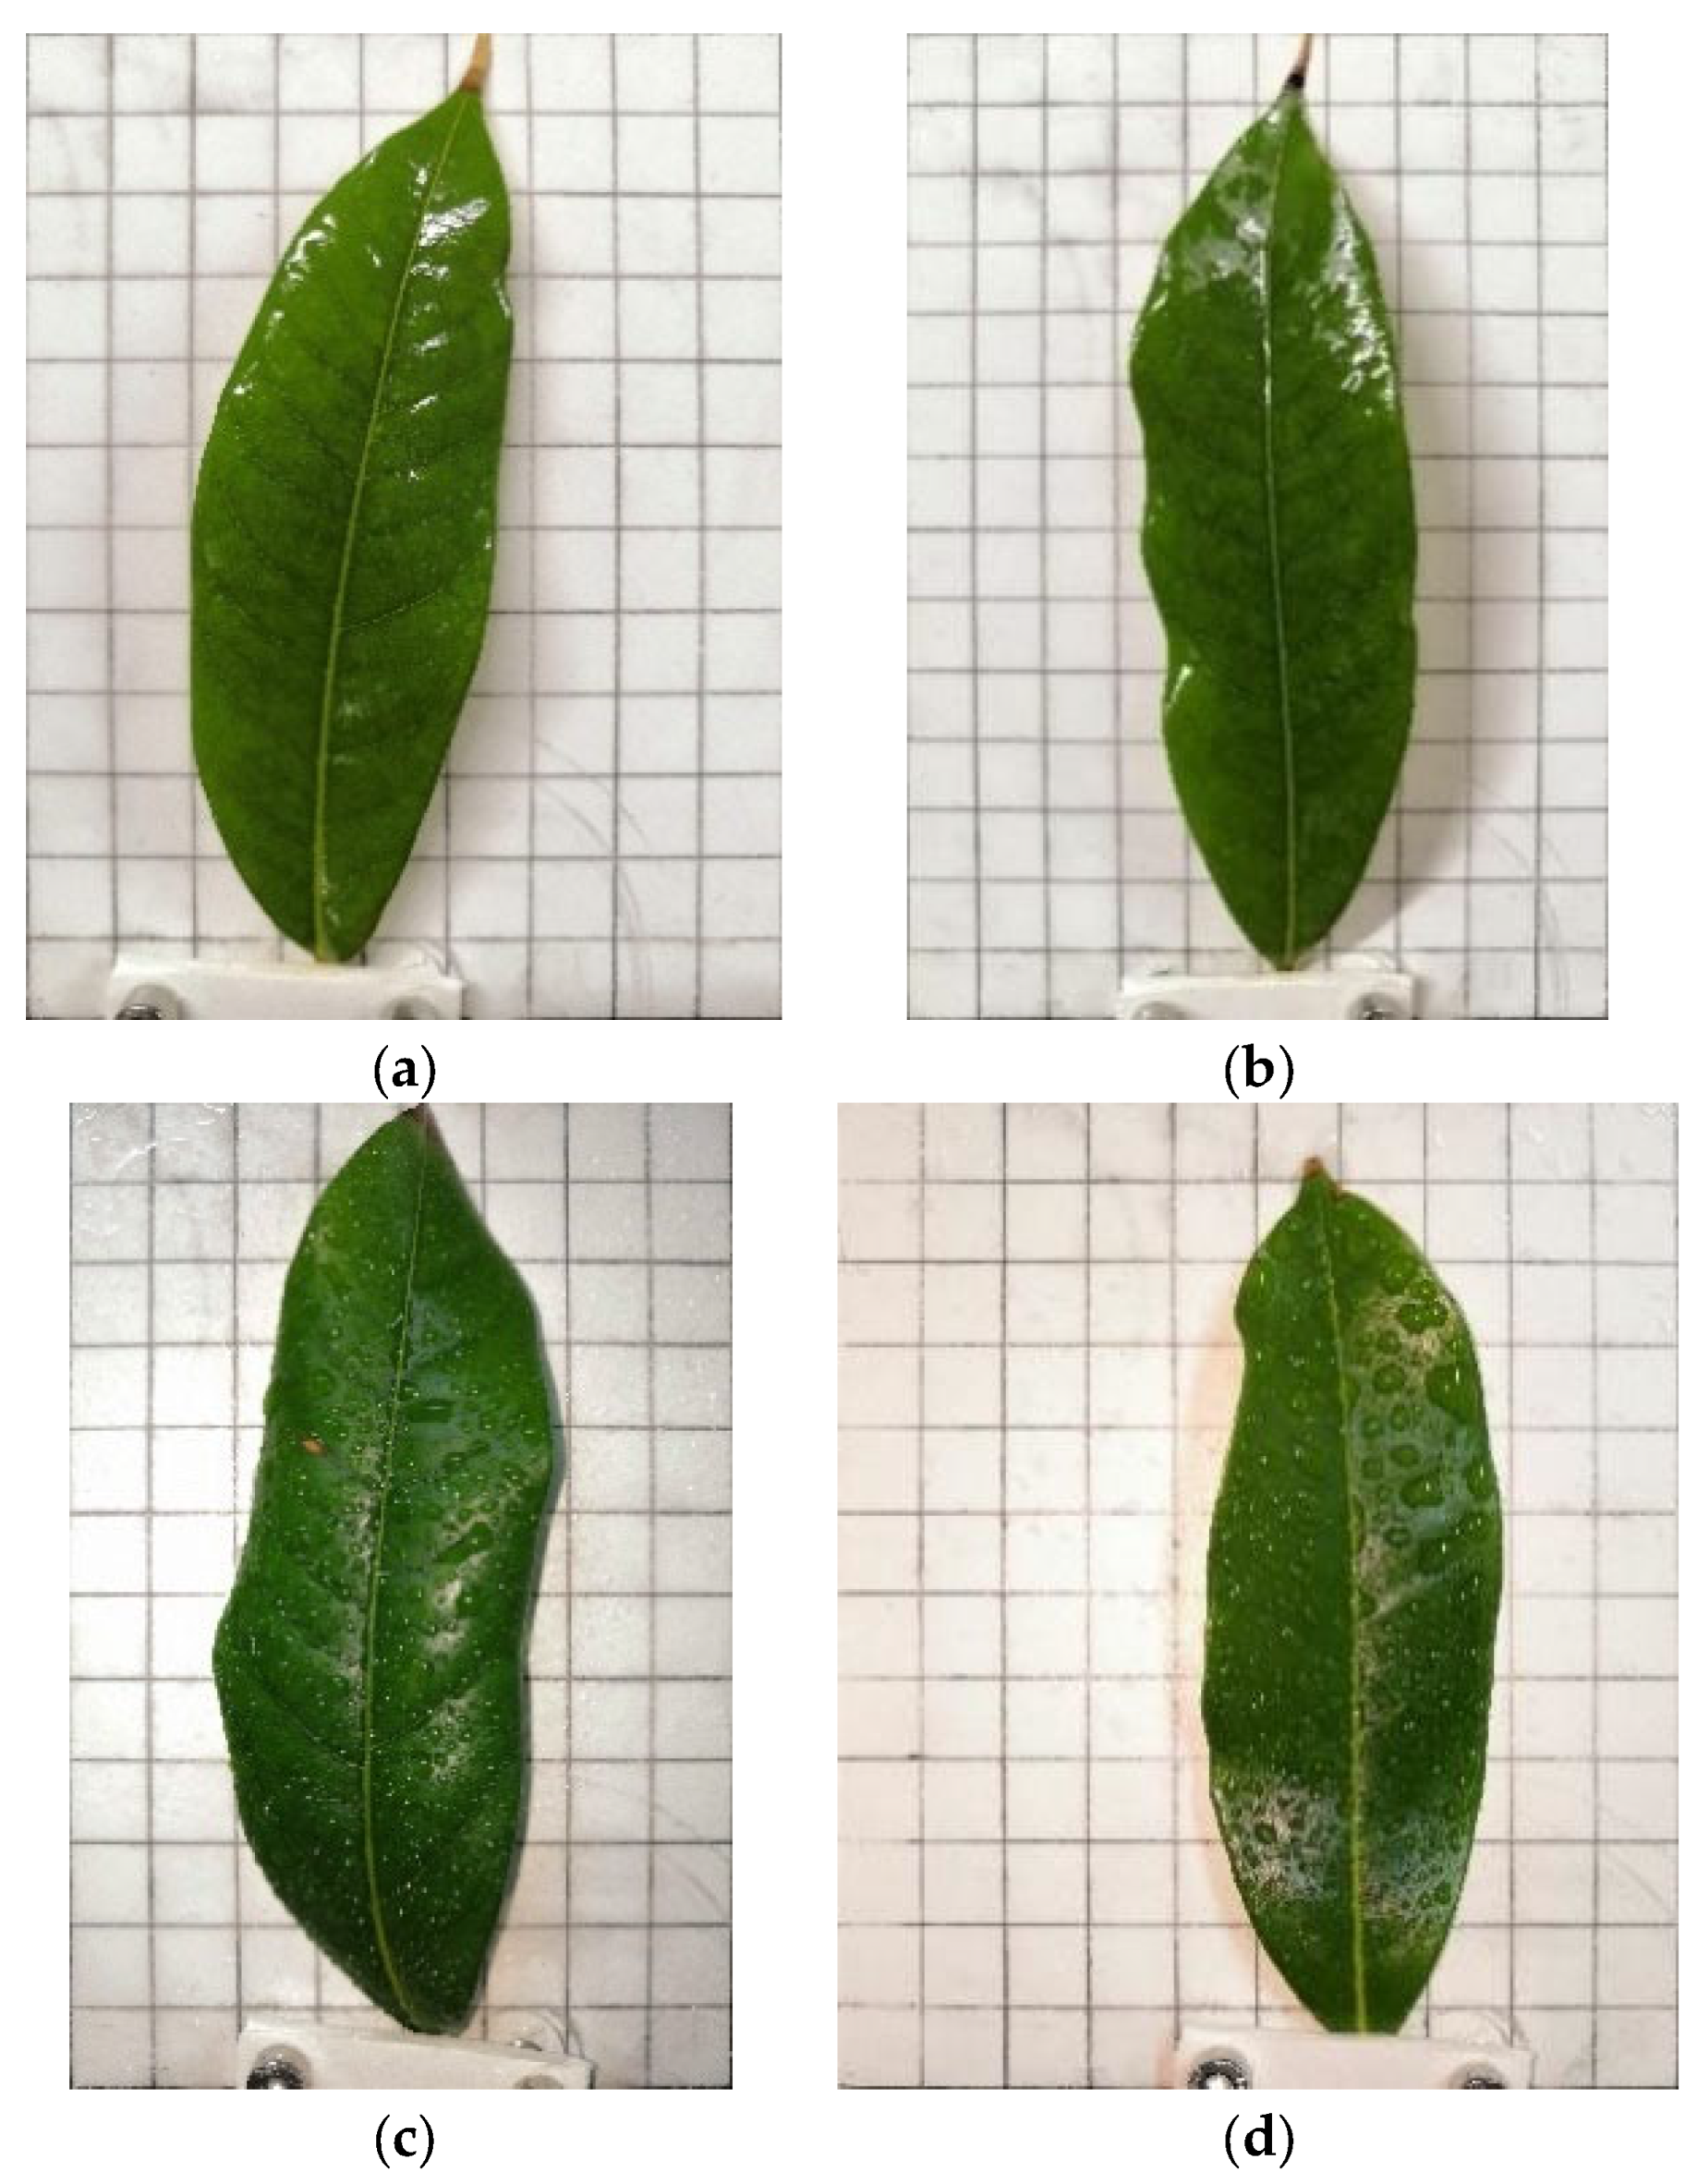
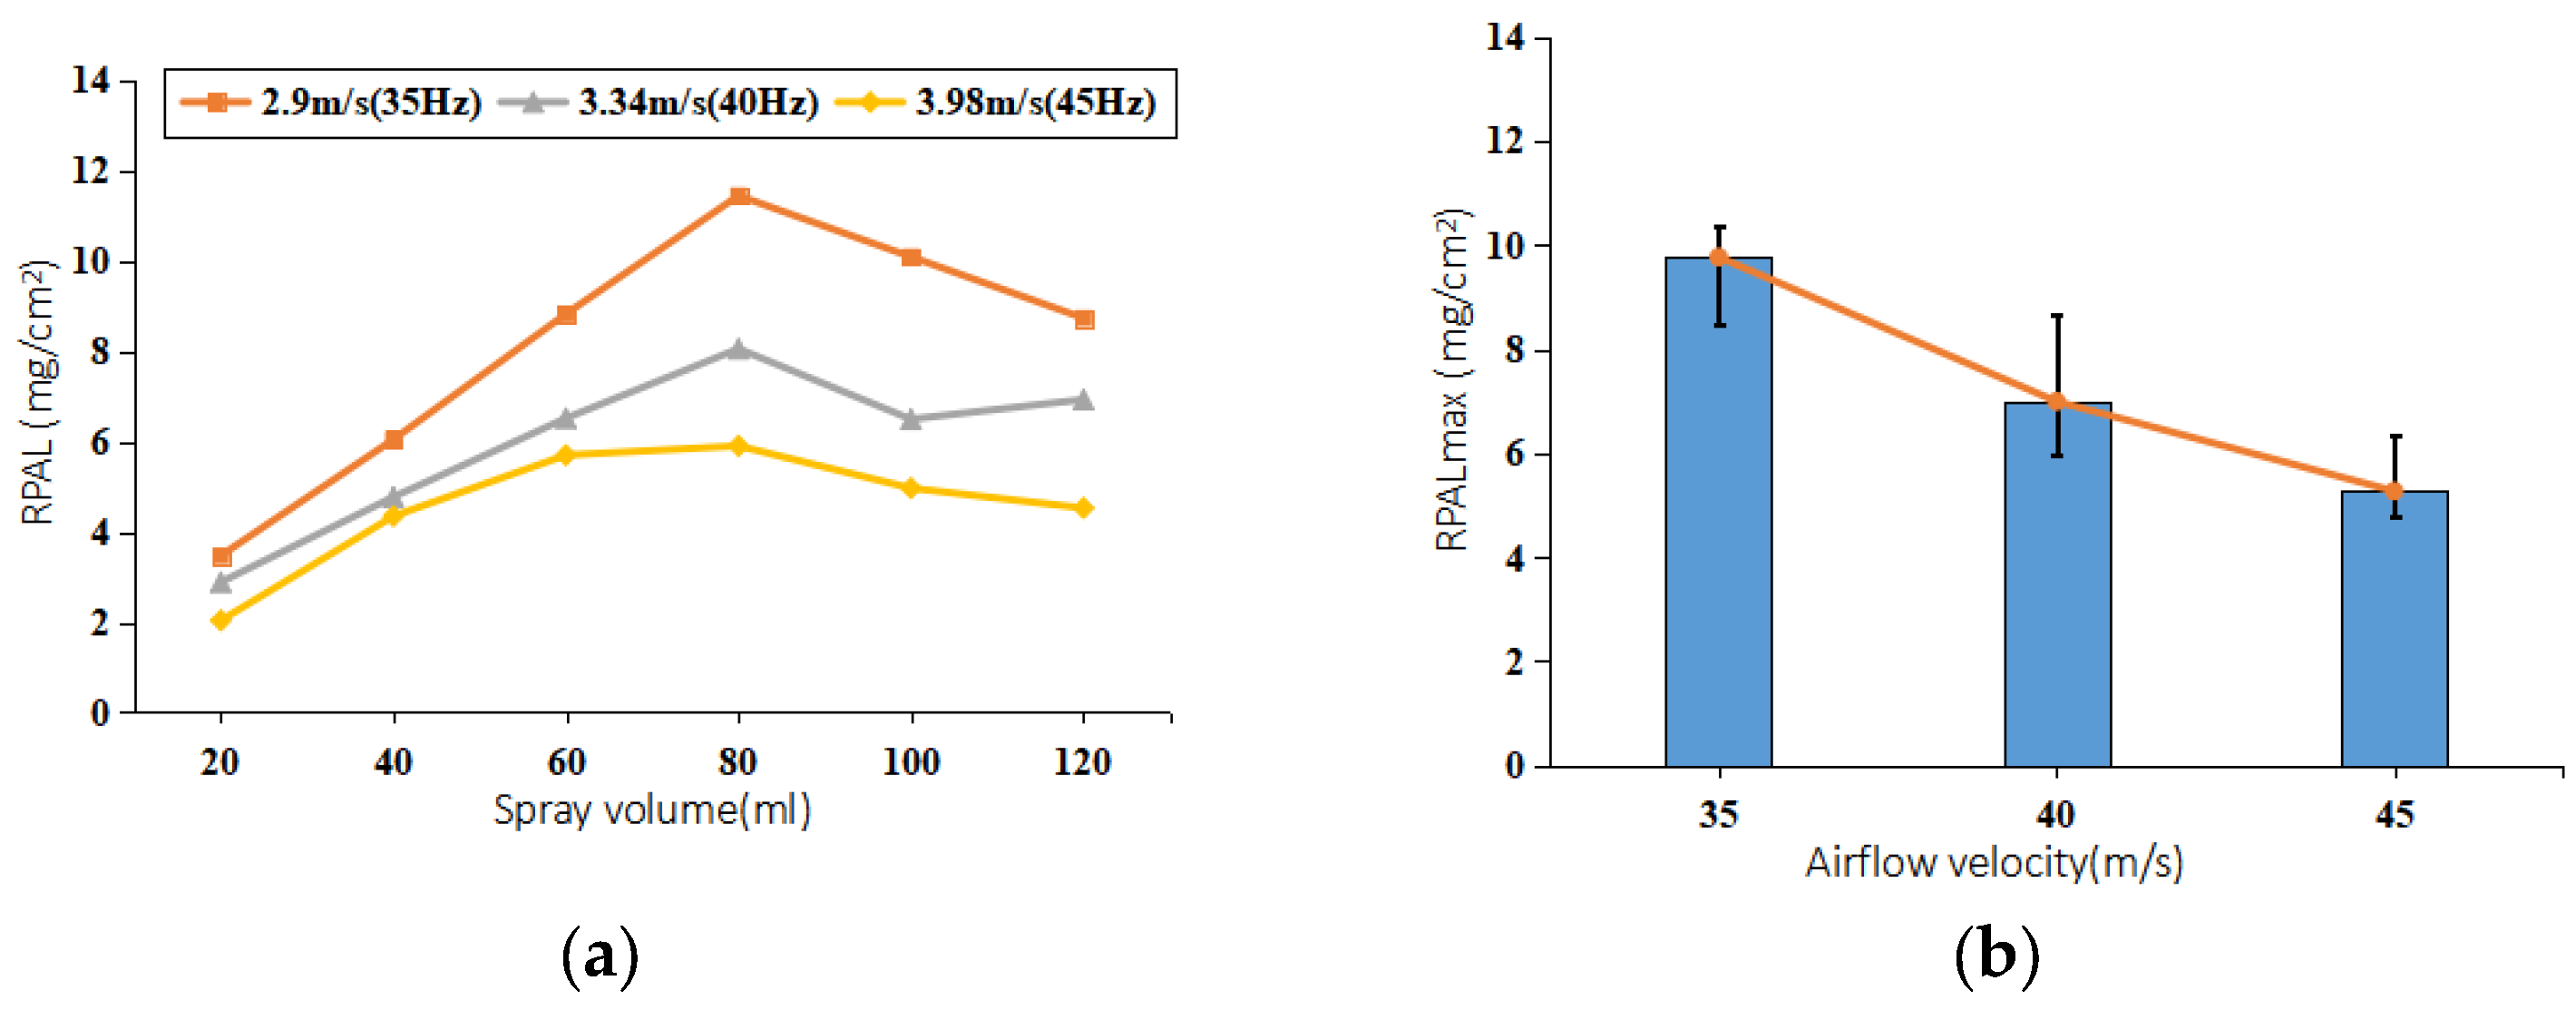
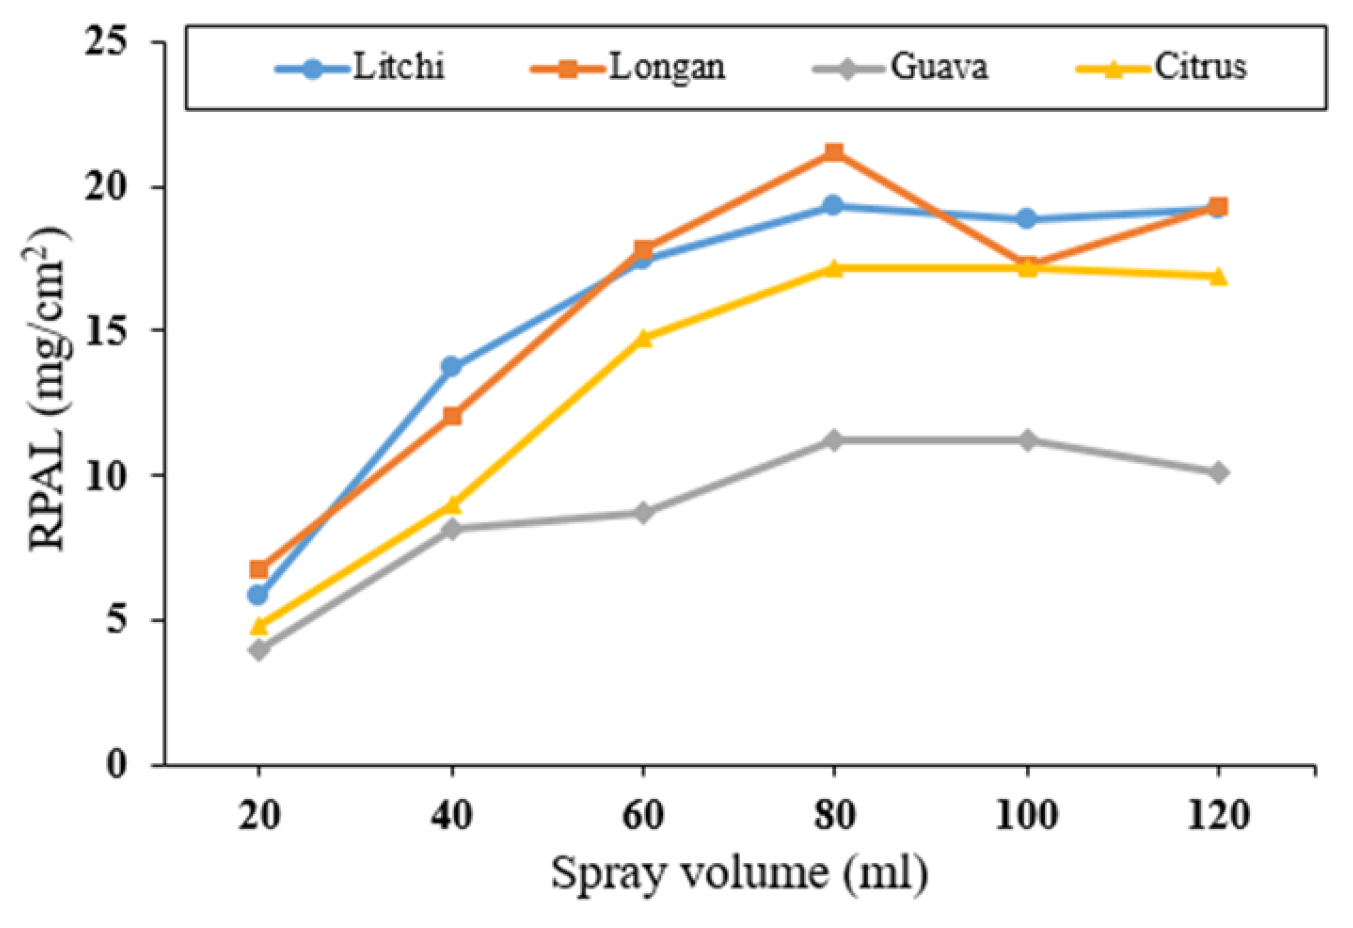
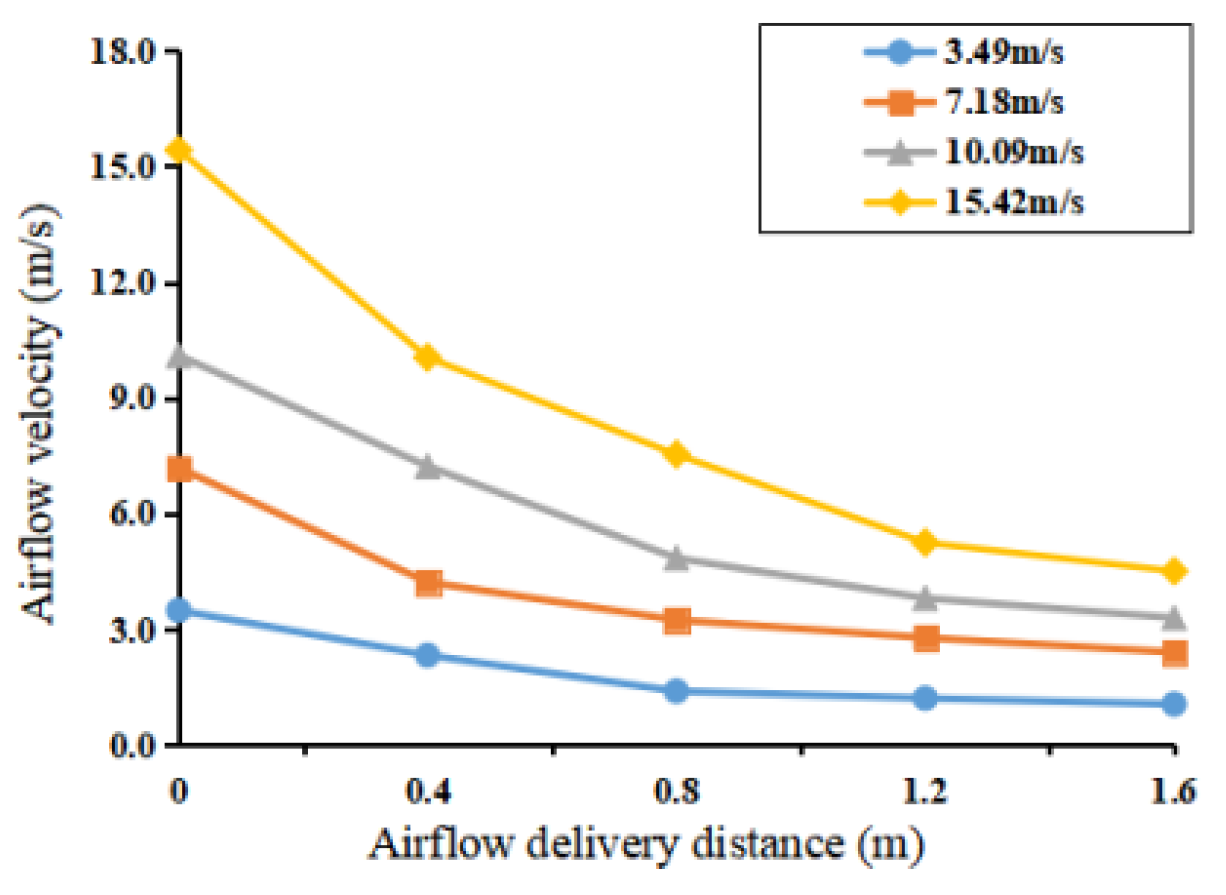
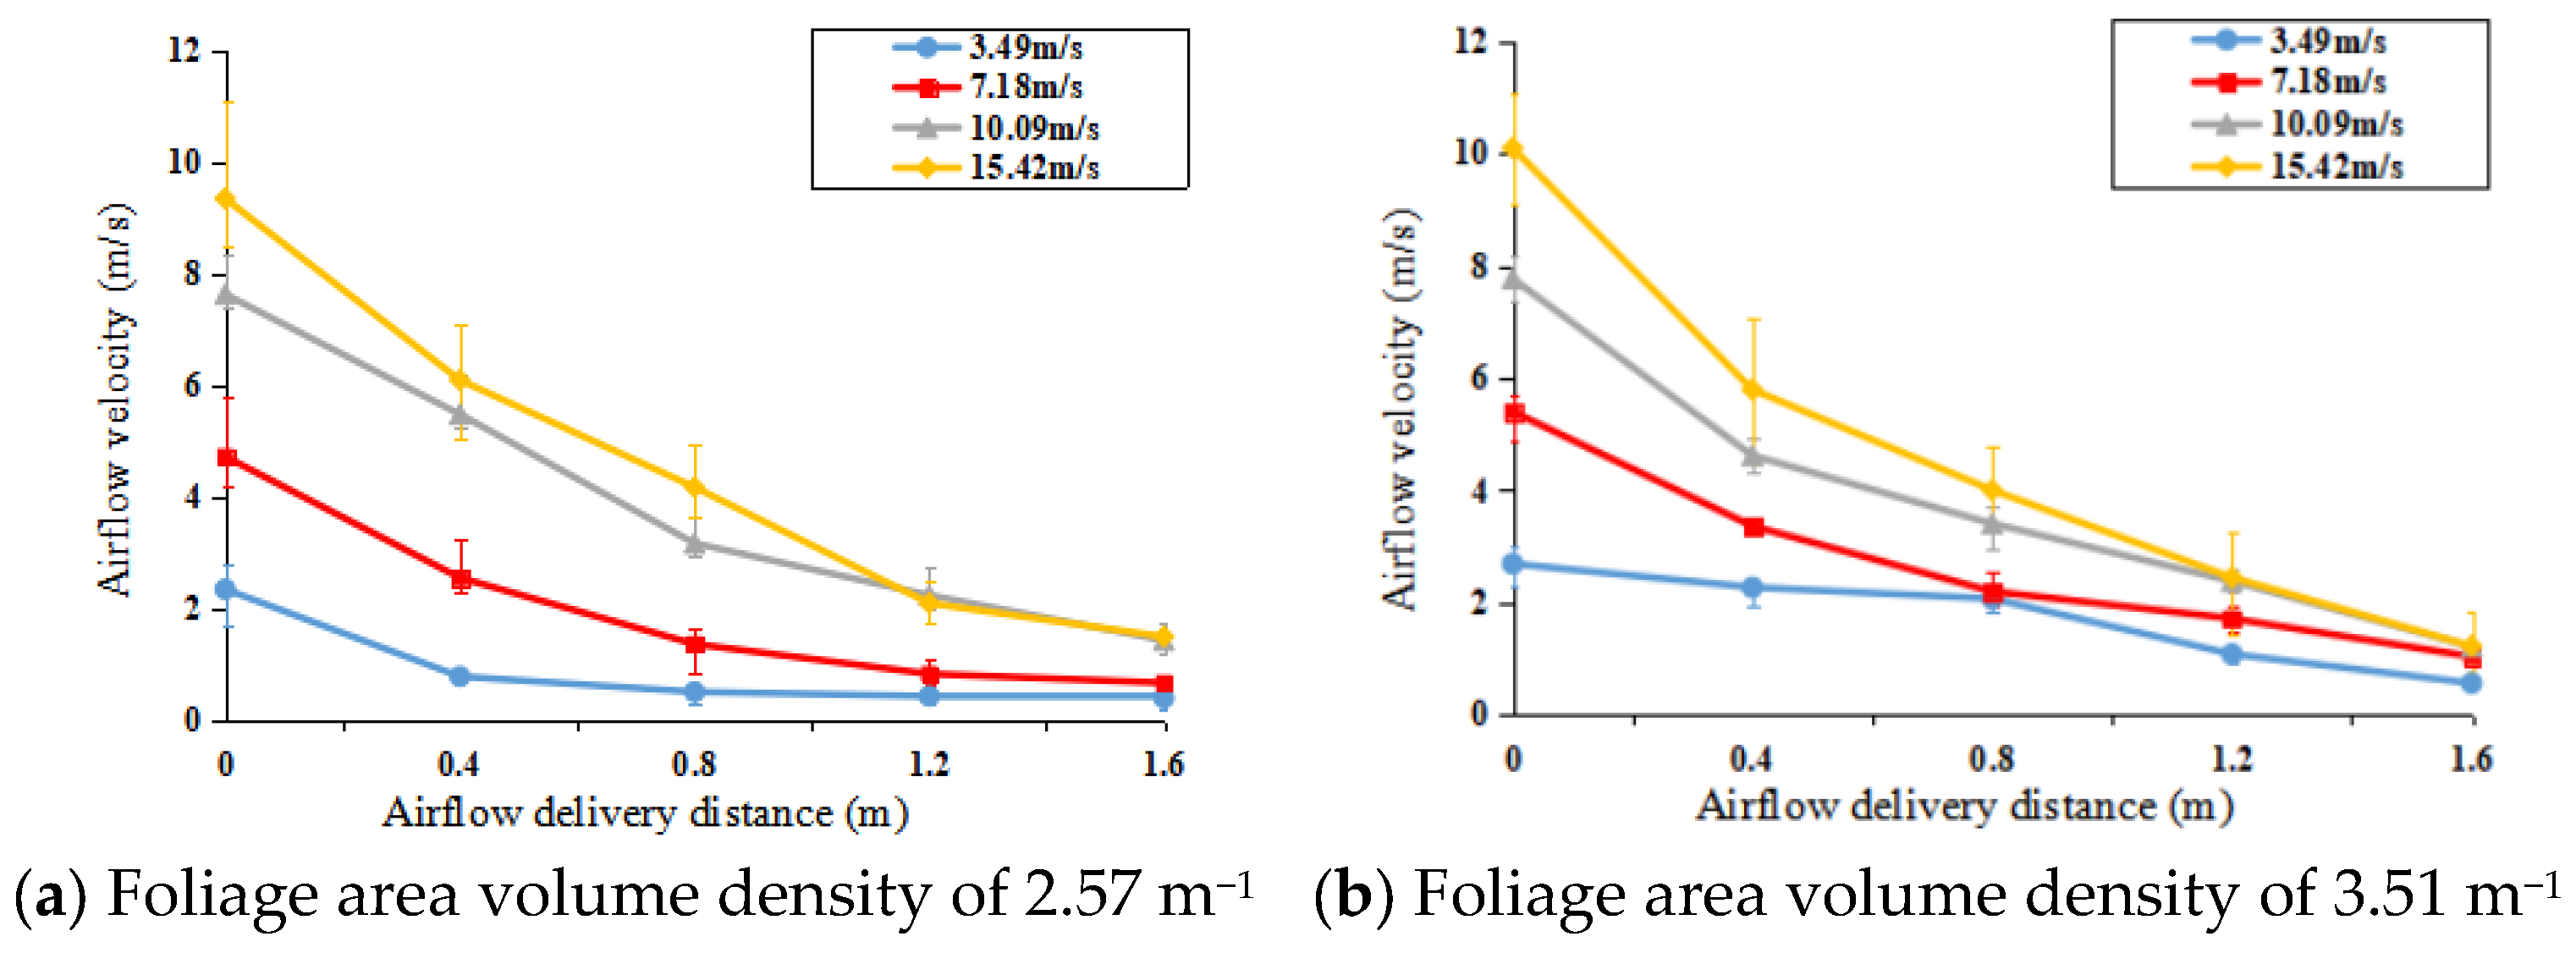
Most studies on the estimation of canopy liquid retention have primarily been based on canopy parameters, whereas the mechanism of interaction between a single leaf and a droplet has not been reported previously. The purpose of this paper was to present an approach for estimating droplet retention in fruit tree canopies by deposition of droplets on individual leaves during air-assisted spraying. The specific research had three objectives: to investigate the deposition of droplets and determine droplet retention on individual leaves with various forms for air-assisted spraying; To characterize airflow and droplet attenuation in a fruit tree canopy under natural conditions; to assess droplet retention of the total canopy on the basis of the droplet retention of individual leaves, as well as the attenuation characteristics of the airflow and droplets in the fruit tree canopy, under natural conditions.
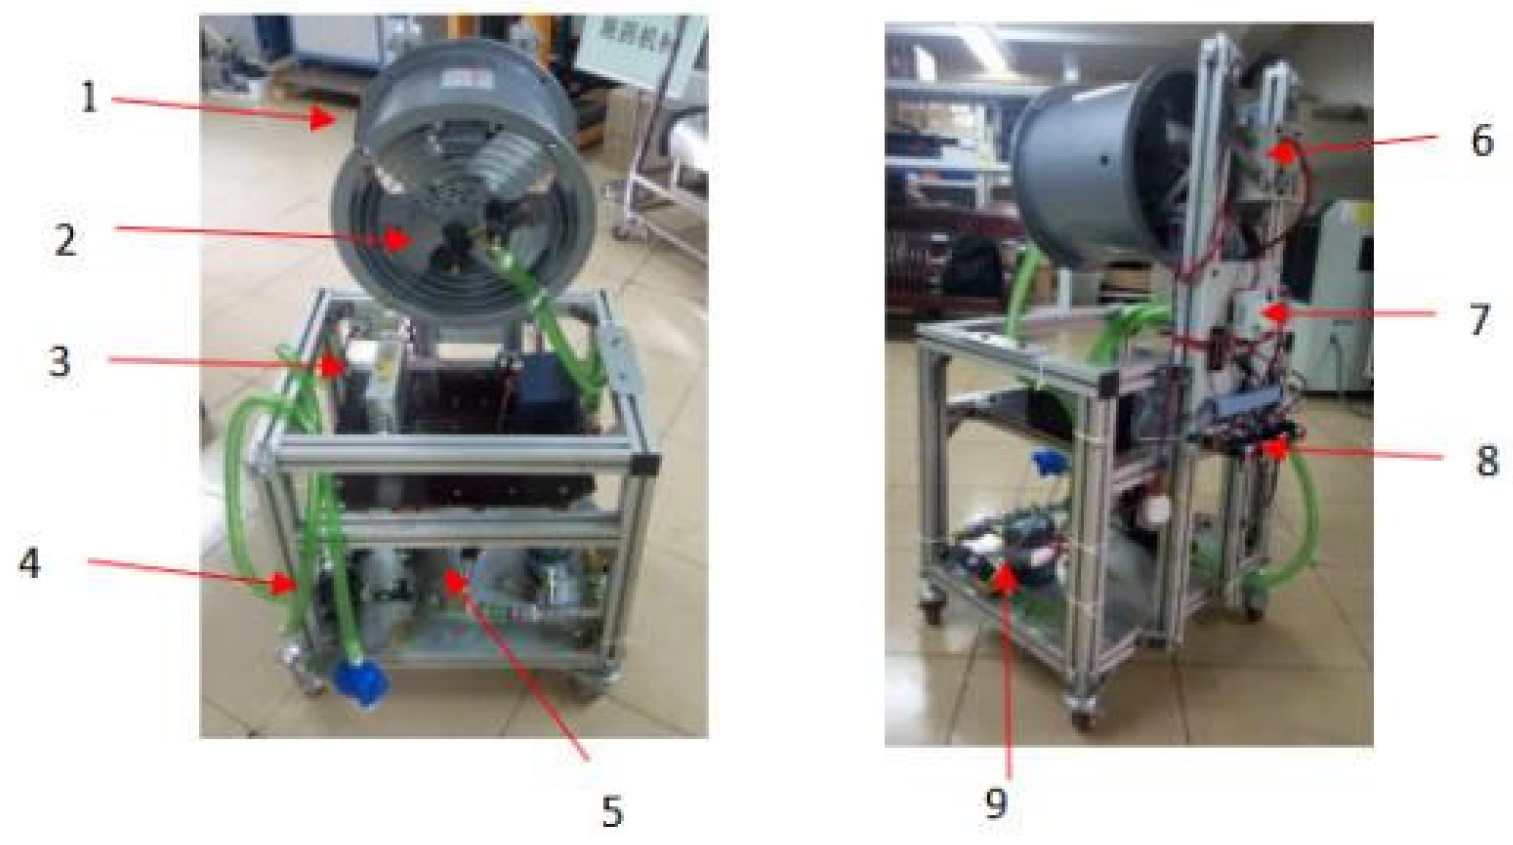
The interaction mechanisms between leaves and fog droplets were revealed. On the basis of the analysis of the retention of different forms of fog droplets on a single leaf, the maximum retention of fog droplets in the fruit tree canopy can be predicted to provide a decision solution for precise air-assisted orchard operating parameters.

2. Materials and Methods

2.1. Droplet Deposition on Individual Leaves in Air-Assisted Spraying

2.1.1. Experimental Materials

The experimental materials included a 3D profilometer (RTEC Instruments Co., Silicon Valley, CA, USA) to measure the roughness factor, an EZ-Pi Plus dynamic surface tension measuring instrument (Finland Kibron Co, Helsinki, Finland) to measure the surface tension of liquid, and a high-speed camera (FASTCAM Mini UX50, 1280 × 1024 resolution, 1000 fps) to record the leaf deposition images, using Adobe Photoshop software (San Jose, CA, USA)to calculate the coverage. Furthermore, we used a high-precision electronic balance (Sartorious Co, Gottingen, Germany) to compare the original weight with the weight after deposition to calculate the amount of deposition. we used a self-developed axial-flow air-assisted platform (Figure 1) to complete the experiment. The key parameters of the platform were as follows: 1.18 m high, equipped with a Chino SFWL3-2 axial fan with an air outlet diameter of 0.36 m, rated power of 0.37 kW, rated frequency of 50 Hz, full pressure of 230 Pa, air blade diameter of 0.3 m, rated voltage of 220 V, rated air volume of 3000 m3/h, and rated speed of 2800 rpm. The height of the fan center from the ground was 0.97 m. The fan was equipped with a frequency control device on the rear side to regulate the fan speed. The rear side of the fan was equipped with a frequency control device to adjust the fan speed, the frequency range was 0–50 Hz, and the fan speed control range was 0–2800 rpm. The droplet size range of the high-pressure nozzle was about 130–200 μ m (nozzle aperture, 1.0 mm; spray angle, 60°).
Leaves with different properties were selected for conducting the droplet deposition experiment, including Litchi chinensis Sonn. (hereinafter referred to as litchi) leaves, Dimocarpus longan Lour. (hereinafter referred to as longan) leaves, Psidium guajava Linn. (hereinafter referred to as guava) leaves, and Citrus achibana Blanco (hereinafter referred to as citrus) leaves. The leaves were all picked from the Litchi Cultivation Experimental Park of South China Agricultural University. Different concentrations of polyether-modified trisiloxane aqueous solutions were prepared for spraying.

2.1.2. Roughness Measurement of Leaf Surface

The roughness factor was obtained using a 3D profilometer. A few leaves with relatively flat surfaces were picked from trees, washed (to prevent foliar dust from interfering with the measurement results), and dried. The leaf sample was then placed flat on the loading surface of the 3D profilometer. Observations of the 3D structural morphology of the target leaf surface were conducted with a 20× objective lens and a numerical aperture of 0.45. A total of three 1 cm × 1 cm areas (avoiding the leaf’s midveins as much as possible) were selected randomly from a whole leaf for scanning by the 3D profilometer. The roughness factor r of the leaf was calculated by the division of the scanned leaf area into the projection area. The average roughness factor of the three randomly selected areas was calculated, as shown in Table 1.

2.1.3. Measurement of Surface Tension of Liquid

The surface tension of liquid was measured using an EZ-Pi Plus dynamic surface tension measuring instrument. The organic silicon agricultural surfactant of polyether-modified trisiloxane and distilled water were blended. A total of 12 different concentrations of polyether-modified trisiloxane solutions were prepared. The prepared solution was poured into a cup for surface tension measuring. When the liquid level was still, the measurement was started. The means were taken for three repetitions of each concentration. The measurements are shown in Table 2.

2.1.4. Measurement of Viscosity

The NDJ-8S rotary viscometer (Pingxuan Scientific Instruments Co, Shanghai, China) was used to measure the liquid viscosity values of several selected agricultural auxiliaries of different concentrations.
The concentrations of the solutions were 5%, 1%, 0.5%, 0.1%, 0.05%, 0.01%, and 0% (water). The solution to be measured was loaded into a large beaker, the rotor was completely immersed in the solution, and the rotating viscometer was activated to measure the viscosity of the solution; each solution was repeated three times for the average value. The results of the measurement data for each concentration are shown in Table 3.
On the basis of the small differences in the measured viscosity values, the effect of viscosity was not considered in this paper in view of experimental instability.

2.1.5. Single-Factor Experimental Design

The volume of deposition per cubic centimeter on the leaves is defined here as RPAL. To explore the effects of factors such as airflow velocity, blade inclination, liquid surface tension, and blade type on RPAL, single-factor experiments were carried out, and the corresponding parameters are shown in Table 4. Since the surface tension values of the 0.1 and 0.01 concentrations were almost equal, we chose 0.01 to be more in line with other levels.
During testing, a target leaf was clamped with a triangular clamping bracket, and the leaf inclination was changed by adjusting the angle of the clamping bracket. The nozzle of an air-assisted spray platform was positioned horizontally to the leaf, and the spray distance between targeted leaf and nozzle was 1 m (Figure 2). The spray volume was set in the spray control system of the air supply spray experiment platform, and the initial value was set to 20 mL. The experimental procedures were as follows: (1) the leaf was imaged on a positioning plate to obtain its area and placed in a high-precision electronic scale to measure its weight; (2) the air-assisted system and the spray control system were initiated after the fan speed and airflow speed were stable; (3) the spray control system and air supply system were suspended; (4) the spray volume was increased at an interval level of 20 mL until the weight of the target leaf no longer increased, repeating each level three times and calculating the average weight; (5) the target leaf was removed with forceps and placed on a high-precision electronic balance for weighing.

2.1.6. Orthogonal Experimental Design

To select the optimal combination of leaf inclination, airflow velocity, roughness factor, and surface tension of liquid influencing droplet retention, a four-factor and four-level orthogonal experimental design was carried out. The maximum retention of droplet per unit area of the leaf (hereinafter referred to as RPALmax) was taken as the experimental index. The orthogonal test factors and levels are shown in Table 5. As the surface tension values between 0.01% (31.48) and 0.1% (30.61) were almost the same, a concentration of 0.005% was chosen as the experimental level.

2.2. Characterizing Attenuation of Droplets in Canopies

2.2.1. Experimental Materials

The instruments and equipment used in this experiment included a DT-3880 thermosensitive anemometer (CEM Technology Industrial Co, Ltd., Shenzhen, China; error of wind speed measurement = 5% ± 0.03 m/s), a high-precision electronic balance (Sartorious Co., Gottingen, Germany; measurement resolution = 0.1 mg), and a self-created axial-flow air-assisted sprayer (Figure 3). The sprayer was mainly composed of a vehicle platform, spray supply, and air-assisted component. The spray supply further consisted of a pesticide box, an electric motor, a liquid pump, a gasoline generator, etc. The gasoline generator supplied power to the whole system. The electric motor drove the pump through a pulley to suck liquid from the pesticide box before circulating it to a ring-like nozzle group. The air-assisted component consisted chiefly of four axial-flow fans. Different concentrations of solutions blended with polyether-modified trisiloxane and distilled water were prepared. This experiment was carried out in the standard orchard of South China Agricultural University. The fruit trees were uniformly pruned, and the canopy was relatively sparse.

2.2.2. Volume Density Measurement of Different Foliage Areas

In this experiment, a cubic frame (Figure 4) of 30 cm × 30 cm × 30 cm was inserted into different measurement areas of a canopy for sampling using foliage area volume density (FAVD) as the key variable. The total number of leaves and the area of the leaves on one side were counted and recorded [22]. For calculating the sampled leaf area, the leaf was placed on a positioning plate, and Photoshop software was used for imaging and editing. The foliage area volume density was calculated using the following formula:
FAVD = k = 1 n N k · S k n · V k ( k = 1 , 2 , , n ) ,
where FAVD is the foliage area volume density (m−1), Nk is the number of leaves in a sampled cubic frame, Sk is the average area of individual leaves in a sampled cubic frame (m2), and Vk is the volume of a sampled cubic frame (m3). Experimental data are shown in Table 6.

2.2.3. Single-Factor Experimental Design

Single-factor experiments were conducted to investigate the effects of airflow velocity, foliage area volume density, and surface tension of liquid on the droplet volume. Test factors and corresponding parameters are shown in Table 7.
Before testing, the axial-flow air-assisted sprayer was positioned in front of a target tree, and the profile strut and fan angle were adjusted such that the fan’s axis and the center of the tree canopy were aligned horizontally. During testing, the air-assisted device was first started. Then, the spray supply device was initiated after the airflow velocity was stable. Upon reaching a set spray volume, the air-assisted device and spray supply device were suspended. For the collection of droplets, a circular absorbent paper with a diameter of 7 cm was placed on the windward side of the tree canopy. A three-layer sampling strategy was adopted, and three measuring points were set at the left, middle, and right of each layer. The layout of the collection points is shown in Figure 5. Droplet retention was obtained by weighing the absorbent paper using a high-precision electronic balance, providing a basis for investigating the attenuation characteristics of droplets along the spray direction. The droplet penetration ratio Pd was calculated using the following equation:
P d = Q i Q 1 × 100 % ,
where Q1 is the droplet retention at collection points of the first layer (mg), and Qi is the droplet retention at collection points of the i-th (i = 2, 3) layer (mg).

2.2.4. Orthogonal Experimental Design

To further explore the optimal parameter combination of airflow velocity, foliage area volume density, and canopy depth affecting the droplet penetration ratio, a three-factor and four-level orthogonal experiment L 16 ( 4 3 ) was carried out. A total of 16 treatments were created, and each treatment was repeated three times. The orthogonal test factors and levels are shown in Table 8.

3. Results and Discussion

3.1. Effect of Factors Affecting Droplet Deposition on Individual Leaves

3.1.1. Effect of Leaf Inclination Angle on Droplet Deposition

Taking litchi leaves as an example, Figure 6a shows the patterns of RPAL against spray volume under various leaf inclination angles. When spray volume ranged from 20 to 80 mL, the RPAL increased gradually and reached the maximum at a spray volume of around 80 mL. When the spray volume was greater than 80 mL, the RPAL no longer increased or even started to fall with a continuous increase in spray volume. The cause of this phenomenon was that some liquid drops that were gradually merged with smaller droplets rolled off the leaves when their gravity exceeded their cohesive force with continuous spraying, resulting in droplet retention loss [23]. On the other hand, the RPAL decreased with an increase in leaf inclination angle, which agrees with previous findings.
Figure 6b shows the decreasing trend of RPALmax with increasing leaf inclination. Since a leaf inclination angle of 0° exists less in reality, we selected 15°, 45°, and 75° as orthogonal design levels.

3.1.2. Effect of Surface Tension of Liquid on Droplet Deposition

We analyzed the results according to the Weber number (Equation (3)) in computational fluid dynamics.
W e = ρ D 0 U 0 2 γ ,
where ρ   is the droplet density, D 0 is the droplet size, U 0 is the speed of droplets before collision, and γ is the liquid surface tension. In this test, the working parameters of the platform were not changed; thus, U 0 of the droplets was considered to be the same, as calculated from two continuous pictures taken using a high-speed camera ( U 0 = 4.8   m / s ). The Weber numbers are shown in Table 9.
We can see from Table 9 that the surface tension greatly decreased and the Weber number increased correspondingly upon adding polyether-modified trisiloxane. A lower surface tension improved the droplet deposition with the same impact kinetic energy, because the consequent liquid film was thinner compared to that for a water droplet. The suppression of droplet rebound by the decreased surface tension was also observed in previous experiments using surfactant-added water droplets [24,25].
The deposition effect of droplets with different Weber numbers is shown in Figure 7. These droplet depositions were obtained at a spray volume of 80 mL. When We > 144.3, the droplets were deposited in the form of a liquid film (Figure 7a and Figure 8b). The liquid film completely covered the leaves. However, it was observed that the liquid film of droplets on the leaf was thin, resulting in a lower droplet retention. When We < 84.3, the droplets on the leaf surface were deposited in the form of liquid droplets (Figure 7c and Figure 8d). Compared to the deposition effect of solutions and distilled water, it may be concluded that the use of organic silicon agricultural aid could improve the droplet deposition uniformity of spraying, which agrees with previous findings.
As discussed in Section 2.1.3, a blend of polyether-modified trisiloxane and distilled water was used as the solution for measurement of surface tension. Lower concentrations of polyether-modified trisiloxane solutions resulted in larger surface tensions. Taking litchi leaves as an example, Figure 8 shows a negative effect of surface tension of liquid on RPALmax. Therefore, greatly reducing the surface tension in the operation could not achieve a good plant protection effect.

3.1.3. Effect of Airflow Velocity on Droplet Deposition

Taking litchi leaves as the research object, Figure 9 shows the effect of airflow velocity on droplet deposition. Airflow velocity showed a negative correlation with RPAL This is because the higher airflow velocity reduced the density of droplets in the spatial region, causing more droplets to be blown over a longer distance. However, the airflow improved the uniformity of droplet deposition and reduced the spatial accumulation of droplets in some areas. Therefore, it is crucial to balance the RPAL and airflow velocity.
Figure 9b also shows a decreasing trend of RPALmax with increasing airflow velocity.

3.1.4. Effect of Leaf Type on Droplet Deposition

Figure 10 shows the effect of leaf roughness on droplet deposition. It can be seen that RPAL was lowest for guava leaves, whereas citrus leaves had a greater RPAL. Litchi and longan leaves had a similar RPAL. The microstructure of the leaves may have caused the variation in deposition, since a larger roughness factor should have result in a smaller deposition.

3.1.5. Orthogonal Experimental Results of Droplet Deposition

The orthogonal experimental results are shown in Table 10. The experimental index was RPALmax, and SPSS was used to conduct non-repeated orthogonal experiment variance analysis. As seen in Table 8, all four factors had a significant effect on RPALmax.
The results of the analysis of variance for the orthogonal experiment are shown in Table 11, and the F-test showed that all four factors had a significant effect on RPALmax.
Combined with the single-factor experimental analysis of the leaf inclination, airflow velocity, roughness factor, and liquid surface tension, the orthogonal experimental results were fitted by a multiple linear regression equation using SPSS. The fitting equation is shown in Equation (4).
Q = 1.244 v c ± 0.664 vr + 4.323 r 0.084 v 2 0.744 r 2 3.687 ,
where Q is the RPALmax (mg), γ is the liquid surface tension (mN/m), r is the roughness factor, and v c is the airflow velocity in canopy (m/s), which can be calculated using Equations (5) and (6).

3.2. Factors Affecting Droplet Penetration Ratio in Canopy

3.2.1. Airflow Attenuation under Natural Conditions

The measurement results of the airflow velocity at 15 Hz, 30 Hz, 45 Hz, and 60 Hz fan frequencies are shown in Figure 6. The relationship between airflow velocity and conveying distance is shown in the Figure 11. When the delivery distance was less than 0.4 m/s, airflow attenuation rate was fast. With the increase in delivery distance, the attenuation rate of airflow decreased and tended to be stable.
According to the experimental results of the airflow velocity measured at different fan frequencies and different airflow delivery distances in a natural state, the fan outlet airflow speed v 0 and the airflow delivery distance d were taken as independent variables, and the velocity of the airflow coming into the canopy v n was taken as the dependent variable. Multiple linear regression analysis was conducted using SPSS to obtain the equation (R2 = 0.989).
v n = 0.91 v 0 4.1 d + 2.68 d 2 0.44 v 0 d + 0.69 .

3.2.2. Airflow Attenuation in Canopies

The airflow attenuation characteristics of different canopies were further studied. The canopy airflow attenuation measurement experiment was carried out for four types of canopies using the FAVD data from Table 6, and different fan frequencies were selected for the measurement. Five airflow velocity measuring points were arranged from near to far from the fan, and the distance between measuring points was 0.2 m. Preliminary relationships were drawn between the canopy airflow velocity and the canopy depth, airflow velocity, and foliage area volume density, as shown in Figure 12. Results show that the attenuation rate of the airflow velocity in the canopy decreased with increasing foliage area volume density and canopy depth.
With the velocity of the airflow coming into the canopy v n , foliage area volume density p, and canopy depth l as independent variables and the airflow velocity in canopy v c as the dependent variable, a multiple linear regression equation (R2 = 0.978) was established using the canopy experiment data of different leaf area volume densities.
v c = 1.1 v n 5.63 l + 1.64 p + 7.56 l 2 0.16 p 2 1.12 lv n 0.05 pv n 2.93 .

3.2.3. Effect of Airflow Velocity on Droplet Penetration Ratio

The spray distance was set to 0.8 m. The target plant with an FAVD of 5.83 m−1 was selected. Water was selected as the spray liquid (surface tension = 72.7 mN/m). The average droplet retention of each canopy for three measurement points is shown in Figure 13. When the measurement point was at a close distance and the airflow velocity was set to 3.49 m/s, the average droplet retention was 439.90.
As droplets passed through the close-distance layer, they were mostly intercepted. The droplet penetration rate in the middle-distance layer was only 3.5%, while the penetration ratio in the far-distance layer was only 2.6%. With increasing airflow velocity, the canopy droplet penetration ratio gradually increased. When the airflow velocity reached 10.09 m/s, the droplet deposition volume in the middle-distance and far-distance layers reached the highest values; the droplet penetration ratio in the middle-distance layer was 28.8%, 87.8% higher than that at an airflow velocity of 3.49 m/s, while the droplet penetration ratio in the far-distance layer was 10.3%, 74.8% higher than that at an airflow velocity of 3.49 m/s. When the airflow velocity continued to increase, the droplet deposition volume in the middle-distance and far-distance layers was relatively reduced. Because the spray volume of the nozzle was constant, the increase in the airflow velocity accelerated the forward movement of the droplet group, resulting in a decrease in the droplet retention volume per unit area. Some droplets drifted or penetrated beyond the canopy due to the high airflow velocity. In addition, the aerodynamic response velocity generated by high-speed airflow on the leaves increased, leading to an intense unexcited disturbance on the leaves, which increased the kinetic energy of droplets and led to a decrease in droplet retention volume per unit area on the leaf [2]. Therefore, within the same spray time, under the condition of a certain volume of spray, the droplet deposition volume behind the canopy was relatively reduced.

3.2.4. Effect of FAVD on the Droplet Penetration Ratio

The spray distance was set to 0.8 m, the airflow velocity was set to 10.09 m/s, water was selected as the spray fluid (the surface tension value was 72.7 mN/m), and the spray droplet deposition volume of target plants under different FAVDs was calculated, as shown in Figure 14. As shown in Figure 14, there was no linear correlation between droplet deposition and FAVD, which may have been because the droplet deposition volume in the middle-distance layer was affected by the average leaf inclination of the leaves in the close-distance layer. The droplet penetration ratio of the middle-distance layer and the far-distance layer in the canopy was calculated and obtained, as shown in Table 12. From Table 12, it can be intuitively seen that the droplet penetration ratio of the middle-distance layer was negatively correlated with the FAVD, while the droplet penetration ratio in the canopy decreased with increasing FAVD.

3.2.5. Effect of Liquid Surface Tension on the Droplet Penetration Ratio

The relevant parameters of the spray experiment were set as follows: spray distance of 0.8 m, spray volume of 150 mL, target plants with foliage area volume density of 5.83 m, and airflow velocity of 10.09 m/s. There was a positive correlation between the droplet deposition volume and liquid surface tension value.The average droplet retention of each canopy for three measurement points is shown in Figure 15.
To further study the relationship between droplet penetration ratios and different liquid surface tensions in the target canopy, the results of droplet penetration ratios were calculated using Equation (2). As seen intuitively from Table 13, with increasing liquid surface tension, there was no significant difference in the droplet penetration ratio in each layer, indicating that liquid surface tension had no significant effect on the droplet penetration ratio in the canopy.

3.2.6. Establishment of the Canopy Droplet Penetration Ratio Prediction

The orthogonal experiment scheme and results are shown in Table 14. The experimental parameters were airflow velocity (A), FAVD (B), and canopy sampling depth (C), and the experimental index was the canopy droplet penetration ratio. Combined with the single-factor experimental analysis results of the fan frequency, foliage area volume density, and canopy sampling depth vs. the canopy droplet deposition volume, the orthogonal experimental results were fitted using a multiple linear regression equation with SPSS, yielding the following equation (R2 = 0.991):
P = 0.53 v 0 3.36 p 2.88 l + 0.02 l 2 + 109.55 ,
where l is the canopy sampling depth (cm), v 0 is the fan outlet airflow speed (m/s), and p is the foliage area volume density (m−1).

3.3. Prediction of Maximum Canopy Droplet Retention

The calculation formula of the leaf area and volume density was FAVD = N k · S k V k (k = 1, 2, 3, …, n). The equation was quantified for the whole fruit tree canopy, assuming that FAVD = FAVD ¯ , and the formula was as follows:   FAVD ¯ = N · S V , where FAVD ¯ is the average foliage area volume density of the tree (m−1), N is the total number of leaves on a tree (piece), S is the average area of a single leaf (m2), and V is the canopy volume of the tree.
The distribution range of different leaf inclinations was calculated according to the median of the distribution range of leaf inclination (if the leaf inclination was within the range of 0°–30°, 15° was used for calculation), yielding the following formula of average canopy leaf inclination:
θ ¯ = 15 c 1 + 45 c 2 + 75 c 3 ,
where c 1 , c 2 , and c 3 represent the proportion of leaf inclination in the whole canopy at leaf inclinations of 0°–30°, 30°–60°, and 60°–90° (%), respectively.
The maximum droplet retention volume = the area of all leaves × the maximum droplet retention volume per leaf, and the area of all leaves = N × S = FAVD ¯ × V. Because the canopy droplet penetration ratio decreased with increasing canopy sampling depth, the value for the target tree was calculated by stratification from the close-distance layer to the far-distance layer, combining Equations (4) and (5), yielding the following formula of the total canopy droplet retention volume:
S sum = 1 i i = 1 n P i × Q i × FAVD ¯ × V , ( i = 1 , 2 , , n ) ,
where P i is the droplet penetration ratio of layer i (%), Q i is the RPALmax of layer i (mg), and S sum is the total canopy droplet retention (mg).
The validation test was carried out on the premise that the air supply distance was 1 m, the liquid surface tension was 72.7 mN/m, the outlet airflow velocity was 10.09 m/s (45 Hz), and the roughness factor was 1.15. The volume of the fruit trees was abstracted into an elliptical structure model, i.e., V = 4 3 π ac 2 , and the middle half axis and the short half axis were treated equally [26]. The predicted value was calculated according to three sampling layers (i = 3). The experiment results are shown in Table 15. The average relative error between the predicted and actual values was 15.6%. A larger volume of the fruit canopy resulted in a larger relative error. During the experiment, it was observed that the deposition volume of droplets at the center of the sampling surface of the fruit tree canopy was high, while that at the edge of the sampling surface was low. This difference may have been because the axial-flow sprayer was used to spray at a fixed position in this verification experiment, resulting in the low deposition volume of droplets at the edge of the canopy. If the working mode of the normal orchard air-assisted spray machine was carried out while moving and spraying, then the deposition volume of droplets in the canopy would be relatively uniform, and the deposition volume in the whole canopy would also be improved.

4. Conclusions

In this paper, the RPALmax of a single leaf was studied under four factors: airflow velocity, roughness factor, surface tension, and leaf inclination angle. The penetration of droplet deposition in the canopy was also experimentally studied. The main conclusions can be summarized as follows:
(1)
Droplets with a large Weber number are conducive to spreading on the leaf surface, but the amount of deposition on the leaf would be reduced; hence, it is necessary to select an appropriate concentration of pesticide. For example, in this experiment, We = 144.3.
(2)
According to the orthogonal test results of the four parameters of leaf inclination angle, flow velocity, roughness factor, and liquid surface tension, the significance order was obtained as follows: liquid surface tension > airflow > roughness factor > leaf inclination angle.
(3)
With increasing wind velocity, the canopy penetration rate of droplets gradually increased. The airflow velocity reached 10.09 m/s, and the deposition volume of droplets in the middle- and far-distance layers reached the highest value. The droplet penetration ratio in the canopy was negatively correlated with the FAVD, and the droplet penetration ratio in the middle-distance layer decreased with increasing FAVD.
(4)
The prediction equation of the total canopy droplet retention volume was verified, and the average relative error was 15.6%.

Author Contributions

Conceptualization and supervision, J.L.; visualization and writing—review and editing, M.H.; writing—original draft, H.C.; data curation, P.L.; investigation, Y.C. and G.L.; project administration, G.H.; methodology, H.F. All authors read and agreed to the published version of the manuscript.

Funding

This work was supported by the earmarked fund for the Laboratory of Lingnan Modern Agriculture Project (NZ2021009), the China Agriculture Research System of MOF and MARA (No. CARS-32), the Special Project of Rural Vitalization Strategy of Guangdong Academy of Agricultural Sciences (No. TS-1-4), and the Guangdong Provincial Modern Agricultural Industry Technology System (No. 2021KJ123).

Institutional Review Board Statement

Not applicable.

Informed Consent Statement

Not applicable.

Data Availability Statement

Not applicable.

Conflicts of Interest

The authors declare no conflict of interest.

References

  1. Cross, J.V.; Walklate, P.J.; Murray, R.A.; Richardson, G.M. Spray deposits and losses in different sized apple trees from an axial fan orchard sprayer: 3. Effects of air volumetric flow rate. Crop Prot. 2003, 22, 381–394. [Google Scholar] [CrossRef]
  2. Li, J.; Li, Z.; Ma, Y.; Cui, H.; Yang, Z.; Lu, H. Effects of leaf response velocity on spray deposition with an air-assisted orchard sprayer. Int. J. Agric. Biol. Eng. 2021, 14, 123–132. [Google Scholar] [CrossRef]
  3. Larbi, P.A.; Salyani, M. Model to Predict Spray Deposition in Citrus Airblast Sprayer Applicationsf: Part 2. Spray Deposition. Trans. ASABE 2012, 55, 41–48. [Google Scholar] [CrossRef]
  4. Hewitt, A.J. Spray drift: Impact of requirements to protect the environment. Crop Prot. 2000, 19, 623–627. [Google Scholar] [CrossRef]
  5. Dorr, G.J.; Hewitt, A.J.; Adkins, S.W.; Hanan, J.; Zhang, H.; Noller, B. A comparison of initial spray characteristics produced by agricultural nozzles. Crop Prot. 2013, 53, 109–117. [Google Scholar] [CrossRef]
  6. Musiu, E.M.; Qi, L.; Wu, Y. Spray deposition and distribution on the targets and losses to the ground as affected by application volume rate, airflow rate and target position. Crop Prot. 2019, 116, 170–180. [Google Scholar] [CrossRef]
  7. Song, S.; Xia, H.; Lu, Y.; Hong, T.; Ruan, Y. Structural optimization and experiment on fluid director of air-assisted sprayer. Trans. Chin. Soc. Agric. Eng. 2012, 28, 7–12. (In Chinese) [Google Scholar]
  8. Song, L.; Li, J.; Yang, X.; Wang, P. Parameter optimization of diversion structure of tower type air-assisted sprayer. J. Chin. Agric. Mech. 2020, 41, 34–39. (In Chinese) [Google Scholar]
  9. Wang, S.; Zhang, W.; He, H.; Wang, W.; Zhang, M.; Hu, X. Effection of typical plants leaves on pesticide wetting speciality and retentivity. J. Jilin Univ. (Eng. Technol. Ed.) 2013, 43, 564–568. (In Chinese) [Google Scholar]
  10. Hall, D.M.; Burke, W. Wettability of leaves of a selection of New Zealand plants. N. Z. J. Bot. 1974, 12, 283–298. [Google Scholar] [CrossRef]
  11. Papierowska, E.; Mazur, R.; Stańczyk, T.; Beczek, M.; Szewińska, J.; Sochan, A.; Ryżak, M.; Szatyłowicz, J.; Bieganowski, A. Influence of leaf surface wettability on the drop splash phenomenon. Agric. For. Meteorol. 2019, 279, 107762. [Google Scholar] [CrossRef]
  12. Wirth, W.; Storp, S.; Jacobsen, W. Mechanisms controlling leaf retention of agricultural spray solutions. Pestic. Sci. 1991, 33, 411–420. [Google Scholar] [CrossRef]
  13. Damak, M.; Hyder, M.N.; Varanasi, K.K. Enhancing droplet deposition through in-situ precipitation. Nat. Commun. 2016, 7, 1–9. [Google Scholar] [CrossRef] [PubMed] [Green Version]
  14. Bird, J.C.; Dhiman, R.; Kwon, H.M.; Varanasi, K.K. Reducing the contact time of a bouncing drop. Nature 2013, 503, 385–388. [Google Scholar] [CrossRef] [PubMed]
  15. Song, M.; Ju, J.; Luo, S.; Han, Y.; Dong, Z.; Wang, Y.; Gu, Z.; Zhang, L.; Hao, R.; Jiang, L. Controlling liquid splash on superhydrophobic surfaces by a vesicle surfactant. Sci. Adv. 2017, 3, e1602188. [Google Scholar] [CrossRef] [PubMed] [Green Version]
  16. Al-Sharafi, A.; Yilbas, B.S.; Ali, H.; Al-Qahtani, H. Adhesion of a water droplet on inclined hydrophilic surface and internal fluidity. Int. J. Adhes. Adhes. 2020, 96, 102464. [Google Scholar] [CrossRef]
  17. Yazbeck, T.; Bohrer, G.; De Roo, F.; Mauder, M.; Bakshi, B. Effects of spatial heterogeneity of leaf density and crown spacing of canopy patches on dry deposition rate. Agric. For. Meteorol. 2021, 306, 108440. [Google Scholar] [CrossRef]
  18. Liu, H.; Si, C.; Liu, H.; Si, C.; Cai, C.; Zhao, C.; Yin, H. Experimental investigation on impact and spreading dynamics of a single ethanol-water droplet on a heated surface. Chem. Eng. Sci. 2021, 229, 116106. [Google Scholar] [CrossRef]
  19. McLennon, E.; Dari, B.; Jha, G.; Sihi, D.; Kankarla, V. Regenerative agriculture and integrative permaculture for sustainable and technology driven global food production and security. Agron. J. 2021, 113, 4541–4559. [Google Scholar] [CrossRef]
  20. Cross, J.V.; Walklate, P.J.; Murray, R.A.; Cross, J.V.; Walklate, P.J.; Murray, R.A.; Richardson, G.M. Spray deposits and losses in different sized apple trees from an axial fan orchard sprayer: 2. Effects of spray quality. Crop Prot. 2001, 20, 333–343. [Google Scholar] [CrossRef]
  21. Vázquez-García, J.G.; Castro, P.; Torra, J.; Cruz, R.A.D.L.; Prado, R.D. Resistance evolution to EPSPS inhibiting herbicides in false barley (Hordeum murinum) harvested in Southern Spain. Agronomy 2020, 10, 992. [Google Scholar] [CrossRef]
  22. Sun, C.; Qiu, W.; Ding, W.; Gu, J. Parameter optimization and experiment of air-assisted sprayer on pear trees. Trans. Chin. Soc. Agric. Eng. 2015, 31, 30–38. (In Chinese) [Google Scholar]
  23. Li, J.; Cui, H.; Ma, Y.; Xun, L.; Li, Z.; Yang, Z.; Lu, H. Orchard Spray Study: A Prediction Model of Droplet Deposition States on Leaf Surfaces. Agronomy 2020, 10, 747. [Google Scholar] [CrossRef]
  24. Aytoua, M.; Bartolo, D.; Wegdam, G.; Bonn, D.; Rafaï, S. Impact dynamics of surfactant laden drops: Dynamic surface tension effects. Exp. Fluids 2010, 48, 49–57. [Google Scholar] [CrossRef] [Green Version]
  25. Gatne, K.P.; Jog, M.A.; Manglik, R.M. Surfactant-induced modification of low Weber number droplet impact dynamics. Langmuir 2009, 25, 8122–8130. [Google Scholar] [CrossRef] [PubMed]
  26. Weimin, D.; Siqi, Z.; Sanqin, Z.; Jiabing, G.; Wei, Q.; Binbin, G. Measurement methods of fruit tree canopy volume based on machine vision. Trans. Chin. Soc. Agric. Mach. 2016, 47, 1–10. (In Chinese) [Google Scholar]
Figure 1. Self-developed axial-flow air-assisted platform: (1) axial fan; (2) nozzle; (3) power supply; (4) pump; (5) manometer; (6) frequency converter; (7) fan switch; (8) button; (9) flow meter.
Agriculture 12 01093 g001
Figure 2. Test site for droplet retention on individual leaves.
Agriculture 12 01093 g002
Figure 3. Display of the self-created axial-flow air-assisted sprayer: (1) vehicle platform; (2) pesticide box; (3) electric motor; (4) liquid pump; (5) axial-flow fan; (6) ring-like nozzle group; (7) adjustable profile strut; (8) control cabinet; (9) gasoline generator.
Agriculture 12 01093 g003
Figure 4. Cubic frame schematic diagram.
Agriculture 12 01093 g004
Figure 5. Layout of droplet collection points.
Agriculture 12 01093 g005
Figure 6. (a) Patterns of RPAL against spray volume under various leaf inclination angles; (b) maximum RPAL against leaf inclination angle.
Agriculture 12 01093 g006
Figure 7. Effect of droplet deposition for different Weber numbers: (a) We = 188.5; (b) We = 144.3; (c) We = 84.3; (d) We = 62.1.
Agriculture 12 01093 g007
Figure 8. Relationship between surface tension of liquid and droplet retention for litchi leaves.
Agriculture 12 01093 g008
Figure 9. Effect of airflow velocity on RPAL: (a) RPAL against spray volume under different airflow velocity; (b) relationship between airflow velocity and RPALmax.
Agriculture 12 01093 g009
Figure 10. Effect of leaf type on droplet deposition under different spray volumes.
Agriculture 12 01093 g010
Figure 11. Variation in the airflow velocity under different fan frequencies and airflow delivery distances.
Agriculture 12 01093 g011
Figure 12. Canopy airflow attenuation characteristics for different leaf area volume densities.
Agriculture 12 01093 g012aAgriculture 12 01093 g012b
Figure 13. The canopy droplet deposition retention under different airflow velocity.
Agriculture 12 01093 g013
Figure 14. The canopy droplet deposition volume under different FAVDs.
Agriculture 12 01093 g014
Figure 15. The canopy droplet deposition volume under different liquid surface tensions.
Agriculture 12 01093 g015
Table 1. The roughness factors for different leaf types.
Leaf Type
LitchiLonganHoneysuckleGuavaCitrus
Roughness factor1.17 ± 0.04 b1.15 ± 0.03 b1.44 ± 0.06 b1.32 ± 0.06 a1.13 ± 0.06 b
Note: a indicate significant differences (p < 0.01). b indicate significant differences (p < 0.05).
Table 2. The roughness factors for different leaf types.
Concentration (%)Surface Tension (mN/m)Concentration (%)Surface Tension (mN/m)
1021.290.0530.63
521.330.0131.48
2.522.060.00536.53
124.690.00152.47
0.524.680.000560.64
0.130.61Water72.70
Table 3. The roughness factors for different leaf types.
Concentration (%)Viscosity Values
(mPa · s)
Concentration (%)Viscosity Values
(mPa · s)
1%1.1970.005%1.033
0.5%1.1870.001%1.033
0.1%1.147water1.017
Table 4. Factors and parameters of the spray deposition experiment.
Experimental FactorsParameters
Leaf typeLitchi, Longan, Honeysuckle, Guava
Leaf inclination angle (°)0, 30, 45, 60, 75
Surface tension of liquid (mN/m)24.69 (1%), 30.61 (0.1%), 52.47 (0.001%), 72.7 (0%)
Airflow velocity (m/s)2.9 (35 Hz), 3.34 (40 Hz), 3.98 (45 Hz)
Table 5. Orthogonal test factors and levels.
LevelFactor
A (Leaf Inclination Angle, °)B (Airflow Velocity, m/s)C (Roughness Factor)D (Surface Tension of Liquid, mN/m)
1151.31.17 (Litchi)24.69 (1%)
2452.61.32 (Guava)30.61 (0.1%)
3753.91.44 (Honeysuckle)36.53 (0.005%)
Table 6. Measured canopy parameters.
A (Different Kinds of Canopies)B (FAVD) (m−1)
Citrus4.38
Longan5.83
Litchi2.57
Guava3.51
Table 7. Factors and corresponding parameters for conducting experiment of droplet attenuation in canopies.
FactorsParameters
Airflow velocity (m/s)3.49 (15 Hz), 7.18 (30 Hz), 10.09 (45 Hz), 15.42 (60 Hz)
FAVD (m−1)2.57, 3.51, 4.38, 5.83
Surface tension of liquid (mN/m)24.68 (1%), 30.61 (0.1%), 52.47 (0.001%), 72.7 (0%)
Table 8. Orthogonal test factors and levels.
LevelFactor
A (Airflow Velocity, m/s)B (FAVD, m−1)C (Canopy Depth, cm)
13.49 (15 Hz)2.570
27.18 (30 Hz)3.5120
310.09 (45 Hz)4.3840
415.42 (60 Hz)5.8360
Table 9. Fluid parameters.
Concentration (%) D 0 (mm) ρ   ( k g · m 1 ) γ   ( mN · m 1 ) W e
01.9799572.762.1
0.001%1.9399552.4784.3
0.1%1.89101530.61144.3
1%1.88107524.69188.5
Table 10. Four factors and four levels orthogonal experiment results.
No.A (Leaf Inclination Angle, °)B (Airflow Velocity, m/s)C (Roughness Factor)D (Surface Tension of Liquid, mN/m) RPALmax
175.003.91.32 (guava)24.69 (1%)0.6280
215.003.91.44 (honeysuckle)30.61 (0.1%)0.6855
375.002.61.17 (litchi)30.61 (0.1%)0.7281
445.002.61.44 (honeysuckle)24.69 (1%)0.4444
515.002.61.32 (guava)36.53 (0.005%)0.9320
675.001.31.44 (honeysuckle)36.53 (0.005%)0.7895
715.001.31.17 (litchi)24.69 (1%)0.6935
845.003.91.17 (litchi)36.53 (0.005%)0.5329
945.001.31.32 (guava)30.61 (0.1%)0.8660
Table 11. Analysis of variance for orthogonal experiment.
Source of VariationSum of SquaresDegree of Freedom Mean Square F-Value
Leaf inclination angle0.08120.04142.73
Airflow velocity0.08920.04446.714
Leaf type0.10420.05254.415
Surface tension of liquid0.11220.05658.805
Repetitive error 0.00990.001
Total variation 8.6918
Table 12. Calculation results of the droplet penetration ratio in the canopy.
FAVD (m−1)
2.573.514.385.83
Close-distance layer100%100%100%100%
Middle-distance layer69.96%65.33%41.80%29.85%
Far-distance layer21.32%12.62%17.95%10.28%
Table 13. Calculation results of the droplet penetration ratio in the canopy.
Liquid Surface Tension (mN/m)
24.6930.6152.4772.70
Close-distance layer100%100%100%100%
Middle-distance layer26.63%27.77%31.72%29.85%
Far-distance layer11.46%12.16%9.58%10.28%
Table 14. The results of three-factor and four-level orthogonal experiment.
No.ABCDroplet Penetration Ratio (%)
13.492.570100
23.493.512056.33
33.494.384012.93
43.495.83603.75
57.182.572055.36
67.183.510100
77.184.38607.09
87.185.83409.35
910.092.574033.32
1010.093.516012.49
1110.094.380100
1210.095.832046.93
1315.422.576015.17
1415.423.514021.86
1515.424.382058.05
1615.425.830100
Table 15. Comparison table of experiment results and predicted values.
NumberLAD (m−1)Average Leaf Inclination (°)Canopy Volume (m3)Predicted (g)Actual (g)Relative Error
(%)
14.3846.71.20782.9872.8113.97
23.5153.40.94280.4675.366.77
32.5758.41.53992.3273.2426.05
Average3.4952.81.22985.2573.8015.60
Publisher’s Note: MDPI stays neutral with regard to jurisdictional claims in published maps and institutional affiliations.

