Article

Stoichiometric Ratios of Carbon, Nitrogen and Phosphorus of Shrub Organs Vary with Mycorrhizal Type

1
School of Agriculture, Henan University of Science and Technology, Luoyang 471023, China
2
Luoyang Key Laboratory of Symbiotic Microorganism and Green Development, Luoyang 471023, China
3
Henan Engineering Research Center of Human Settlements, Luoyang 471023, China
*
Author to whom correspondence should be addressed.
Agriculture 2022, 12(7), 1061; https://doi.org/10.3390/agriculture12071061
Submission received: 5 July 2022 / Revised: 16 July 2022 / Accepted: 19 July 2022 / Published: 20 July 2022
(This article belongs to the Section Agricultural Soils)

Abstract

:
Mycorrhizal types are a predictive framework for nutrient cycling within and across ecosystems, and their types represent different nutrient-acquisition strategies for plants. Carbon (C), nitrogen (N) and phosphorus (P) stoichiometric ratios are essential for understanding biogeochemical processes. The purpose of this study was to reflect the balance in the process of plant resource acquisition by exploring the C, N and P stoichiometric ratios (C/N, N/P, and C/P) in shrub organs in different mycorrhizal types. In this study, the C, N, and P stoichiometric ratios in leaves, stems and roots were analyzed in the types of arbuscular mycorrhizal (AM), ectomycorrhizal (ECM) and AM + ECM of shrubs in Northern China. The results showed that C/N in the stems and roots of AM plants (95.75 and 81.42) was significantly lower than in AM + ECM plants (109.89 and 102.37) and ECM plants (107.67 and 96.93), while both N/P and C/P in the leaves, stems and roots of AM shrubs (38.67, 36.17, 40.69; 1028.14, 2989.13, and 2659.18) were significantly higher than in ECM shrubs (30.52, 22.31, 20.47; 796.51, 2208.28, and 1714.95). Moreover, different elements among the same plant organs were closely correlated, and the same pattern was found among the same element ratios among different plant organs. This suggests that mycorrhizal type can influence C, N and P ratios among different organs.

1. Introduction

Carbon (C), nitrogen (N) and phosphorus (P) are the three essential elements for life on Earth [1]—they are the building blocks of organisms [2,3], and they are involved in the processes of plant development, photosynthesis and apoplastic breakdown [4]. As the essential elements needed for plant growth and development, C, N and P also play a crucial role in regulating and driving the succession process of different types of plants [5,6]. Ecological stoichiometry is an important framework for elemental balance and material cycling through elemental ratios in ecosystems [7]. Ecological stoichiometry is a valuable method for examining the concentration and distribution of C, N and P in plants and is crucial for the biogeochemical cycling of ecosystems [8,9,10]. Plant ecological stoichiometry focuses on stoichiometric characteristics such as the concentration and ratio of chemical elements in plant organs [7], reveals the status of plant nutrient limitation at the population, community and ecosystem scales, and is also an important method for studying plant nutrient allocation [11]. The C:N:P ratio is commonly used for testing nutrient limitation and describing important ecological processes and the interactions of elements, and it is a useful tool for analyzing and interpreting changes and relationships between plants and their environment in ecosystems [12,13]. At the same time, it is of great value to study the C, N and P ratios of plants.
The ratio of plant C, N and P may reflect ecosystem structure and function at a macro level [14]. C/N and C/P of plants represent the relationship between biomass and nutrient ratios, while reflecting the relationship between plant growth rate and nutrient use efficiency [14]. Moreover, the critical value of plant leaf N/P is an indicator of the nutrient supply status of the soil to the plant [15]. Variations in C/N and C/P affect carbon fixation and consumption in different ecosystems, so both ratios are important indicators for assessing the use efficiency of nitrogen or phosphorus. In addition to this, N/P is a valid indicator of plant growth limitation by nitrogen or phosphorus in the soil [16]. Previous studies on the ratio of carbon, nitrogen and phosphorus in plants mostly focused on plant age and growing season. For example, Yang and Luo (2011) [8] found that the C/N of plant parts in forest ecosystems increased significantly with increasing stand age; and Ågren (2008) [17] found that there was an increase in C/N and C/P with plant growth during the growing season. The carbon, nitrogen and phosphorus stoichiometric ratios of plants in an ecosystem indicate the limiting status of nitrogen and phosphorus, and in turn affect the accumulation of carbon [18], and are an important aspect of research. C:N:P stoichiometry not only provides a means of characterizing vital biological processes in terrestrial ecosystems for detecting nutrient limitation [19], but also offers a critical theoretical framework in the exploration of the relationship between nutrient cycling and biofeedback [19]. Numerous studies have shown that C:N:P stoichiometry ratios may be influenced by abiotic factors such as temperature, altitude, precipitation and drought, as well as biotic factors such as species composition, life type and genotype [20]. Other than that, determining C, N, and P stoichiometry in different plant components is essential for understanding biogeochemical processes [21].
Nutrient effectiveness has a major role in ecosystem function and C, N, and P as essential nutrients are considered to be the primary source of mineral and organic nutrients for plants [3,22]. Since different plant organs play different roles in plant growth and have different requirements for different nutrients, the ratios of carbon, nitrogen and phosphorus in different organs should also be different [23,24]. Moreover, plants are able to coordinate the uptake and allocation of limited resources by various organs and their adaptation to environmental constraints [25]. The concentrations of C, N and P in different organs of plants and their ratios reflect the ecological strategies and adaptations of plants in response to environmental changes [26]. The C:N:P ratio among the organs (leaf, stem, and root) can indicate plant growth rate and physiological regulation in addition to nutrient effectiveness and nutrient limitation [27]. The plant body needs to distribute nutrients to different organs to meet the needs of a number of functions including growth, reproduction, nutrient storage and defense [24]. The distribution of nutrients includes the distribution of different nutrients within organs and the distribution of the same nutrients among organs [24]. Studies have previously shown that factors such as evolutionary history, environmental stress and plant functional groups can influence the nutritional relationships among different organs [21,25]. C, N and P stoichiometry in plant organs and the factors affecting them have become a hot topic in plant functional ecology [28]. Therefore, the study of stoichiometry ratios in organs is important for a comprehensive understanding of the growth mechanisms and strategies of plants in the scrubland. The ratio of nutrient concentration in different plant organs is closely related to their function, growth rate, life history and climate [29], but how does it relate to mycorrhizae?
Mycorrhiza, as a pervasive mutualistic symbiosis between plant roots and soil fungi, forms among the most important inter-biotic interactions [30]. By common knowledge, almost all plant species rely on symbiotic relationships with mycorrhizal fungi to promote their nutrient acquisition [31]. Various species have different types of mycorrhizae, and functional differences between arbuscular mycorrhizae (AM) and ectomycorrhizae (ECM) will lead to differences in nutrient among plants [32]. Arbuscular mycorrhizal fungi can connect neighboring plants and plant species by forming interconnected mycorrhizal networks [33]. Mycorrhizal fungi obtain the fixed carbon that is available from their photosynthetic hosts for the exchange of mineral nutrients such as phosphorus and nitrogen, which positively affects plant growth [34]. Stoichiometry can help further mycorrhizal science and contribute to the understanding of mycorrhizal function when assessing the effectiveness and allocation of carbon, nitrogen and phosphorus in plants, elucidating the competitive ability of mycorrhizal plants and the outcome of nutrient cycling in terrestrial ecosystems [35]. Shrubs are the dominant vegetation type in Northern China [24] and are characterized by high resilience, rapid growth and ease of management [36]. Compared with trees, shrubs are usually smaller and relatively more evenly sized among species, which contributes to weakening the “dilution effect” of N and P allocation to plants [21]. Therefore, in this study, shrub communities in Northern China were selected to research the stoichiometry ratios of C, N and P in leaves, stems and roots and to determine the influencing factors.

2. Materials and Methods

2.1. Study Site and Investigation

This study was conducted from July to September 2011 at longitudes of 86.7–132.8° E and latitudes of 33.7–52.4° N in Northern China. In this study, plants were divided into three mycorrhizal types AM, AM + ECM, and ECM. Mycorrhizal types of some plants were determined experimentally by this study, while others were determined from published studies according to the methods adopted by Averill et al. (2019) [37], Wang et al. (2006) [38] and Shi et al. (2020) [39]. Five hundred and two samples were obtained with definite mycorrhizal types, which were 337 (67.13%) in AM species, 67 (13.35%) in AM + ECM and 98 (19.52%) in ECM (Supplementary Data).
In this study, a 20 × 20 m plot with relatively uniform species composition and community structure was selected as the sample area to represent the shrub community at this site. All individuals were identified to the species level and we determined mycorrhizal types according to species. In total, we analyzed 502 individuals of 67 shrub species from 44 genera and 24 families from 149 sites. The shrub levels were determined according to the basal stem, plant height, growing environment and growing age of the shrubs, usually divided into three levels—large, medium and small—and then three individuals were selected for each level. We had at most 14 levels and at least one level. For each individual, we collected all its adult leaves capable of normal photosynthesis, all stems except the new stems of the current year, and whole roots of each individual outside and adjacent to the quadrate. The plant samples collected were dried and ground in the laboratory for the next step of analysis and determination. More information on data collection and sampling site locations are found in Yang et al. (2014) [24].

2.2. Determination of Carbon, Nitrogen and Phosphorus Concentrations

Carbon and nitrogen concentrations in plant samples were measured using an elemental analyzer (2400 II CHNS; Perkin-Elmer, Boston, MA, USA) under 950 °C for combustion and then reduced to 640 °C. The phosphorus concentrations in different shrub organs were analyzed using the molydate/ascorbic acid method after H2SO4-H2O2 digestion [40].

2.3. Data Analysis

In order to better represent the stoichiometric ratios of C, N, and P, the elemental concentrations of C, N, and P were converted to molar concentrations for ratio analysis in this study. Mean C/N, N/P and C/P for each mycorrhizal type were used to represent the elemental ratio in this mycorrhizal type, and 9999 permutations were performed for the ratio of different element in different mycorrhizal types. All analyses of significance were performed using SPSS 23.0 and R 4.0.5 (http://R-project.org/, accessed on 29 May 2022). Linear regression analysis was performed on different element concentrations among the same organs and the same element ratios among different organs in the shrubs and their standardized regression slopes and p values were calculated to determine the relationship between them. For the AM, AM + ECM and ECM mycorrhizal types, the effects of mycorrhiza type, latitude, and their interactions on nine categories (leaf C/N, leaf N/P, leaf C/P, stem C/N, stem N/P, stem C/P, root C/N, root N/P, and root C/P) were examined by linear mixed-effects models. Each category was treated as a response variable. Mycorrhiza type, latitude and their interaction were fixed effects. Species was considered a random effect. The analysis of linear mixed-effects models was conducted by R software (version 4.0.5).

3. Results

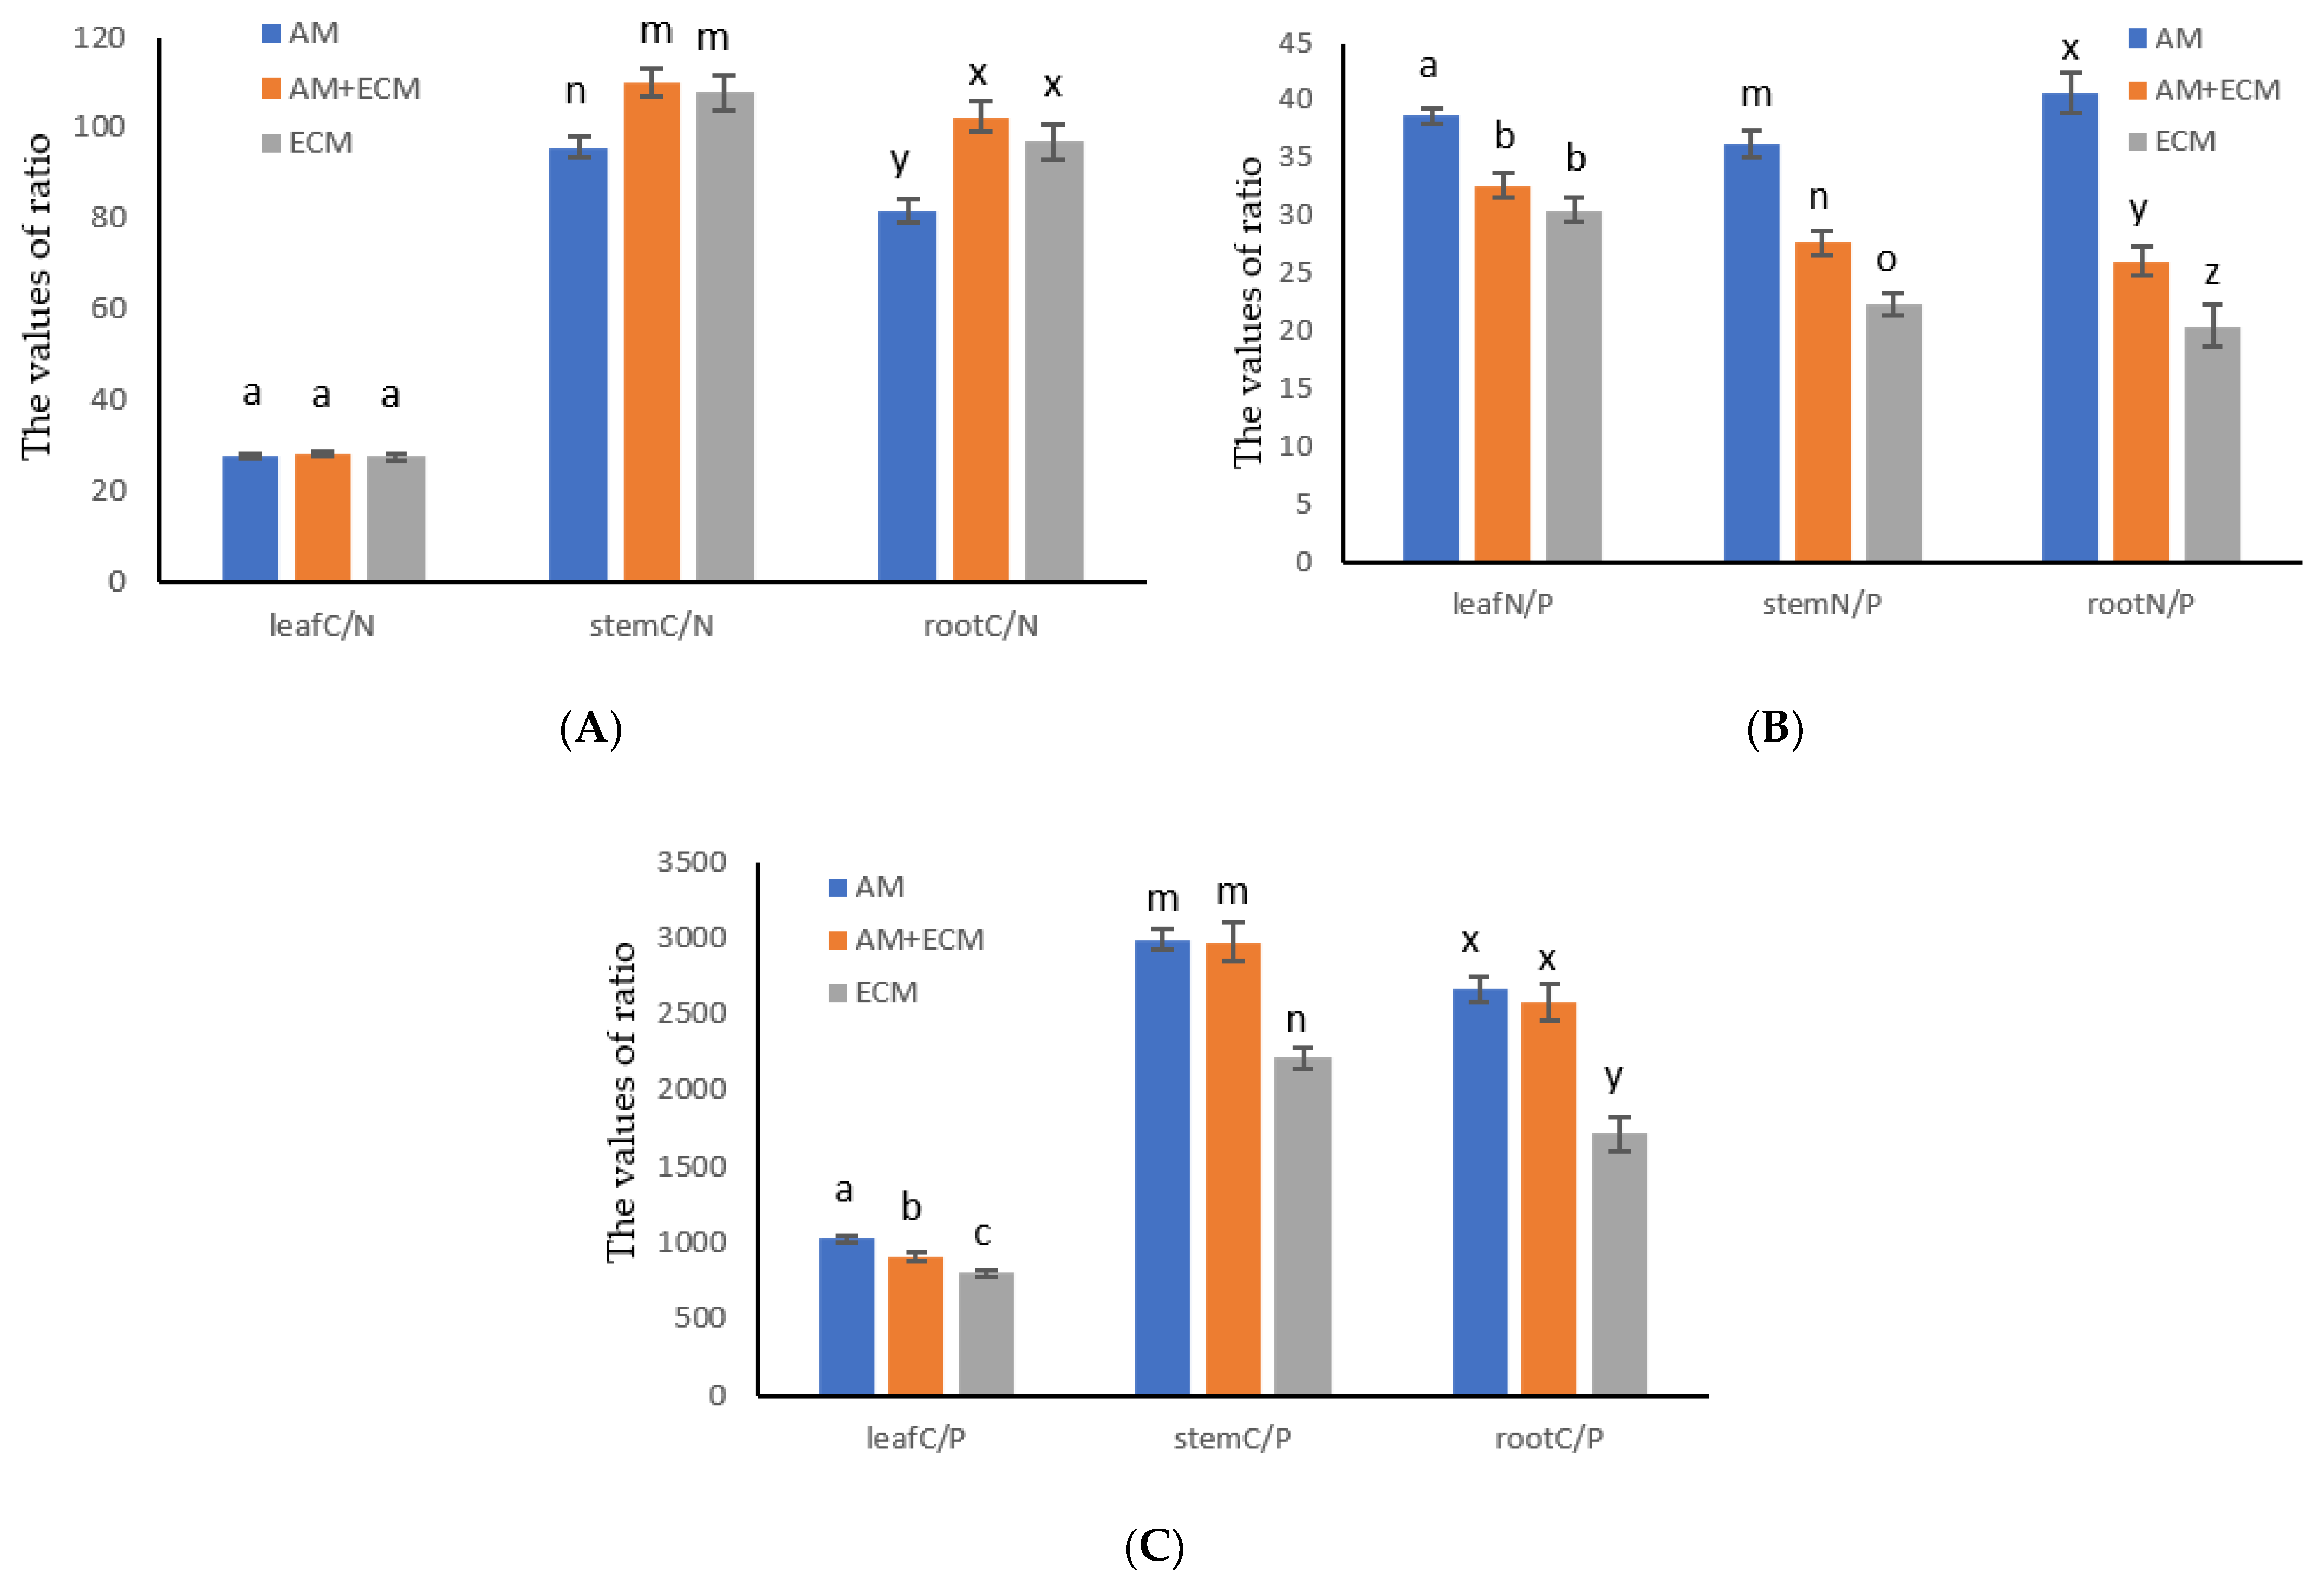
3.1. Elemental Concentration Ratios in Shrub Organs in Different Mycorrhizal Types

C/N varied for different mycorrhizal types among different shrub organs. C/N of leaves for AM, AM + ECM, and ECM were 27.42, 28.25 and 27.32, respectively, and no significant difference was found among the three (Figure 1A). Stem C/N of AM + ECM plants (109.89) and ECM (107.67) was significantly higher than stem C/N of AM plants (95.75). However, no remarkable difference was observed between AM + ECM and ECM on stem C/N. In the roots, AM + ECM (102.37) and ECM (96.93) were observed to have a significantly higher C/N than AM (81.42) (Figure 1A).
Leaf N/P was 38.67, 32.62 and 30.52 (Figure 1B) in AM, AM + ECM and ECM species, respectively. Additionally, the N/P in the stem and root was 36.17, 27.67 and 22.31 (Figure 1B), 40.69, 26.02 and 20.47 (Figure 1B), respectively. N/P of leaves, stems and roots in different mycorrhizal types of AM, AM + ECM and ECM presented a similar trend, with a significantly higher N/P in the AM species than in AM + ECM and ECM plants (Figure 1B). Moreover, AM + ECM had a significantly higher N/P than ECM in the stems and roots of the shrubs (Figure 1B).
Leaf C/P was 1028.14, 913.79 and 796.51 (Figure 1C), respectively, in AM, AM + ECM and ECM species. Additionally, it was significantly higher in AM plants than in AM + ECM plants, and significantly higher in AM + ECM plants than in ECM plants (Figure 1C). Stem C/P in AM, AM + ECM and ECM was 2989.13, 2971.51 and 2208.28, respectively, and the C/P in stems in ECM was significantly lower than that in AM and AM + ECM (Figure 1C). There was a similar trend in roots, for which the C/P was 2659.18, 2572.28 and 1714.95, respectively (Figure 1C).

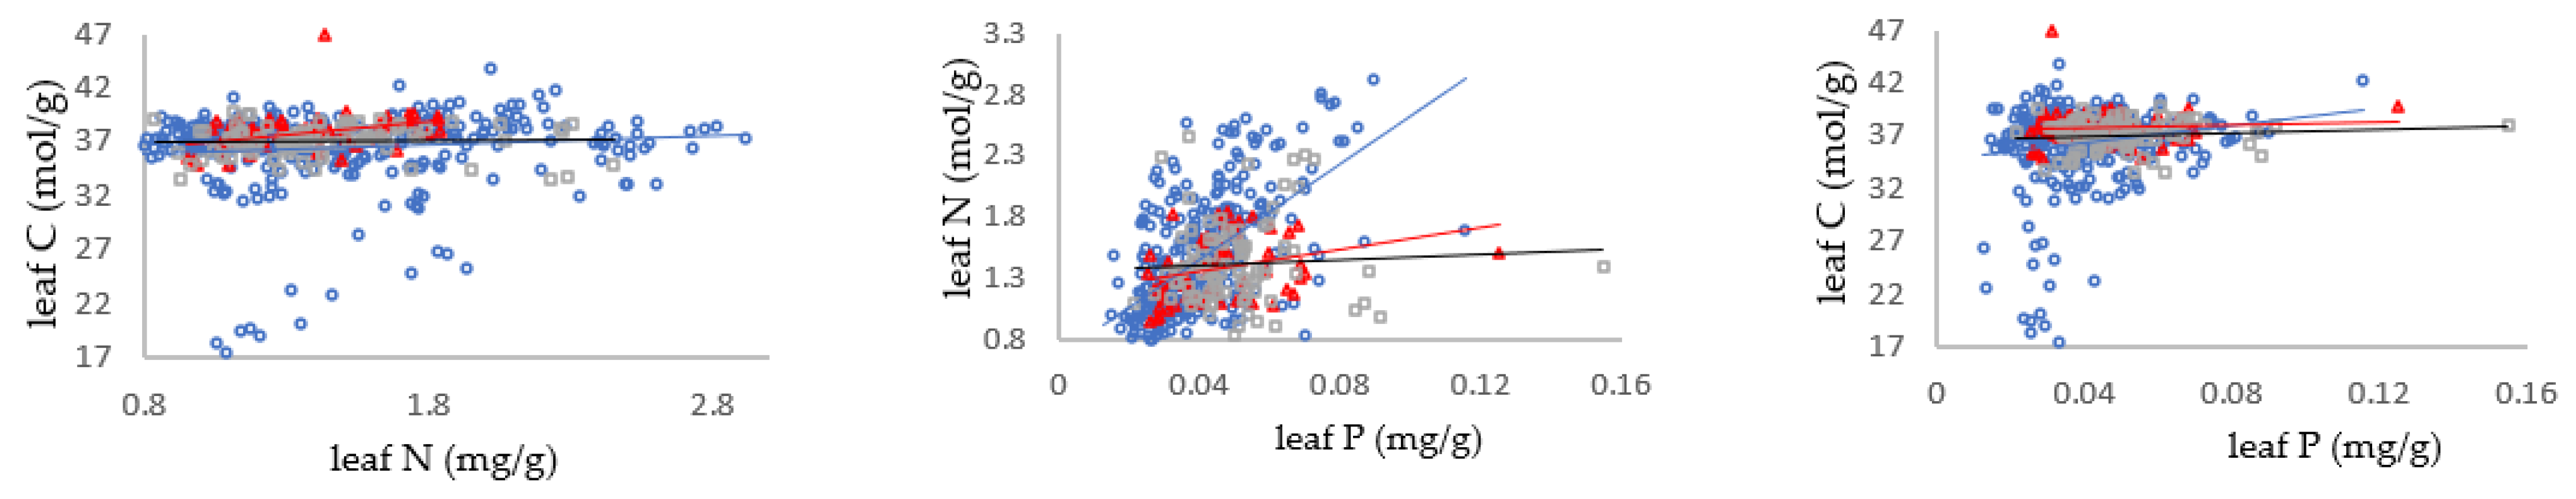
3.2. Relationship between Carbon, Nitrogen and Phosphorus in Different Mycorrhizal Types of Shrub Leaves

The relationship between the ratio of leaf carbon, nitrogen and phosphorus element concentrations in different mycorrhizal types was shown in Figure 2. The slope of the increasing trend of leaf C with increasing leaf N was 0.8384, 2.3619, and 0.0435 in AM, AM + ECM and ECM, respectively (Table S1). Based on the p-value of the slope, it is known that leaf C increased extremely significantly with increasing leaf N in AM + ECM species, while no significant pattern was found in AM and ECM plants (Figure 2, Table S1). The slope of leaf N/P was 19.394, 4.4693 and 1.1417 in AM, AM + ECM and ECM mycorrhizal-type plants, respectively, and was highly significant in AM plants and significant in AM + ECM plants, but no significance was observed for ECM plants (Figure 2, Table S1). The slopes of leaf C/P in different mycorrhizal types of AM, AM + ECM, and ECM were 42.145, 7.1678 and 8.0611, respectively. A strongly significant leaf C/P was observed only in AM plants (Figure 2, Table S1).
The slopes of C/N in the stems were 0.2719, 1.0278 and 0.2926 for the AM, AM + ECM and ECM mycorrhizal types, respectively, but none of them were significant (Figure 3, Table S2). In stems, plants with each of these three mycorrhizal types exhibited an extremely significant increase in nitrogen concentration with increasing phosphorus concentration, where the slopes of stem N/P were 14.933, 11.242, 11.303 in AM, AM + ECM, and ECM, respectively (Figure 3, Table S2). The opposite pattern was shown for C/P in the stem, which was that the carbon concentration in the stem gradually decreased as the phosphorus concentration in the stem increased, and this decreasing trend showed a strong significance in AM plants (Figure 3, Table S2).
In the roots of the shrubs, the slopes of C/N, N/P, and C/P of AM species were 0.6408, 12.028 and −31.841, respectively (Figure 4), where carbon concentration increased significantly with increasing nitrogen concentration and decreased highly significantly with increasing phosphorus concentration, and nitrogen concentration increased greatly with increasing phosphorus concentration (Table S3). For AM + ECM plants, C/N, N/P, and C/P in their roots were 3.1454, 2.8711 and −69.927, respectively, with C/P being extremely significant (Figure 4, Table S3). C/N, N/P, and C/P were not significant in the roots of ECM plants (Figure 4, Table S3).

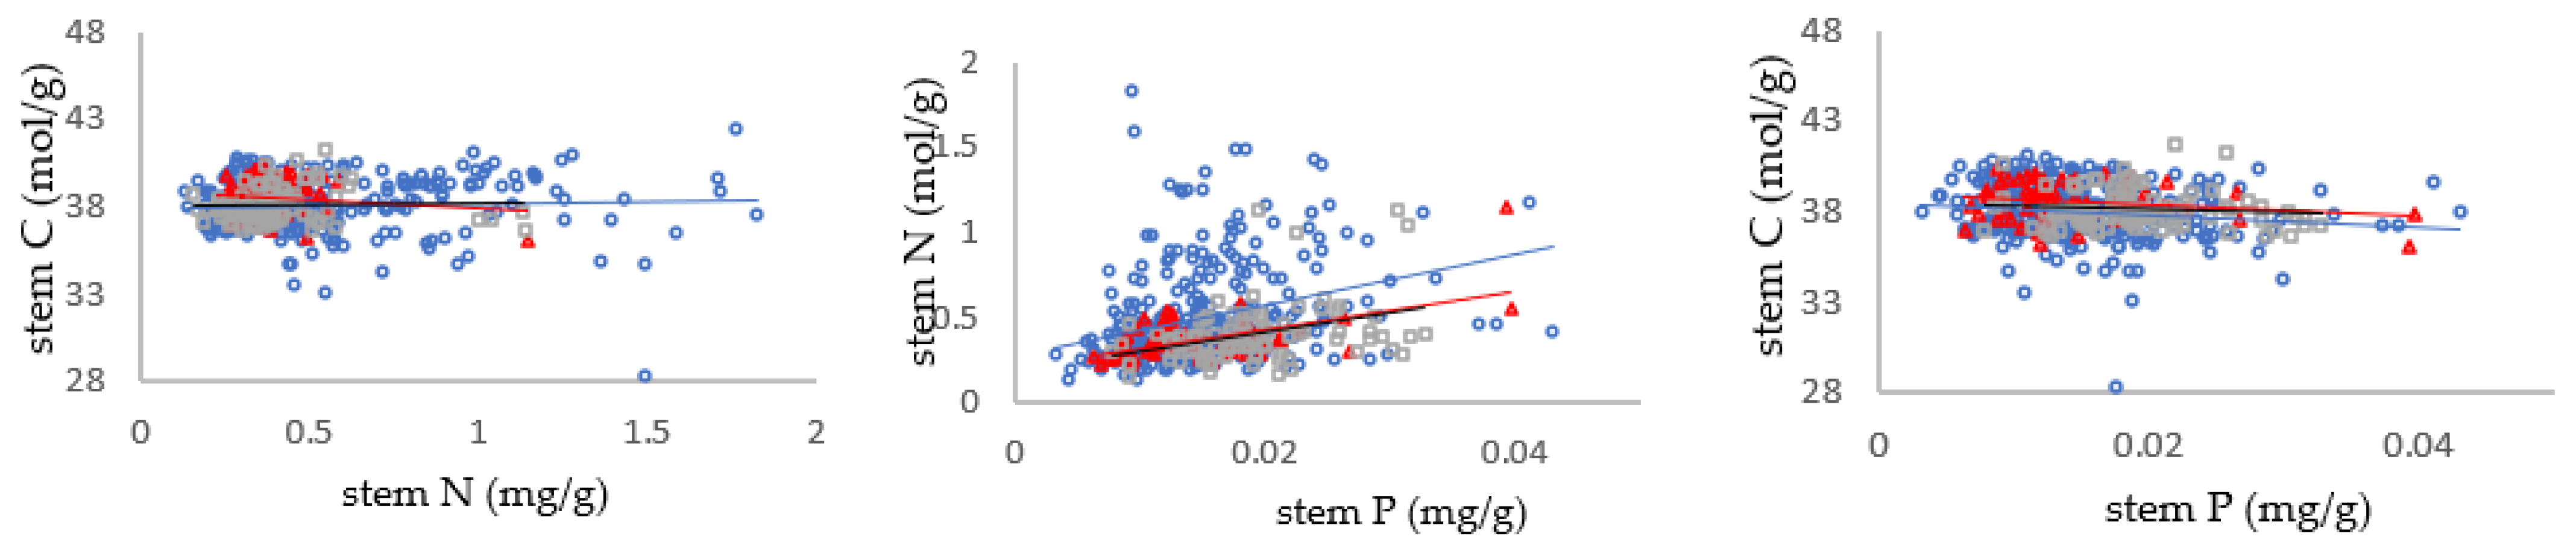
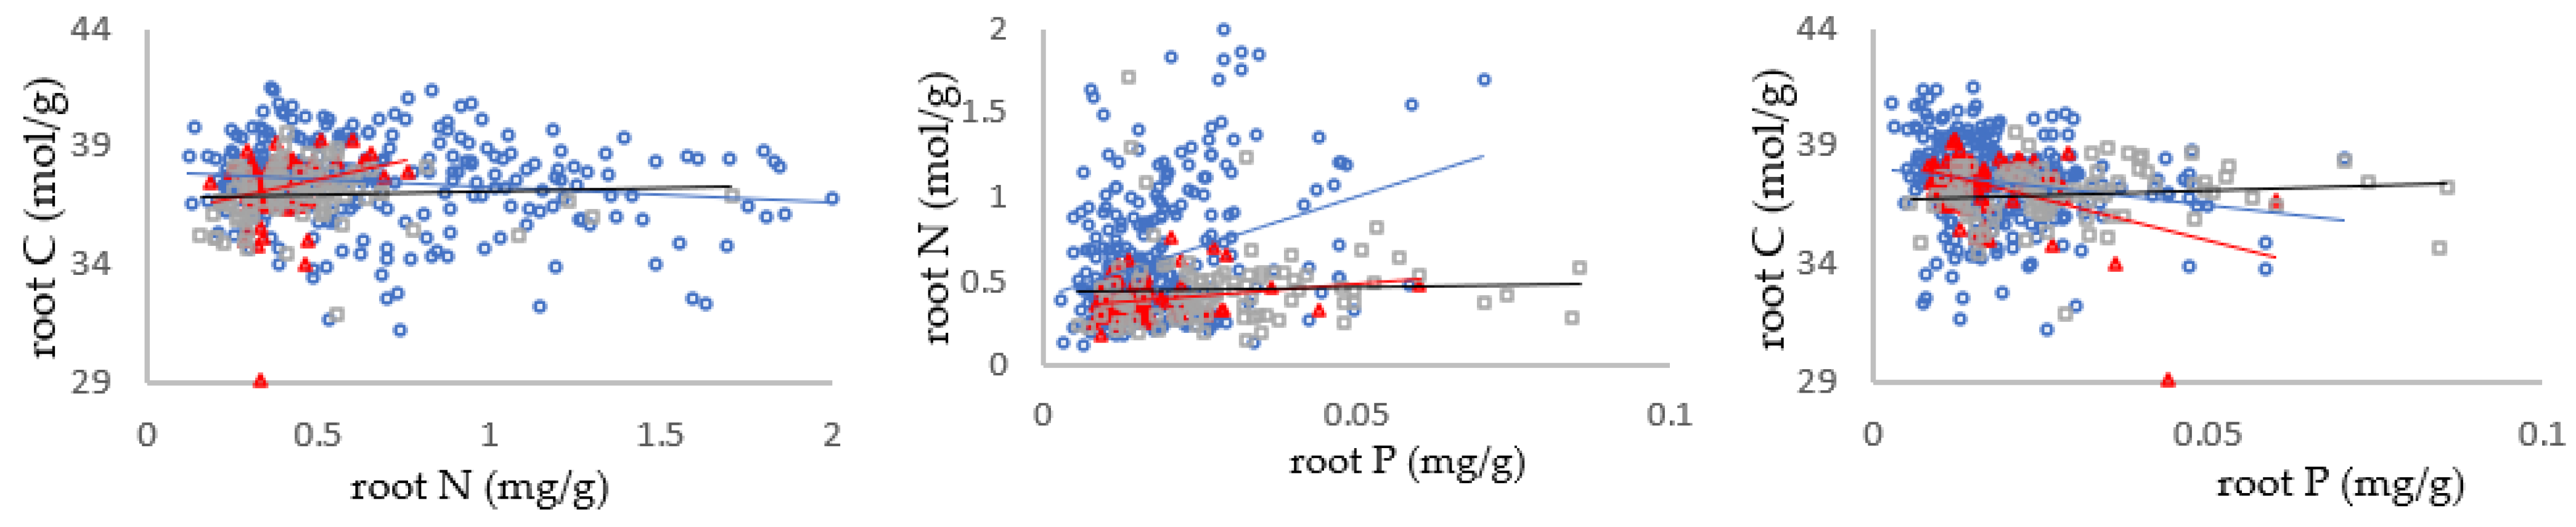
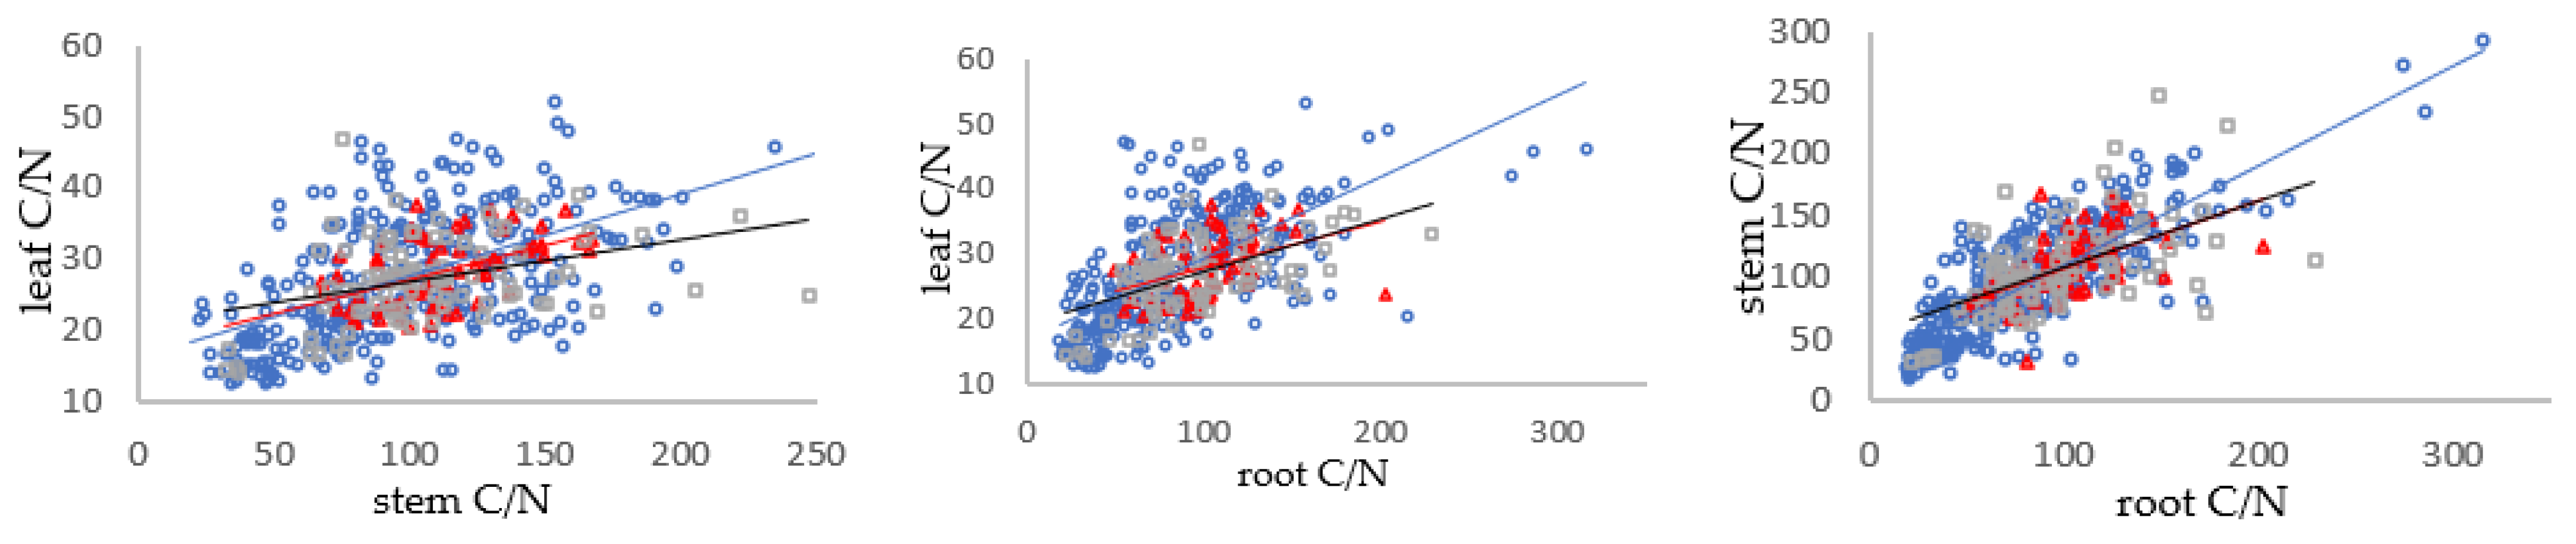
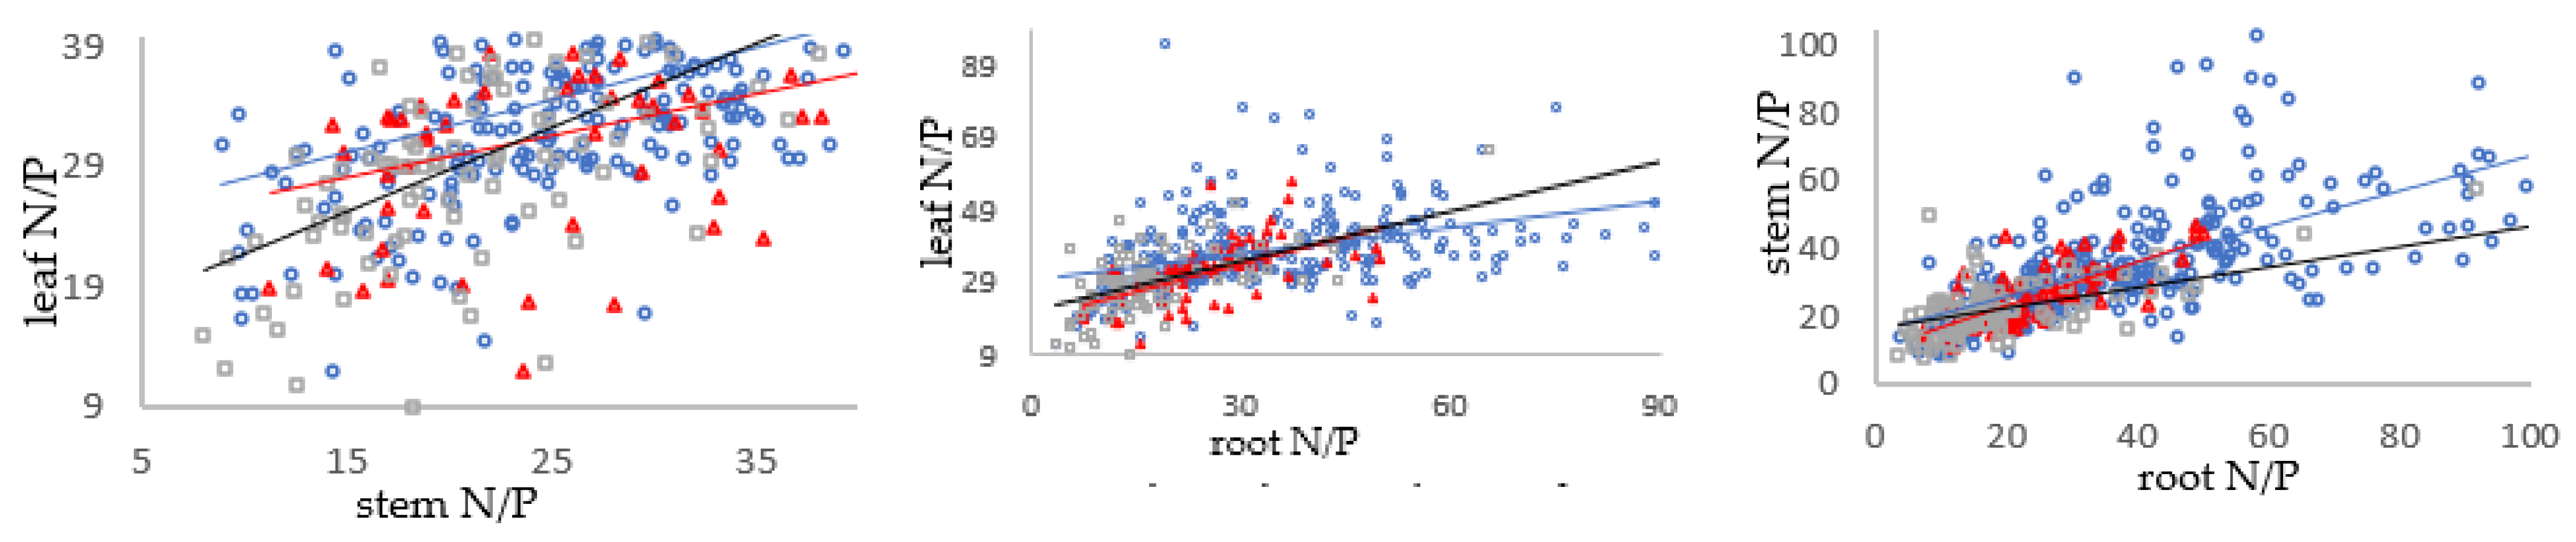
3.3. Relationships between C/N, N/P and C/P in Shrub Organs in Different Mycorrhizal Types

There were also relationships between different organs of the shrubs for C/N, N/P, and C/P (Figure 5, Figure 6 and Figure 7). The slope of the ratio of leaf C/N to stem C/N was 0.1141, 0.0959 and 0.0585 (Table S4), the slope of the ratio of leaf C/N to root C/N was 0.1246, 0.0696 and 0.0805, respectively (Table S4), and the slope of the ratio of stem C/N to root C/N was 0.8051, 0.5535 and 0.5313, respectively (Table S4), in AM, AM + ECM and ECM species. Moreover, the C/N ratio showed an extremely significant relationship among the leaves, stems and roots of the shrubs. This suggests that in AM, AM + ECM and ECM shrubs, leaf C/N increased with stem and root C/N, and at the same time stem C/N increased with root C/N (Figure 5).
We found the same trend in the ratio of N/P and C/P in different organs of the shrub (Figure 6 and Figure 7). For N/P, the slopes in the leaf/stem of AM, AM + ECM, and ECM were 0.4355, 0.3482, and 0.7012; the slopes in the leaf/root of AM, AM + ECM, and ECM were 0.2408, 0.5043, and 0.4527; and the slopes in the stem/root of AM, AM + ECM, and ECM were 0.5181, 0.6267, and 0.3000 (Table S5). Moreover, the extremely significant slope indicated that leaf N/P increased in a highly significant manner with the increase in stem N/P and root N/P, and stem N/P also showed a strongly significant increase with the increase in root N/P (Figure 6). In AM, AM + ECM, and ECM, the slopes of the ratios of leaf C/P and stem C/P were 0.0889, 0.1113, and 0.1143, respectively; the slopes of the ratios of leaf C/P and root C/P were 0.1001, 0.1272, and 0.0973, respectively; and the slopes of the ratios of stem C/P and root C/P were 0.4401, 0.6498, and 0.2709 (Table S6). Additionally, all these slopes showed great significance, which means a strongly significant increase in leaf C/P with increasing stem C/P and a very significant increase in both leaf C/P and stem C/P with increasing root C/P (Figure 7).
Linear mixed-effects model analyses confirmed that leaf N/P, leaf C/P, stem N/P, stem C/P, root C/N and root N/P in shrub organs varied with mycorrhiza type and stem C/N, stem N/P, stem C/P, root C/N and root N/P also varied with latitude. Additionally, significant interactions were observed between the two variables (except stem C/P and root C/P) (Table 1).

4. Discussion

Leaf C/N (AM: 27.42, AM + ECM: 28.25, and ECM: 27.32) was similar to the global value (27.77) and Chinese value (24.62) in different mycorrhizal types, leaf N/P (AM: 38.67, AM + ECM: 32.62, and ECM: 30.52) was also similar to the global value (30.56) and Chinese value (31.89), and leaf C/P (AM: 1028.14, AM + ECM: 913.79, and ECM: 796.51) was higher than the global value (777.32) [16,41]. C/N in shrub leaves in different mycorrhizal types was lower than that of Chinese dryland plants (29.4) [42]. N/P and C/P of AM shrub leaves were higher than those of Chinese dryland plants (36.09 and 997.17), while N/P and C/P of AM + ECM shrub leaves were lower than those of Chinese dryland plants [42]. C/N and C/P in stems of AM, AM + ECM and ECM shrubs were higher than those in stems of Chinese dryland plants. AM shrubs had higher stem N/P than Chinese dryland plants, while AM + ECM and ECM shrubs had the opposite [42]. C/N, N/P and C/P in roots had the same pattern in stems of different mycorrhizal types of shrubs in Northern China compared with Chinese dryland plants [42]. This study showed that leaf C/N, N/P, and C/P of AM plants in shrubs in Northern China were 27.42, 38.67, and 1028.14 greater than those of herbaceous plants (16.05, 38.31 and 583.60) [43], respectively, and the C/N and C/P of AM + ECM leaves (28.25 and 913.79) were also greater than those of herbaceous plants, and the C/N and C/P of ECM plant leaves (27.32, 769.51) were also greater than those of herbaceous plants. This may be related to the lower leaf carbon concentration of herbaceous plants [43]. Fast-growing plants typically have lower C/N and C/P than slow-growing plants [17]. It has been shown that herbaceous plants exhibit lower C/N and C/P than shrubs and trees, which is related to their ability to develop more quickly [35,44]. Therefore, inconsistencies between this and other studies may be the result of variations in the geographic scope of sampling, the type of plant being studied, or the plant organ in question.
Various plant organs have various physiological functions, which inevitably lead to different ratios of element concentrations in different organs [17,41]. In our study, the C/N and C/P in the leaves of the shrubs were lower than that in the root, which is in agreement with the findings of Zou et al. (2021) [45] in karst shrubs. Additionally, our results showed that leaves had lower C/N and C/P than stems, which is in agreement with the results of Yang et al. (2016) [46] in Lucerne; this may be related to more C accumulation in stems. N/P in the leaves was greater than in the stems, which was related to the fact that more N was accumulated in the leaves. N/P is more strongly correlated with N than with P [47]. Since the leaf is the major organ of plant assimilation and metabolism, the plant allocates more nitrogen to it for synthesis of enzymes, transport of proteins and amino acids, to take part in metabolic activities such as photosynthesis and respiration [48]. Overall, differences in plant carbon, nitrogen and phosphorus stoichiometric ratios among different organs may be attributed to differences in organ structure and physiology.
The results of this study showed no significant difference in leaf C/N among the different mycorrhizal types. This indicated that mycorrhizal type had less of an effect on C/N in leaves and also suggested that the leaves of shrubs maintained their relative stability in terms of C/N. This result supported the dynamic equilibrium theory and characterized the important role of plants in regulating leaf C/N stability by themselves [7]. This is different from other studies where C/N was higher in ECM leaves than in AM leaves [49,50]; this difference may be caused by differences in study sites, vegetation types, species, etc. However, in stems and roots, the C/N in AM + ECM and ECM was significantly higher than that in AM. C/N of the plant is a tangible indicator of the growth rate [17]. Therefore, the lower stem and root C/N of AM species indicated that AM shrubs grew faster than ECM shrubs, which was closely related to the rapid nutrient cycling of AM species [51].
C/P can be used to evaluate the P use efficiency and the response of plants to P assimilation, since the C/P ratio has a positive correlation with plant P use efficiency and a negative correlation with plant growth rate [52]. In our study, AM plants had a higher C/P than the plants of the other two mycorrhizal types, indicating that AM shrubs had the highest efficiency of P utilization and the lowest growth rate. ECM plants had the lowest C/P among the leaves, stems, and roots of the shrubs, suggesting that ECM mycorrhizal colonization can improve the P status of the plants. This is in stark contrast to the results of other studies showing relatively low C/P with arbuscular mycorrhizal species [49,53]. Carbon acquisition depends greatly on the availability of nitrogen and phosphorus. It has been shown that C/N and C/P is more susceptible to the control of N and P and not of C [47]. Carbon concentration in plant leaves, stems and roots is known to be fairly constant across plant organs, plant species. Thus, changes in C/N and C/P ratios are driven to a greater extent by changes in N and P concentrations [2,54]. This came down to the fact that ECM shrubs have higher phosphorus concentrations compared to AM shrubs, which can be attributed to several reasons. First, compared to the predominantly negative feedback in AM, ECM typically shows positive plant–soil feedback [55], and thus ECM plants can promote phosphorus accumulation in plants by promoting plant growth. Second, in theory, ECM symbiotic evolution may result in the evolution of fungal phosphorus uptake characteristics, and the phosphorus acquisition characteristics of ECM can be improved following this symbiotic evolution [56].
Nitrogen and phosphorus are generally regarded as the most limiting elements of terrestrial vegetation [57], and their concentrations will limit the growth and development of plants in terrestrial ecosystems and are susceptible to abiotic factors [45]. The concentrations and ratios of elements in different organs have different effects. Leaf nitrogen and phosphorus have important roles in plant metabolism, stems serve as storage organs for nitrogen and phosphorus, and roots take up nutrients and water [40]. N/P of leaves in different mycorrhizal types in this study was higher than that in East Asian shrub communities [58]; this shows that N/P can be affected by geographical location. Research showed that the leaves require sufficient nitrogen and phosphorus to synthesize various enzymes for biochemical reactions, the stems are also rich in nitrogen and phosphorus, and the roots require sufficient nitrogen and phosphorus to support metabolism [59]. Ågren (2004) [60] showed that the lower the N/P, in turn, the higher the growth rate. In our study, AM plants had a significantly higher N/P than AM + ECM and ECM plants in different shrub organs (leaves, stems and roots), indicating that AM plants have higher growth rates. Leaf N/P can be used to determine the potential nitrogen and phosphorus limitation in plants. In general, plant growth is more susceptible to N limitation when leaf N/P is less than 14, and is more susceptible to P limitation when N/P is greater than 16, while N/P between 14 and 16 means that N and P are equally limiting to plant growth [61]. Since the ratios here are in units of concentration, after converting the units of N and P used in this study from mol/g to mg/g, we found that leaf N/P was greater than 16 for AM plants (17.46), between 14 and 16 for AM + ECM plants (14.73), and less than 14 for ECM plants (13.78), indicating that AM species are more susceptible to phosphorus limitation and ECM shrub species are more susceptible to nitrogen limitation. This suggests that the nutrient limitation of the plant can be affected by the mycorrhizal type. Normally, it is the most active organs that require the highest levels of essential elements (e.g., nitrogen and phosphorus). Therefore, the more active organs will have a higher N/P stoichiometric homeostasis [35]. AM mycorrhizae had a more significant positive effect on N/P and C/P in leaves, stems and roots of shrubs than ECM mycorrhizae, which is in agreement with our previous study that ECM mycorrhizae were most effective in promoting phosphorus absorption in shrub organs [62]. Plant stoichiometry of nitrogen and phosphorus may also be influenced by various environmental factors such as temperature and rainfall. The C:N:P stoichiometric ratio of plants may also be influenced by soil nutrient conditions.
There was a significant relationship among carbon, nitrogen and phosphorus concentrations within the same plant organ, as well as nutrient ratios (C/N, C/P and N/P) in all paired organs, and the same findings were also found in the studies of Ma et al. (2019) [63], and Yuan et al. (2011) [64]. There was a significant relationship among carbon, nitrogen and phosphorus of AM species in all shrub organs (leaves, stems and roots) (except leaf C and N and stem C and N). The opposite phenomenon is that there is no some relationship between carbon, nitrogen and phosphorus in the different organs of ECM species (except between stem N and P). This indicates that the AM mycorrhizal type is beneficial in promoting the relationship between different nutrients among the same organs of the shrubs, especially for elements in the leaves and roots of the shrub. This may be related, on the one hand, to the fact that AM can form symbiotic relationships with most (71%) of the vascular plants in terrestrial ecosystems [65], and on the other hand to the fact that symbiotic relationships between AM fungi and plants can facilitate nutrient uptake by host plants [49]. The strong relationship between carbon, nitrogen and phosphorus in each plant organ probably comes from the most basic biochemical processes and metabolic activities common to land plants such as photosynthesis and respiration. Our observations revealed the same elemental ratios (C/N, N/P, and C/P) in whether the AM, AM + ECM or ECM mycorrhizal types showed significant relationships in different organs of the shrubs. Our previous study also found strong relationships among the same elemental concentrations (C, N, and P) in different organs [62]. Previous studies have shown that significantly different N and P stoichiometry existed in different organs within the same plant, while N and P concentrations in leaves, stems and roots remained related [64]. The nutritional properties of different organs of plants may be limited by their evolutionary history and may exhibit similar physiological interactions of organs. This strong relationship is inextricably linked to the strong relationship between the above- and belowground organs of the plant. Due to the close association between plant parts, nutrient assimilation between aboveground and belowground parts is closely related, and nutrient concentrations between leaves and roots are usually positively correlated [24], which is also highly consistent with our findings. To be specific, increases in nutrients in the nutrient-rich aboveground organs (leaves) are often accompanied by significant increases in nutrients in the belowground organs (roots) [63]. Leaves usually exhibit relatively high photosynthetic and metabolic activity, requiring more investment in roots to maintain nutrient uptake by roots. The increased nutrient concentrations of structural organs (roots and stems) may imply an increased rate of nutrient cycling in the bast, which leads to an efficient export of photosynthetic products and bast loading within the plant. Additionally, climate is a factor that affects elemental ratios among organs, and climate can influence soil factors directly or indirectly through improved plant–soil feedback responses [66] and further regulate changes in plant nutrient concentrations and the ratio among organs.
The results of the linear mixed-effects model indicated that the ratios of elements in plant leaves, stems and roots were influenced by the mycorrhizal type, latitude and the interaction between the two. This correctly confirmed the differences in the proportions of elements in the organs of different mycorrhizal types of shrubs. Previous studies have also shown the relationship between elemental ratios and latitude [67]—both C/P and N/P in different organs of the plant decreased significantly with the increasing of latitude, while C/N did not show a significant trend with latitude [59]. This may be due to the different soil nutrient status, shrub type and moisture limitation status at different latitudes. This also suggests that phosphorus is more constrained by environmental conditions in terrestrial ecosystems; and in addition, it has been shown that this constraining effect is stronger in active organs such as leaves and roots [59]. This is worthy of further in-depth study.

5. Conclusions

In the stems and roots of the shrubs, AM + ECM plants and ECM plants had a significantly higher C/N than AM plants. AM has a more positive effect on N/P and C/P in leaves, stems and roots of shrubs than ECM. The different nutrients in the same organs of the shrubs and the ratios of the same nutrients in different organs of the shrubs are strongly related and are not independent. In conclusion, these findings will provide some new insights into the role of C:N:P stoichiometry limiting strategies in plants and improve our understanding of ecological processes in shrubs in Northern China.

Supplementary Materials

The following supporting information can be downloaded at: https://www.mdpi.com/article/10.3390/agriculture12071061/s1, Table S1: The slope of the ratio of C, N, and P in leaves for different mycorrhizal types; Table S2: The slope of the ratio of C, N, and P in stems for different mycorrhizal types; Table S3: The slope of the ratio of C, N, and P in roots for different mycorrhizal types; Table S4: The slope of the carbon to nitrogen ratio in different organs for different mycorrhizal types; Table S5: The slope of the nitrogen to phosphorus ratio in different organs for different mycorrhizal types; Table S6: The slope of the carbon to phosphorus ratio in different organs for different mycorrhizal types. Supplementary Data: Five hundred and two samples were obtained with definite mycorrhizal types, which were 337 (67.13%) in AM species, 67 (13.35%) in AM + ECM and 98 (19.52%) in ECM.

Author Contributions

Conceptualization, S.Y. and Z.S.; methodology, S.Y.; software, S.Y.; validation, S.Y. and Z.S.; investigation, Z.S.; resources, S.Y., Z.S., Y.S., X.W. (Xiaohui Wang), W.Y., J.G. and X.W. (Xugang Wang); data curation, Z.S.; writing—original draft preparation, S.Y.; writing—review and editing, S.Y. and Z.S.; visualization, S.Y. and Z.S.; supervision, Z.S.; project administration, Z.S.; funding acquisition, Z.S. All authors have read and agreed to the published version of the manuscript.

Funding

This research was funded by NSFC (32171620 and 31670499), Student Research Training Program of Henan University of Science and Technology (2022461).

Institutional Review Board Statement

Not applicable.

Informed Consent Statement

Not applicable.

Data Availability Statement

The data presented in this study are available in Supplementary Materials.

Conflicts of Interest

The authors declare that they have no conflict of interest.

References

  1. Chen, J.R.; Wang, G.L.; Meng, M.; Wang, R.C. Effects of drought stress on the stoichiometric characteristics in different organs of three shrub species. Chin. J. Appl. Ecol. 2021, 32, 73–81. [Google Scholar]
  2. Huang, D.; Wang, D.M.; Ren, Y. Using leaf nutrient stoichiometry as an indicator of flood tolerance and eutrophication in the riparian zone of the Lijang River. Ecol. Indic. 2019, 98, 821–829. [Google Scholar] [CrossRef]
  3. Wang, J.L.; Chen, G.F.; Zou, G.Y.; Song, X.F.; Liu, F.X. Comparative on plant stoichiometry response to agricultural non-point source pollution in different types of ecological ditches. Environ. Sci. Pollut. Res. 2019, 26, 647–658. [Google Scholar] [CrossRef] [PubMed]
  4. Chen, Y.L.; Chen, L.Y.; Peng, Y.F.; Ding, J.Z.; Li, F.; Yang, G.B.; Kou, D.; Liu, L.; Fang, K.; Zhang, B.B.; et al. Linking microbial C: N: P stoichiometry to microbial community and abiotic factors along a 3500-km grassland transect on the Tibetan Plateau. Glob. Ecol. Biogeogr. 2016, 25, 1416–1427. [Google Scholar] [CrossRef]
  5. Yang, W.; Zhou, J.G.; Wang, M.H. Spatial variation of ecological stoichiometry of soil C, N and P in a small hilly watershed in subtropics of China. Acta Petrol. 2015, 52, 1336–1344. [Google Scholar]
  6. Zeng, Q.C.; Li, X.; Dong, Y.H.; Li, Y.Y.; Chen, M.; An, S.S. Ecological stoichiometry characteristics and physical-chemical properties of soils at different latitudes on the Loess Plateau. J. Nat. Resour. 2015, 30, 870–879. [Google Scholar]
  7. Sterner, R.W.; Elser, J.J. Ecological Stoichiometry: The Biology of Elements from Molecules to the Biosphere; Princeton University Press: Princeton, NJ, USA, 2002. [Google Scholar]
  8. Yang, Y.H.; Luo, Y.Q. Carbon: Nitrogen stoichiometry in forest ecosystems during stand development. Glob. Ecol. Biogeogr. 2011, 20, 354–361. [Google Scholar] [CrossRef]
  9. Ji, C.H.; Liu, H.L.; Cha, Z.Z.; Lin, Q.H.; Feng, G. Spatial-Temporal Variation of N, P, and K Stoichiometry in Cropland of Hainan Island. Agriculture 2021, 12, 39. [Google Scholar] [CrossRef]
  10. Yang, Y.; Liu, B.R.; An, S.S. Ecological stoichiometry in leaves, roots, litters and soil among different plant communities in a desertified region of Northern China. Catena 2018, 166, 328–338. [Google Scholar] [CrossRef]
  11. Chen, X.; Chen, H.Y. Plant mixture balances terrestrial ecosystem C:N:P stoichiometry. Nat. Commun. 2021, 12, 4562. [Google Scholar] [CrossRef]
  12. Zeng, Q.C.; Li, X.; Dong, Y.H.; An, S.S.; Darboux, F. Soil and plant components ecological stoichiometry in four steppe communities in the Loess Plateau of China. Catena 2016, 147, 481–488. [Google Scholar] [CrossRef]
  13. Wang, Z.Q.; Lv, S.Q.; Song, H.; Wang, M.C.; Zhao, Q.; Huang, H.; Niklas, K.J. Plant type dominates fine-root C: N: P stoichiometry across China: A meta-analysis. J. Biogeogr. 2020, 47, 1019–1029. [Google Scholar] [CrossRef]
  14. Li, Y.G.; Zhou, X.B.; Zhang, Y.M. Shrub modulates the stoichiometry of moss and soil in desert ecosystems, China. J. Arid Land 2019, 11, 579–594. [Google Scholar] [CrossRef] [Green Version]
  15. She, S.F.; Hu, Y.F.; Shu, X.Y.; Yan, X.; Li, Z.; Wang, Q.; He, J.; Jia, A.D. Variation of C, N and P stoichiometry in dominant understory plants during stand development in Salix cupularis plantations in alpine grassland in Northwestern Sichuan, China. Acta Pratacult. Sin. 2018, 27, 123–130. [Google Scholar]
  16. Reich, P.B.; Oleksyn, J. Global patterns of plant leaf N and P in relation to temperature and latitude. Proc. Natl. Acad. Sci. USA 2004, 101, 11001–11006. [Google Scholar] [CrossRef] [Green Version]
  17. Ågren, G.I. Stoichiometry and nutrition of plant growth in natural communities. Annu. Rev. Ecol. Evol. Syst. 2008, 39, 153–170. [Google Scholar] [CrossRef]
  18. Wang, N.; Fu, F.Z.; Wang, B.T.; Wang, R.J. Carbon, nitrogen and phosphorus stoichiometry in Pinus tabulaeformis forest ecosystems in warm temperate Shanxi Province, north China. J. For. Res. 2018, 29, 1665–1673. [Google Scholar] [CrossRef]
  19. Hättenschwiler, S.; Jørgensen, H.B. Carbon quality rather than stoichiometry controlslitters decomposition in a tropical rain forest. J. Ecol. 2010, 98, 754–763. [Google Scholar] [CrossRef]
  20. Guo, L.L.; Chen, Y.; Zhang, Z.; Fukushima, T. N: P stoichiometry in a forested runoff during storm events: Comparisons with regions and vegetation types. Sci. World J. 2012, 2021, 257392. [Google Scholar] [CrossRef]
  21. Kerkhoff, A.J.; Fagan, W.F.; Elser, J.J.; Enquist, B.J. Phylogenetic and growth form variation in the scaling of nitrogen and phosphorus in the seed plants. Am. Nat. 2006, 168, E103–E122. [Google Scholar] [CrossRef] [Green Version]
  22. Sun, H.F.; Li, Q.; Lei, Z.F.; Zhang, J.B.; Song, X.Z.; Song, X.Z. Ecological stoichiometry of nitrogen and phosphorus in Moso bamboo (Phyllostachys edulis) during the explosive growth period of new emergent shoots. J. Plant. Res. 2019, 132, 107–115. [Google Scholar] [CrossRef] [PubMed]
  23. Zhang, J.H.; Zhao, N.; Liu, C.C.; Yang, H.; Li, M.L.; Yu, G.R.; Wilcox, K.; Yu, Q.; He, N.P. C:N:P stoichiometry in China’s forests: From organs to ecosystems. Funct. Ecol. 2018, 32, 50–60. [Google Scholar] [CrossRef] [Green Version]
  24. Yang, X.; Tang, Z.Y.; Ji, C.J.; Liu, H.Y.; Ma, W.H.; Mohhamot, A.; Shi, Z.Y.; Sun, W.; Wang, T.; Wang, X.P.; et al. Scaling of nitrogen and phosphorus across plant organs in shrubland biomes across Northern China. Sci. Rep. 2014, 4, 5448. [Google Scholar] [CrossRef] [PubMed]
  25. Liu, G.F.; Freschet, G.T.; Pan, X.; Cornelissen, J.H.C.; Li, Y.; Dong, M. Coordinated variation in leaf and root traits across multiple spatial scales in Chinese semi-arid and arid ecosystems. New Phytol. 2010, 188, 543–553. [Google Scholar] [CrossRef]
  26. Chen, M.L.; Cui, J.T.; Deng, L.; Wang, K.B. Distribution patterns and ecological stoichiometry of water, carbon, nitrogen and phosphorus in different organs of two conifer species on the Loess Plateau. J. Environ. Earth 2018, 9, 54–63. [Google Scholar]
  27. Collins, C.G.; Wright, S.J.; Wurzburger, N. Root and leaf traits reflect distinct resource acquisition strategies in tropical lianas and trees. Oecologia 2016, 180, 1037–1047. [Google Scholar] [CrossRef]
  28. Tang, Z.Y.; Xu, W.T.; Zhou, G.Y.; Bai, Y.F.; Li, J.X.; Tang, X.L.; Chen, D.M.; Liu, Q.; Ma, W.H.; Xiong, G.M.; et al. Patterns of plant carbon, nitrogen, and phosphorus concentration in relation to productivity in China’s terrestrial ecosystems. Proc. Natl. Acad. Sci. USA 2018, 115, 4033–4038. [Google Scholar] [CrossRef] [Green Version]
  29. Minden, V.; Kleyer, M. Internal and external regulation of plant organ stoichiometry. Plant Biol. 2014, 16, 897–907. [Google Scholar] [CrossRef]
  30. Genre, A.; Lanfranco, L.; Perotto, S.; Bonfante, P. Unique and common traits in mycorrhizal symbioses. Nat. Rev. Microbiol. 2020, 18, 649–660. [Google Scholar] [CrossRef]
  31. van der Heijden, M.G.A.; Martin, F.M.; Selosse, M.A.; Sanders, I.R. Mycorrhizal ecology and evolution: The past, the present, and the future. New Phytol. 2015, 205, 1406–1423. [Google Scholar] [CrossRef]
  32. Cheeke, T.E.; Phillips, R.P.; Brzostek, E.R.; Rosling, A.; Bever, J.D.; Fransson, P. Dominant mycorrhizal association of trees alters carbon and nutrient cycling by selecting for microbial groups with distinct enzyme function. New Phytol. 2017, 214, 432–442. [Google Scholar] [CrossRef] [PubMed] [Green Version]
  33. Shen, K.P.; Cornelissen, J.H.C.; Wang, Y.J.; Wu, C.B.; He, Y.J.; Ou, J.; Tan, Q.Y.; Xia, T.T.; Kang, L.L.; Guo, Y.; et al. AM Fungi Alleviate Phosphorus Limitation and Enhance Nutrient Competitiveness of Invasive Plants via Mycorrhizal Networks in Karst Areas. Front. Ecol. Evol. 2020, 8, 125. [Google Scholar] [CrossRef]
  34. Smith, S.E.; Read, D.J. Mycorrhizal Symbiosis, 3rd ed.; Academic Press: San Diego, CA, USA, 2008. [Google Scholar]
  35. Chagnon, P.L.; Bradley, R.L. Evidence that soil nutrient stoichiometry controls the competitive abilities of arbuscular mycorrhizal vs. root-borne non-mycorrhizal fungi. Fungal Ecol. 2013, 6, 557–560. [Google Scholar] [CrossRef]
  36. Han, L. Applied Research of Shrub in Urban Areas-Main Unban Area of Ankang as an Example. Shaanxi J. Agric. Sci. 2020, 66, 80–83. [Google Scholar]
  37. Averill, C.; Bhatnagar, J.M.; Dietze, M.C.; Pearse, W.D.; Kivlin, S.N. Global imprint of mycorrhizal fungi on whole-plant nutrient economics. Proc. Natl. Acad. Sci. USA 2019, 116, 23163–23168. [Google Scholar] [CrossRef] [PubMed]
  38. Wang, B.; Qiu, Y.L. Phylogenetic distribution and evolution of mycorrhizas in land plants. Mycorrhiza 2006, 16, 299–363. [Google Scholar] [CrossRef] [PubMed]
  39. Shi, Z.Y.; Li, K.; Zhu, X.Y.; Wang, F.Y. The worldwide leaf economic spectrum traits are closely linked with mycorrhizal traits. Fungal Ecol. 2020, 43, 100877. [Google Scholar] [CrossRef]
  40. Jones, J.B. Laboratory Guide for Conducting Soil Tests and Plant Analysis; CRC Press: New York, NY, USA, 2001. [Google Scholar]
  41. Li, D.F.; Yu, S.L.; Wang, G.X.; Fang, W.W. Environmental heterogeneity and mechanism of stoichiometry properties of vegetative organs in dominant shrub communities across the Loess Plateau. Chin. J. Plant Ecol. 2015, 39, 453–465. [Google Scholar]
  42. Xiong, J.L.; Dong, L.W.; Lu, J.L.; Hu, W.G.; Gong, H.Y.; Xie, S.B.; Zhao, D.M.; Zhang, Y.H.; Wang, X.T.; Deng, Y.; et al. Variation in plant carbon, nitrogen and phosphorus contents across the drylands of China. Funct. Ecol. 2022, 36, 174–186. [Google Scholar] [CrossRef]
  43. Tao, Y.; Zhou, X.B.; Zhang, Y.M.; Yin, B.F.; Li, Y.G.; Zang, Y.X. Foliar C: N: P stoichiometric traits of herbaceous synusia and the spatial patterns and drivers in a temperate desert in Central Asia. Glob. Ecol. Conserv. 2021, 28, e01620. [Google Scholar] [CrossRef]
  44. Zhang, K.; He, M.Z.; Li, X.R.; Tan, H.J.; Gao, Y.H.; Li, G.; Han, G.J.; Wu, Y.Y. Foliar carbon, nitrogen and phosphorus stoichiometry of typical desert plants across the Alashan Desert. Acta Ecol. Sin. 2014, 34, 6538–6547. [Google Scholar]
  45. Zou, Z.G.; Zeng, F.P.; Zeng, Z.X.; Du, H.; Tang, H.; Zhang, H. The Variation in the Stoichiometric Characteristics of the Leaves and Roots of Karst Shrubs. Forests 2021, 12, 852. [Google Scholar] [CrossRef]
  46. Yang, X.; Chi, X.L.; Ji, C.J.; Liu, H.Y.; Ma, W.H.; Mohhammat, A.; Shi, Z.Y.; Wang, X.P.; Yu, S.L.; Yue, M.; et al. Variations of leaf N and P concentrations in shrubland biomes across northern China: Phylogeny, climate, and soil. Biogeosciences 2016, 13, 4429–4438. [Google Scholar] [CrossRef] [Green Version]
  47. Lu, J.Y.; He, S.B.; Wang, Z.N.; Yang, H.M. Carbon, nitrogen and phosphorus stoichiometry in differently aged lucerne stands during flowering. Legum. Res. 2016, 39, 595–600. [Google Scholar] [CrossRef] [Green Version]
  48. Zhang, W.; Liu, W.C.; Xu, M.P.; Deng, J.; Han, X.H.; Yang, G.H.; Feng, Y.Z.; Ren, G.X. Response of forest growth to C: N: P stoichiometry in plants and soils during Robinia pseudoacacia afforestation on the Loess Plateau, China. Geoderma 2019, 337, 280–289. [Google Scholar] [CrossRef]
  49. Liu, X.Y.; Hu, Y.K. C:N:P stoichiometry of leaves and fine roots in typical forest swamps of the GreaterHinggan Mountains, China. Yingyong Shengtai Xuebao 2020, 31, 3385–3394. [Google Scholar]
  50. Gao, Y.; Yuan, Y.; Li, Q.; Kou, L.; Fu, X.L.; Dai, X.Q.; Wang, H.M. Mycorrhizal type governs foliar and root multi-elemental stoichiometries of trees mainly via root traits. Plant Soil 2021, 460, 229–246. [Google Scholar] [CrossRef]
  51. Zhang, H.Y.; Lü, X.T.; Hartmann, H.; Keller, A.; Han, X.G.; Trumbore, S.; Phillips, R.P. Foliar nutrient resorption differs between arbuscular mycorrhizal and ectomycorrhizal trees at local and global scales. Glob. Ecol. Biogeogr. 2018, 27, 875–885. [Google Scholar] [CrossRef]
  52. Vrede, T.; Dobberfuhl, D.R.; Kooijman, S.A.L.M.; Elser, J.J. Fundamental connections among organism C: N: P stoichiometry, macromolecular composition, and growth. Ecology 2004, 85, 1217–1229. [Google Scholar] [CrossRef] [Green Version]
  53. Phillips, R.P.; Brzostek, E.; Midgley, M.G. The mycorrhizal-associated nutrient economy: A new framework for predicting carbon-nutrient couplings in temperate forests. New Phytol. 2013, 199, 41–51. [Google Scholar] [CrossRef]
  54. Dong, C.G.; Qiao, Y.N.; Cao, Y.; Chen, Y.M.; Wu, X.; Xue, W.Y. Seasonal variations in carbon, nitrogen, and phosphorus stoichiometry of a Robinia pseudoacacia plantation on the Loess Hilly region. China. Forests 2021, 12, 214. [Google Scholar] [CrossRef]
  55. Bennett, J.A.; Maherali, H.; Reinhart, K.O.; Lekberg, Y.; Hart, M.M.; Klironomos, J. Plant-soil feedbacks and mycorrhizal type influence temperate forest population dynamics. Science 2017, 355, 181–184. [Google Scholar] [CrossRef] [PubMed]
  56. Kohler, A.; Kuo, A.; Nagy, L.G.; Morin, E.; Barry, K.W.; Buscot, F.; Canback, B.; Choi, C.; Cichocki, N.; Clum, A.; et al. Convergent losses of decay mechanisms and rapid turnover of symbiosis genes in mycorrhizal mutualists. Nat. Genet. 2015, 47, 410–415. [Google Scholar] [CrossRef] [PubMed]
  57. Law, B.E. Regional analysis of drought and heat impacts on forests: Current and future science directions. Glob. Chang. Biol. 2014, 20, 3595–3599. [Google Scholar] [CrossRef] [Green Version]
  58. Guo, Y.P.; Yan, Z.B.; Gheyret, G.; Zhou, G.Y.; Xie, Z.Q.; Tang, Z.Y. The community-level scaling relationship between leaf nitrogen and phosphorus changes with plant growth, climate and nutrient limitation. J. Ecol. 2020, 108, 1276–1286. [Google Scholar] [CrossRef]
  59. Zhang, J.H.; Li, M.X.; Xu, L.; Zhu, J.X.; Dai, G.H.; He, N.P. C: N: P stoichiometry in terrestrial ecosystems in China. Sci. Total Environ. 2021, 795, 148849. [Google Scholar] [CrossRef]
  60. Ågren, G.I. The C: N: P stoichiometry of autotrophs–theory and observations. Ecol. Lett. 2004, 7, 185–191. [Google Scholar] [CrossRef]
  61. Li, H.; Crabbe, M.J.C.; Xu, F.; Wang, W.; Niu, R.; Gao, X.; Zhang, P.; Chen, H.K. Seasonal variations in carbon, nitrogen and phosphorus concentrations and C: N: P stoichiometry in the leaves of differently aged Larix principis-rupprechtii Mayr. plantations. Forests 2017, 8, 373. [Google Scholar] [CrossRef] [Green Version]
  62. Yang, S.; Shi, Z.Y.; Zhang, M.H.; Li, Y.; Gao, J.K.; Wang, X.G. Stoichiometry of Carbon, Nitrogen and Phosphorus in Shrub Organs Linked Closely with Mycorrhizal Strategy in Northern China. Front. Plant Sci. 2021, 12, 687347. [Google Scholar] [CrossRef]
  63. Ma, X.X.; Hong, J.T.; Wang, X.D. C: N: P stoichiometry of perennial herbs’ organs in the alpine steppe of the northern Tibetan Plateau. J. Mt. Sci. 2019, 16, 2039–2047. [Google Scholar] [CrossRef]
  64. Yuan, Z.Y.; Chen, H.Y.H.; Reich, P.B. Global-scale latitudinal patterns of plant fine-root nitrogen and phosphorus. Nat. Commun. 2011, 2, 2555–2559. [Google Scholar] [CrossRef] [PubMed] [Green Version]
  65. Brundrett, M.C. Global diversity and importance of mycorrhizal and non-mycorrhizal plants. Ecol. Stud. 2017, 230, 533–556. [Google Scholar]
  66. Sardans, J.; Peñuelas, J. The role of plants in the effects of global change on nutrient availability and stoichiometry in the plant-soil system. Plant Physiol. 2012, 160, 1741–1761. [Google Scholar] [CrossRef] [PubMed] [Green Version]
  67. Fang, Z.; Li, D.D.; Jiao, F.; Yao, J.; Du, H.T. The latitudinal patterns of leaf and soil C: N: P stoichiometry in the loess plateau of China. Front. Plant Sci. 2019, 10, 85. [Google Scholar] [CrossRef] [Green Version]
Figure 1. C/N (A), N/P (B) and C/P (C) in shrub organs (leaf, stem, and root) in different mycorrhizal types. Line bars show the value of SE. Letters above the line bars show the significant difference based on the permutation tests. The same letters are not significantly different, while those with different letters are significantly different.
Agriculture 12 01061 g001
Figure 2. The relationship between the ratio of C, N, and P in leaves for different mycorrhizal types. The blue cycles and blue lines mean AM, the red triangles and red lines mean AM + ECM, and the gray squares and black lines mean ECM.
Agriculture 12 01061 g002
Figure 3. The relationship between the ratio of C, N, and P in stems for different mycorrhizal types. The blue cycles and blue lines mean AM, the red triangles and red lines mean AM + ECM, and the gray squares and black lines mean ECM.
Agriculture 12 01061 g003
Figure 4. The relationship between the ratio of C, N, and P in roots for different mycorrhizal types. The blue cycles and blue lines mean AM, the red triangles and red lines mean AM + ECM, and the gray squares and black lines mean ECM.
Agriculture 12 01061 g004
Figure 5. Relationships between C/N in shrub organs for different mycorrhizal types. The blue cycles and blue lines mean AM, the red triangles and red lines mean AM + ECM, and the gray squares and black lines mean ECM.
Agriculture 12 01061 g005
Figure 6. Relationships between N/P in shrub organs for different mycorrhizal types. The blue cycles and blue lines mean AM, the red triangles and red lines mean AM + ECM, and the gray squares and black lines mean ECM.
Agriculture 12 01061 g006
Figure 7. Relationships between C/P in shrub organs for different mycorrhizal types. The blue cycles and blue lines mean AM, the red triangles and red lines mean AM + ECM, and the gray squares and black lines mean ECM.
Agriculture 12 01061 g007
Table 1. The effect of mycorrhiza type, latitude, and their interaction on the C, N, and P concentration ratio in shrub organs based on linear mixed-effects models.
RatioMycorrhiza TypeLatitudeMycorrhizatype × Latitude
FPFPFP
leaf C/N0.280.752.330.134.700.01
leaf N/P3.350.042.120.157.62<0.001
leaf C/P3.240.040.120.734.540.01
stem C/N1.800.1749.25<0.00110.80<0.001
stem N/P4.720.0112.65<0.0014.730.009
stem C/P3.350.046.960.0090.660.52
root C/N2.580.0814.40<0.0013.730.02
root N/P3.490.049.180.0033.970.02
root C/P1.380.260.110.740.450.64
Mycorrhiza type, latitude and their interaction are fixed effects. Species is a random effect.
Publisher’s Note: MDPI stays neutral with regard to jurisdictional claims in published maps and institutional affiliations.

