Article

Mechanical Characteristics of Rice Root–Soil Complex in Rice–Wheat Rotation Area

1
Faculty of Modern Agricultural Engineering, Kunming University of Science and Technology, Kunming 650500, China
2
Shandong Academy of Agricultural Machinery Science, Ji’nan 250010, China
*
Author to whom correspondence should be addressed.
Agriculture 2022, 12(7), 1045; https://doi.org/10.3390/agriculture12071045
Submission received: 30 June 2022 / Revised: 13 July 2022 / Accepted: 14 July 2022 / Published: 18 July 2022
(This article belongs to the Section Agricultural Technology)

Abstract

:
In order to explore the mechanical characteristics of stubble breaking and provide a theoretical basis for the design of a stubble breaking and crushing blockage prevention device, an orthogonal test with three factors (water content, bulk weight, and root content) and a quick shearing test of remolded soil were carried out in a laboratory. The shear resistance of the rice root–soil complex was studied and the soil mechanical equation of the rice root–soil composite was established. It is found that the shear strength of the root–soil composite is related to water content and root content. When the water content was around 30% and the root content was 1.1%, the cohesion of the root–soil composite was the smallest. With the decrease or increase of water content and the decrease or increase of root content, the cohesion of the root–soil composite showed the trend of increasing layer by layer. When the water content was 40% and the root content was 1.1%, the internal friction angle of the root–soil composite showed the minimum value. With the decrease of water content and the increase of root content, the internal friction angle of the root–soil composite gradually showed an increasing trend; while the root content had a great influence on the internal friction angle, the influence of water content on it was relatively small. The direct shear and fast shear tests of root–soil composite samples showed that the shear strength of the root–soil composite and the normal pressure loaded on it conform to the Coulomb equation. The presence of roots increased the shear strength and cohesion value of the soil and improved the resistance to deformation of the soil, but had little influence on the internal friction angle.

1. Introduction

Conservation tillage technology is widely used in agricultural engineering [1,2,3,4]. No-tillage, less tillage, and straw mulching are adopted to maintain soil moisture, improve soil structure [5], and slow down land degradation [6,7,8,9,10]. A no-tillage sowing environment for implementing conservation tillage is different from traditional sowing farmland. Besides straw and weeds on the surface, there are also a lot of crop stubbles in the soil [11,12,13]. Therefore, the trencher of the no-tillage planter needs to process this root–soil complex. The main function of the residue cutting and anti-blocking device is to cut and remove straw and weeds on the surface, and, at the same time, break and loosen the solid root–soil complex [14,15,16]. In order to design more reasonable conservation agriculture equipment, the mechanical properties of soil need to be studied.
Soil itself is a complex system. In addition, the friction, biting, and adhesion of the root system distributed underground form a special composite material–root–soil complex. Burak et al. [17] studied the influence of known root properties on the shear strength of the root–soil complex. Feng et al. [18] took a root–soil complex composed of arbor roots and unsaturated red clay as the research object, and studied the influence of soil water content, the angle between parallel double roots, and shear surface on shear strength. Meijer [19] studied a common model framework that quantifies the impact of various model assumptions through existing methods; Liu et al. [20] analyzed the micro-structural characteristics of root surfaces of Caragana and Overlord shrubs, soil surface in contact with the roots, and soil surface in contact with no roots and their influence on friction characteristics of the root–soil interface by means of scanning electron microscope. Zheng et al. [21] carried out shear tests on the rice root–soil complex on a universal material-testing machine with a self-made shear test device. Meng et al. [22] performed mechanical analysis of soils containing Golden Vicary Privet roots, and they found that both root geometry and distribution characteristics affected the shear strength of rooted soils. Hou et al. [23] studied the use of X-ray-computed tomography (CT) as a non-invasive method to detect root distribution in soil. They found that X-ray CT was able to reconstruct the core of the soil in three dimensions to accurately estimate the wide range of soil characteristics, including roots, and to examine not only spatial but also temporal changes. Fan et al. [24] carried out in-situ pull-out tests on roots. Their research results showed that the initial pull-out stiffness decreased with the increase of root length and soil water content. They found that the increase of soil water content led to a significant decrease in soil–root bonding strength, and that the soil–root bonding strength decreased with the increase of root length. In addition, many scientific researchers at home and abroad have carried out a lot of research on this aspect, revealing the interaction between stubble and soil [25,26,27], and the mechanism of action of roots on soil consolidation and slope protection [28,29,30,31].
While normally tilled soils are the subject of most studies, the research on the root–soil complex under conservation tillage is relatively scarce. Only Jiang et al. [32] measured the mechanical properties of the whole corn stubble and the root–soil complex for the first time in a two-cropping area over one year in the north. However, little research was conducted on the characteristics of the root–soil complex in rice stubble fields under the protective tillage technology in the middle and lower reaches of the Yangtze River.
Therefore, the research object of this paper was the rice root–soil complex in the middle and lower reaches of the Yangtze River. The shear strength of the rice root–soil complex was tested, according to the test method of soil mechanics, under the conditions of different bulk weight, different water content, and different root content. The shear behavior of rice root–soil complex was studied and the soil mechanical equation of rice root–soil complex was established. This paper provides necessary mechanical indexes for the study of the stubble breaking principle, as well as a necessary theoretical basis for the design of a stubble breaking and crushing blockage prevention device and the research of a simulation machine.

2. Materials and Methods

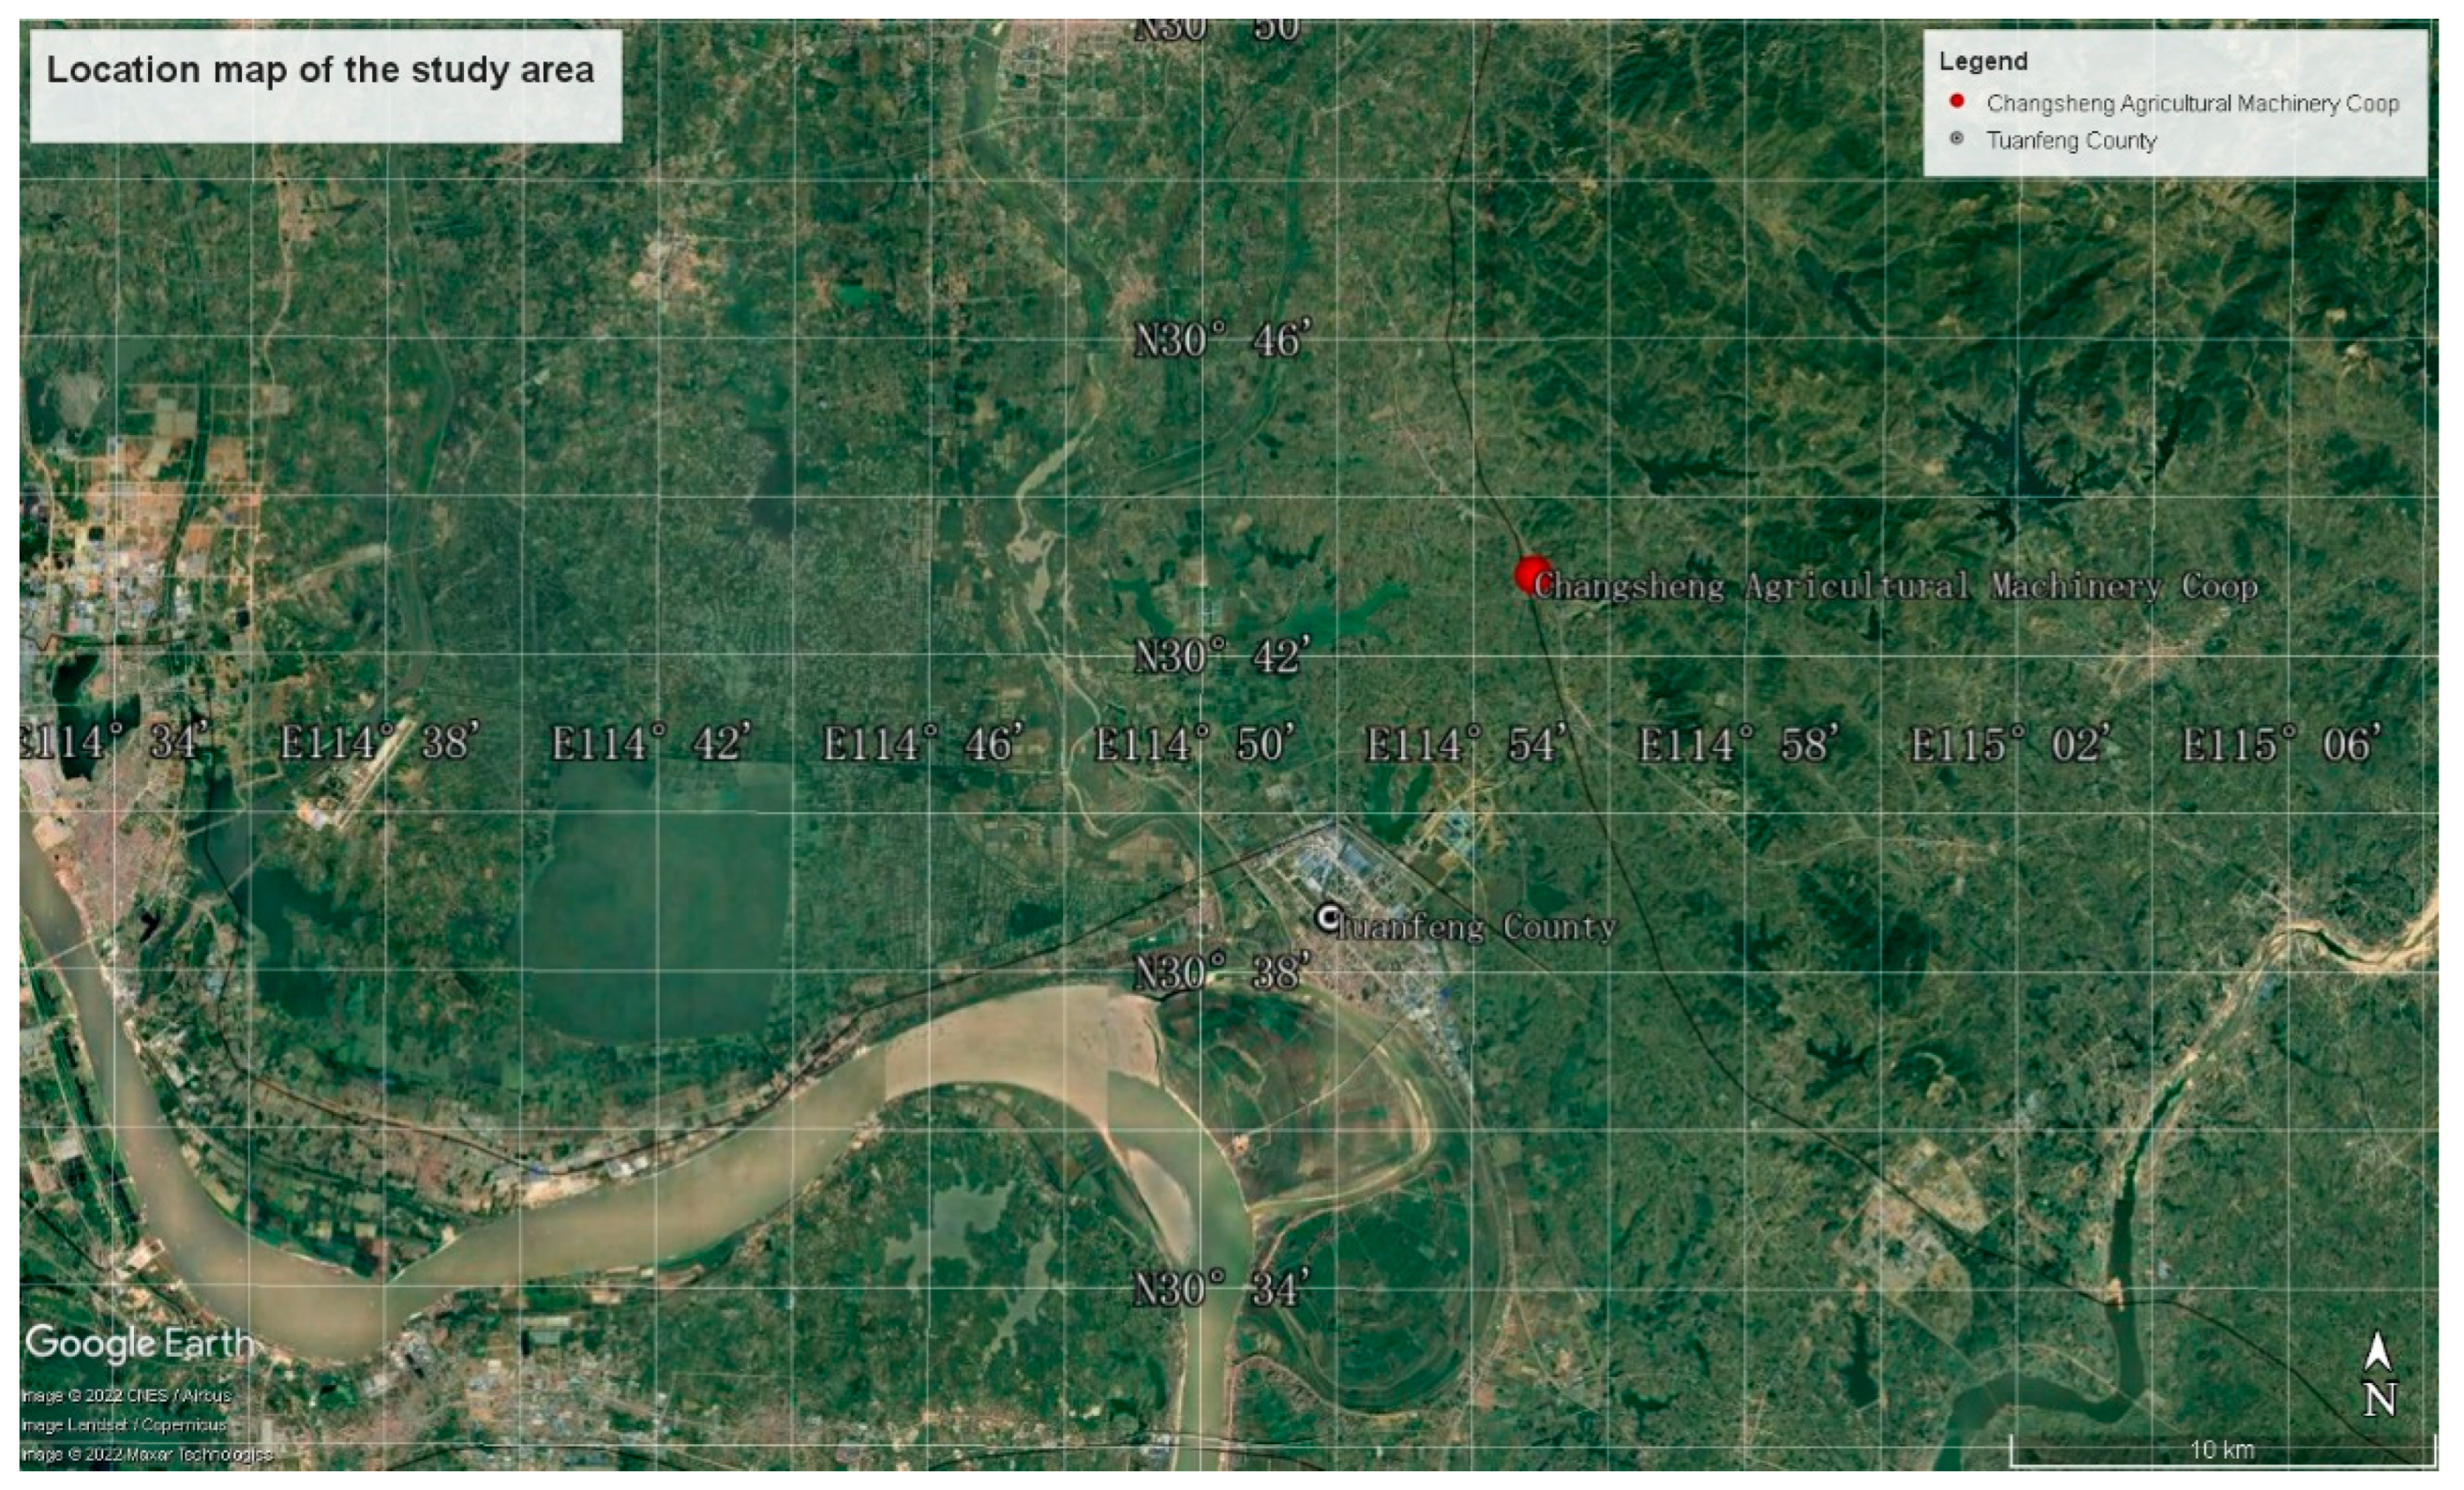
2.1. Preparation of Test Samples

The samples used in this experiment were soils from a typical rice–wheat rotation area in the middle and lower reaches of the Yangtze River. The samples were taken from the test field of Changsheng Agricultural Machinery Coop, Tuanfeng County, Huanggang City, Hubei Province, China (30°43′1″ N, 114°54′39″ E). The location of the study area is shown in Figure 1. The soil bulk density, firmness, and water content are shown in Table 1. The test instruments mainly include a strain-controlled direct shearing apparatus, standard screen (coarse screen, fine screen), an electronic balance (weighing 200 g and 1000 g, accuracy 0.01 g), drying oven, vibrating screen, grinding bowl, ceramic plate, etc.
This test was conducted according to the method of root–soil composite shear stress test. It is difficult to sample straw roots due to the hardness of straw roots in field sampling. This would cause serious disturbance to the original soil and result in errors in measurement results. Field tests are also limited by time, environmental conditions, and test equipment. Therefore, disturbed soil was used in this test, and then samples were reproduced in the laboratory in accordance with specifications [33,34]. When sampling in the field, it is difficult to sample the grass roots due to their hardness. This would seriously interfere with the original soil and lead to errors in the measurement results.
The soil samples collected and their water-bearing rice stubbles were dried and weighed separately, and the root content in each 100 g soil was 0.5 g, 1.1 g, and 2.1 g, respectively. According to the basic parameters of the abovementioned soil samples, the water content of the samples was initially set at the levels of 20%, 30%, and 40%, and the soil density was 1.5 g·cm−3, 1.7 g·cm−3, and 1.9 g·cm−3 levels.

2.2. Testing Indicators and Methods

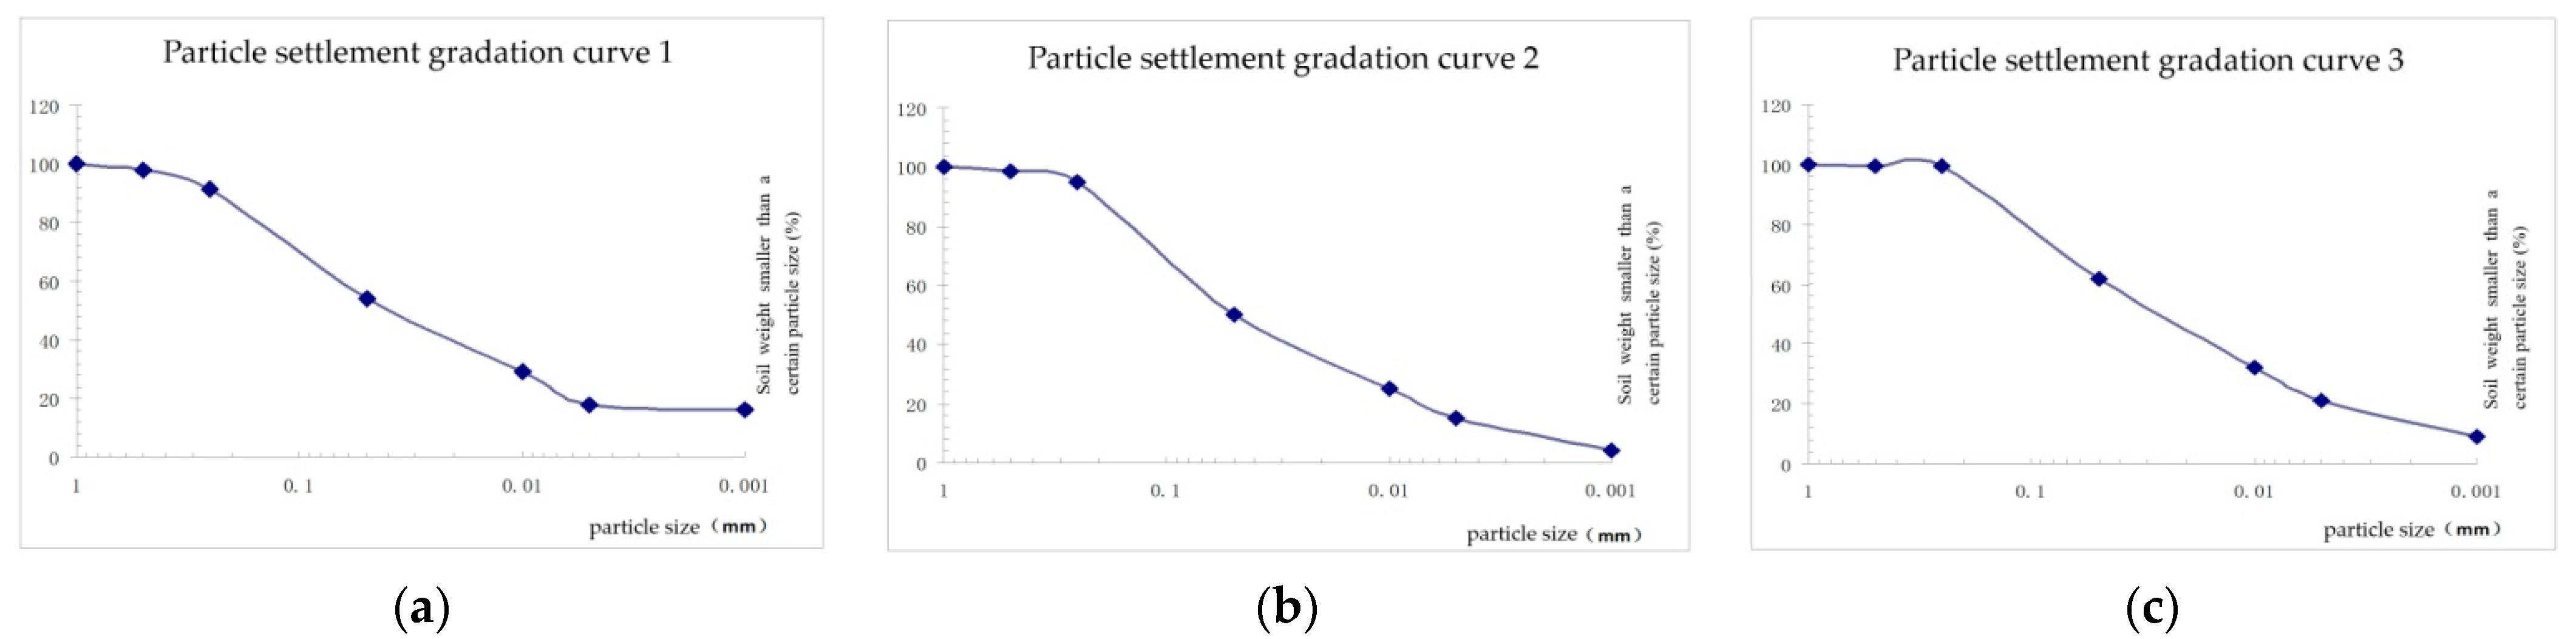
2.2.1. Particle Analysis Test

Through soil grain size analysis tests, it is possible to determine the percentage of each particle group in the dry soil sample to the total mass of the soil sample, and to determine the grain size distribution. This test uses the screening method to screen the test soil samples.
First, the percentage of the mass of the sample smaller than a certain particle size to the total mass of the sample was calculated according to Equation (1):
X s = A s B s d x × 100 %
where:
  • Xs—the percentage of sample mass smaller than a certain particle size to the total mass of the sample, %.
  • As—sample mass smaller than a certain particle size, g.
  • Bs—the quality of the sample taken when analyzed with a fine screen; the total mass of the sample is determined when analyzed with a rough screen, g.
  • dx—sample mass with particle size less than 2 mm as a percentage of total sample mass, %.

2.2.2. Shear Test of Root–Soil Composite

The friction angle of the soil φs and cohesion Cs are indispensable indexes for calculation of soil stability and other strength. In this study, the total stress method was used to characterize this characteristic of soil mass, its cohesion (Cs), and internal friction angle (φs) as a variable indicator of shear strength. A quick shear test of root–soil composite was carried out with the direct shear apparatus.
The calculation of the shear displacement of the specimen is shown in Equation (2).
Δ L s = 20 n s R s
where:
  • ΔLs—shear displacement of the Ls-root–soil composite sample, 0.01 mm.
  • ns—number of handwheel turns of the straight shearing instrument.
  • Rs—dial gauge reading of the direct shearing instrument, 0.01 mm.
The calculation of shear strength of the root–soil composite based on the Coulomb equation and the shear strength of clayey soil is shown in Equation (3).
τ s = σ s tan φ s + C s
where:
  • τs—root–soil composite shear strength, kPa.
  • σs—normal stress acting on the root–soil complex, kPa.
  • φs—internal friction angle of root–soil complex, °.
  • Cs—cohesion of root–soil complex, kPa.
With the axial strain as the transverse coordinate and the axial deviation stress as the longitudinal coordinate, the stress–strain curves of each sample under each radial load condition were plotted. When the axial deviation stress reached a certain value, there was a value when the axial deviation stressed stabilized or reached the peak strength. This value was the shear strength of the root–soil composite specimen when it was destroyed under this vertical stress. Vertical stress to be loaded on the test soil σs is the horizontal coordinate. The shear strength of the root–soil composite, τs, is the vertical coordinate. We drew the relationship between shear strength τs and vertical stress σs. According to the Coulomb equation, there is a linear relationship between the shear strength of soil mass and the normal stress on it. If the measured point can be fitted into a straight line, the inclination of the line is the internal friction angle (φs) of the root–soil complex. The intercept part of the line on the longitudinal axis is the cohesion force (Cs) of the root–soil complex.

3. Experimental Design

Soil particle classification test and root–soil composite shear strength test were carried out in accordance with China′s Standard for Geotechnical Test Methods [35]. Soil particle classification experiment is a routine experiment to determine the basic parameters of the tested soil. For the shear strength test of root–soil composite, based on the above-mentioned basic test parameters, the test treatment was selected as the main test factors, i.e., soil water content, root content, and soil bulk weight. The soil water content was 20%, 30%, and 40%. The root content level was 0.5%, 1.1%, and 2.1%; the soil bulk density level was 1.5 g·cm−3, 1.7 g·cm−3 and 1.9 g·cm−3. According to the requirements of the direct shear test, the normal stresses loaded were 100 KPa, 200 KPa, 300 KPa, and 400 KPa. In order to fully calculate the shear strength of each factor at each level, this test was designed as a complete test.
According to the balanced dispersion and neat comparability of orthogonal experimental design, the L9(34) orthogonal table was selected to construct a 3-factor and 3-level test scheme, and the shear strength of the root–soil composite was tested by direct shear (fast shear) test. The corresponding factor level is shown in Table 2. The orthogonal test scheme is shown in Table 3 and the test index was the shear strength of the root–soil composite.

4. Results and Discussion

4.1. Particle Analysis of Sample Soil

According to the above experimental design, the soil particles of the tested root–soil complex were analyzed. The grain size distribution curve is shown in Figure 2 and the particle composition is shown in Table 4.
According to the grain gradation of soil samples in Figure 2 and Table 4, the clay content, silt content, and sand content of the test soil samples in the 0–10 cm layer were 29%, 25%, and 46%. In the 10–20 cm soil layer, the clay content was 25%, the silt content was 25%, and the sand content was 50%. In the 20–30 cm soil layer, the clay content was 32%, the silt content was 30%, and the sand content was 38%.

4.2. Analysis of Shear Strength of the Root–Soil Composite

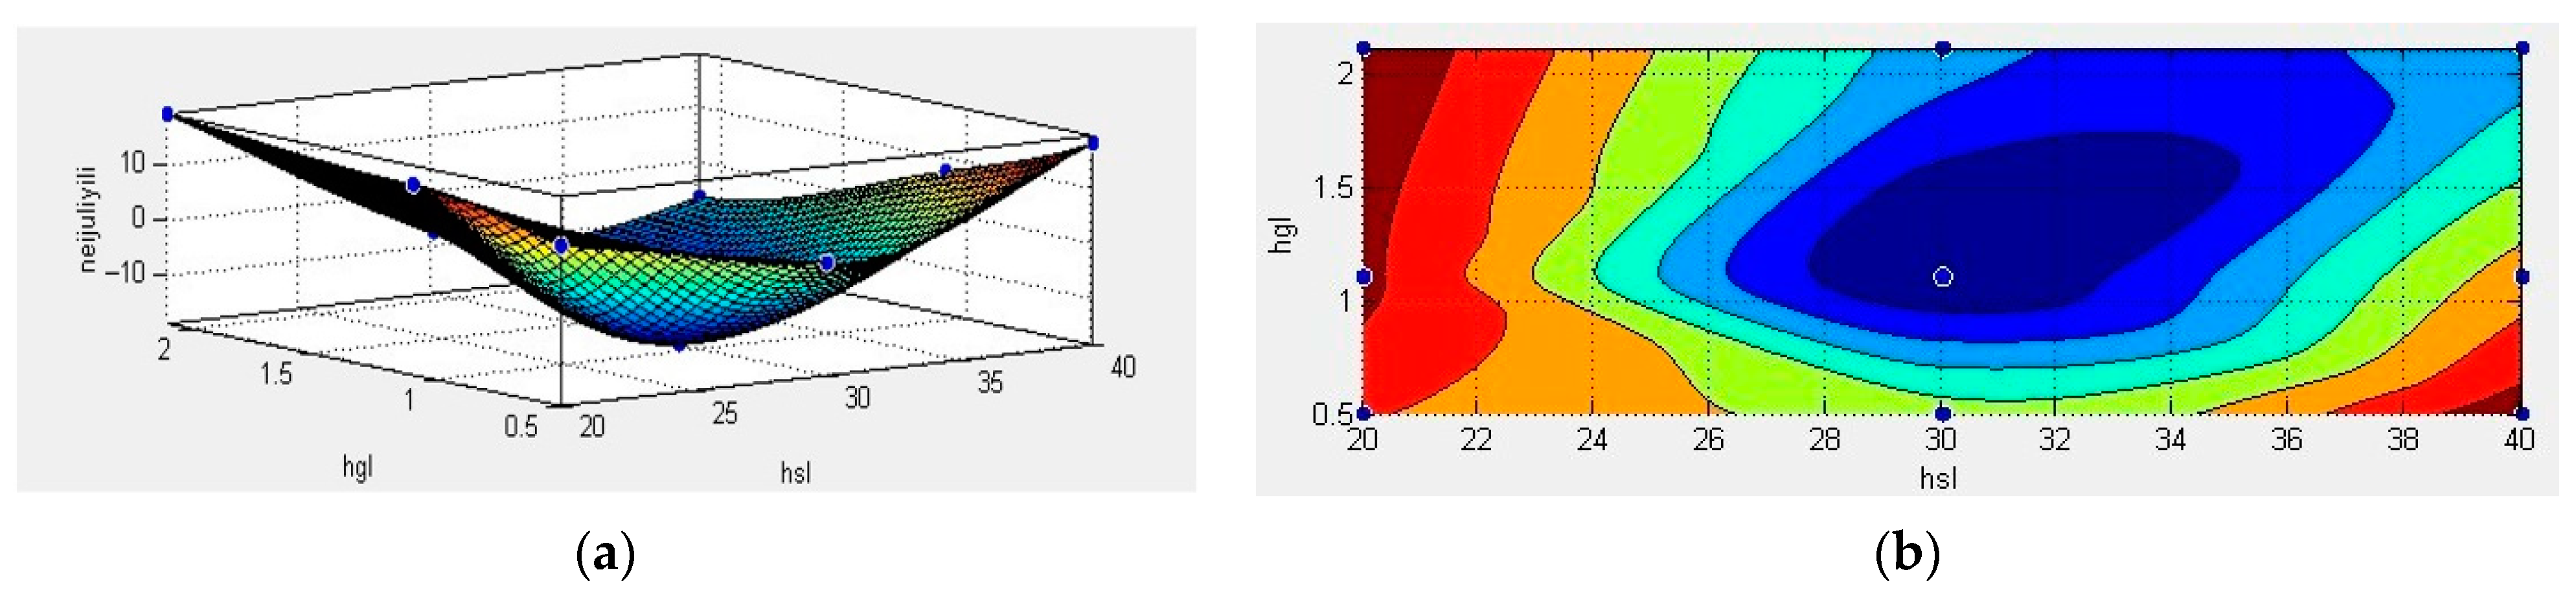
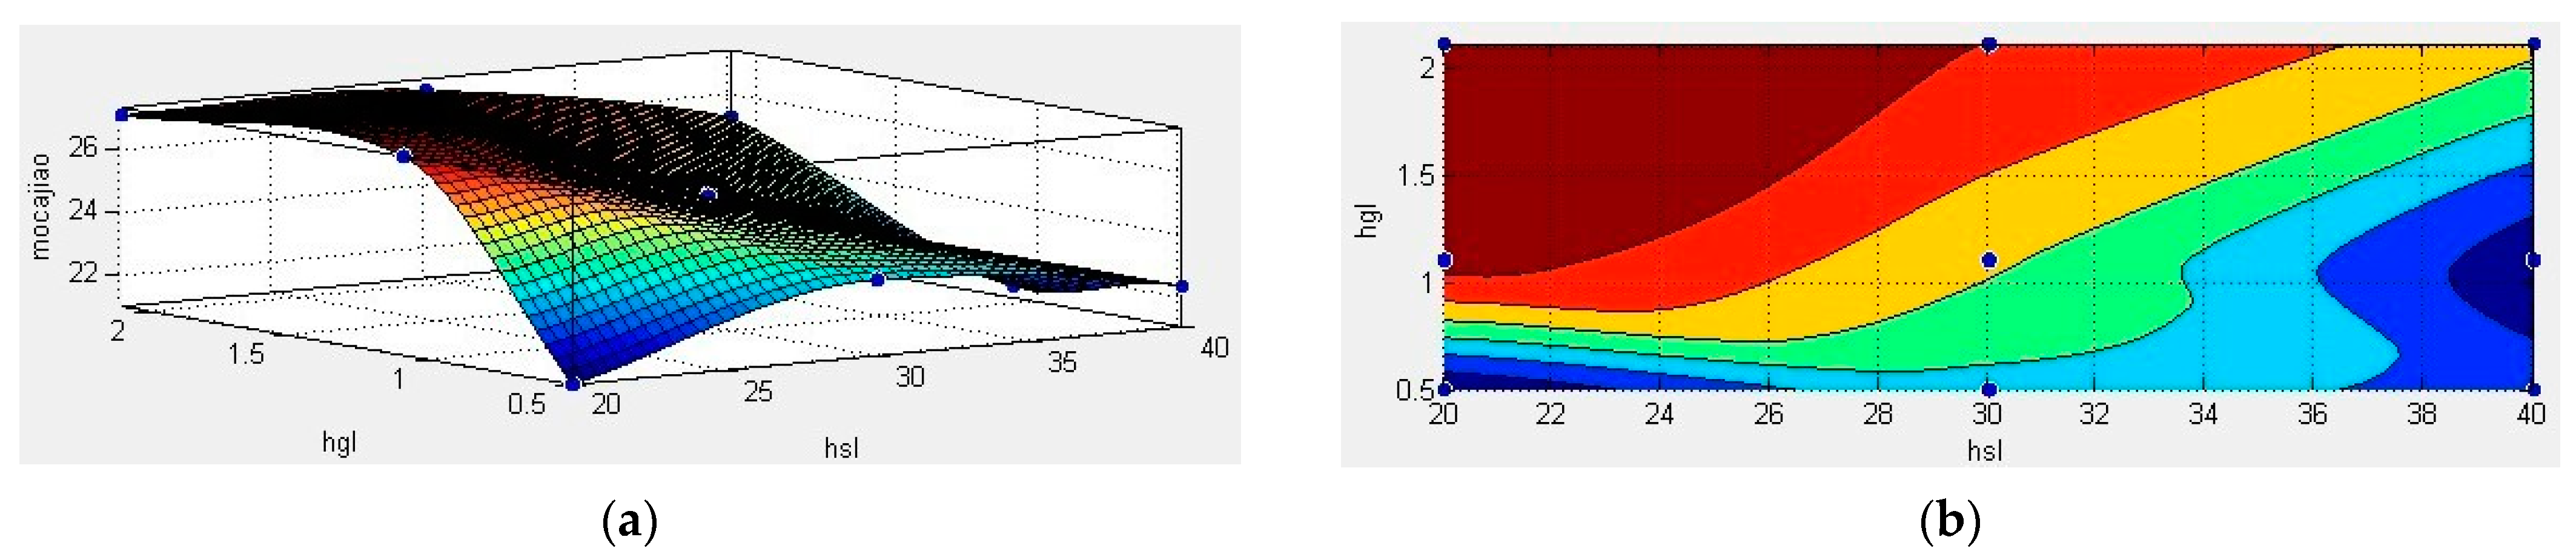
4.2.1. Range Analysis

According to the aforementioned research methods and means, the test of shear strength of the root–soil composite was carried out with range analysis. The specific data are shown in Table 5.
From Table 5, for the shear strength parameters Cs of the root–soil composite, the extreme differences of factor water content, bulk density, and root content were 16.1693, 1.8473, and 19.8987, respectively. Additionally, φs (friction angle), the range value of water content factor was 3.10, the range value of unit weight was 0.72, and the range value of root content was 2.33. It can be seen that the two key parameters Cs and φs which influence the shear strength of the root–soil composite were the root content and water content. However, the effect of water content on φs was the most significant, and the effect of root content on Cs was the most obvious.
With the horizontal coordinates of water content, bulk weight, and root content, and the average values of cohesion and internal friction angle as vertical coordinates, the trend of the factor level and test index was plotted respectively, as shown in Figure 3.
It can be seen from Figure 3 that the influence of water content on test index Cs decreased first and then increased, reaching the minimum at water content A level. The influence of the bulk weight of the root–soil complex on the test index Cs gradually increased, reaching the maximum at the level of bulk weight B. The influence of root content on test index Cs showed a trend of decreasing first and then increasing, and showed a minimum value at the level of root content C2. However, the influence of the above factors on the test index φs was somewhat different. The influence of water content on φs decreased first and then increased, but also reached the minimum at A2 level. The influence of specific weight on φs first decreased and then increased, and showed a minimum value at B2 level. The influence of root content on φs increased first and then decreased, and there was a maximum value at C2. That is to say, the influence of water content and bulk weight on the key indexes Cs and φs of shear strength of the root–soil composite first decreased, then increased, with extreme points and minimum values; the influence of root content on the key indexes Cs and φs of shear strength of the root–soil composite is mutually exclusive, i.e., the deterioration of φs occurred when the influencing factors were in favor of Cs, and vice versa.

4.2.2. Variance Analysis

The above range analysis only qualitatively analyzes the influence of each factor level on each test index. On this basis, variance analysis was carried out in order to obtain the quantitative analysis of each factor on each test index respectively. The variance analysis is shown in Table 6.
Table 6 shows that the bulk weight of the root–soil complex was not significant to the test index, so in range analysis, the change trend of the bulk weight to the test index is not credible. The influence of water content and root content of the root–soil composite on shear strength of the root–soil composite was significant and extremely significant respectively. Combining with the previous range analysis, the influence of root content on the two test indexes is mutually exclusive. Therefore, it is necessary to redesign the influence of water content and root content on shear strength of the root–soil composite with fixed soil volume. Therefore, the soil bulk density was fixed at the level of 1.7 g/cm3 and the water content and root content were tested completely respectively. The test data are shown in Table 7.

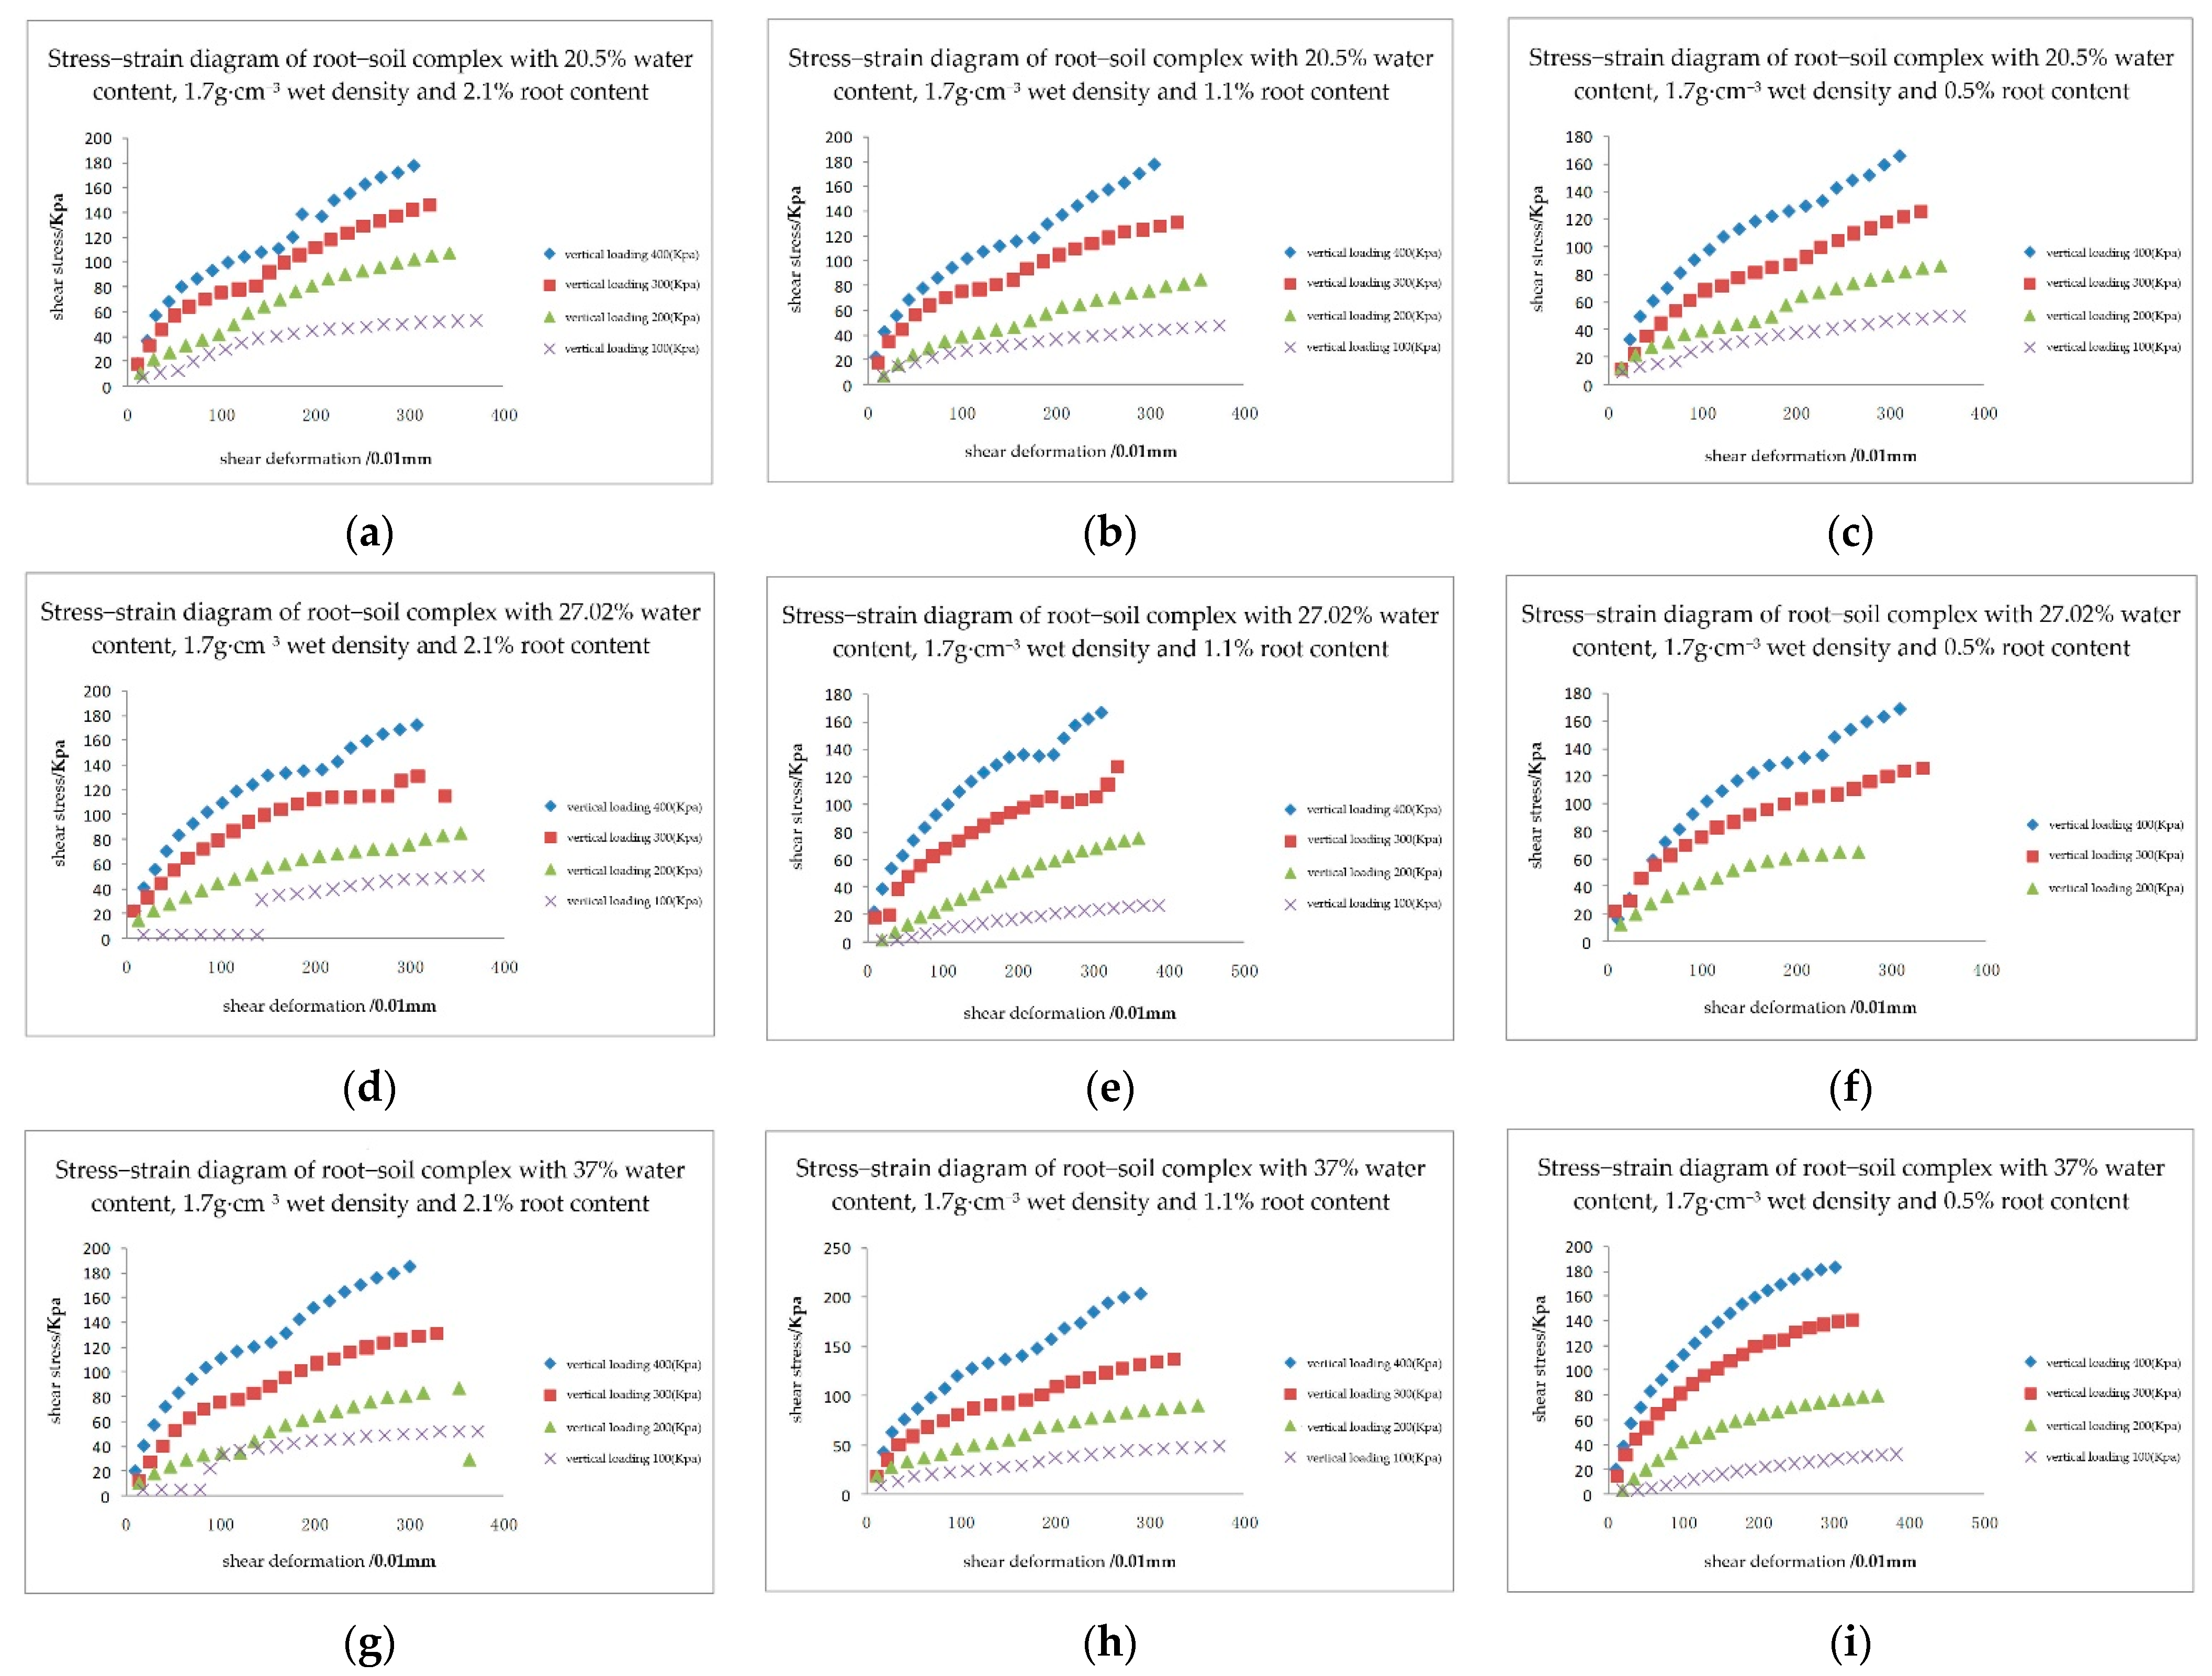
4.2.3. Shear Stress and Shear Deformation

Quick shear tests were carried out on root–soil composite samples with different water content and root content combination step-by-step under four normal pressure classes of 100 kPa, 200 kPa, 300 kPa, and 400 kPa respectively. When the water content of the root–soil composite was 20%, 30%, and 40%, the shear stress of the root–soil composite specimens with different root content is shown in Figure 4.
It can be seen from Figure 4 that the shear stress between the root–soil complex increased with the increase of shear deformation and showed an approximate linear relationship at the initial stage. When the shear deformation reached a certain degree, the shear stress presented a non-linear relationship and tended to stabilize gradually. As the shear deformation continued to increase, the shear stress again showed a non-linear increase, and there was no sign that the shear stress tended to stabilize until the end of the experiment. In addition, the shear stress of the root–soil composite increased with the increase of normal pressure, which was non-linear. According to analysis, the shear stress tended to stabilize for the first time due to the main body of the sample, i.e., the soil was sheared, but the root system in the soil played an associated role as the soil was destroyed more deeply. At this time, the shear resistance was not pure soil, but root–soil complex doped with roots. As the experiment continued, the shear stress of the sample increased again in a non-linear manner, and the increase was significantly greater than the previous stage.

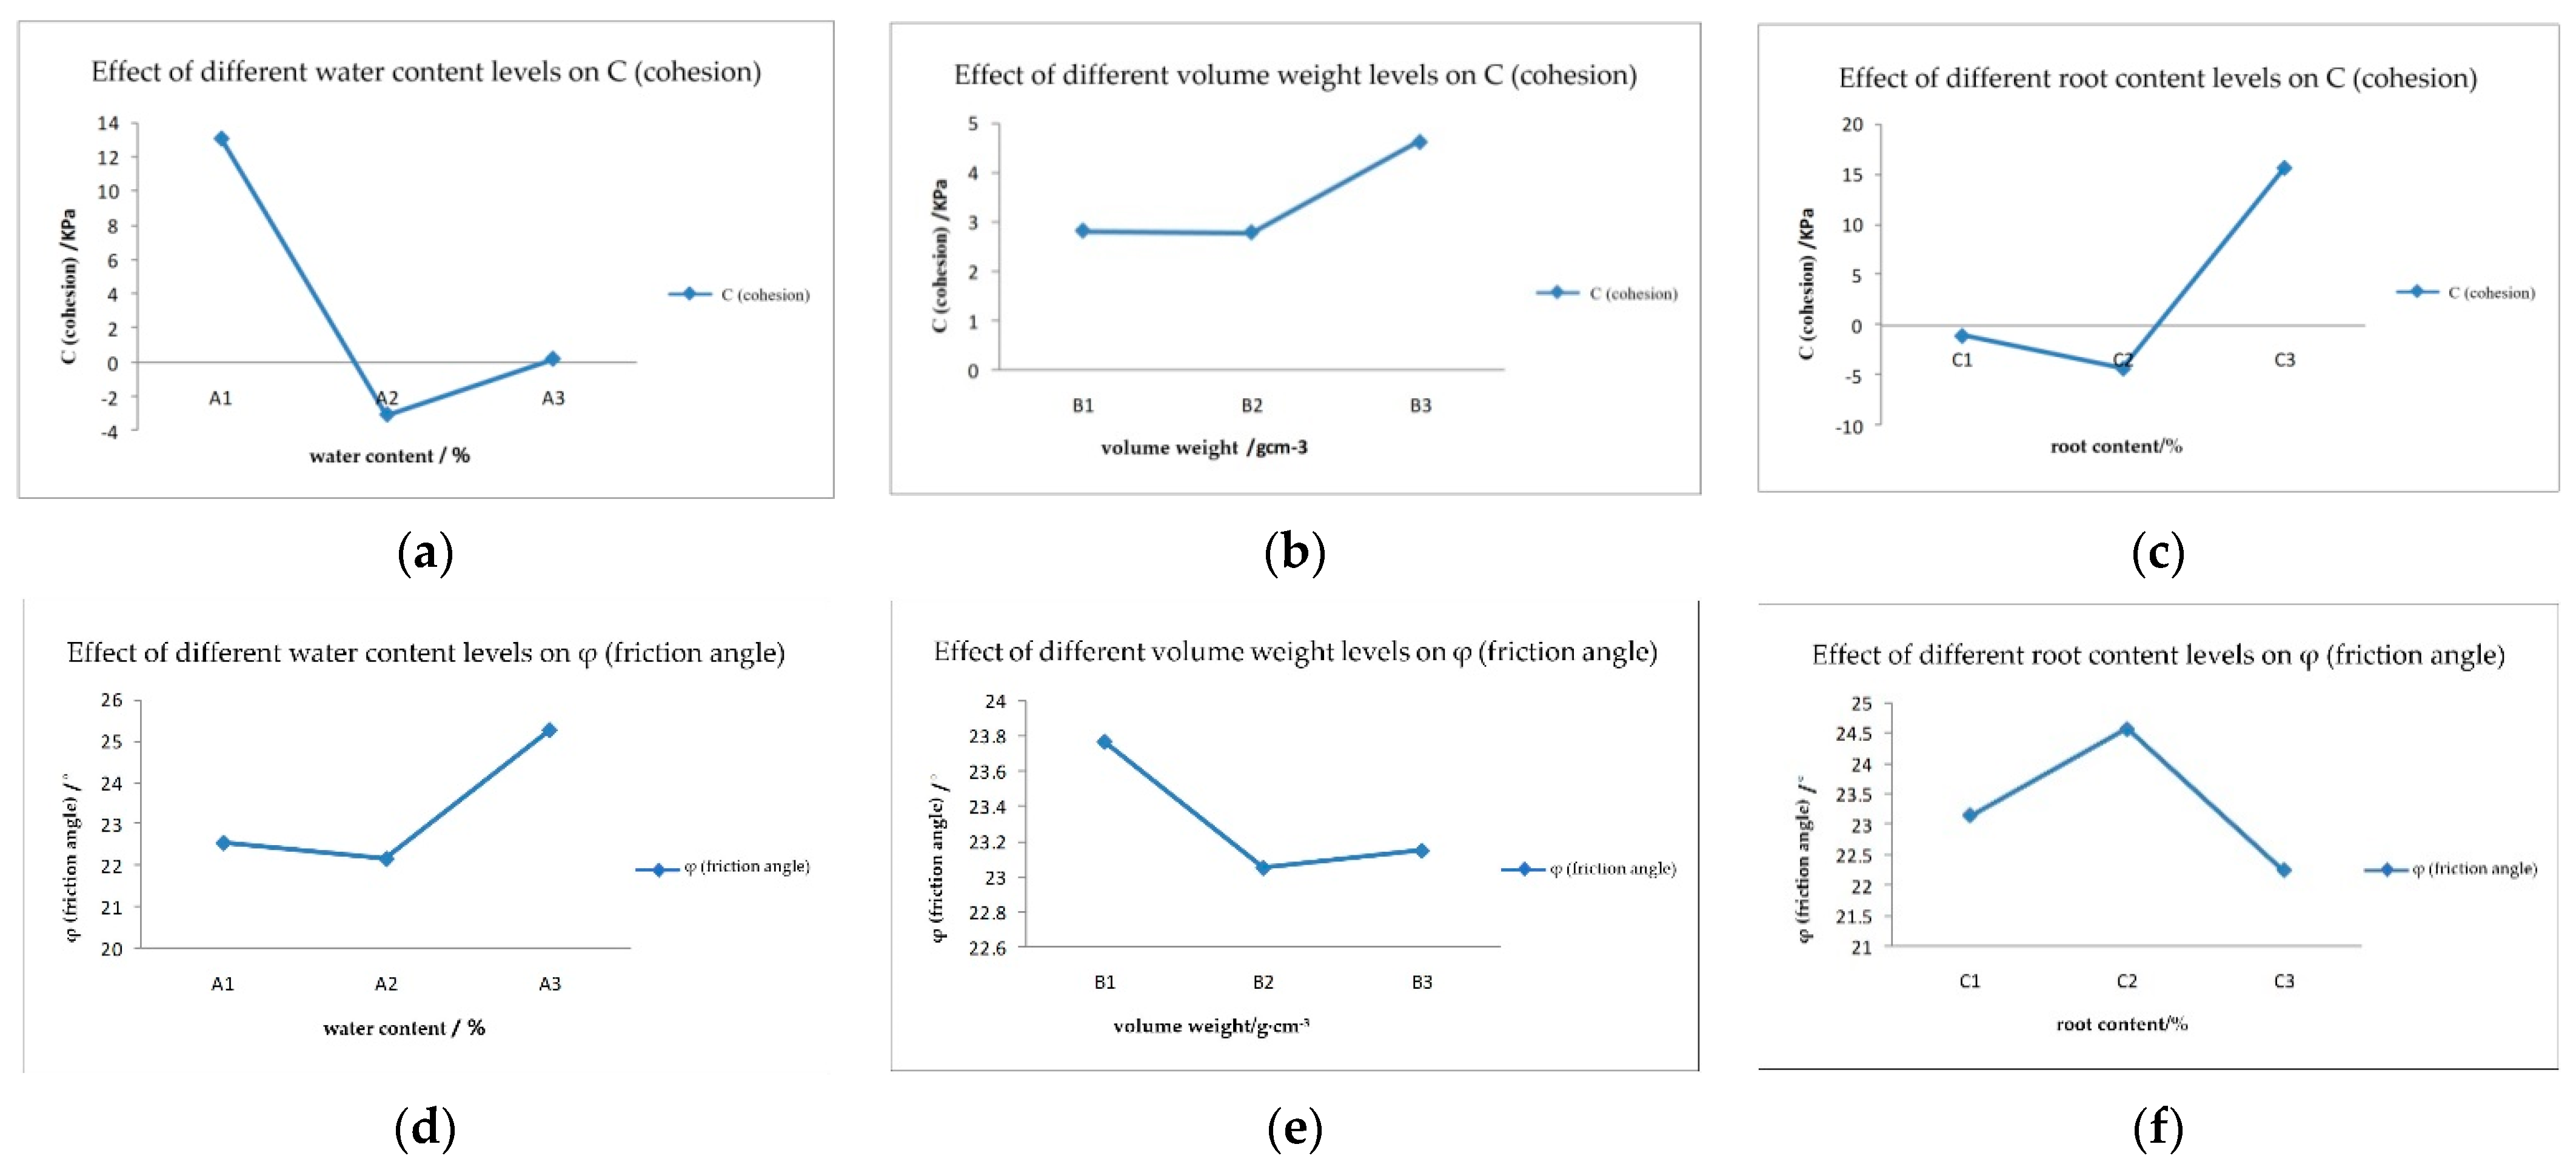
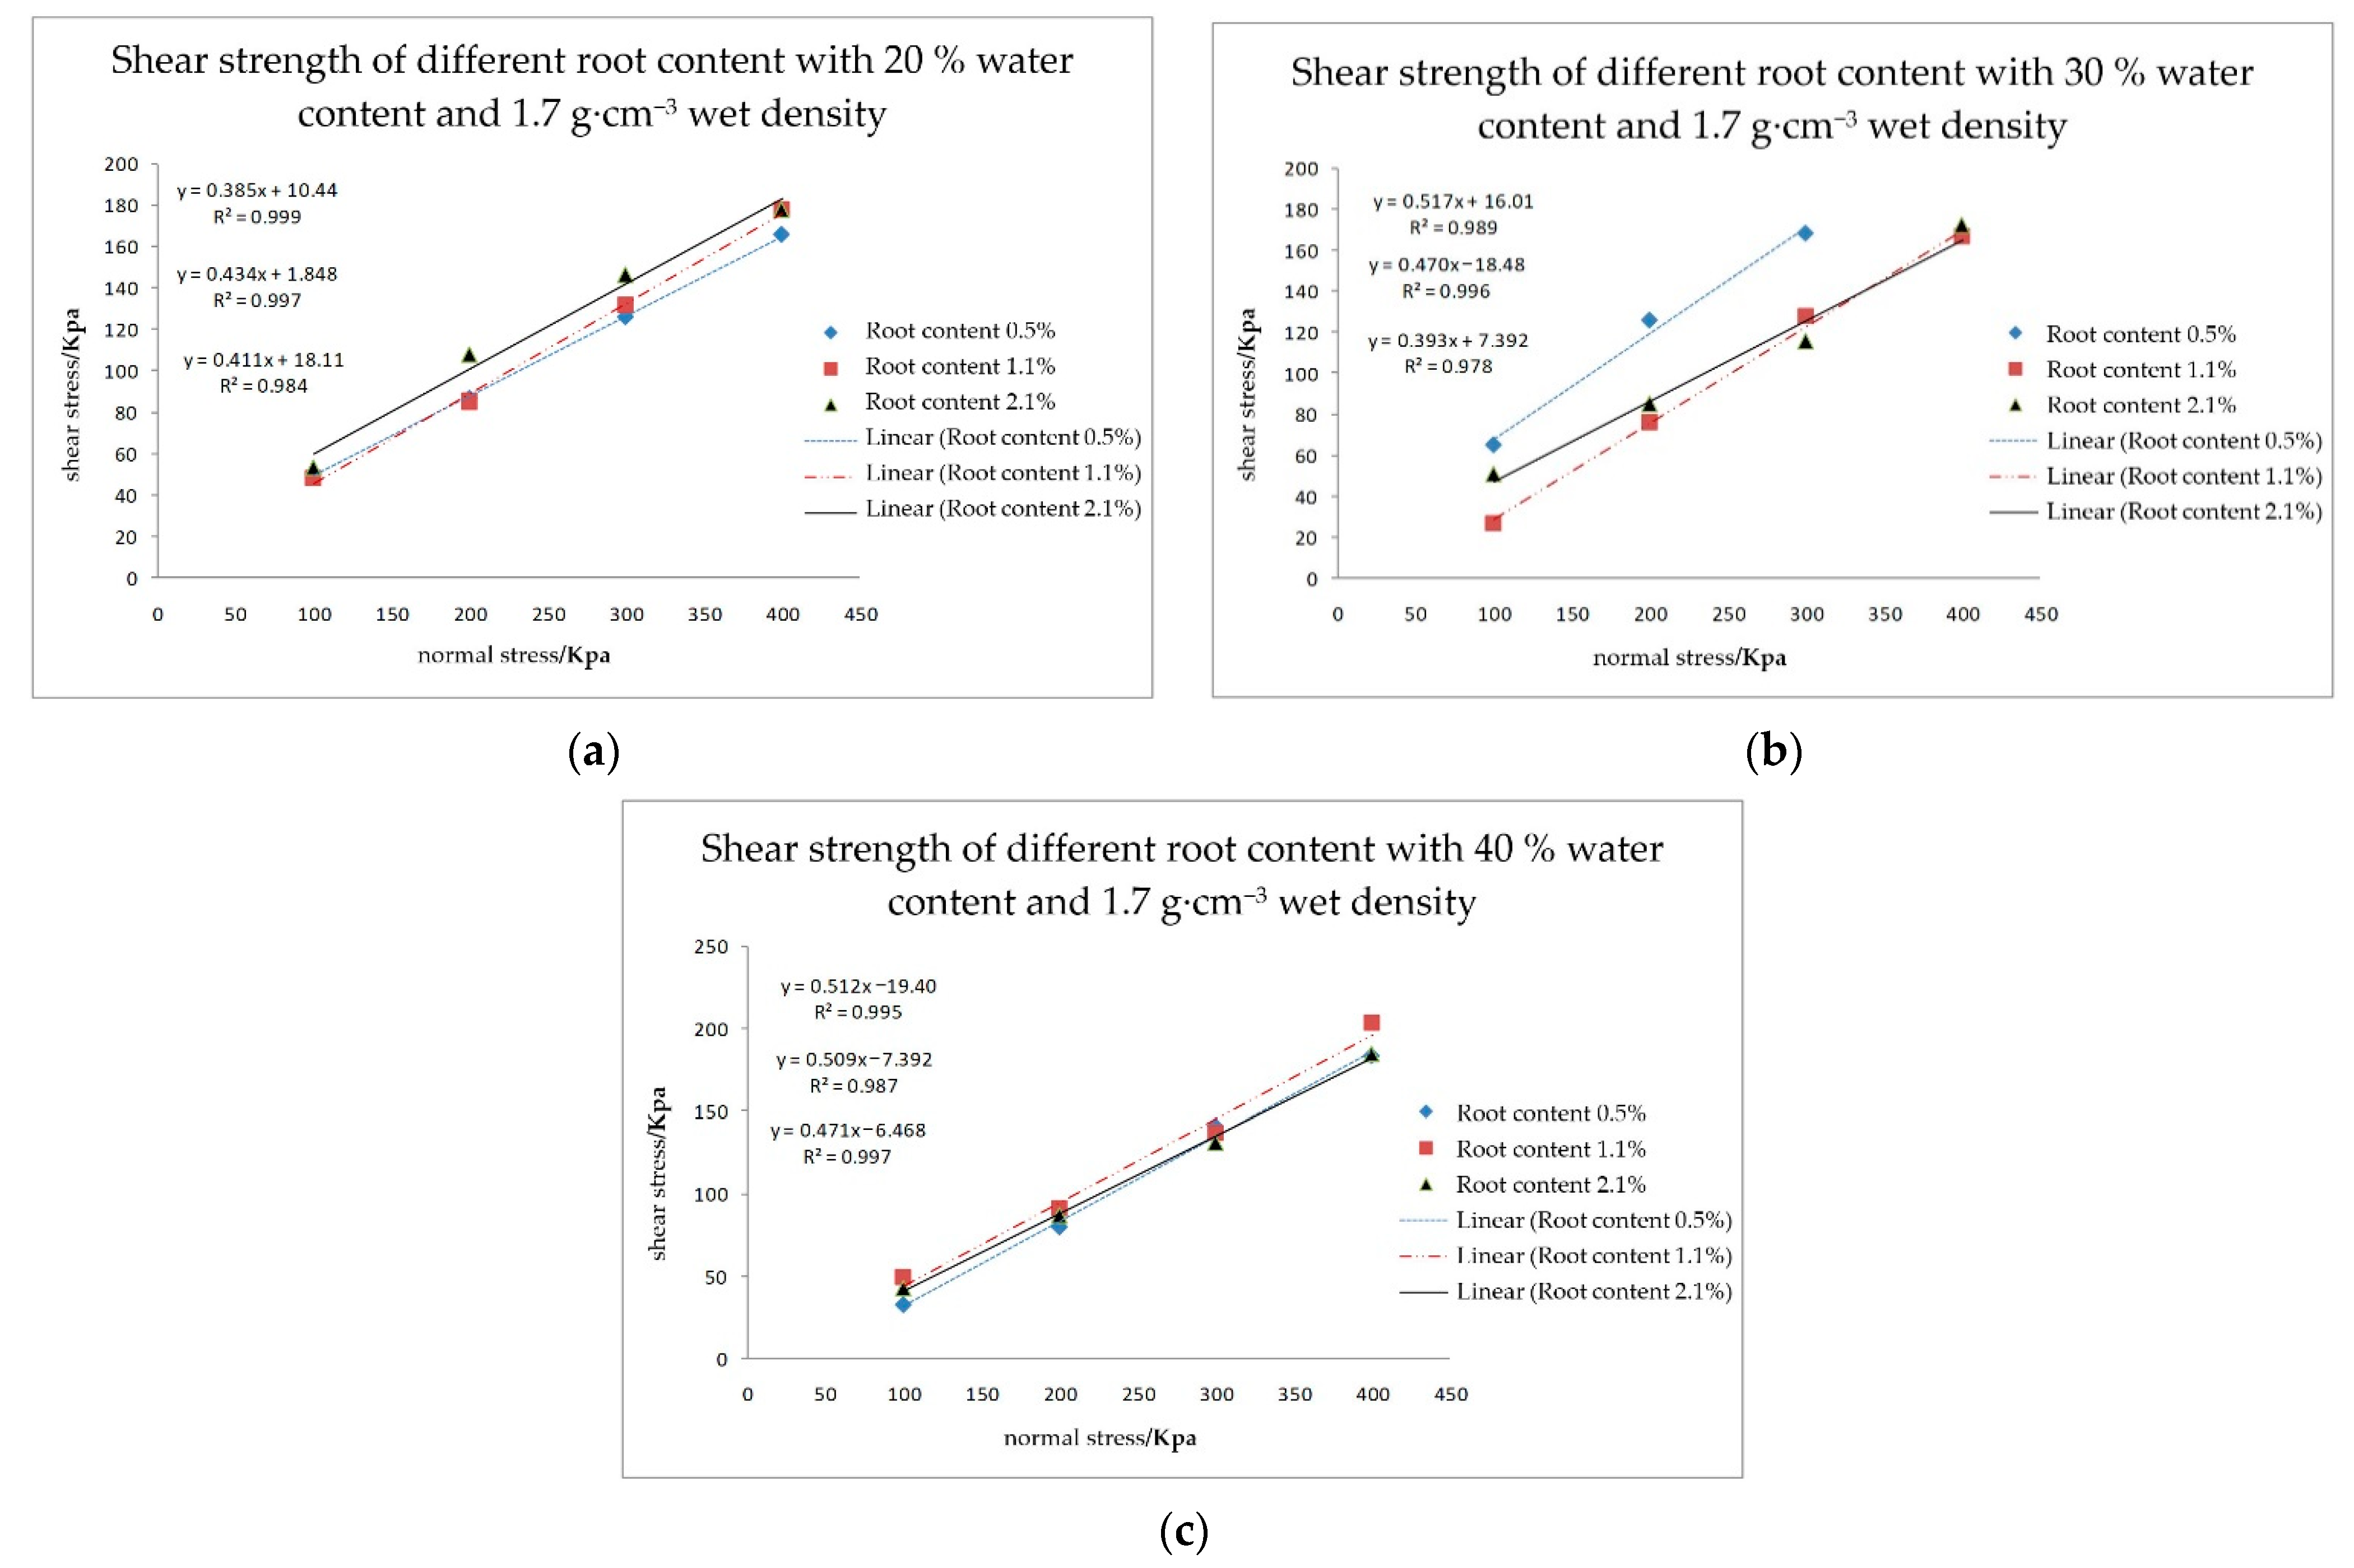
4.2.4. Shear Strength of Root–Soil Composite and Its Relationship with Root Content

Under the condition of fixed soil bulk density, comprehensive tests on shear strength of the root–soil compatible body were performed by two factors, water content and root content. Based on the results and the data in Table 7, the changes of shear strength τs, shear strength index Cs, and φs of the root–soil composite under the condition of fixed bulk density and water content are discussed.
When the soil bulk weight of the root–soil complex was 1.7 g·cm−3, the scatter plots of shear stress and normal stress with different root content at 20%, 30%, and 40% water content and their fitting lines are shown in Figure 5 respectively.
The shear strength of the root–soil composite increased with the increase of the root content and normal pressure when the bulk weight and water content were constant. The cohesion of Cs changed with the change of root content, and the change was large. When water content was 20%, the change of Cs was 16.26 kPa; when water content was 30%, the change of Cs was 34.49 kPa; when water content was 40%, the change of Cs was 27.6 kPa. The change of φs with root content was relatively small. When water content was 20%, the change of φs was 2.4°; when water content was 30%, the change of φs was 5.89°; when water content was 40%, the change of φs was 2.31°.
The above research also shows that, because of the high tensile and shear strength of the roots themselves, when mixed with the soil, the roots form reinforcing bars similar to those in reinforced concrete, which act as anchors for the soil. The root system strengthens the axial pressure of soil and significantly increases the cohesion of the root–soil complex. The increase of roots also increased the contact area between roots and soil and increased the amplitude of cohesion. However, it had little effect on the internal friction angle. Meng et al. [22] drew the same conclusions from their experiments, and in most studies [36,37,38], the conclusions are basically the same.

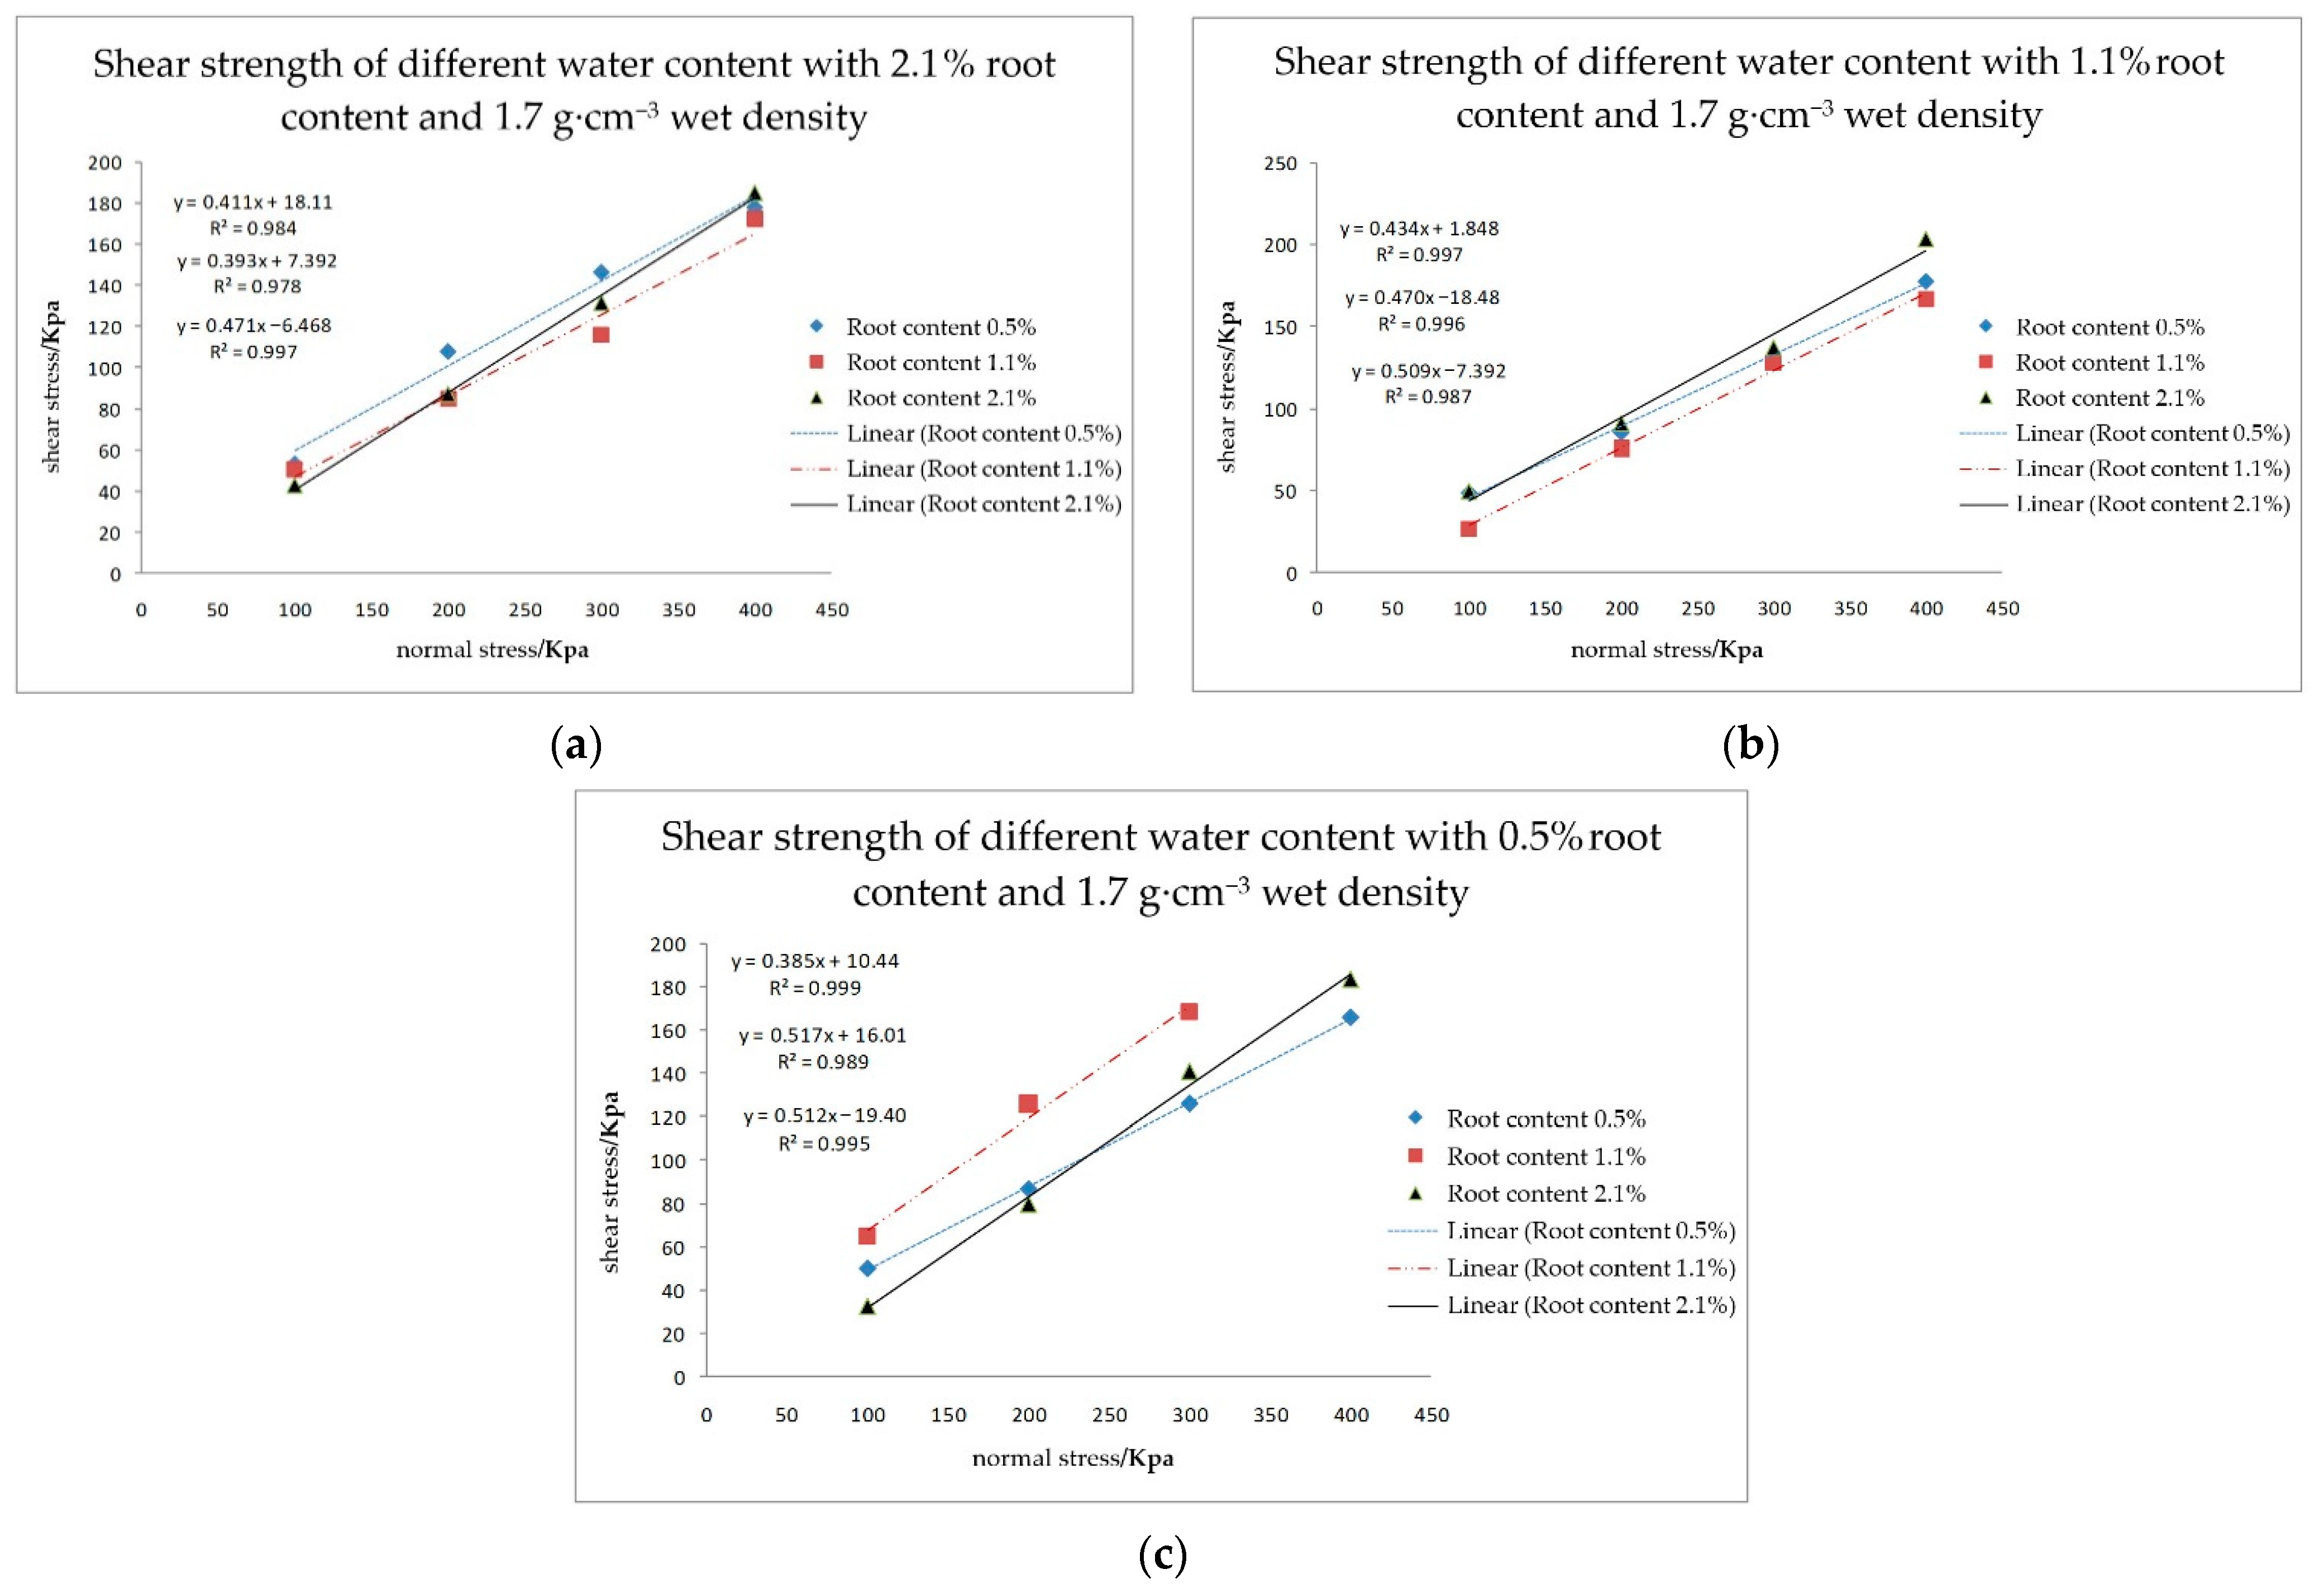
4.2.5. Shear Strength of the Root–Soil Composite and its Relationship with Water Content

Similarly, based on the data in Table 7, under the condition of fixed volume weight and root content, the shear strength τs of the root–soil composite due to different water content is discussed. The shear strength index Cs and φs of the root–soil composite due to different water content are also discussed.
When the soil bulk weight of the root–soil complex was 1.7 g·cm−3, the scatter plots of shear stress and normal stress with different water content at 2.1%, 1.1%, and 0.5% and their fitting lines are shown in Figure 6 respectively. From Figure 6, it can be seen that the shear strength of soils with different water content increased linearly with the increase of normal pressure when the bulk density and root content of the root–soil complex were constant, but the increase rate was different with different water content. Based on the characteristics that the root–soil complex is an elastic–plastic body and the Coulomb Equation, regression analysis was carried out on the above test data to obtain the relationship between vertical normal pressure and shear strength. The Cs value, tanφs value, φs value, and R2 value of each fitting line under different water content and root content are shown in Table 8.
In addition, when the unit weight, root content, and normal pressure of the root–soil composite were constant, the shear strength decreased gradually with the increase of water content. The change of Cs cohesion changed with the change of water content, and the change range was large. The change of Cs was 10.72 kPa when the root content was 2.1%, 20.33 kPa when the root content was 1.1%, and 29.84 kPa when the root content was 0.5%. When the root content reached a certain value, the main factor influencing the change of cohesion Cs changed from water content to root content, which means the influence of water content change was weakened. Additionally, φs changed relatively slightly with water content; the change of φs was 3.35° when the root content was 2.1%, 3.33° when the root content was 1.1%, and 6.28° when the root content was 0.5%. The range of φs varied from 21° to 27°. It can also be seen that when the root content was small, the water content had a greater influence on the friction angle φs in the root–soil composite. When the root content exceeded a certain value, the influence of water content was weakened and the root system played an important role in enhancing the shear strength of the root–soil composite.
From the above data, the relationship between cohesion–rooting content–water content and internal friction angle–rooting content–water content was constructed as shown in Figure 7 and Figure 8, respectively. From Figure 7, it can be seen that the cohesion of the root–soil complex was the smallest when the water content was around 30% and the root content was 1.1%. The cohesion of the root–soil complex increased with the decrease or increase of the water content and the decrease or increase of the root content. As shown in Figure 8, when the water content was 40% and the root content was 1.1%, the internal friction angle of the root–soil composite showed the minimum value. With the decrease of water content and the increase of root content, the internal friction angle of the root–soil composite gradually showed an increasing trend. The root content has a great influence on the internal friction angle. The influence of water content was relatively small. Fan et al. [24] found that increasing soil water content led to a significant decrease in soil–root bonding strength, which is consistent with the conclusions of this experiment. This also fits the general conclusions of other research fields on root–soil complexes [39,40,41].

5. Conclusions

Based on the method of orthogonal test design, the orthogonal test with three levels of factors (water content, bulk weight, and root content) was designed in this paper. The quick shear test of the remolded soil was carried out in the laboratory with the direct shear tester, and the experimental results were analyzed by range analysis. The trend diagram of each test index was drawn by each factor level, and then the ANOVA was carried out. According to the difference of significance levels of each influence factor, the orthogonal test results were analyzed by ANOVA. At a certain level of fixed bulk density, a complete test was carried out on the rooting content and water content at a high significance level. The corresponding stress–strain diagram and τs–σs relation curve were plotted. At the same time, the corresponding shear strength model fitting was carried out.
(1)
The influence of water content and bulk weight on the key indexes Cs and φs of shear strength of the root–soil composite first decreased and then increased, with extreme points and minimum values. The influence of root ratio on the key indexes Cs and φs of shear strength of the root–soil composite is mutually exclusive, i.e., the deterioration of φs occurred when the influencing factors were in favor of Cs and vice versa.
(2)
In the shear strength test of the root–soil composite, the main factors influencing Cs were root content, water content, error factor, and unit weight in turn. The main factors influencing φs were water content, root content, error factor, and unit weight in turn. The influence of bulk weight on the test index was not significant, while the water content and root content had significant influences on shear strength of the root–soil composite.
(3)
The indoor direct shear and fast shear tests of the root–soil composite samples showed that the root system enhanced the axial pressure of the soil and significantly increased the cohesion. The increase of roots also increased the contact area between roots and soil and increased the amplitude of cohesion, but it had little effect on the internal friction angle.

Author Contributions

Conceptualization, H.Z. (Huibin Zhu) and H.Z. (Haoran Zhao); methodology, H.Z. (Huibin Zhu); software, H.Z. (Huibin Zhu); validation, S.M., X.Z. and H.L.; resources, L.B.; data curation, H.Z. (Huibin Zhu); writing—original draft preparation, H.Z. (Huibin Zhu); writing—review and editing, H.Z. (Huibin Zhu) and H.Z. (Haoran Zhao); project administration, L.B. All authors have read and agreed to the published version of the manuscript.

Funding

This research was funded by the National Natural Science Foundation of China, grant number 51865022.

Institutional Review Board Statement

Not applicable.

Informed Consent Statement

Not applicable.

Data Availability Statement

The analyzed datasets are available from the corresponding author on reasonable request.

Conflicts of Interest

The authors declare no conflict of interest.

References

  1. He, J.; Li, H.W.; Wang, Q.J.; Gao, H.W.; Li, W.Y.; Zhang, X.M.; McGiffen, M. The adoption of conservation tillage in China. Ann. N. Y. Acad. Sci. 2010, 1195 (Suppl. S1), E96–E106. [Google Scholar] [CrossRef] [PubMed]
  2. Kuhn, N.J.; Hu, Y.; Bloemertz, L.; He, J.; Li, H.; Greenwood, P. Conservation tillage and sustainable intensification of agriculture: Regional vs. global benefit analysis. Agric. Ecosyst. Environ. 2016, 216, 155–165. [Google Scholar] [CrossRef]
  3. Pittelkow, C.M.; Liang, X.; Linquist, B.A.; van Groenigen, K.J.; Lee, J.; Lundy, M.E.; van Gestel, N.; Six, J.; Venterea, R.T.; van Kessel, C. Productivity limits and potentials of the principles of conservation agriculture. Nature 2015, 517, 365–368. [Google Scholar] [CrossRef] [PubMed]
  4. Zhang, Q.; Wang, S.; Sun, Y.; Zhang, Y.; Li, H.; Liu, P.; Wang, X.; Wang, R.; Li, J. Conservation tillage improves soil water storage, spring maize (Zea mays L.) yield and WUE in two types of seasonal rainfall distributions. Soil Tillage Res. 2022, 215, 105237. [Google Scholar] [CrossRef]
  5. Araya, S.N.; Mitchell, J.P.; Hopmans, J.W.; Ghezzehei, T.A. Long-term impact of cover crop and reduced disturbance tillage on soil pore size distribution and soil water storage. Soil 2022, 8, 177–198. [Google Scholar] [CrossRef]
  6. Bilen, S.; Jacinthe, P.-A.; Shrestha, R.; Jagadamma, S.; Nakajima, T.; Kendall, J.R.A.; Doohan, T.; Lal, R.; Dick, W. Greenhouse gas fluxes in a no-tillage chronosequence in Central Ohio. Soil Tillage Res. 2022, 218, 105313. [Google Scholar] [CrossRef]
  7. Liu, Z.; Gu, H.; Liang, A.; Li, L.; Yao, Q.; Xu, Y.; Liu, J.; Jin, J.; Liu, X.; Wang, G. Conservation tillage regulates the assembly, network structure and ecological function of the soil bacterial community in black soils. Plant Soil 2022, 472, 207–223. [Google Scholar] [CrossRef]
  8. Xu, P.; Li, G.; Houlton, B.Z.; Ma, L.; Ai, D.; Zhu, L.; Luan, B.; Zhai, S.; Hu, S.; Chen, A.; et al. Role of Organic and Conservation Agriculture in Ammonia Emissions and Crop Productivity in China. Environ. Sci. Technol. 2022, 56, 2977–2989. [Google Scholar] [CrossRef]
  9. Yang, H.; Wu, G.; Mo, P.; Chen, S.; Wang, S.; Xiao, Y.; Ma, H.a.; Wen, T.; Guo, X.; Fan, G. The combined effects of maize straw mulch and no-tillage on grain yield and water and nitrogen use efficiency of dry-land winter wheat (Triticum aestivum L.). Soil Tillage Res. 2020, 197, 104485. [Google Scholar] [CrossRef]
  10. Farahani, E.; Emami, H.; Forouhar, M. Effects of tillage systems on soil organic carbon and some soil physical properties. Land Degrad. Dev. 2022, 33, 1307–1320. [Google Scholar] [CrossRef]
  11. Malasli, M.Z.; Celik, A. Disc angle and tilt angle effects on forces acting on a single-disc type no-till seeder opener. Soil Tillage Res. 2019, 194, 104304. [Google Scholar] [CrossRef]
  12. Rafiq, M.H.; Ahmad, R.; Jabbar, A.; Munir, H.; Hussain, M. Influence of Different No-till Techniques at Varying Heights of Standing Rice Stubbles on the Wheat Performance. Int. J. Agric. Biol. 2017, 19, 410–416. [Google Scholar] [CrossRef]
  13. Prosdocimi, M.; Jordan, A.; Tarolli, P.; Keesstra, S.; Novara, A.; Cerda, A. The immediate effectiveness of barley straw mulch in reducing soil erodibility and surface runoff generation in Mediterranean vineyards. Sci. Total Environ. 2016, 547, 323–330. [Google Scholar] [CrossRef] [PubMed] [Green Version]
  14. Turmel, M.-S.; Speratti, A.; Baudron, F.; Verhulst, N.; Govaerts, B. Crop residue management and soil health: A systems analysis. Agric. Syst. 2015, 134, 6–16. [Google Scholar] [CrossRef]
  15. Bogunovic, I.; Pereira, P.; Kisic, I.; Sajko, K.; Sraka, M. Tillage management impacts on soil compaction, erosion and crop yield in Stagnosols (Croatia). Catena 2018, 160, 376–384. [Google Scholar] [CrossRef]
  16. Kumar, V.; Ladha, J.K. Direct Seeding of Rice: Recent Developments and Future Research Needs. Adv. Agron. 2011, 111, 297–413. [Google Scholar]
  17. Burak, E.; Dodd, I.C.; Quinton, J.N. Do root hairs of barley and maize roots reinforce soil under shear stress? Geoderma 2021, 383, 114740. [Google Scholar] [CrossRef]
  18. Feng, T.; Li, G.; Hu, W.; Chen, X.; Zhao, P. Experimental study on the influence of arborwood root on the shear strength of root-soil composite. Chin. J. Appl. Mech. 2018, 35, 517–523. [Google Scholar] [CrossRef]
  19. Meijer, G.J. A generic form of fibre bundle models for root reinforcement of soil. Plant Soil 2021, 468, 45–65. [Google Scholar] [CrossRef]
  20. Liu, Y.; Hu, X.; Yu, D.; Li, S.; Yang, Y. Microstructural features and friction characteristics of the interface of shrub roots and soil in loess area of Xining Basin. Chin. J. Rock Mech. Eng. 2018, 37, 1270–1280. [Google Scholar] [CrossRef]
  21. Zheng, L.; Luo, X.; Zeng, S.; Wang, Z.; Liu, C.; Qi, X. Shear characteristics of rice root-soil composite. Trans. Chin. Soc. Agric. Mach. 2017, 48, 63–71. [Google Scholar]
  22. Meng, S.; Zhao, G.; Yang, Y.; Ye, X. Impact of Plant Root Morphology on Rooted-Soil Shear Resistance Using Triaxial Testing. Adv. Civ. Eng. 2020, 2020, 8825828. [Google Scholar] [CrossRef]
  23. Hou, L.; Gao, W.; der Bom, F.; Weng, Z.; Doolette, C.L.; Maksimenko, A.; Hausermann, D.; Zheng, Y.; Tang, C.; Lombi, E.; et al. Use of X-ray tomography for examining root architecture in soils. Geoderma 2022, 405, 115405. [Google Scholar] [CrossRef]
  24. Fan, C.-C.; Lu, J.Z.; Chen, H.H. The pullout resistance of plant roots in the field at different soil water conditions and root geometries. Catena 2021, 207, 105593. [Google Scholar] [CrossRef]
  25. Ji, X.; Chen, L.; Zhang, A. Anchorage properties at the interface between soil and roots with branches. J. For. Res. 2016, 28, 83–93. [Google Scholar] [CrossRef]
  26. Liu, X.P.; Zhang, W.J.; Wang, X.Y.; Cai, Y.J.; Chang, J.G. Root-soil air gap and resistance to water flow at the soil-root interface of Robinia pseudoacacia. Tree Physiol. 2015, 35, 1343–1355. [Google Scholar] [CrossRef] [PubMed] [Green Version]
  27. Fan, C.-C.; Tsai, M.-H. Spatial distribution of plant root forces in root-permeated soils subject to shear. Soil Tillage Res. 2016, 156, 1–15. [Google Scholar] [CrossRef]
  28. Kokutse, N.K.; Temgoua, A.G.T.; Kavazović, Z. Slope stability and vegetation: Conceptual and numerical investigation of mechanical effects. Ecol. Eng. 2016, 86, 146–153. [Google Scholar] [CrossRef]
  29. Roue, J.; Chauvet, H.; Brunel-Michac, N.; Bizet, F.; Moulia, B.; Badel, E.; Legue, V. Root cap size and shape influence responses to the physical strength of the growth medium in Arabidopsis thaliana primary roots. J. Exp. Bot. 2020, 71, 126–137. [Google Scholar] [CrossRef]
  30. Alam, M.; Jiang, Y.-J.; Umar, M.; Su, L.-J.; Rahman, M.; Ullah, F. Influence of drainage and root biomass on soil mechanical behavior in triaxial tests. Acta Geotech. 2021, 17, 2875–2893. [Google Scholar] [CrossRef]
  31. Peixoto, D.S.; Silva, L.; Melo, L.B.B.; Azevedo, R.P.; Araujo, B.C.L.; Carvalho, T.S.; Moreira, S.G.; Curi, N.; Silva, B.M. Occasional tillage in no-tillage systems: A global meta-analysis. Sci. Total Environ. 2020, 745, 140887. [Google Scholar] [CrossRef] [PubMed]
  32. Jiang, J.; Gao, H.; Gong, L. Experimental study on the mechanism of cutting and digging corn rootstalk for no-tillage planter. Trans. Chin. Soc. Agric. Mach 2007, 9, 63–66. [Google Scholar]
  33. Yin, Z.-Y.; Jin, Y.-F.; Shen, J.S.; Hicher, P.-Y. Optimization techniques for identifying soil parameters in geotechnical engineering: Comparative study and enhancement. Int. J. Numer. Anal. Methods Geomech. 2018, 42, 70–94. [Google Scholar] [CrossRef]
  34. Wang, Y.; Guan, Z.; Zhao, T. Sample size determination in geotechnical site investigation considering spatial variation and correlation. Can. Geotech. J. 2019, 56, 992–1002. [Google Scholar] [CrossRef]
  35. Cai, Z.; Wang, F.; Gao, C.; He, N.; Liu, X. Standard for Geotechnical Test Methods; China Planning Press: Beijing, China, 2019. [Google Scholar]
  36. Sui, Z.; Yi, W.; Lu, Y.; Deng, L. Experimental and Numerical Simulation Study on the Shear Strength Characteristics of Magnolia multiflora Root-Soil Composites. Adv. Civ. Eng. 2021, 2021, 6642594. [Google Scholar] [CrossRef]
  37. Temgoua, A.G.T.; Kokutse, N.K.; Kavazović, Z. Influence of forest stands and root morphologies on hillslope stability. Ecol. Eng. 2016, 95, 622–634. [Google Scholar] [CrossRef]
  38. Feng, B.; Zong, Q.; Cai, H.; Chen, Z.; Wang, J. Calculation of increased soil shear strength from desert plant roots. Arab. J. Geosci. 2019, 12, 525. [Google Scholar] [CrossRef]
  39. Lian, B.; Peng, J.; Zhan, H.; Wang, X. Mechanical response of root-reinforced loess with various water contents. Soil Tillage Res. 2019, 193, 85–94. [Google Scholar] [CrossRef]
  40. Tan, H.; Chen, F.; Chen, J.; Gao, Y. Direct shear tests of shear strength of soils reinforced by geomats and plant roots. Geotext. Geomembr. 2019, 47, 780–791. [Google Scholar] [CrossRef]
  41. Veylon, G.; Ghestem, M.; Stokes, A.; Bernard, A. Quantification of mechanical and hydric components of soil reinforcement by plant roots. Can. Geotech. J. 2015, 52, 1839–1849. [Google Scholar] [CrossRef]
Figure 1. Location map of the study area.
Agriculture 12 01045 g001
Figure 2. Particle size grading diagram of the test soil samples. Note: (a) 0–10 cm soil sample; (b) 10–20 cm soil sample; (c) 20–30 cm soil sample.
Agriculture 12 01045 g002
Figure 3. Trend diagram of test factors and indexes. Note: (a) the effect of water content on cohesion. (b) the effect of volume weight on cohesion. (c) the effect of root content on cohesion. (d) the effect of water content on friction angle. (e) the effect of volume weight on friction angle. (f) the effect of root content on friction angle.
Agriculture 12 01045 g003
Figure 4. Relationship between shear stress and shear deformation of samples with 20%, 30%, and 40% water content. Note: (a) 20.5% water content, 1.7g·cm−3 wet density, 2.1% root content. (b) 20.5% water content, 1.7 g·cm−3 wet density, 1.1% root content. (c) 20.5% water content, 1.7 g·cm−3 wet density, 0.5% root content. (d) 27.02% water content, 1.7 g·cm−3 wet density, 2.1% root content. (e) 27.02% water content, 1.7 g·cm−3 wet density, 1.1% root content. (f) 27.02% water content, 1.7 g·cm−3 wet density, 0.5% root content. (g) 37% water content, 1.7 g·cm−3 wet density, 2.1% root content. (h) 37% water content, 1.7 g·cm−3 wet density, 1.1% root content. (i) 37% water content, 1.7 g·cm−3 wet density, 0.5% root content.
Agriculture 12 01045 g004
Figure 5. For each sample with 20%, 30%, and 40% water content τs−σs scatter plot and fitting line. Note: (a) 20% water content, 1.7g·cm−3 wet density. (b) 30% water content, 1.7g·cm−3 wet density. (c) 40% water content, 1.7g·cm−3 wet density.
Agriculture 12 01045 g005
Figure 6. τss scatter plot and fitting line of each sample with root content of 2.1%, 1.1%, and 0.5%. Note: (a) 2.1% root content, 1.7 g·cm−3 wet density. (b) 1.1% root content, 1.7 g·cm−3 wet density. (c) 0.5% root content, 1.7 g·cm−3 wet density.
Agriculture 12 01045 g006
Figure 7. Relationship between cohesion, root content, and water content. Note: (a) is a three-dimensional surface between the three and (b) is an equivalent curve.
Agriculture 12 01045 g007
Figure 8. Relationship between friction angle, root content, and water content. Note: (a) is a three-dimensional surface between the three and (b) is an equivalent curve.
Agriculture 12 01045 g008
Table 1. Original solidity, water content, and wet bulk density of soil samples.
Depth/cmSolidness/kPaMoisture Content/%Wet Volume Weight/g·cm−3
0–1065537.761.55
10–20140030.271.79
20–30177522.961.99
Table 2. Level table of testing factors for the mechanical characteristics of rice straw.
FactorLevel
123
Water content (A)/%20 (A1)30 (A2)40 (A3)
Volume weight (B)/g·cm−31.5 (B1)1.7 (B2)1.9 (B3)
Root content (C)/%0.5 (C1)1.1 (C2)2.1 (C3)
Table 3. Orthogonal test scheme for the shear strength test of the root–soil composite.
Test No.Factors of the TestTest Index
ABCDCsφs
(Water Content/%)(Volume Weight/g·cm−3)(Root Content/%)(Blank)(Cohesion)/kPa(Friction Angle)/°
11 (20)1 (1.5)1 (0.5)1
212 (1.7)2 (1.1)2
313 (1.9)3 (2.1)3
42 (30)123
52231
62312
73 (40)132
83213
93321
Table 4. Particle composition of the test soil samples.
Scheme. Coarse Grain GroupFine Grain Group
SandPowder ParticleClay Particles
CoarseMediumFineExtremely Fine
1~0.50.5~0.250.25~0.10.1~0.050.05~0.010.01~0.002<0.002
1 (0–10)1.986.4621.5616251316
2 (10–20)1.244.0625.219.52516.58.5
3 (20–30)0.420.2221.3616301814
Table 5. Range analysis table of shear strength of the root–soil composite.
Test No.Factors of the Test
A
(Water Content/%)
B
(Volume Weight/g·cm−3)
C
(Root Content/%)
D
(Blank)
Cs
(Cohesion)/kPa
φs
(Friction Angle)/°
CsK139.26808.4160−3.23406.9300
CsK2−9.24008.3160−12.93601.4860
CsK30.562013.858046.760022.1740
Csk113.08932.8053−1.07802.3100
Csk2−3.08002.7720−4.31200.4953
Csk30.18734.619315.58677.3913
Cs range R16.16931.847319.89876.8960
Priority
order
C > A > D > B
φs K167.6371.2969.4471.89
φs K266.4769.1473.7069.77
φs K375.7669.4366.7268.20
φs k122.5423.7623.1523.96
φs k222.1623.0524.5723.26
φs k325.2523.1422.2422.73
φs range R3.100.722.331.23
Priority
order
A > C > D > B
Table 6. Variance analysis of shear srength of root–soil composites.
Test No.Factors of the TestIndex of the Test
A
(Water Content)/%
B
(Volume Weight)/g·cm−3
C
(Root Content)/%
D
(Blank)
Cs
(Cohesion)/kPa
φs
(Friction Angle)/°
(Cs k1)21541.9870.8310.4648.02∑Cs = 30.59
(Cs k2)285.3869.16167.342.21
(Cs k3)20.32192.042186.50491.69 C s ¯ = 5.10
Square of deviance of Cs is S438.586.70684.1376.67
Freedom of Cs is f2222
Variance of Cs is V219.293.35342.0638.33
Fj value of Cs5.720.099.02
Obvious* (0.25)NS** (0.10)
(φs k1)4573.585082.114822.005168.43 ∑φs = 209.87
(φs k2)4418.864780.8165432.374868.31
(φs k3)5740.224821.184451.804651.52 φ s ¯ = 34.98
Square of deviance of φs is S17.090.908.262.29
Freedom of φs is f2222
Variance of φs is V8.550.454.131.14
Fj value of φs7.480.403.61
obvious* (0.25)NS* (0.25)
F0.25(2,2)3
F0.10(2,2)9
Note: ** (0.10) means extremely significant at the significance level of 0.1, * (0.25) means significant at the significance level of 0.25, and NS means not significant.
Table 7. Testing of Water Content and Root Content on Shear Strength and Index of Root–soil Composite.
Test No.Factors of the TestTest Index
Water Content/%Root Content/%Cohesion Cs/kPaFriction Angle φs/°
a1202.118.1122.34
a2201.11.8523.46
a3200.510.4421.06
b1302.17.3921.45
b2301.1−18.4825.17
b3300.516.0127.34
c1402.18.3224.80
c2401.1−7.8526.79
c3400.5−19.4027.11
Table 8. Coefficient table of fitted equations with different moisture contents and root contents at the same volume weight.
Water Content/%Root Content/%Cs/kPatanφsφsR2
200.510.4400.38521.060.999
1.11.8480.43423.460.997
2.118.1100.41122.340.984
300.516.0100.51727.340.989
1.1−18.4800.47025.170.996
2.17.3920.39321.450.978
400.519.4000.51227.110.995
1.1−7.3920.50926.980.987
2.1−6.4680.47125.220.997
Publisher’s Note: MDPI stays neutral with regard to jurisdictional claims in published maps and institutional affiliations.

