Article

Development of an Energy Efficient and Fully Autonomous Low-Cost IoT System for Irrigation Scheduling in Water-Scarce Areas Using Different Water Sources

by
Zisis Tsiropoulos
1,2,*,
Evangelos Skoubris
2,3,
Spyros Fountas
4,
Ioannis Gravalos
5 and
Theofanis Gemtos
1
1
Department of Agriculture Crop Production and Rural Environment, University of Thessaly, 38446 Volos, Greece
2
Agricultural and Environmental Solutions (AGENSO), Markou Mpotsari 47, 11742 Athens, Greece
3
Department of Surveying and Geoinformatics Engineering, School of Engineering, Agiou Spyridonos, University of West Attica, 12243 Egaleo, Greece
4
Department of Natural Resources Management and Agricultural Engineering, Agricultural University of Athens, 11855 Athens, Greece
5
Department of Agrotechnology, School of Agricultural Sciences, University of Thessaly, Periferiaki odos Larissas—Trikalon, 41500 Larissa, Greece
*
Author to whom correspondence should be addressed.
Agriculture 2022, 12(7), 1044; https://doi.org/10.3390/agriculture12071044
Submission received: 27 June 2022 / Revised: 11 July 2022 / Accepted: 13 July 2022 / Published: 18 July 2022
(This article belongs to the Topic Water Management in the Era of Climatic Change)

Abstract

:
Politicians and the general public are concerned about climate change, water scarcity, and the constant reduction in agricultural land. Water reserves are scarce in many regions in the world, negatively affecting agricultural productivity, which makes it a necessity to introduce sustainable water resource management. Nowadays, there is a number of commercial IoT systems for irrigation scheduling, helping farmers to manage and save water. However, these systems focus on using the available fresh water sources, without being able to manage alternative water sources. In this study, an Arduino-based low-cost IoT system for automated irrigation scheduling is developed and implemented, which can provide measurements of water parameters with high precision using low-cost sensors. The system used weather station data combined with the FAO56 model for computing the water requirements for various crops, and it was capable of handling and monitoring different water streams by supervising their quality and quantity. The developed IoT system was tested in several field trials, to evaluate its capabilities and functionalities, including the sensors’ accuracy, its autonomous controlling and operation, and its power consumption. The results of this study show that the system worked efficiently on the management and monitoring of different types of water sources (rainwater, groundwater, seawater, and wastewater) and on automating the irrigation scheduling. In addition, it was proved that the system is can be used for long periods of time without any power source, making it ideal for using it on annual crops.

1. Introduction

Globally, the effects of climate change are evident and affect the daily lives of people and the planet. One of its effects is water shortages in a large number of regions across the world. Water scarcity often results in reduced agricultural productivity due to shortages and/or poor water quality. Taking into consideration that agriculture consumes 70 percent of the available freshwater [1] with low efficiency [2], the need to find sustainable water resource management solutions becomes imperative.
Most of the existing research reports in the field of irrigation scheduling focus on the development of low-cost IoT-based solutions [3,4,5], the use of machine learning and fuzzy logic [6,7,8], and the use of different irrigation methods and models [9,10,11]. A comprehensive analysis regarding the research on smart irrigation systems was reported by García et al. [12], where a detailed overview on the recent trends on sensors and IoT systems for irrigation was presented. At the commercial level, there are many IoT systems that have been developed for multiple agricultural purposes, including irrigation (e.g., Libelium [13] and iMetos [14]). However, some of them only focus on weather and soil monitoring without taking into account crop water requirements (e.g., WatchDog [15] and Netsens [16]).
Recently, significant research has been reported on the development of IoT systems for water monitoring both in terms of quality and quantity [17,18,19,20]. A large number of these systems focuses on monitoring natural water sources, such as lakes and rivers [21,22,23]. Following the research performed in water monitoring, a lot of systems are commercially available with the most well-known being Libelium [13], as its price is relatively low compared to other solutions, but none can control different water sources for irrigation scheduling.
Following the Industry 4.0 revolution, a large variety of low-cost processors, controllers, electronic components, and sensors have become available, which can be used for developing low-cost IoT solutions. The most common example is the Arduino open-source microcontroller-based development board [24]. These boards provide, at a very low cost, all the characteristics needed for developing a monitoring/actuating device, namely, an embedded microprocessor, connections for power supply, analogue and digital I/O channels for interfacing with peripheral devices (e.g., sensors), dedicated channels (e.g., USB communication port), and a vast variety of different modules for various purposes (e.g., GSM modules). In addition, the extensive use of Arduino boards by a large community has allowed the establishment of a broad range of supported features, making these boards mature enough, and with great reliability and flexibility, which is necessary for precision agriculture applications [25]. For this reason, significant research has been reported during the last years on developing Arduino-based solutions for agriculture [26,27,28] and water monitoring [29,30]. Following this trend, the extensive use of Arduino boards has contributed to the development and further availability of a variety of low-cost sensors in the market, whose efficiency in agriculture has been investigated with positive results [31,32,33].
As agriculture may be conducted in an open environment, wireless data transmission is required. Many different types of wireless data communication protocols are used in agriculture [34], including broadband cellular network technology protocols (GPRS, 4G, and 5G), LPWA—Low Power Wide Area Network protocols (LoRaWAN, SigFOx, NB-IoT, and LTE-M), WLAN—wireless LAN protocols (Wi-Fi), and IEEE 802.15 Protocols (ZigBee and Bluetooth). Each one of them has its advantages and disadvantages in terms of power consumption, range coverage, and data collection rate.
In this context, the HYDROUSA H2020 project [35] objectives were the sustainable management of water and the increase in agricultural production in water-scarce areas by applying precision irrigation using water that comes from a variety of water sources (rainwater, groundwater, seawater, and wastewater). Therefore, the main aim of this study is to develop a reliable and accurate low-cost IoT system to monitor and control irrigation scheduling, which is able to operate using different water sources. To achieve this, the system was: (i) developed using open source hardware for minimizing its cost, (ii) capable of supporting a variety of sensors and actuators, (iii) evaluated for its accuracy, and (iv) validated for its functionality and capabilities on using different water sources for automating irrigation scheduling.
The innovation of the present study is the design and development of an Arduino-based low-cost IoT node with extensive energy autonomy, capable of autonomously handling the various water sources and applying precision irrigation based on weather data and plant requirements. This study can contribute to increasing irrigation sustainability, especially in water-scarce areas, as water coming from alternative water sources can be used for irrigation, minimizing the use of the conventional irrigation water sources.

2. Materials and Methods

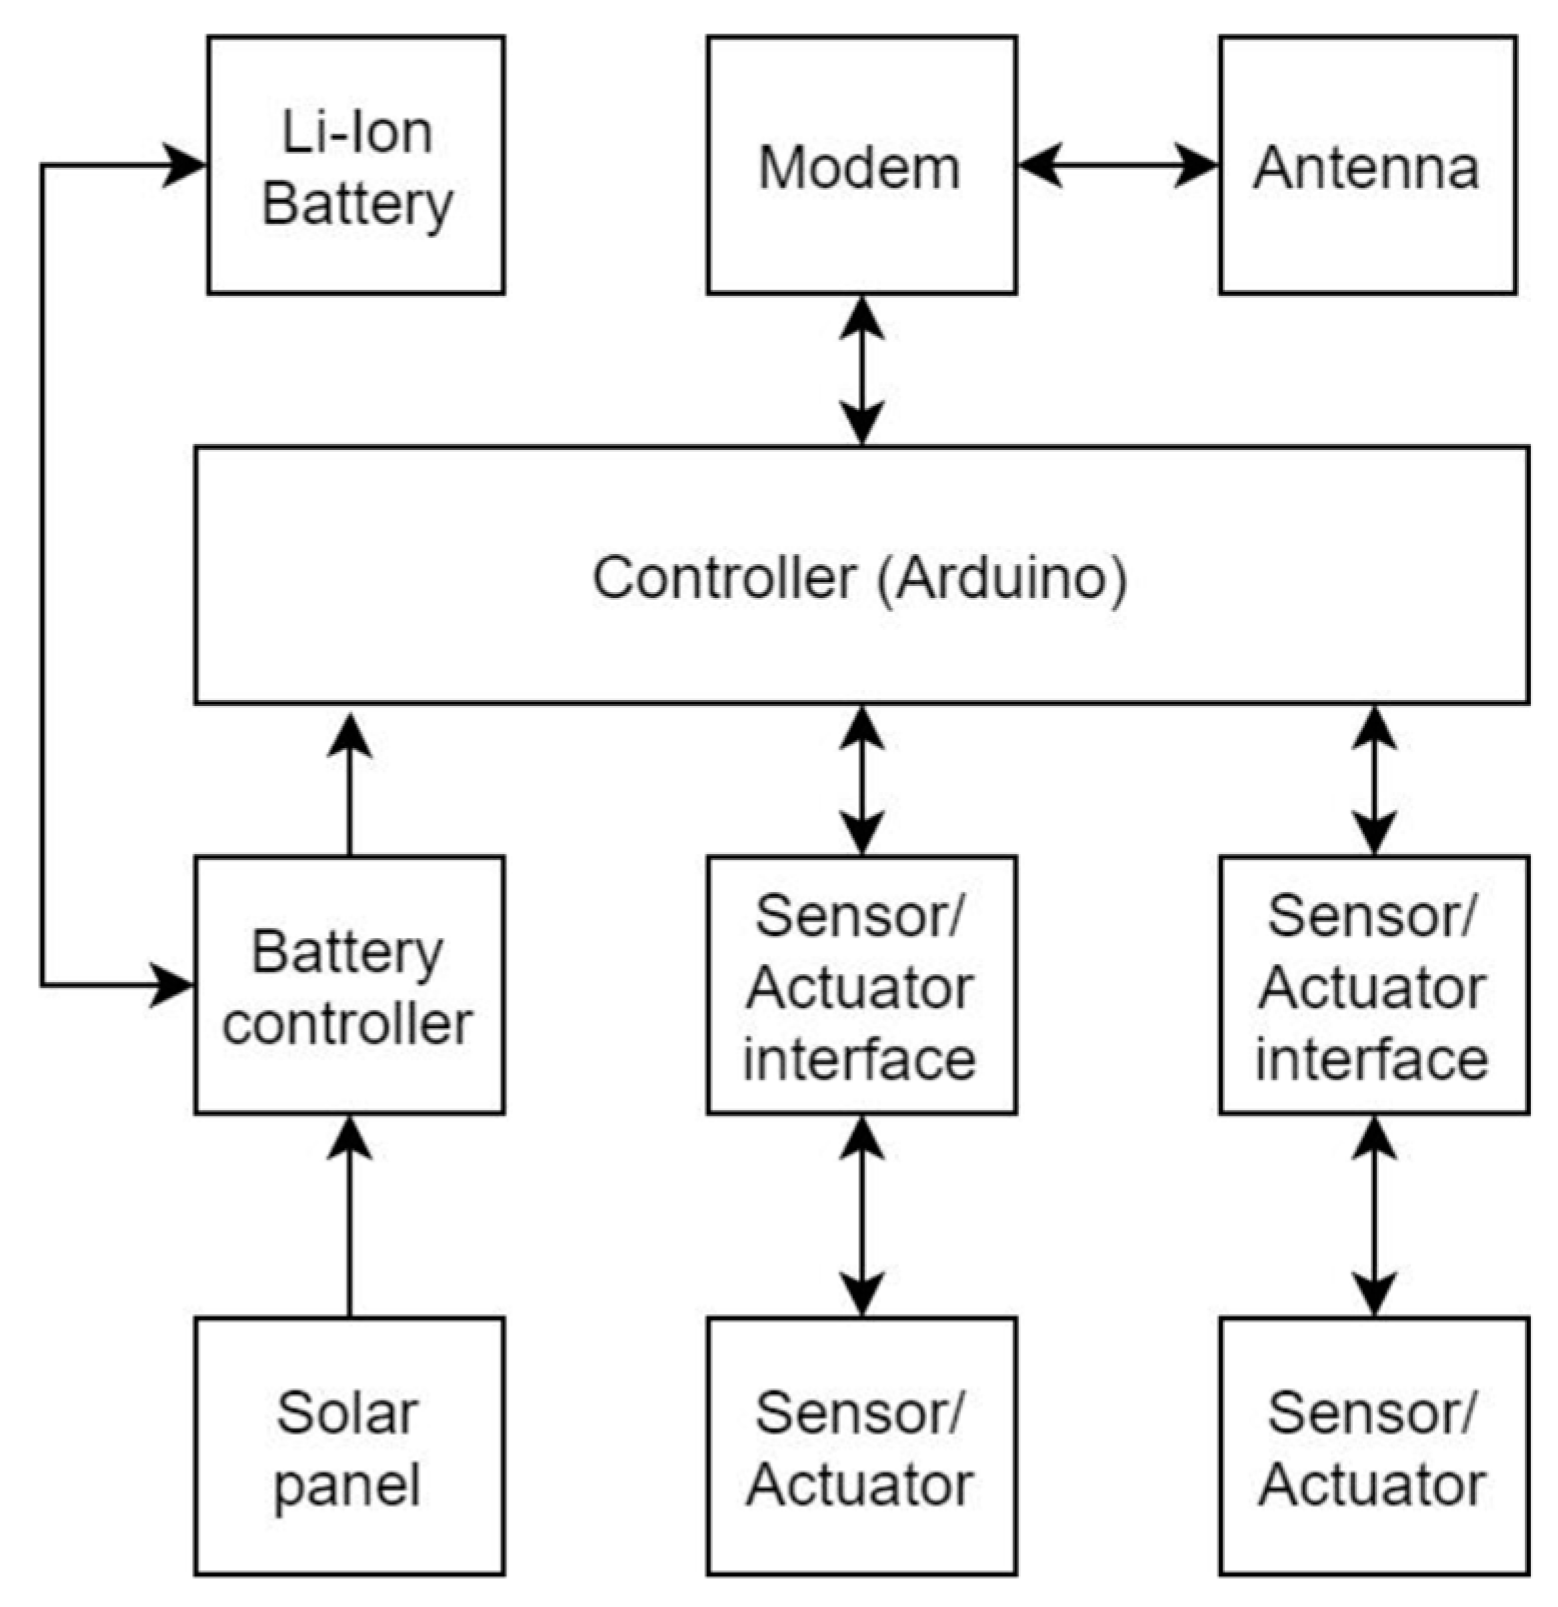
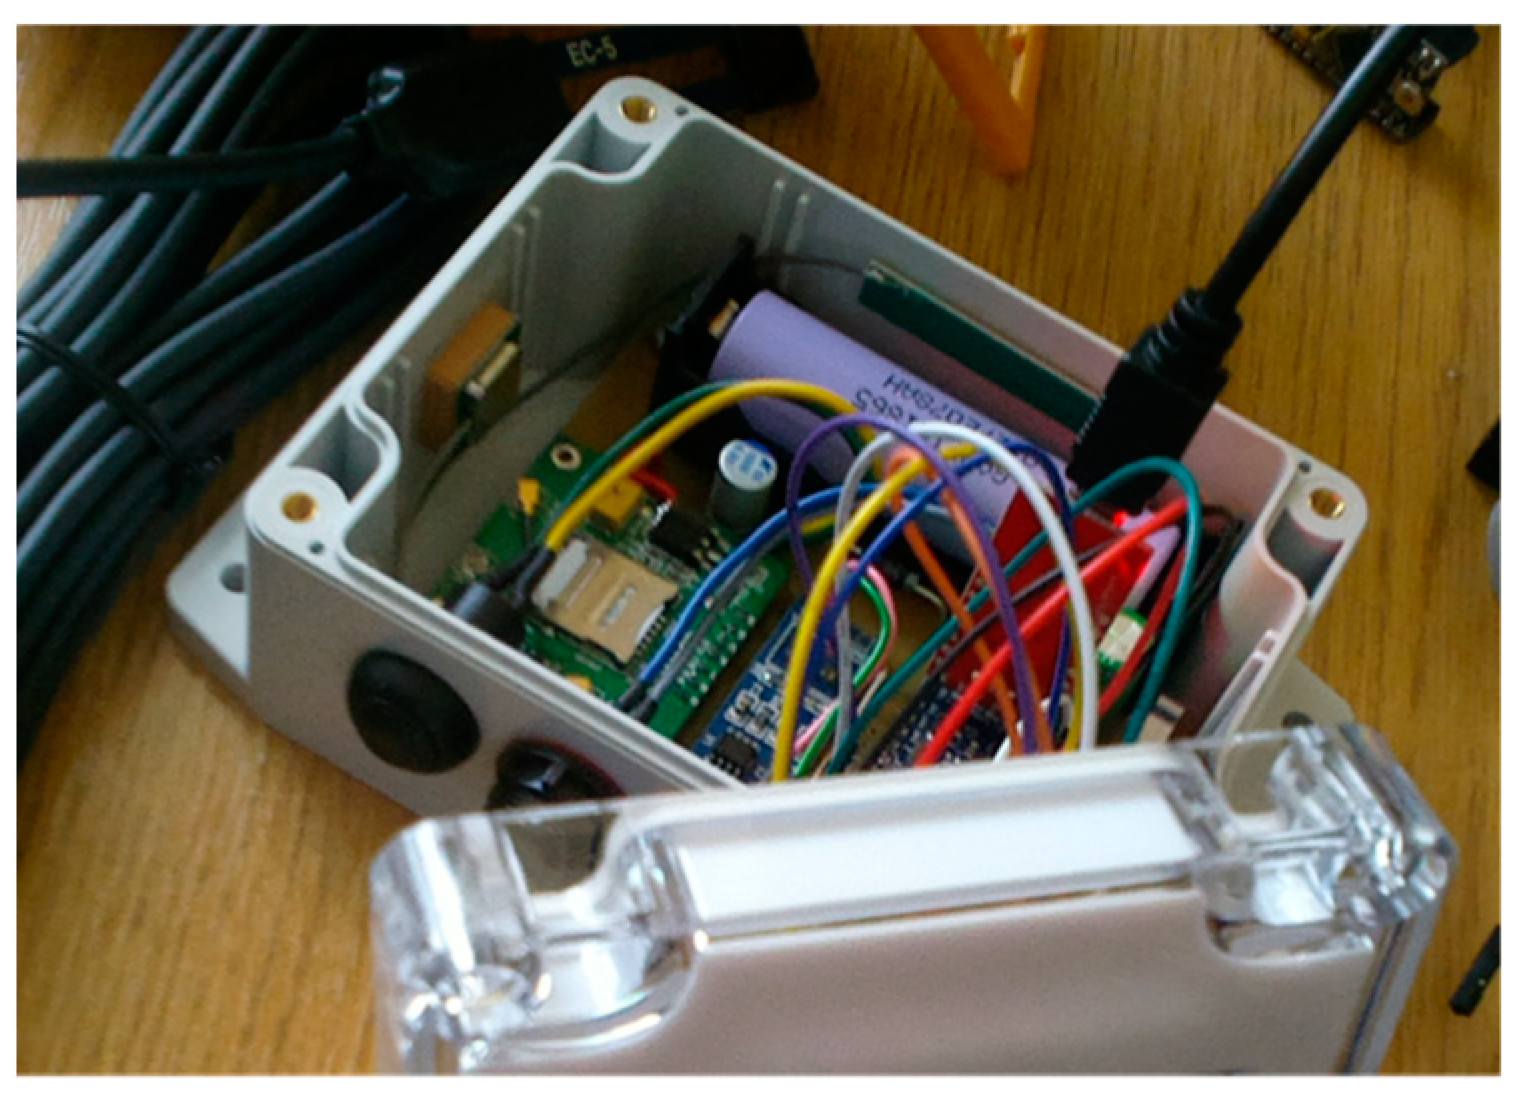
2.1. Design and Development of the IoT Node

The IoT node was designed and developed using Arduino architecture (Figure 1), as it has a very low price for all the components needed for developing a low cost IoT system. A typical wireless node consists of a microcontroller that is also capable of performing data processing; the transceiver, which is responsible for the wireless communication; the power source; and finally the various circuits needed (e.g., AD converters) for supporting the reading of analog and digital signals of the sensors and the actuators. To implement the node, a board was developed by splitting it into 4 distinct layers:
  • The power management layer, which was designed using methodologies for minimizing power consumption;
  • The interfacing layer, responsible for the connectivity of peripherals (sensors and actuators) with the system;
  • The processing/controlling layer, responsible for the initial data processing;
  • The connectivity layer, responsible for the data transmission to the cloud.
The node (Figure 2) has a small size of 12 × 8 cm and IP67 protection so that it can be used in a large number of applications in harsh environments. Moreover, it supports both analog and digital sensors and various communication protocols (e.g., RS-485 serial communication protocol) for supporting most of the available sensors/actuators (even industrial ones).
Data can be uploaded using general (GPRS and 4G) or low-power (NB-IoT and LTE-M) cellular network communication protocols. The communication between the node and the cloud was bidirectional in order to enable remote control and configuration of the system (e.g., open/close valve), and it achieved almost real-time measurements with a minimum sampling rate of 30 s.
To avoid the configuration process on behalf of the user, making the system “plug and play” and able to work with the simple click of the start button, it was decided that the developed node should also act as a getaway node, with direct communication to the cloud. Using this methodology, the nodes were preconfigured, while the cloud services were developed in such way to make them capable to automatically understand the type of the sensors connected to each node.

2.2. Reduction in Power Consumption

The power consumption of an IoT system is a quite critical parameter, as there are cases in which sensors have to be placed into dense and high crops (e.g., maize), where the charging of batteries is a difficult task. To minimize the power consumption of the node, 3 different prototypes were developed. The first one was developed using a commercial Arduino board, while the second was developed by designing a custom board for reducing power consumption. The third one (Figure 2) was an update of the second prototype, which was developed by enhancing the board design for minimizing the power consumption even more.

2.3. Sensors Supported

As there are low-cost sensors that are able to provide measurements of high accuracy with a careful calibration [36] or by using deep-learning-based sensor modelling [37], more than 80 different sensors were tested and evaluated to select the ones with the highest accuracy and durability. In the case of the ones that passed these functional tests, in some cases (pH, temperature, and turbidity sensors), modifications were made to increase their accuracy and make them waterproof. Waterproofing was achieved by potting the sensitive electrical/electronic parts, wiring, and connections of the aforementioned sensors using epoxy resin. Moreover, as the majority of the low-cost sensors were OEM-branded operating using circuits developed from multiple manufacturers (e.g., TDS, pH, and Ultrasonic level sensor), new circuits were developed and embedded into the IoT node for ensuring the proper functionality of the low-cost sensors as well as their measurements’ accuracy. The sensors that have been supported to date by the IoT node are:
  • Weather measurements: Temperature, humidity, atmospheric pressure, precipitation, wind speed, wind gust, wind direction, solar radiation, and UV index;
  • Soil measurements: Moisture content, temperature, pH, and electrical conductivity;
  • Water measurements: Temperature, pH, electrical conductivity, turbidity, TDS, water flow, and storage tank level.

2.4. Actuation

To enable remote control and automation, the communication between the node and the cloud was bidirectional, and the actuation could be achieved by remote control through a website in which the user can:
  • Open or close an actuator;
  • Enter the thresholds of an actuator to change its state (e.g., specific temperature and water level);
  • Enable autonomous operation (e.g., applying precision irrigation).
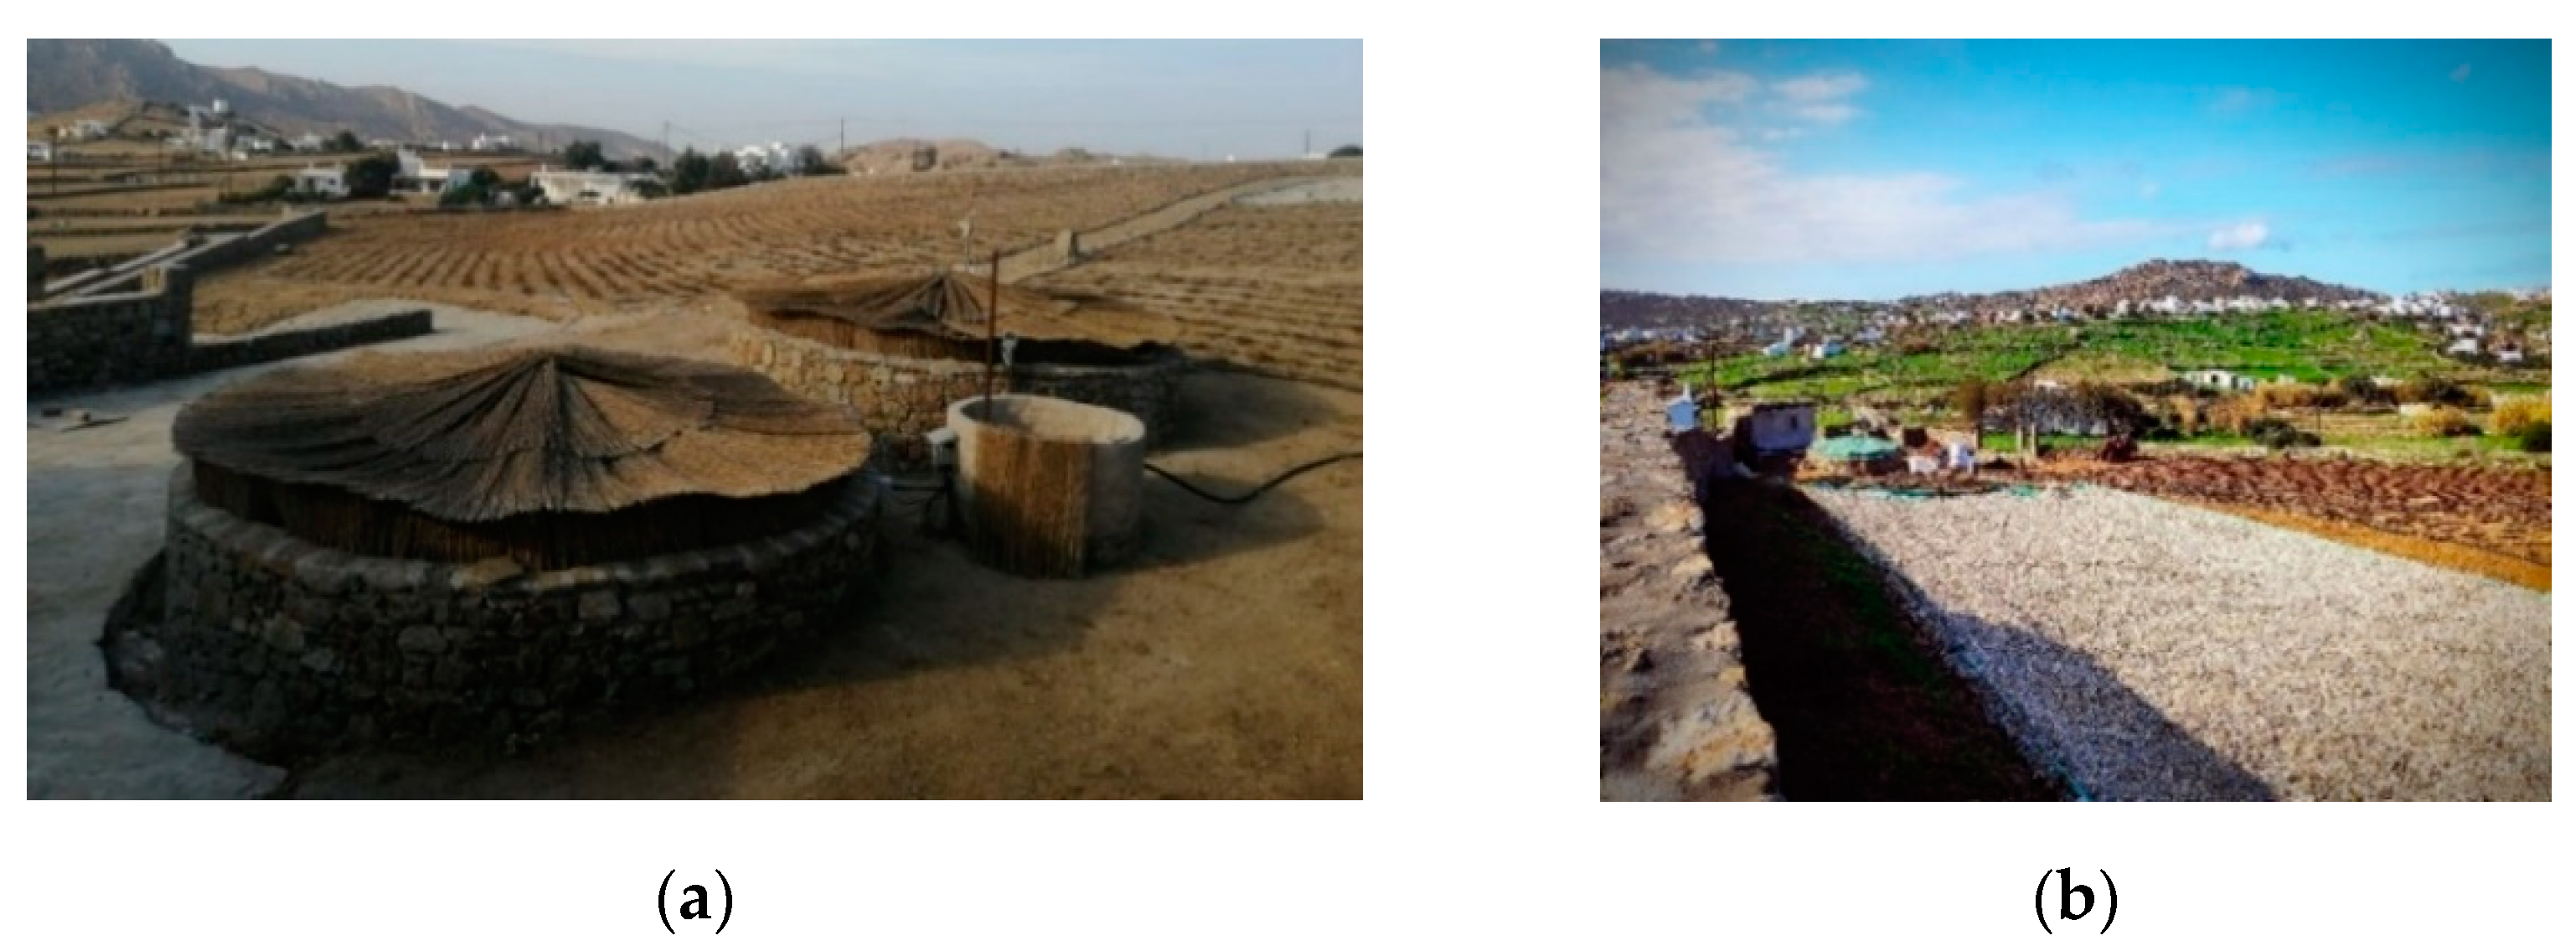
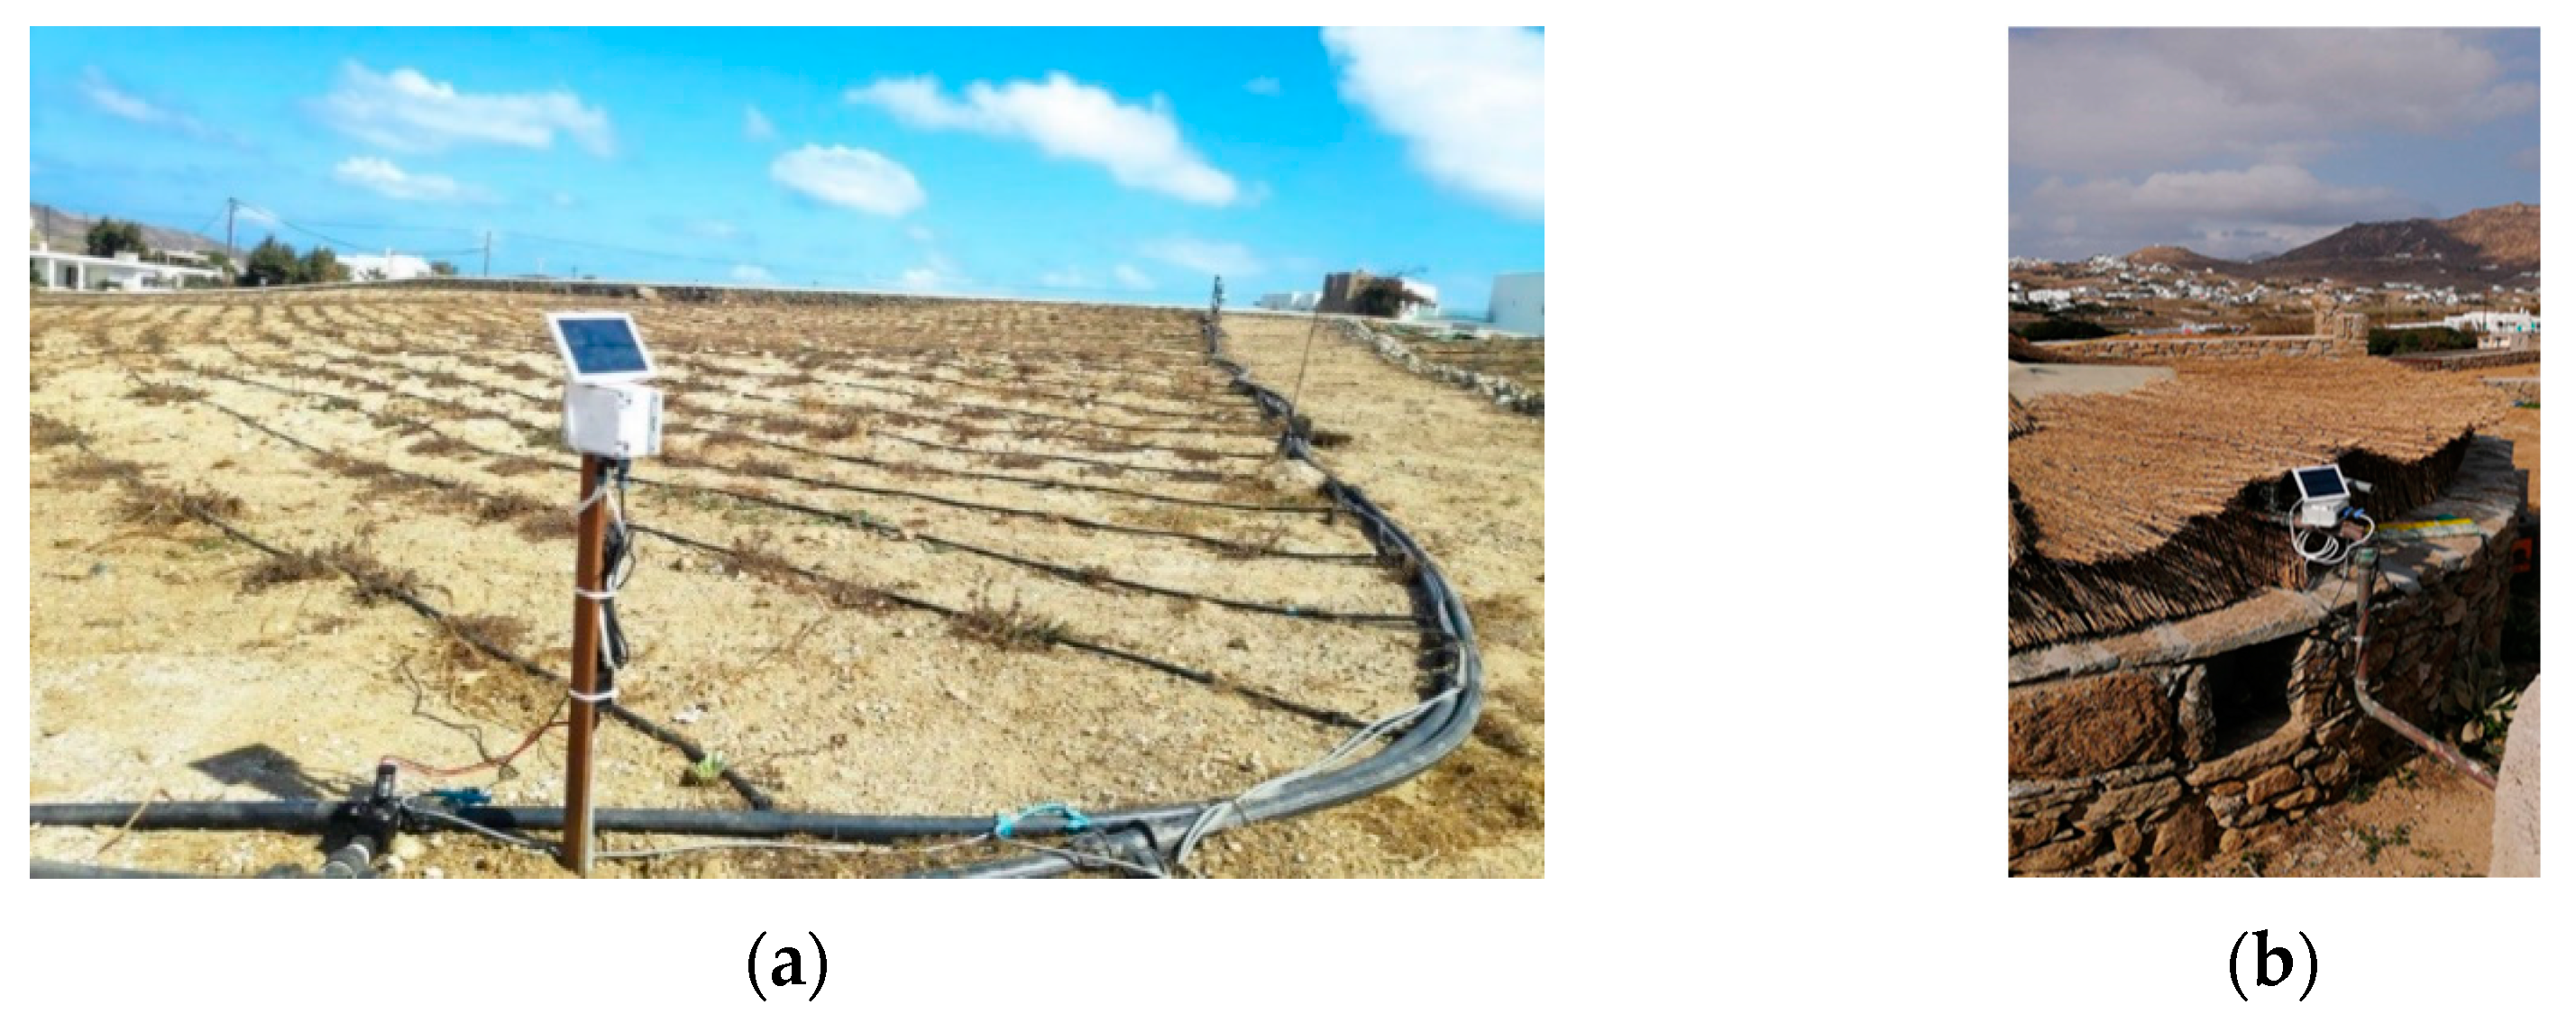
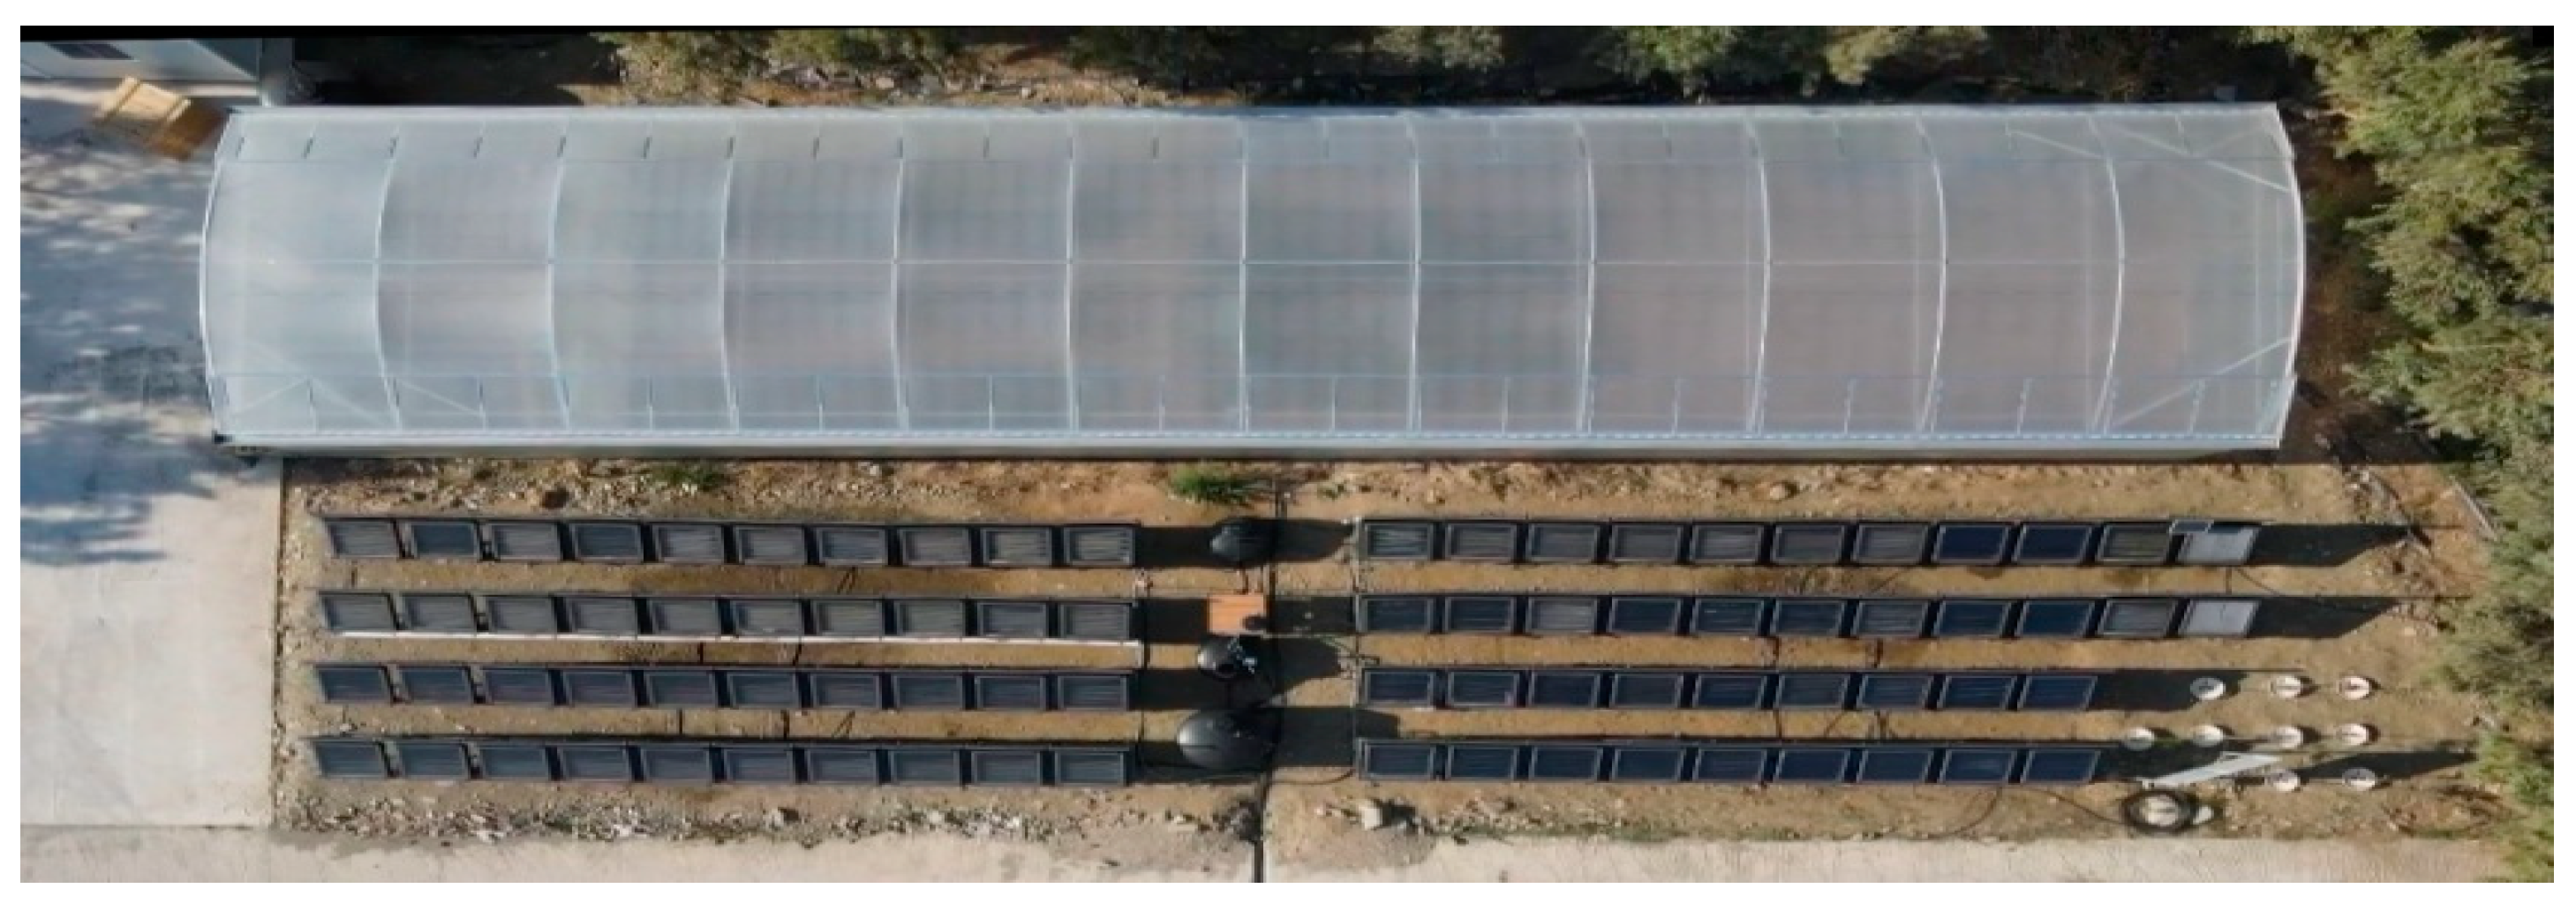
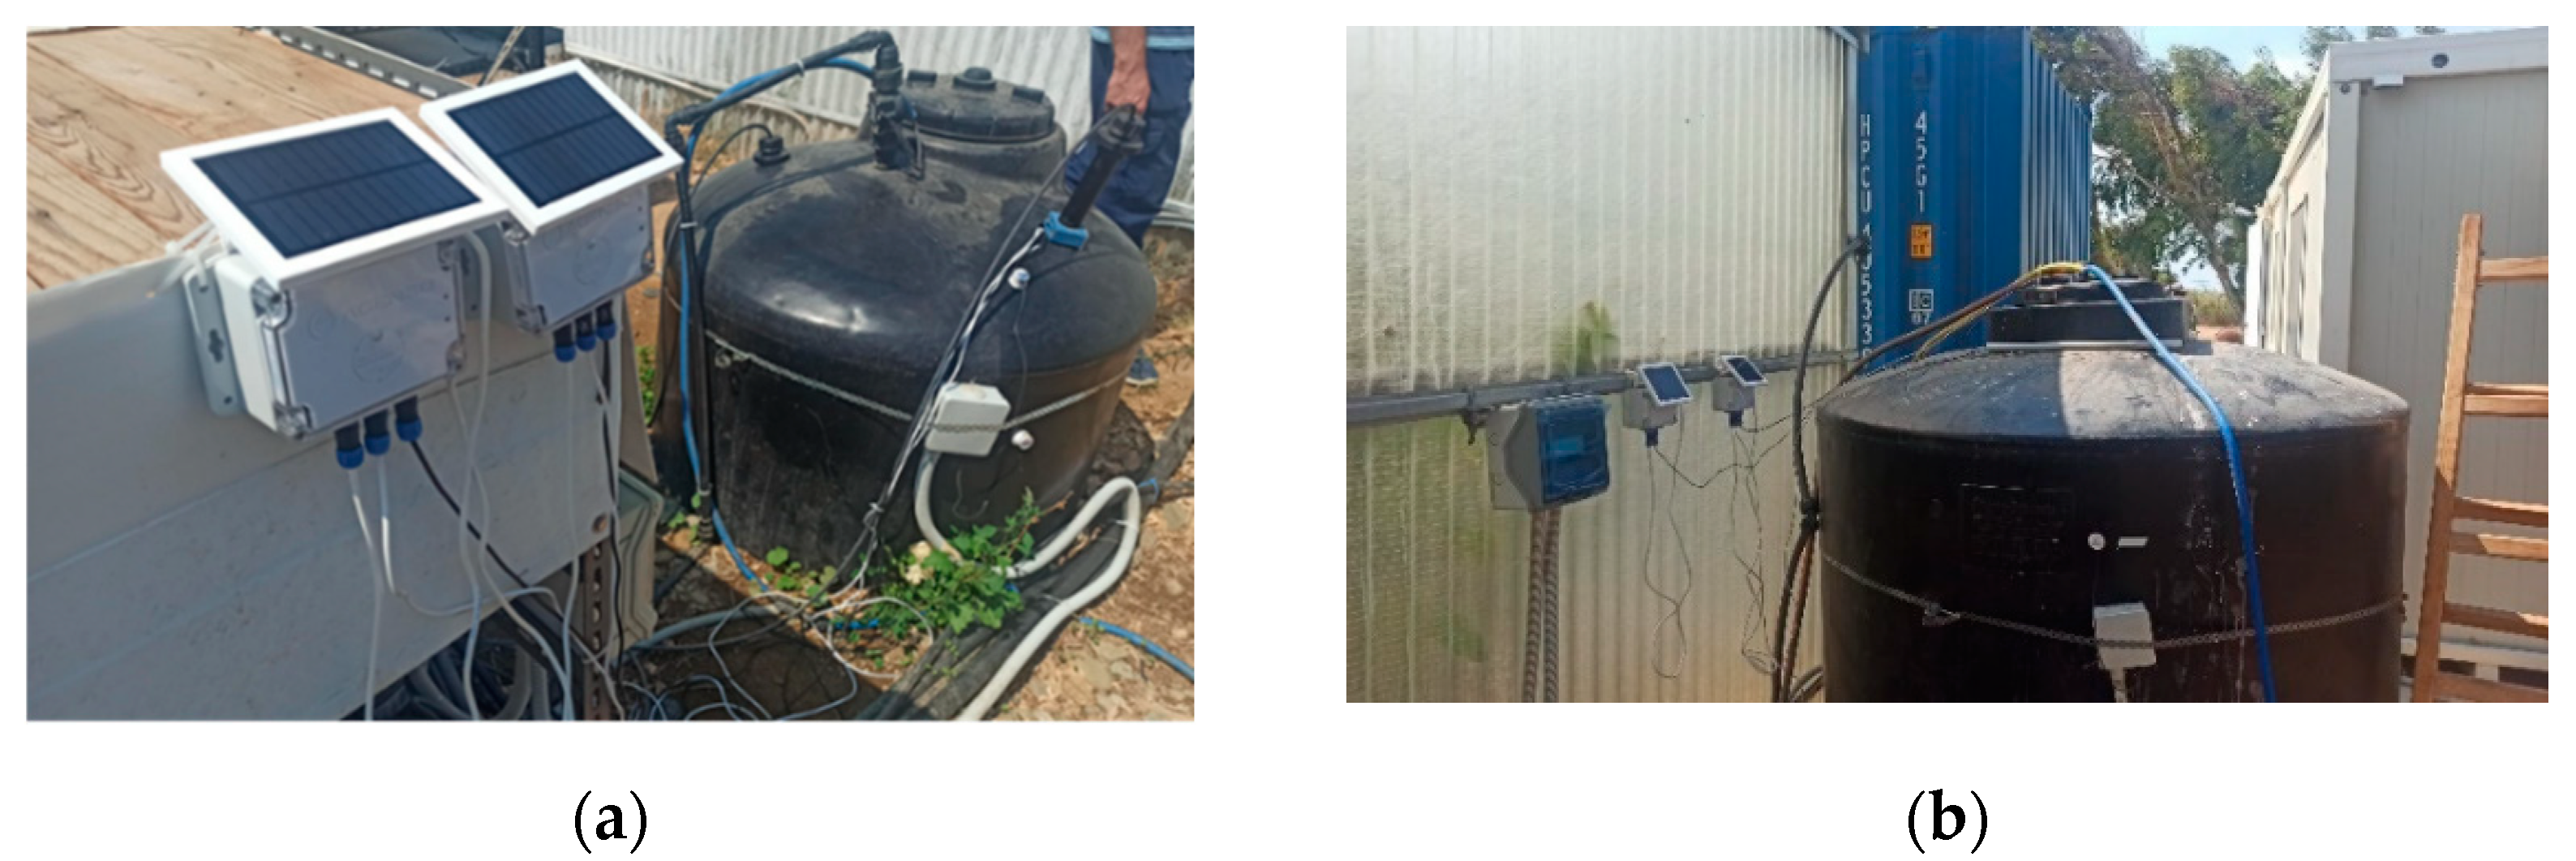
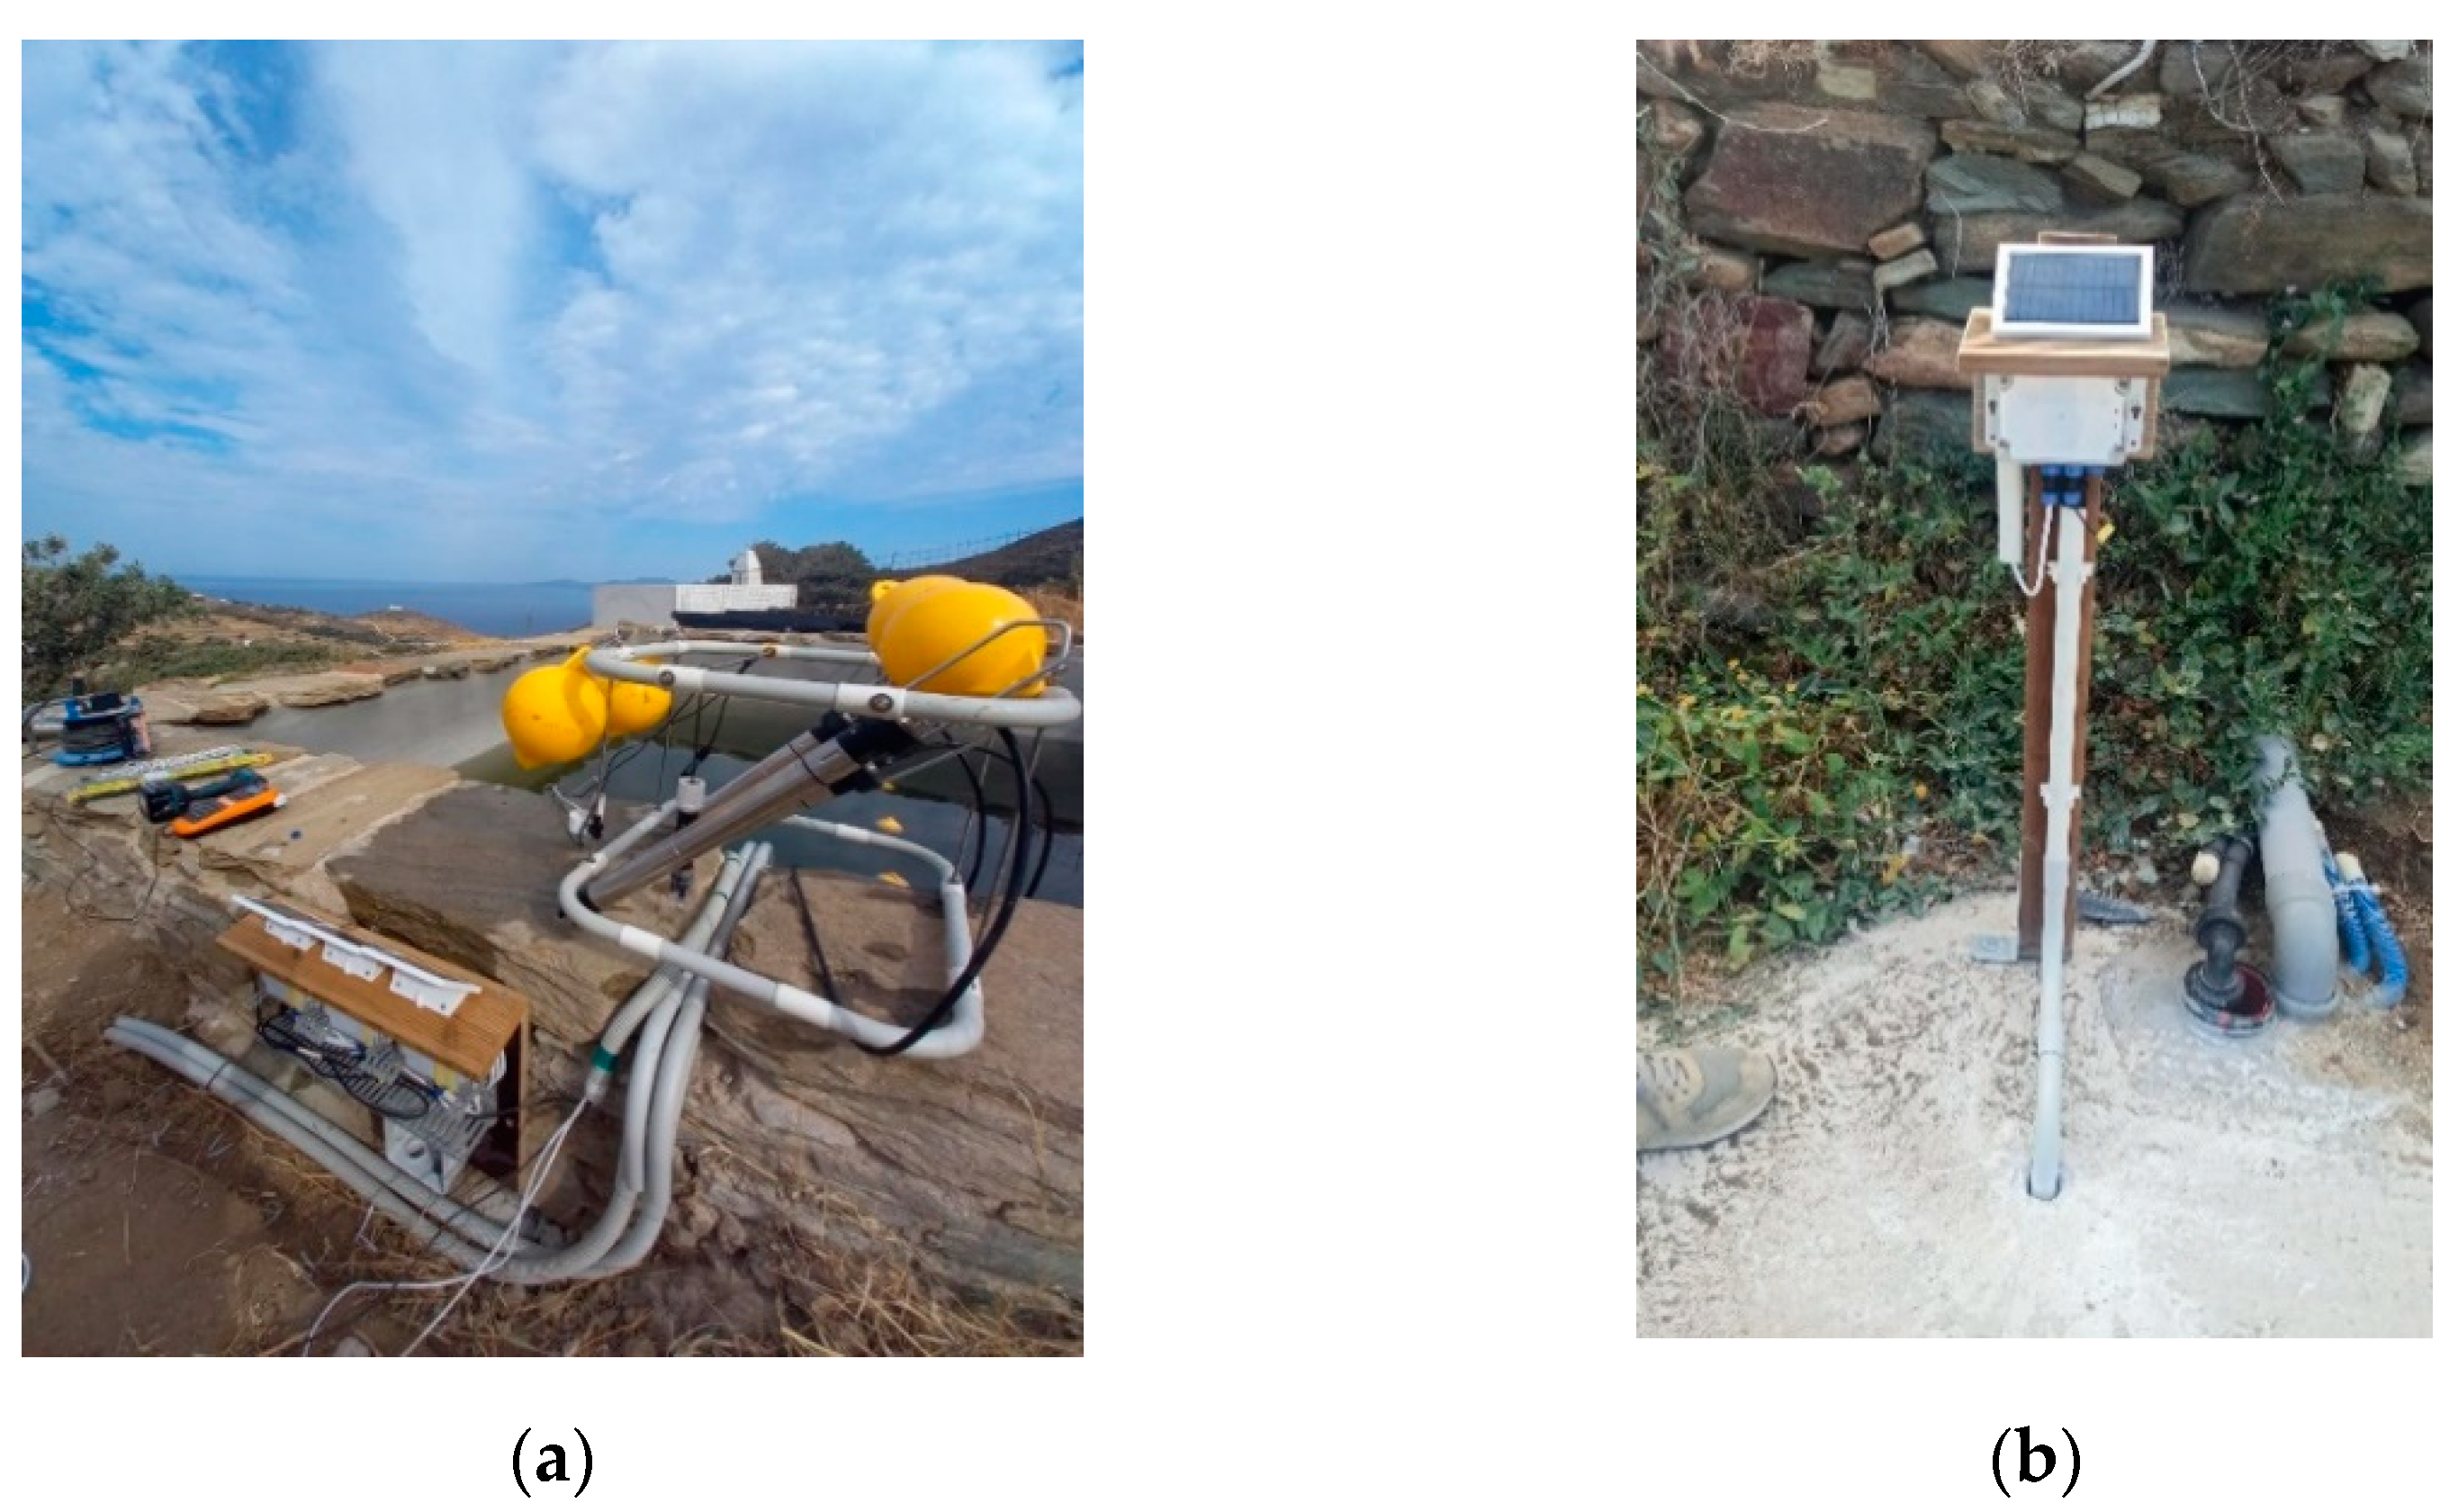
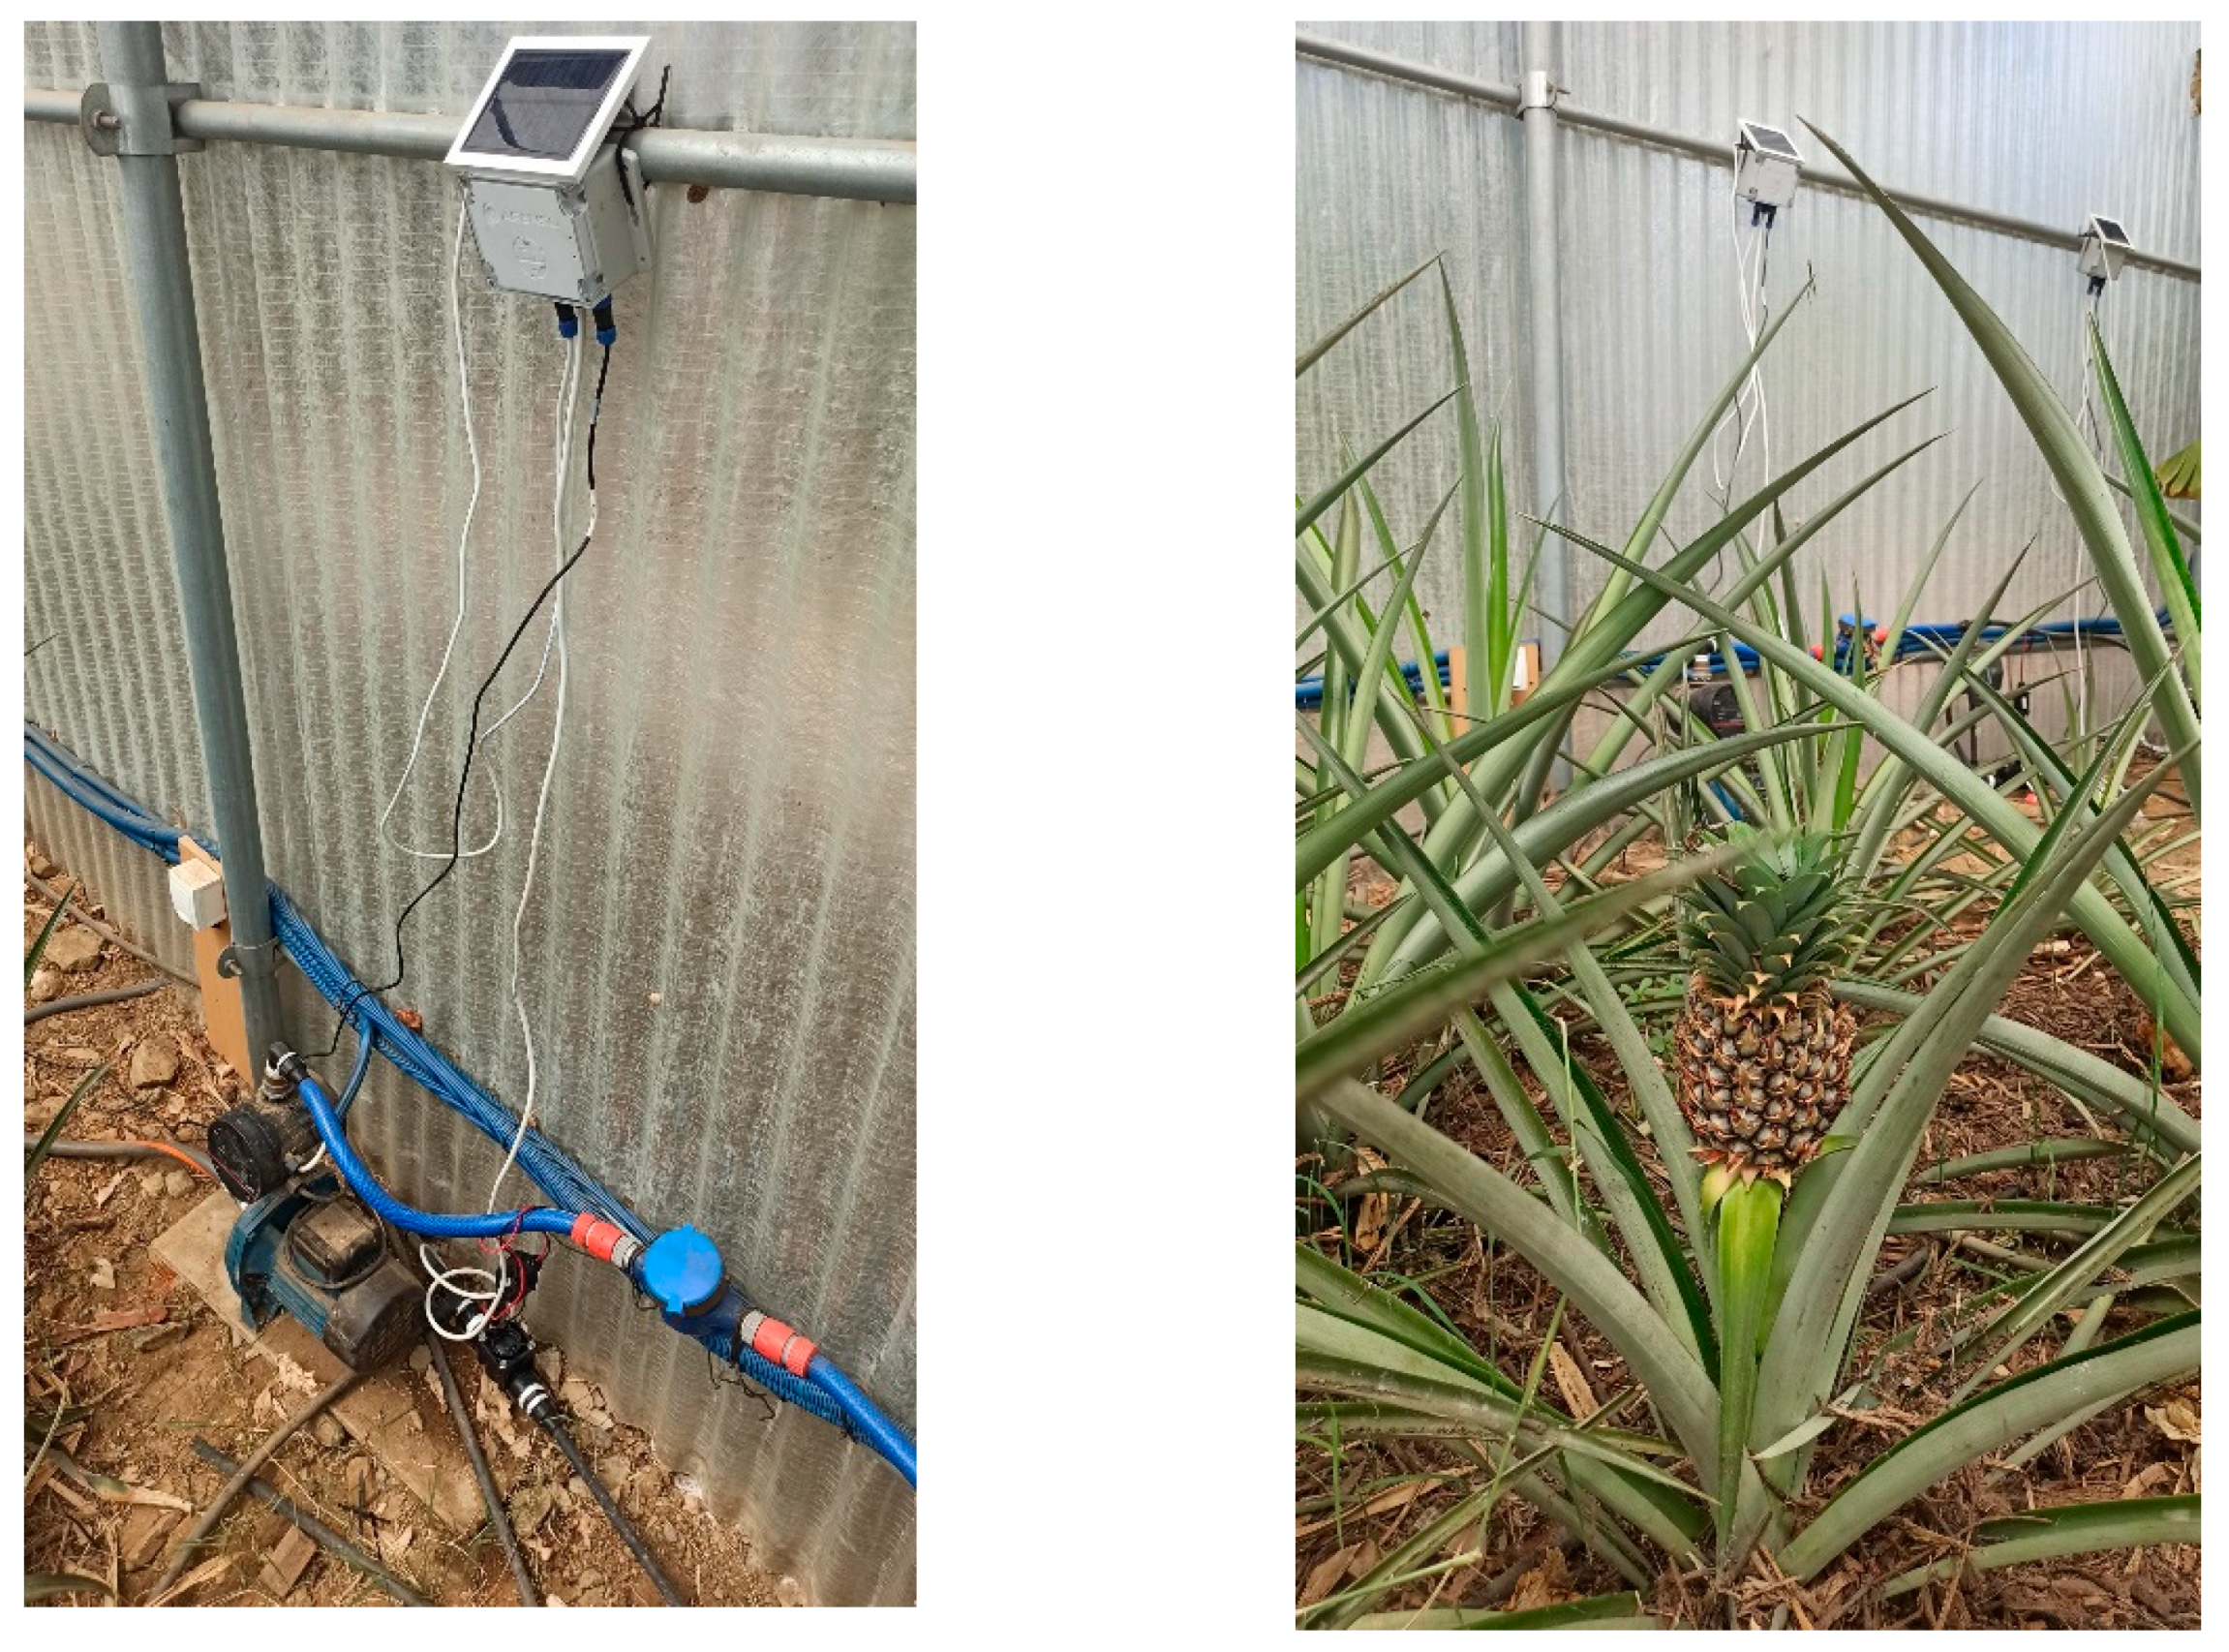
2.5. Field Trials

The ability of the system to efficiently manage different water sources for automated irrigation scheduling was evaluated at 3 different pilot sites developed for the needs of the HYDROUSA project. More specifically, the evaluation procedure was held at Ano Mera, Mykonos, Greece (37°26′51.4″ N 25°24′15.7″ E), at Agios Fokas, Tinos, Greece (37°31′59.1″ N 25°10′44.0″ E), and at an eco-tourist facility in Tinos Greece (37°33′56.7″ N 25°12′55.5″ E). Field trial tests included the evaluation of: (i) low-cost sensors’ accuracy, (ii) system’s monitoring and water management capabilities, (iii) automated irrigation scheduling efficiency, and (iv) the system’s energy autonomy.

3. Results

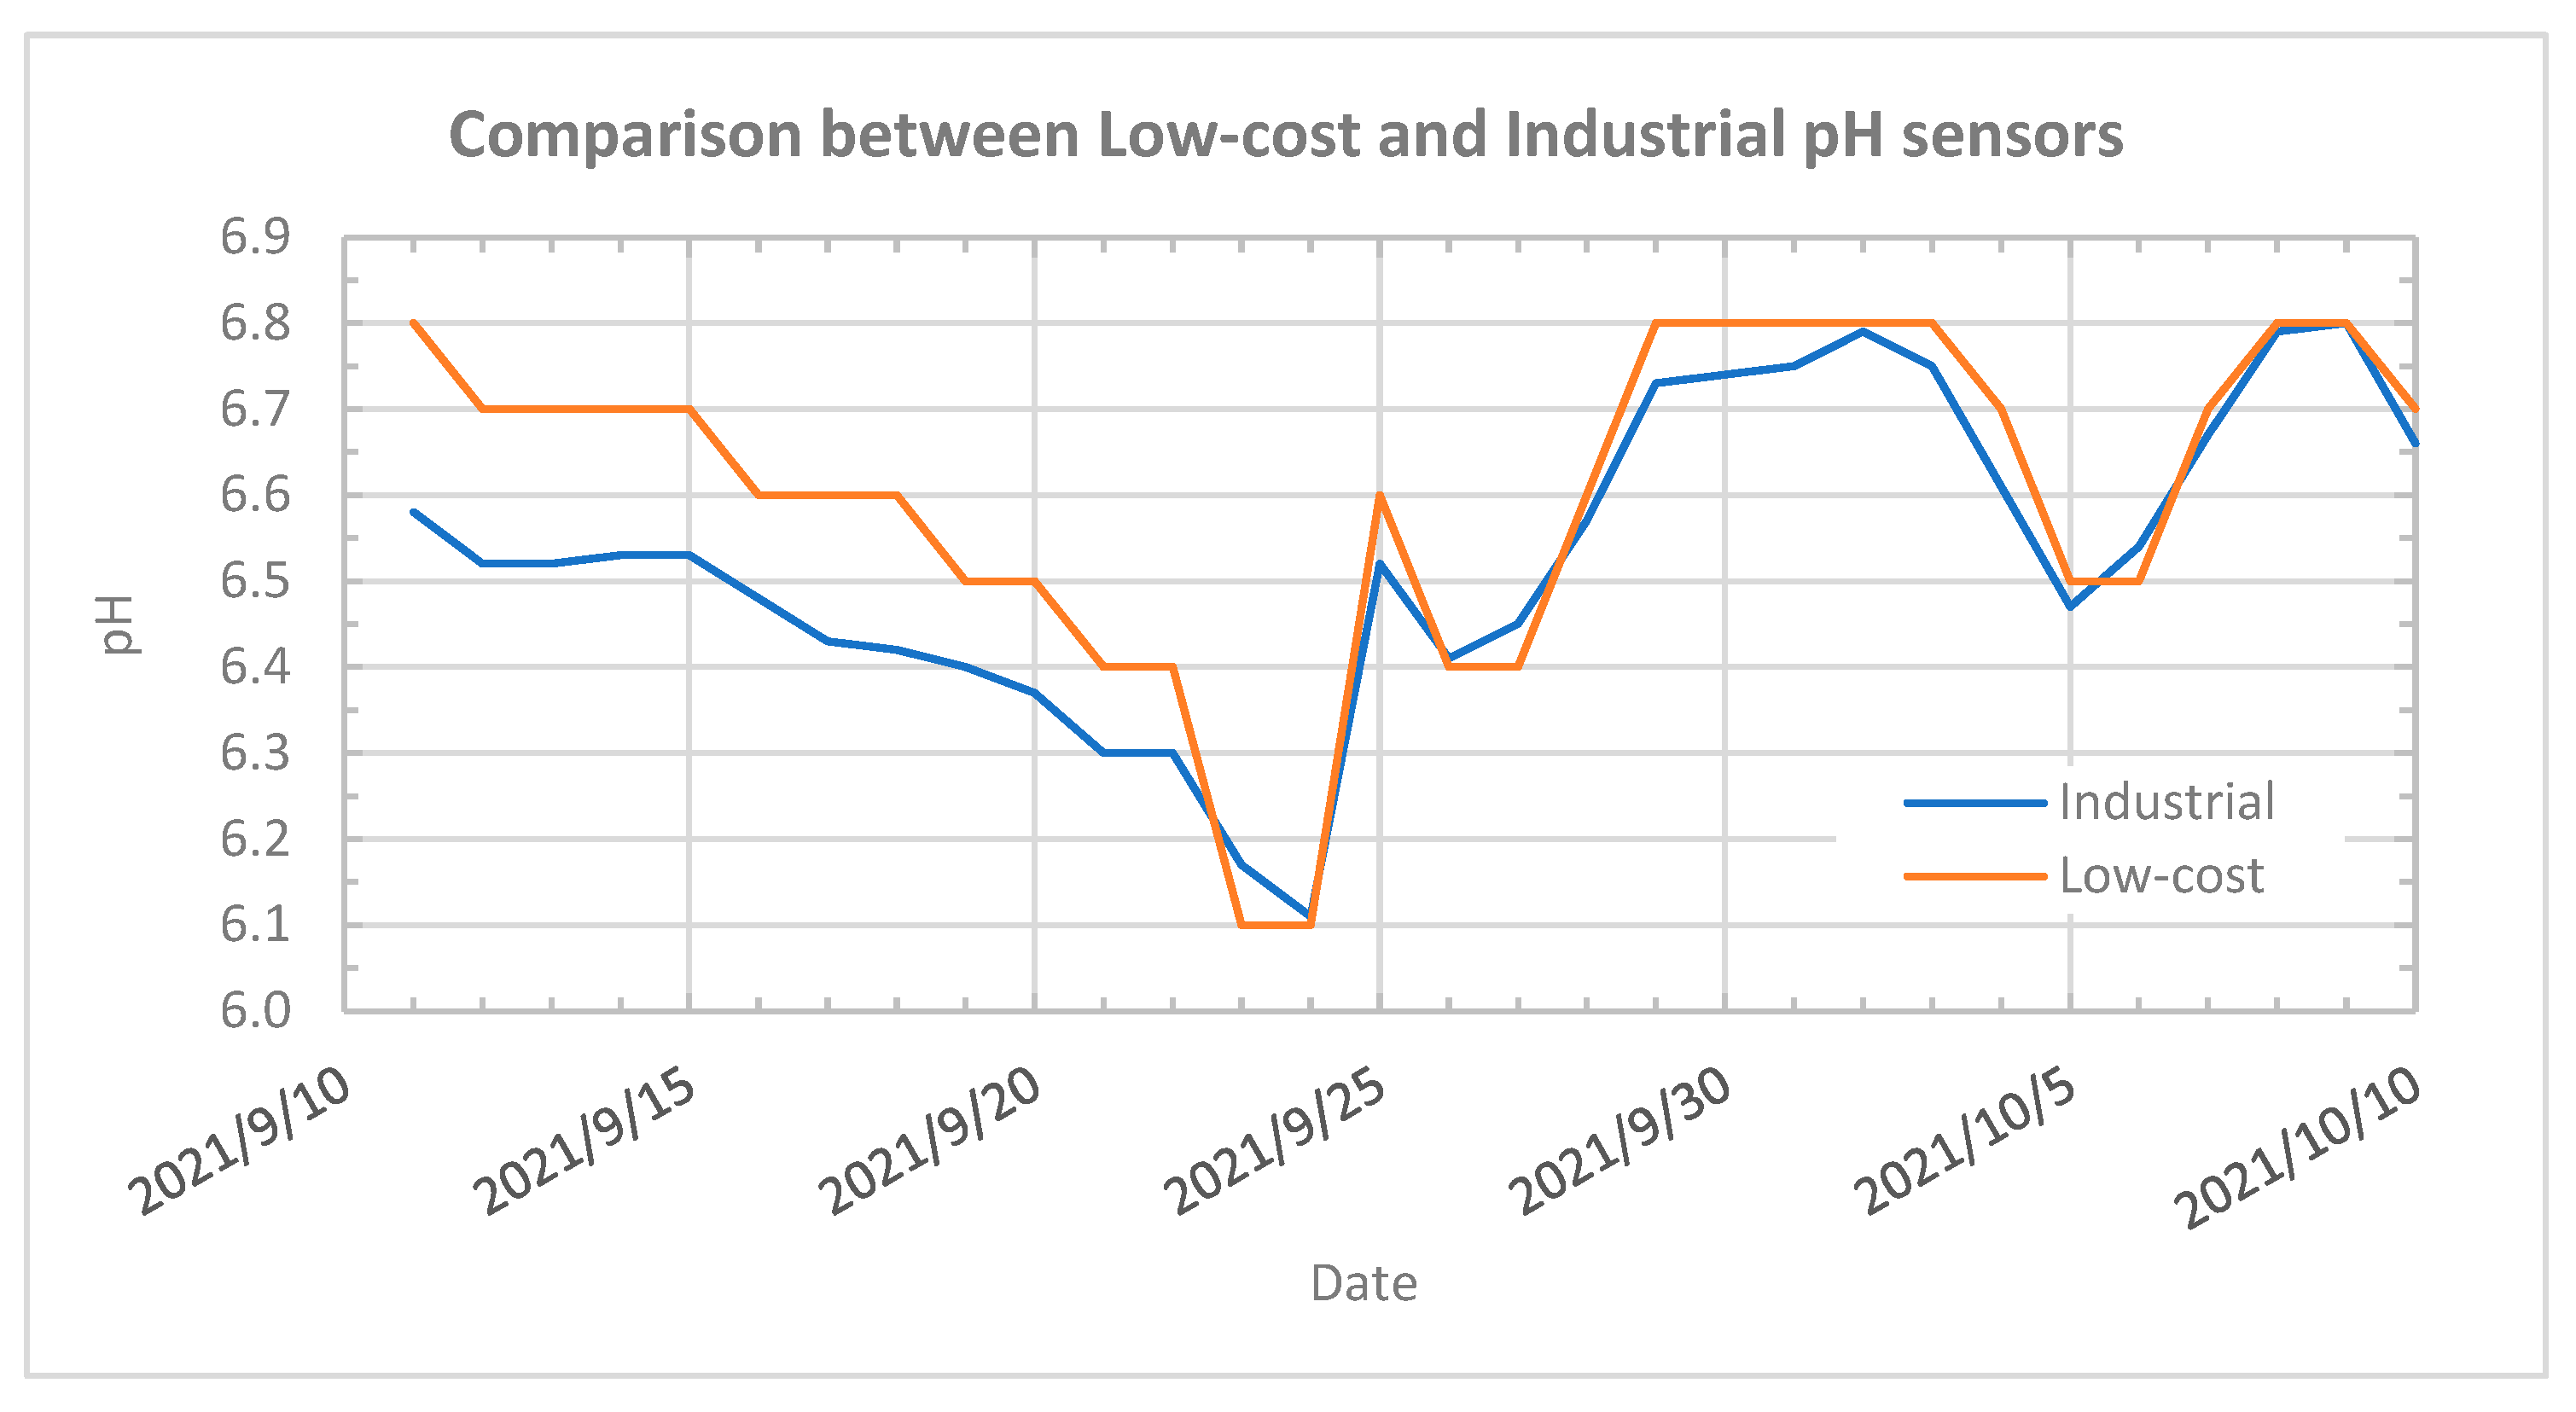
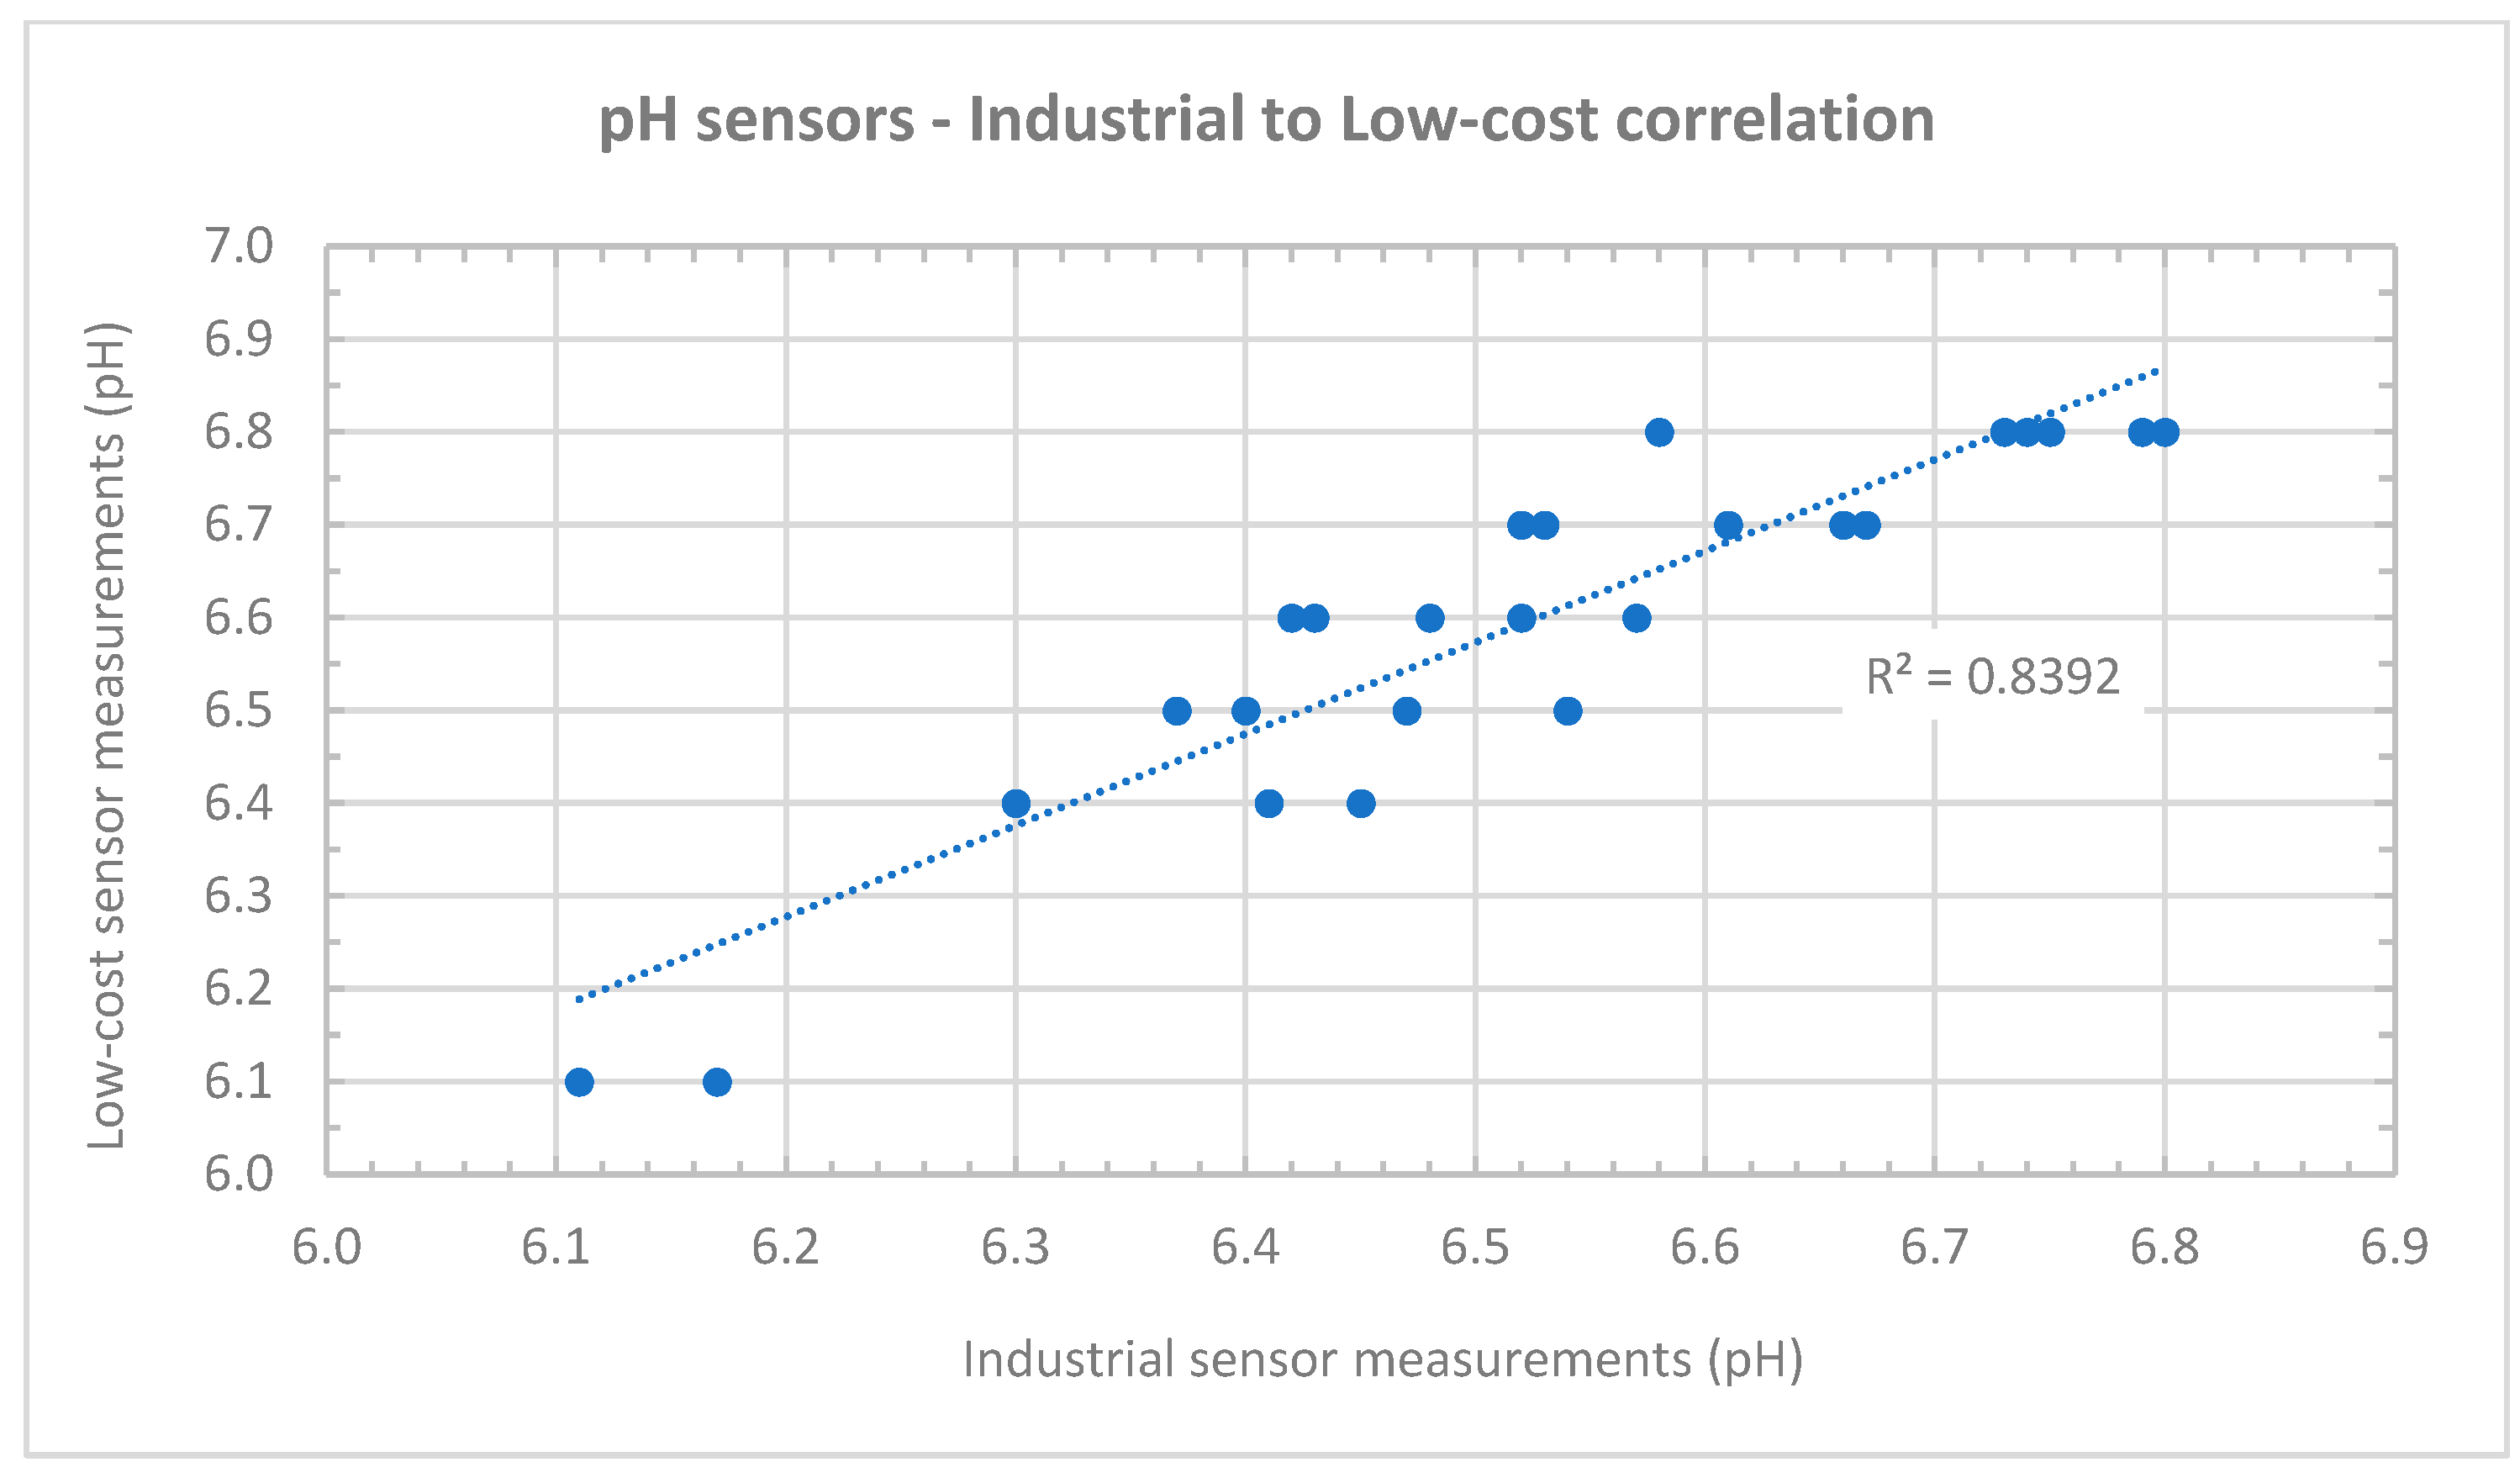
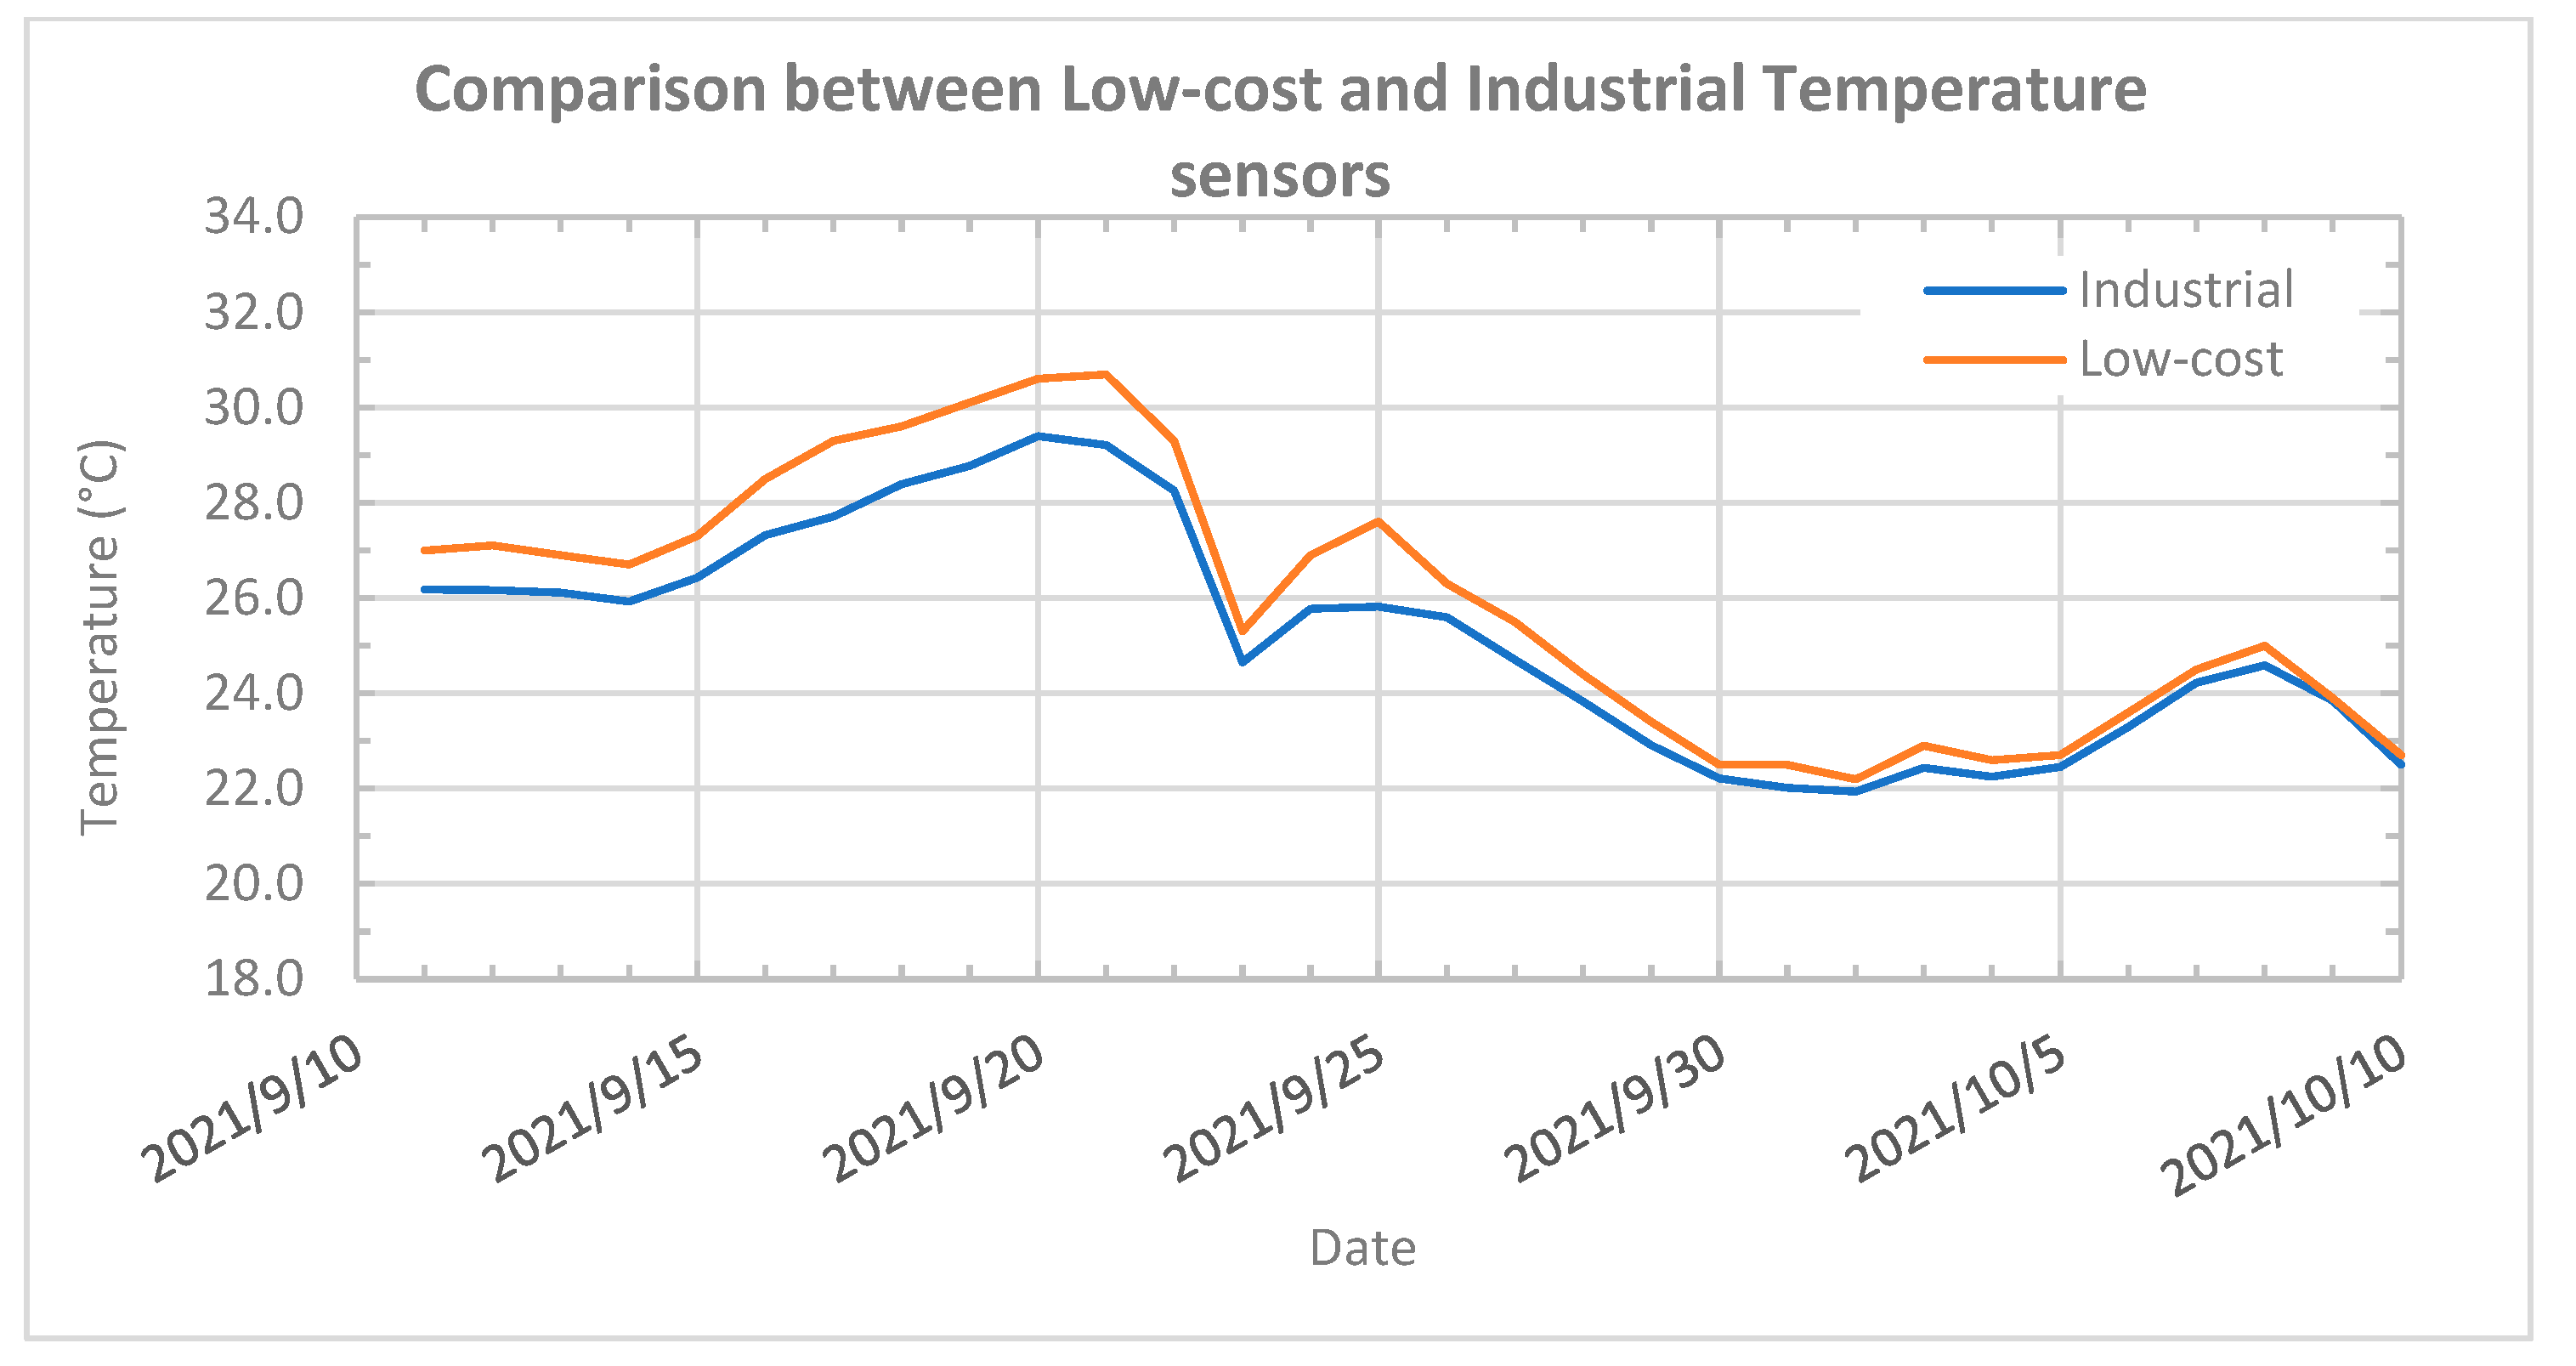
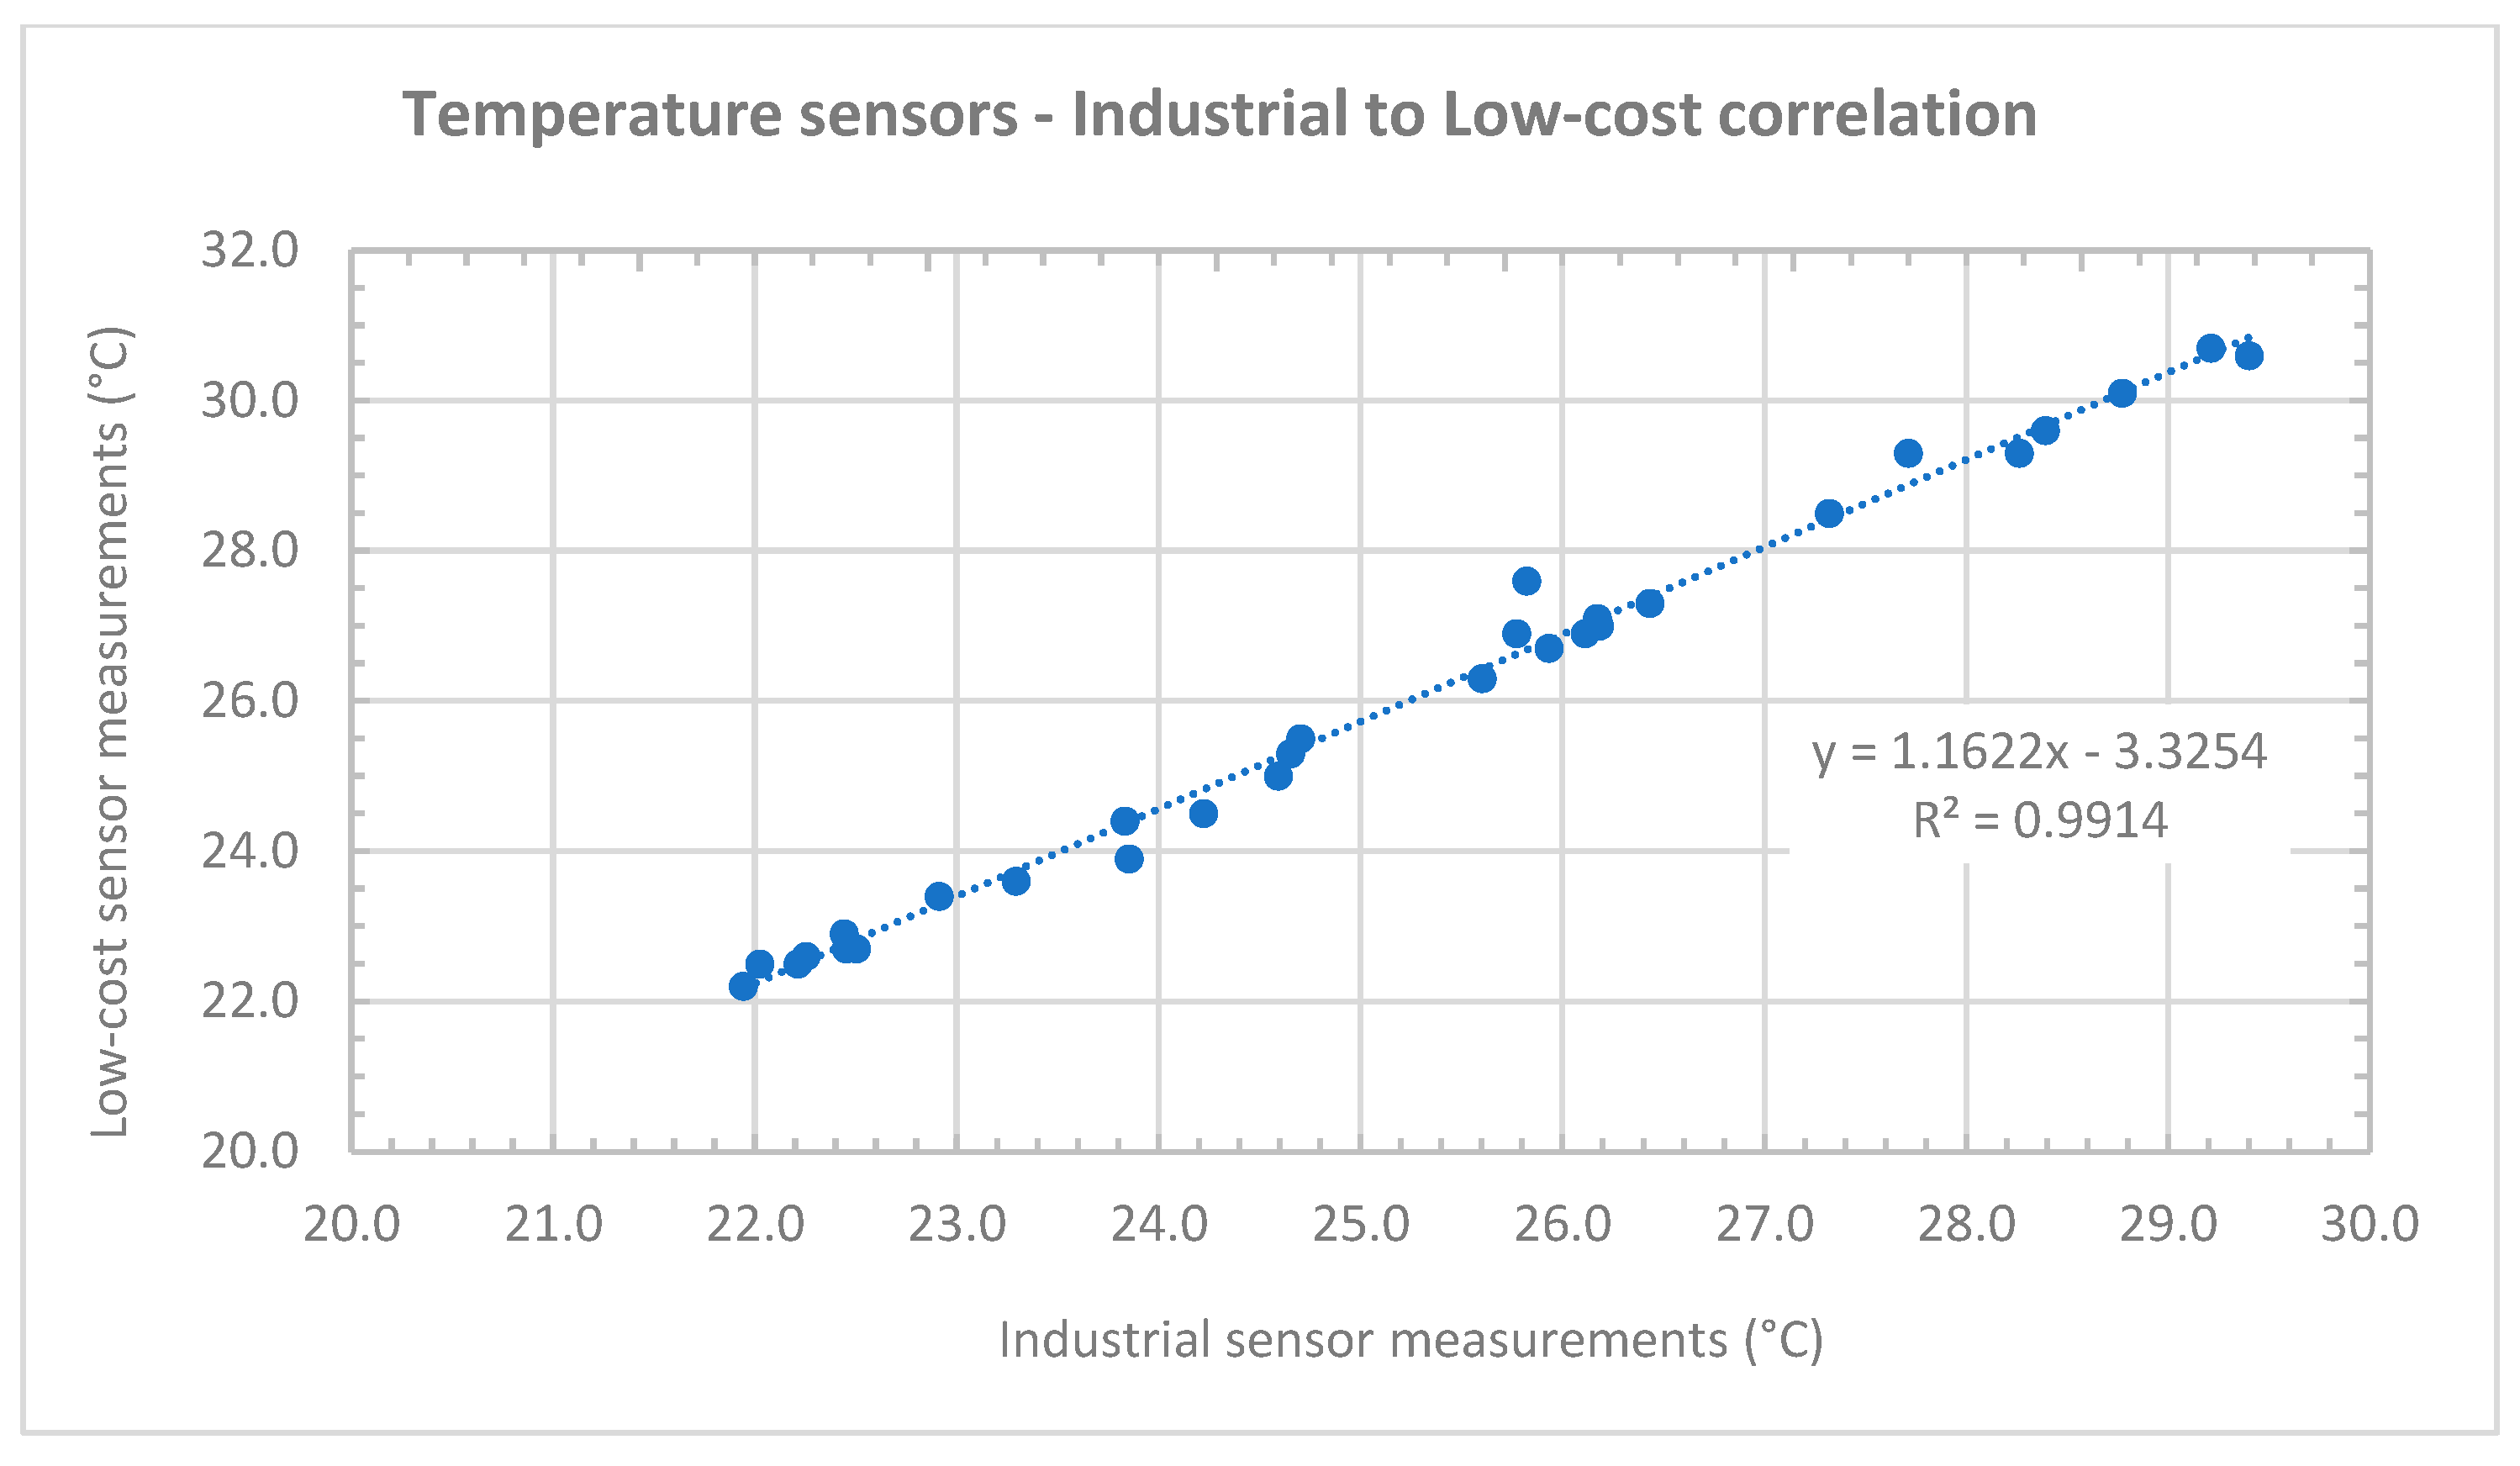
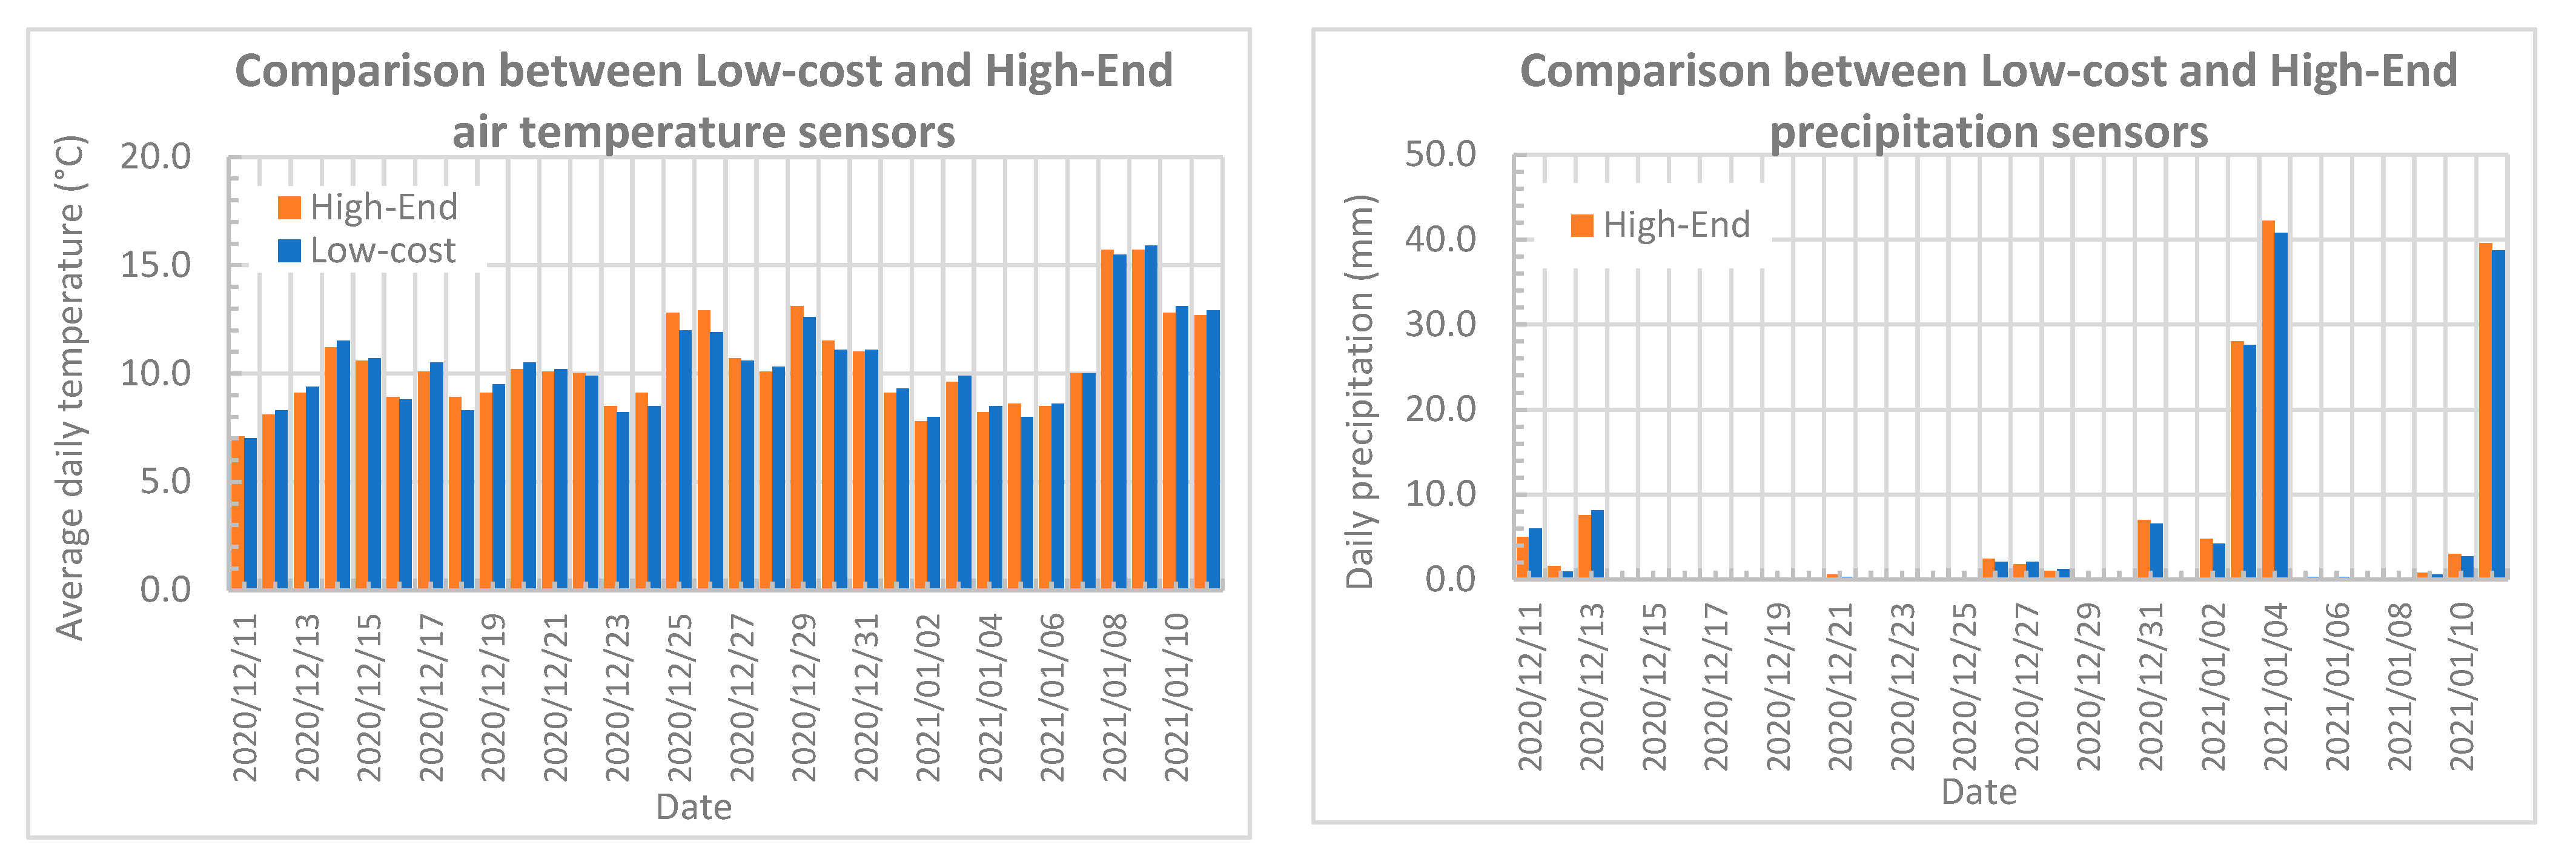
3.1. Evaluation of the Low-Cost Sensors’ Accurancy

The water quality sensors were tested and evaluated at the pilot site of Agios Fokas, Tinos, Greece, by comparing their measurements with industrial type sensors that were installed in parallel in closed tanks used for water storing. Both low-cost (Temperature: DS18B20, AGENSO, Athens, Greece; pH: H-101, HAO SHI, Taiwan) and industrial sensors (Temperature and pH: Sensolyt 700 IQ, YSI, Yellow Springs, OH, USA) were calibrated before their installation. The measurement rate was 1 h for the low-cost sensors and 15 min for the industrial sensors. To compare their results, the average daily values of each sensor were calculated. For pH measurements, the maximum difference recorded between the low-cost and the industrial sensor was 0.22 with a mean difference at 0.08 and R2 = 0.8392 (Figure 3 and Figure 4), with the low-cost sensor having an accuracy of ±0.1 at 25 °C and the industrial one ±0.05 (from 0 °C to 60 °C). For water temperature measurements, the maximum difference recorded was 1.78 °C with a mean difference of 0.75 °C and R2 = 0.9914 (Figure 5 and Figure 6), with both sensors having an accuracy of ±0.5 °C (low cost: from −10 °C to +85 °C; industrial: from 0 °C to 60 °C). The average values per day and their differences are shown in Table 1.
In order to perform a robust comparison and further determination of the statistically significant differences between the obtained measurements, an analysis of variance was performed by conducting a one-way ANOVA using a Fisher’s least significance difference (LSD) test at a 95% confidence level (p < 0.05). As pH industrial sensors have a temperature compensation function to correct the measured pH value according to the water temperature, the accuracy of the low-cost pH sensor had to be improved. For this reason, a firmware update of the IoT node was developed and will be tested in summer 2022, to regulate the pH results according to the water temperature, for increasing the accuracy of the low-cost pH sensor. The low-cost temperature sensor that was used showed a very high level of accuracy (R2 = 0.9914), which was proved also during the initial lab tests that were conducted.
As no low-cost sensors for measuring electrical conductivity on water exist, the measurements of a low-cost TDS sensor (TDS-1000, AGENSO, Athens, Greece) were evaluated in comparison with the measurements of an industrial sensor for measuring electrical conductivity. Thus, the TDS and electrical conductivity (EC) on water are correlated. As shown in Figure 7, the results show a high correlation between the TDS and EC measurements at an EC up to 3 mS/cm. After that point, the correlation was lower as the TDS sensor reached its maximum range. The general rule for the salinity hazard of irrigation water based upon conductivity is that EC over 3 mS/cm creates severe damage to crops [38,39]. The low-cost TDS sensor can be used to evaluate the quality of the water and its properness for irrigation, or to select crops that are tolerant to saline water.
In addition, as weather parameters are the most important factors in decision making in agriculture, the selected low-cost that station (MeteoIoT 2100S, AGENSO, Athens, Greece) was evaluated in an experiment which run at the Municipality of Trikala, Greece, where the data of the station were compared with the data of a high-end weather station (Vantage Pro 2, Davis, Hayward, CA, USA) used by the municipality. This high-end station was connected to the network of weather stations of the National Observatory of Athens, which is the largest network of weather stations in Greece, used for weather monitoring and forecasting. Both stations were installed in open places within the municipality and their distance in a straight line was about 400 m. Figure 8 presents the comparison of the daily average temperature and the total rain recorded using the low-cost and the high-end weather stations for a 30-day period. The average temperatures recorded using the low-cost and high-end weather stations were 10.33 °C and 10.37 °C, respectively, while the total rain recorded was 142.50 mm for the low-cost weather station and 145.80 mm for the high-end weather station, proving the reliability of the measurements retrieved with the low-cost weather station (Table 2).
Daily measurements, meaning daily average temperature and sum of total daily rain, were obtained from the open source access www.meteo.gr [40], supported by the National Observatory of Athens, as single point measurements; thus, any further analysis of variance between the measurements was not applicable due to the lack of access to the hourly data from which the means and sums were generated. As a result, a statistical analysis was performed at monthly level, using the available data, for assessing and determining the statistically significant differences between the monthly values, by conducting a one-way ANOVA using a Fisher’s least significance difference test at a 95% confidence level (p < 0.05). The results indicate the lack of statistical differences between the operation of the low-cost and industrial components for both average temperatures and total rain, indicating the sufficient function of both components in the long term.

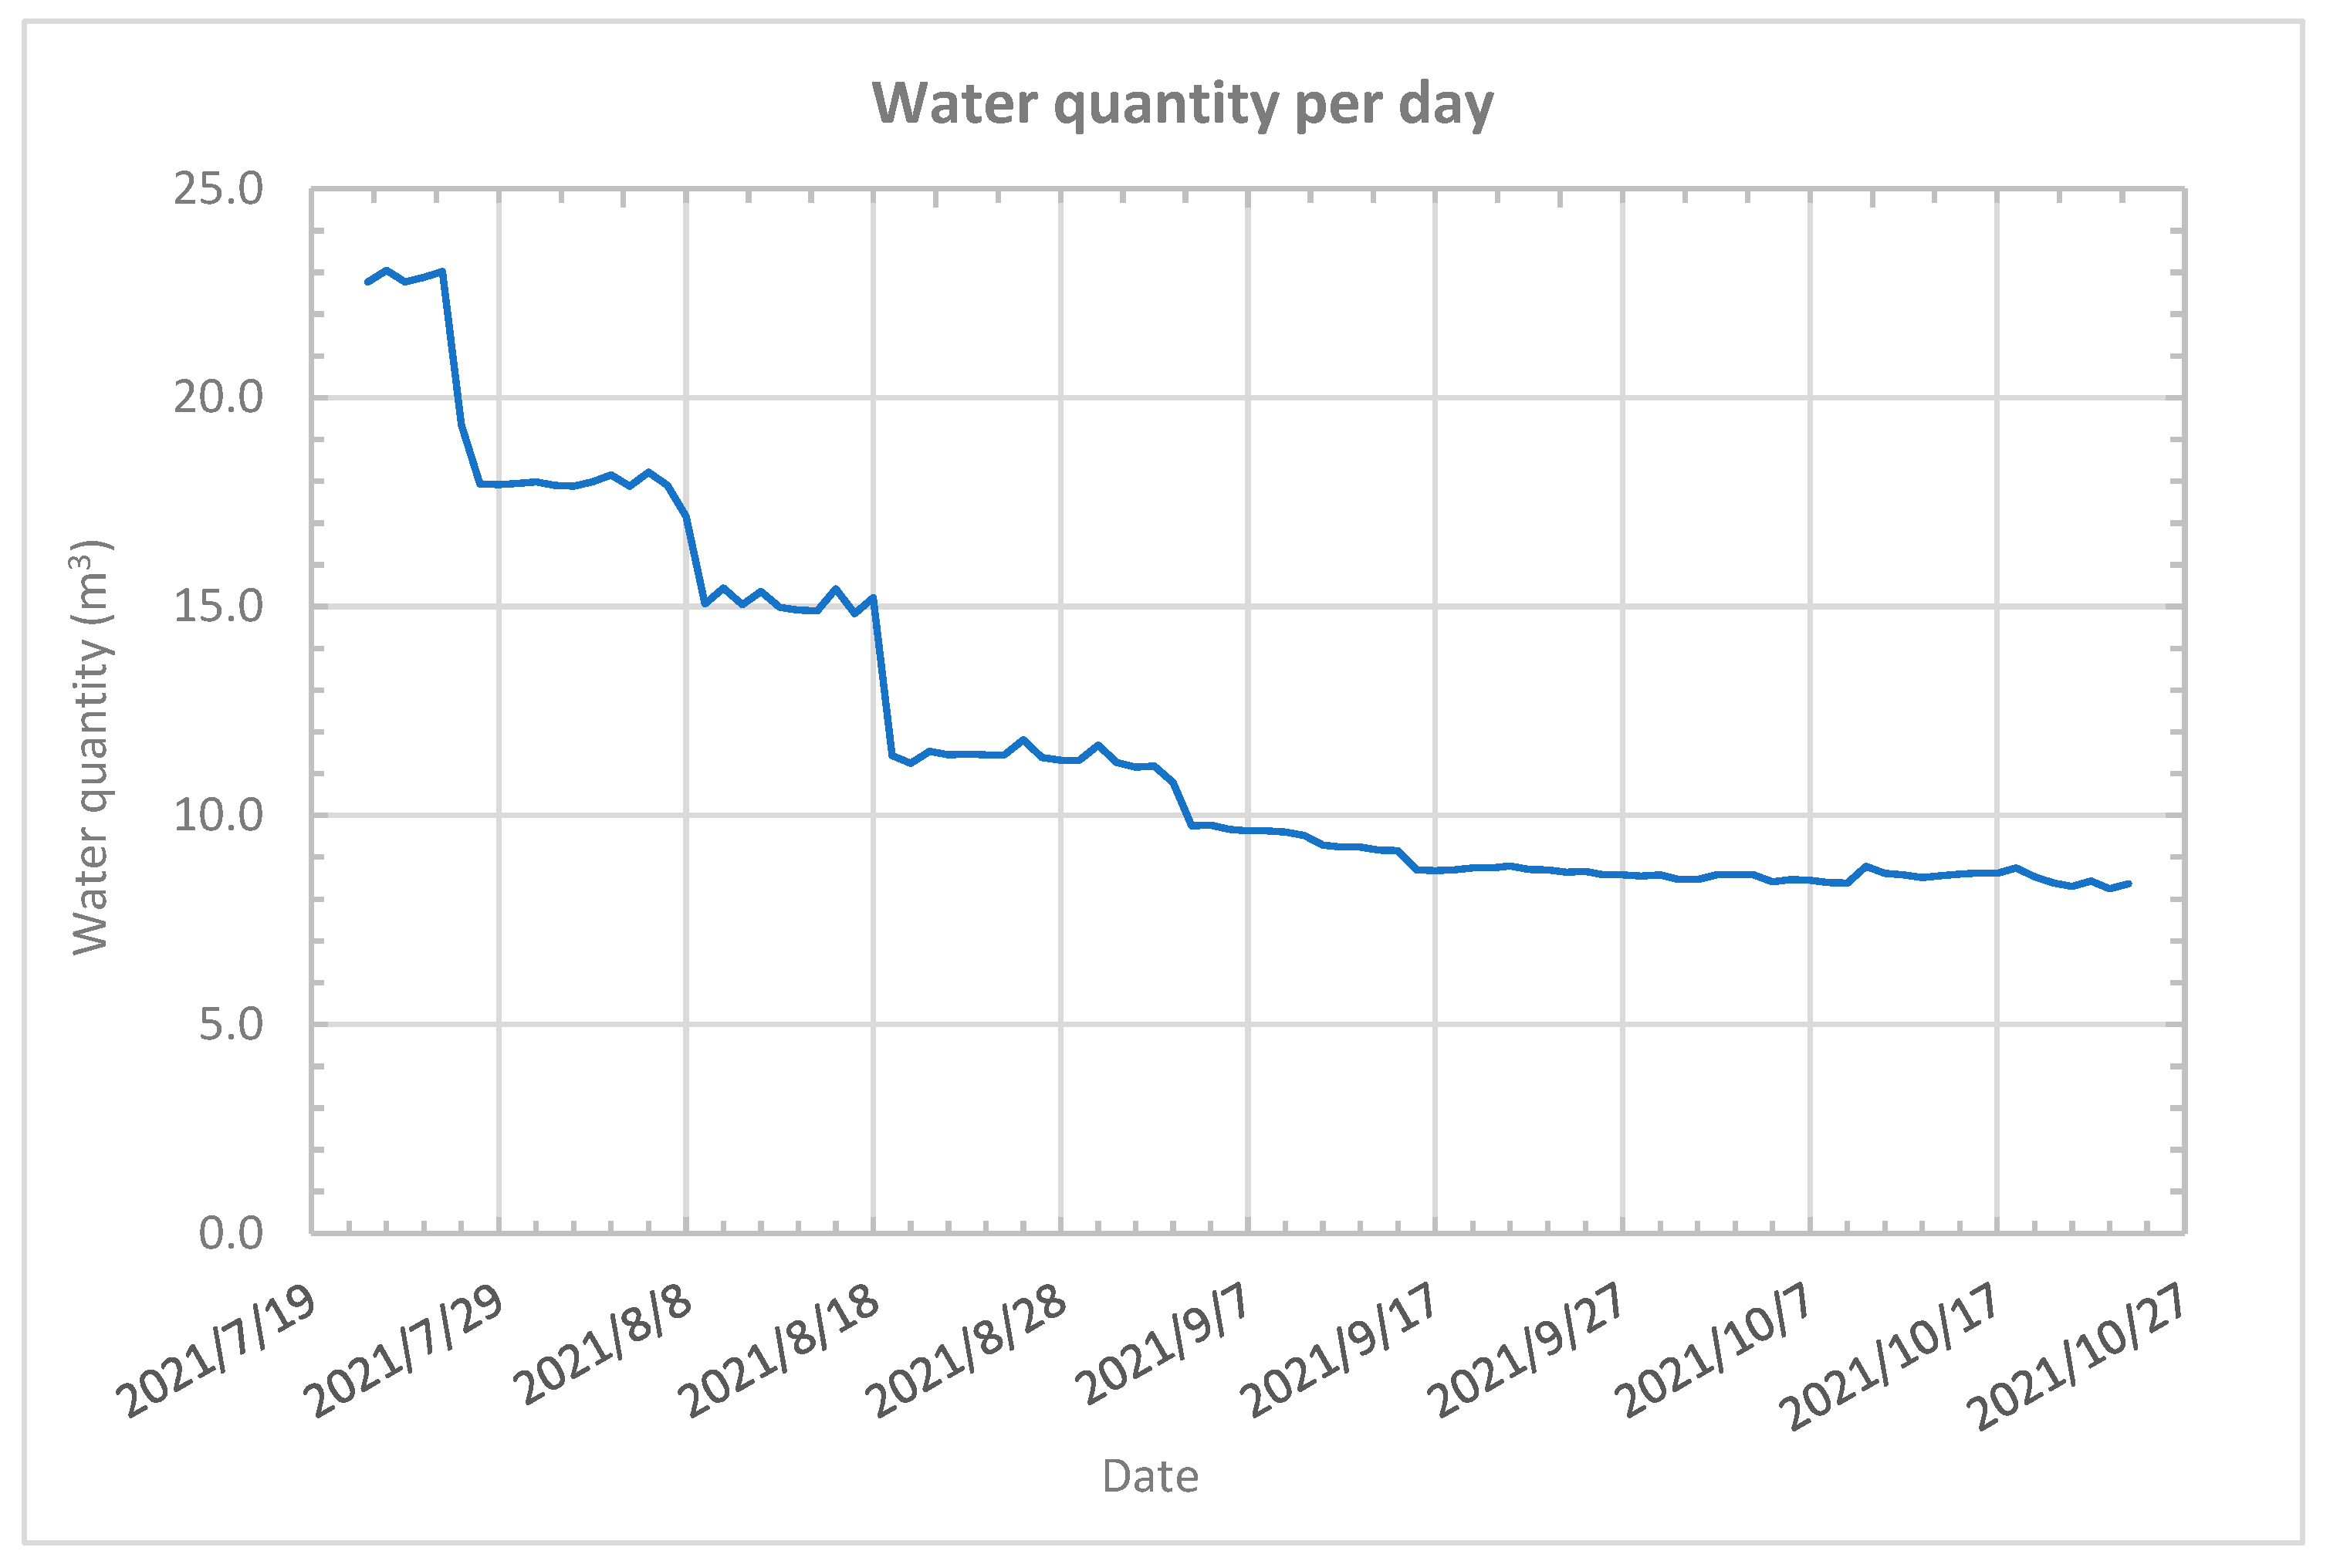
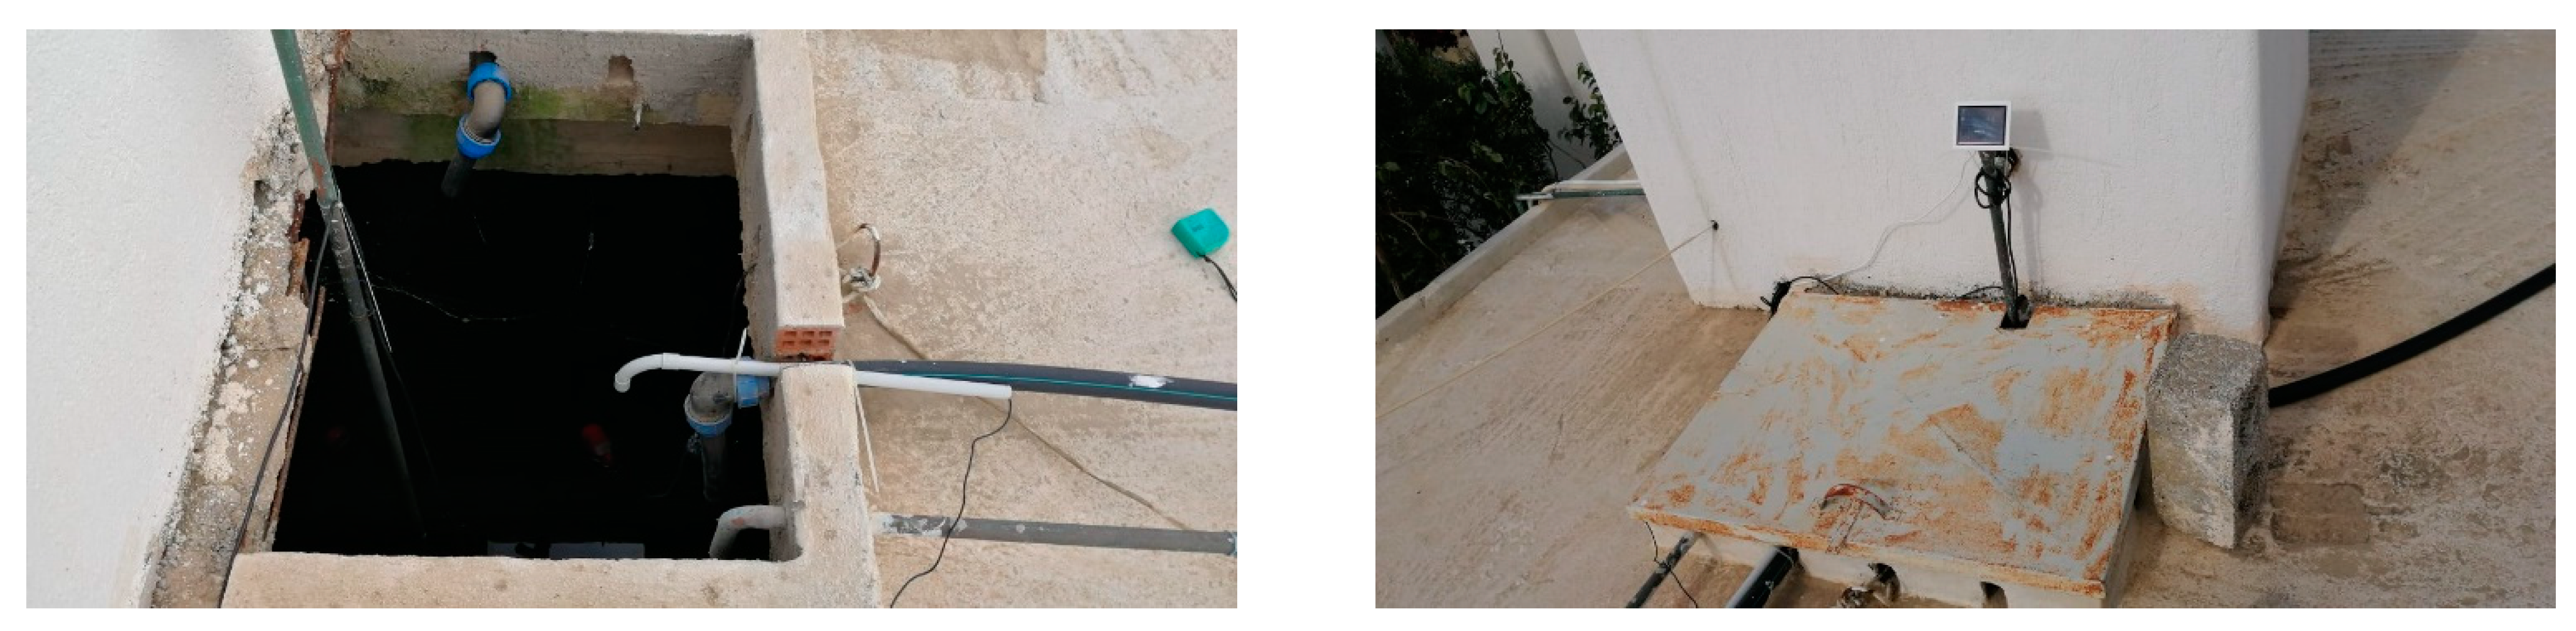
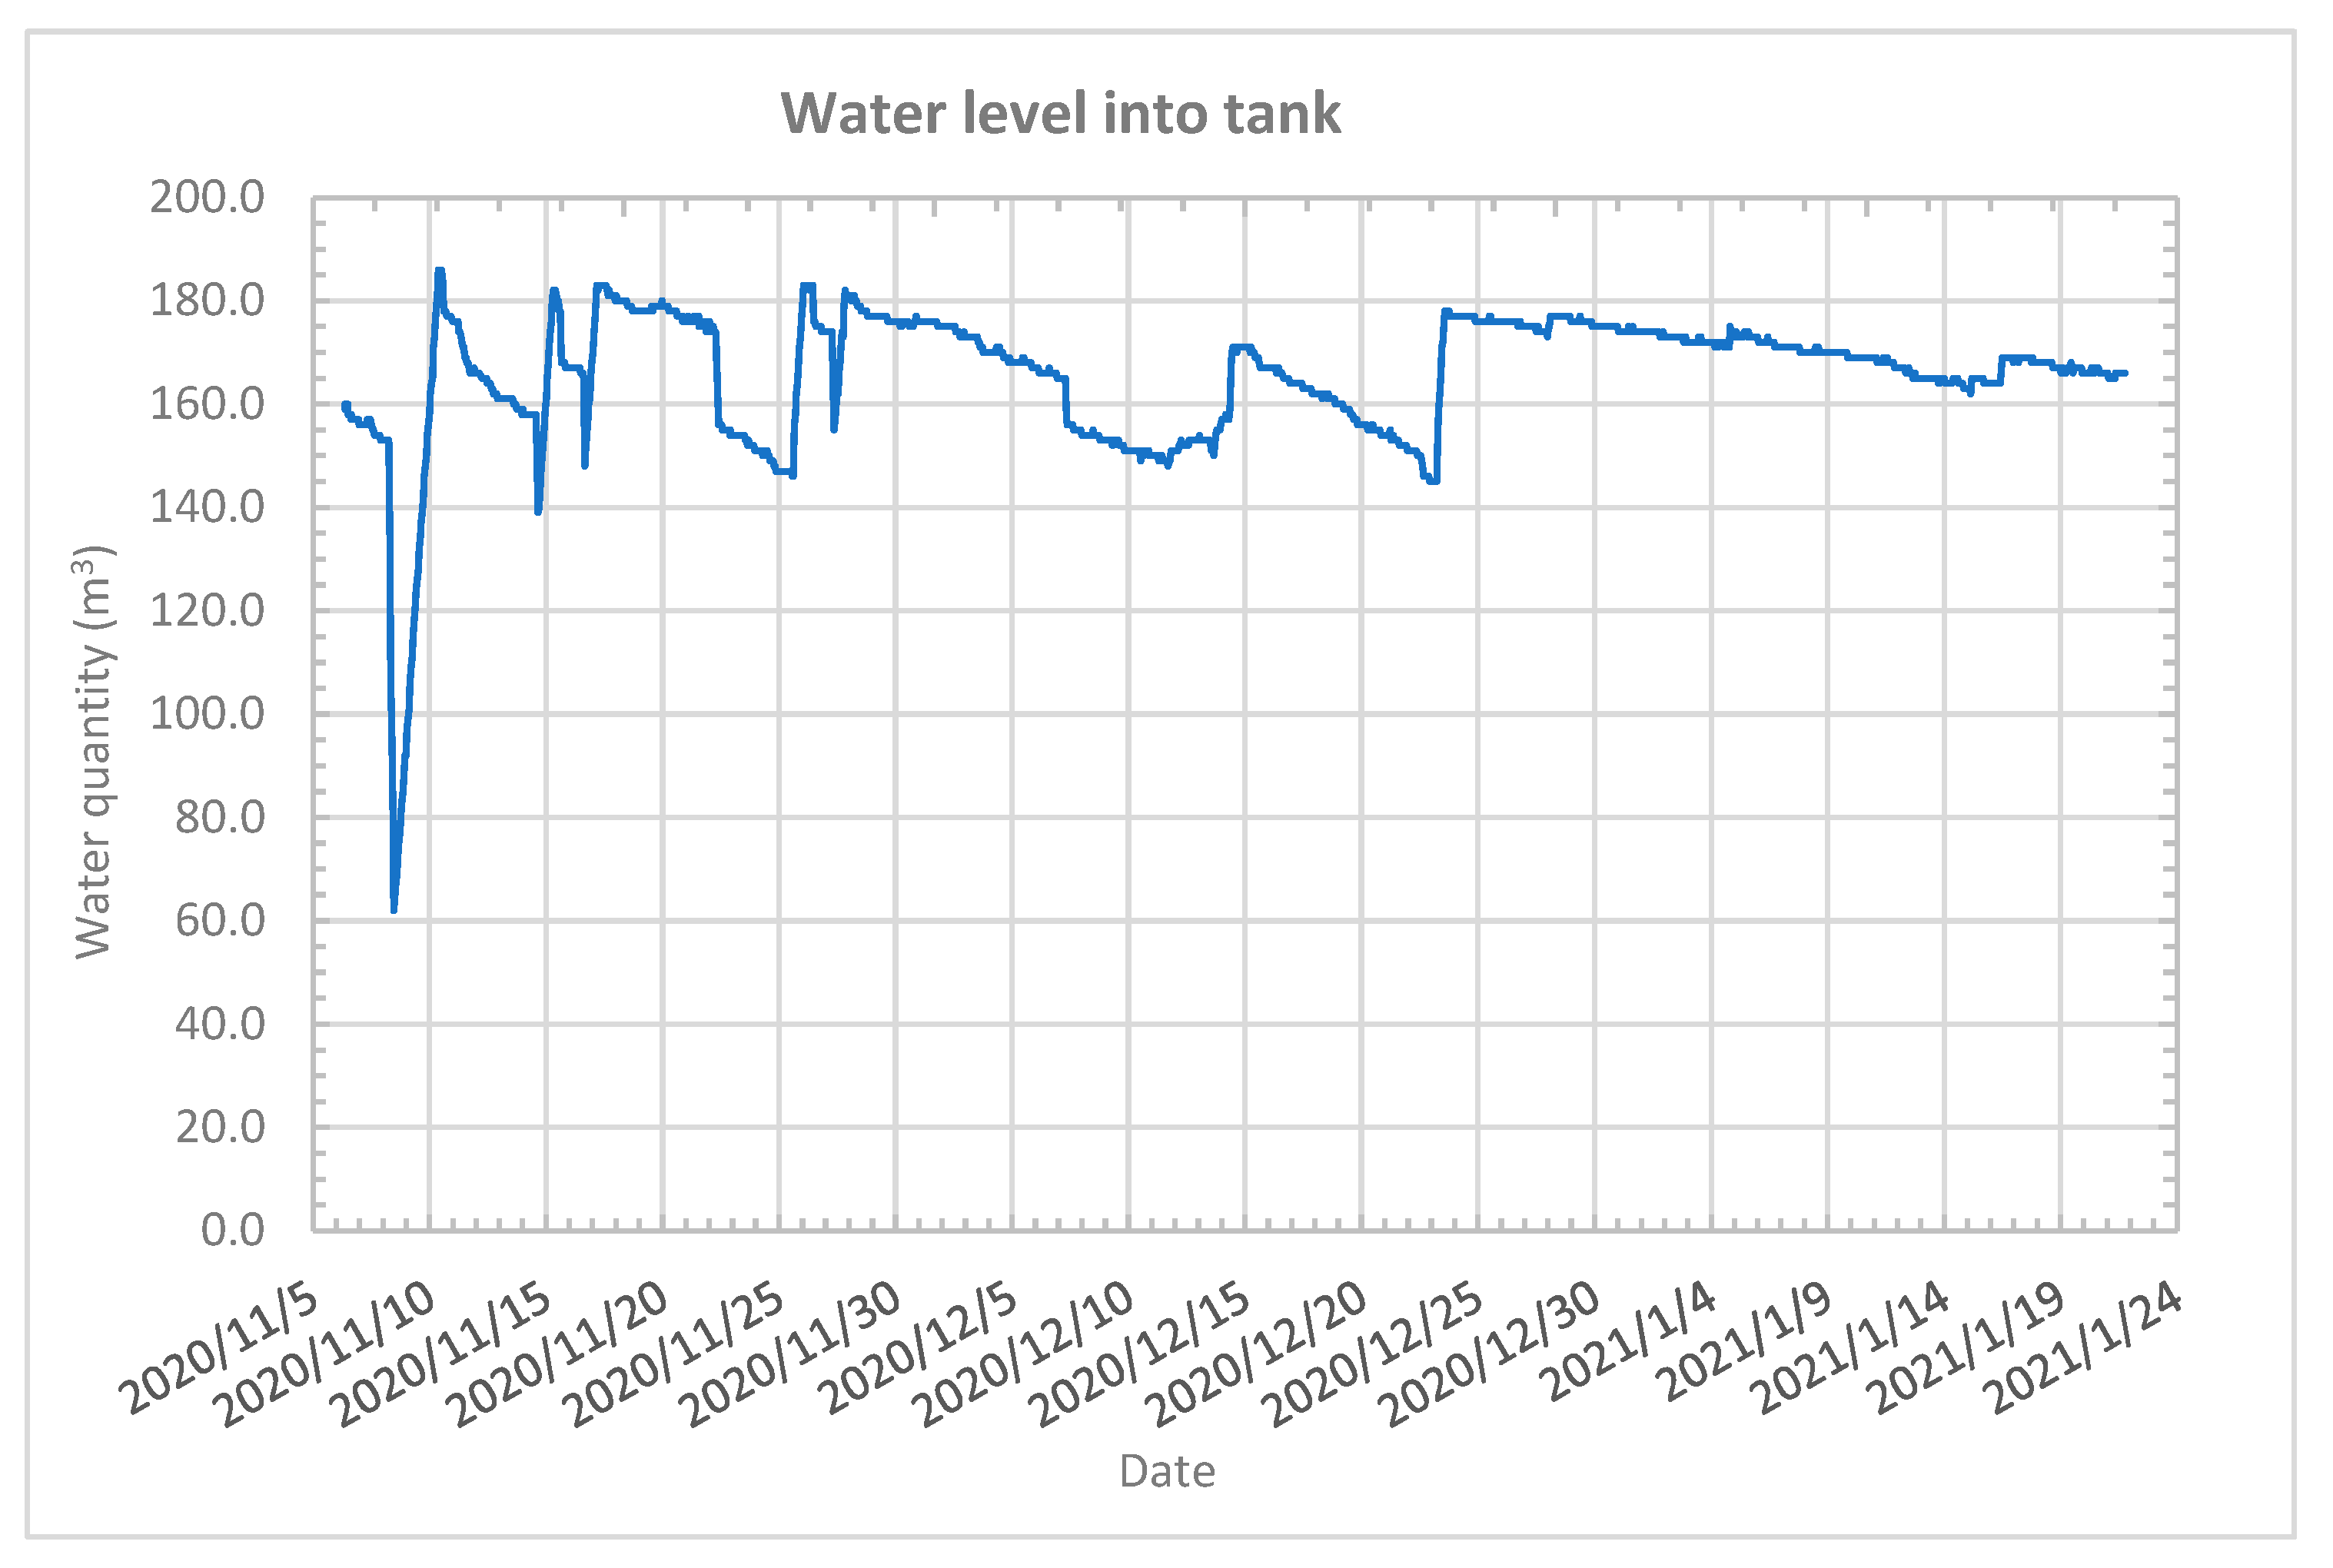
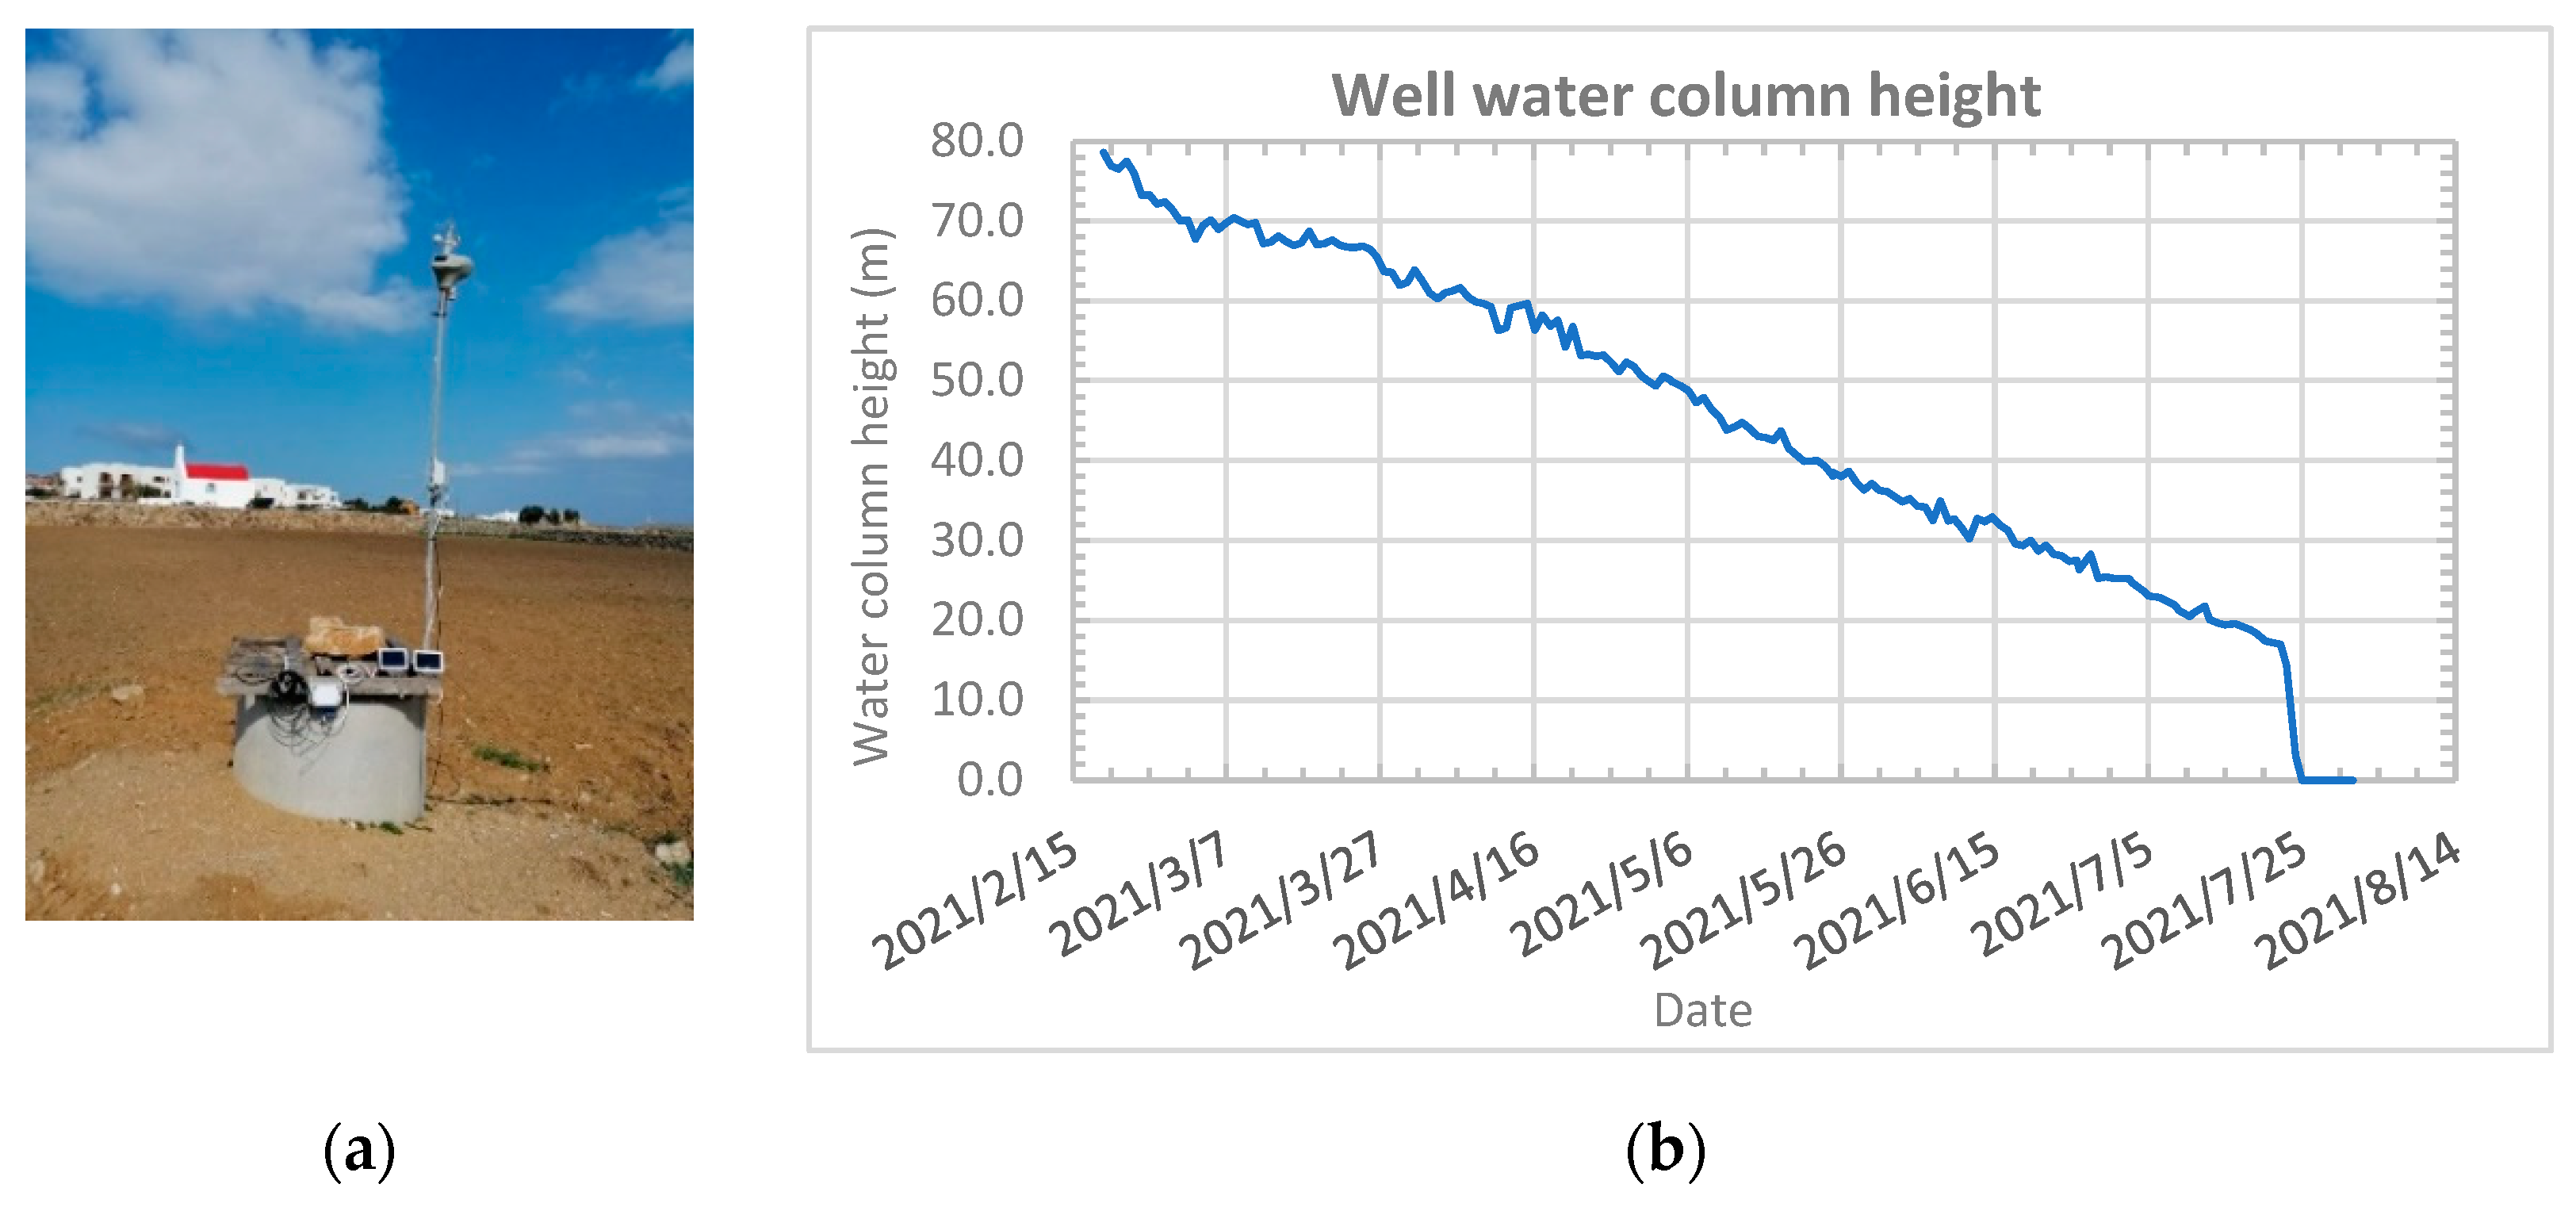
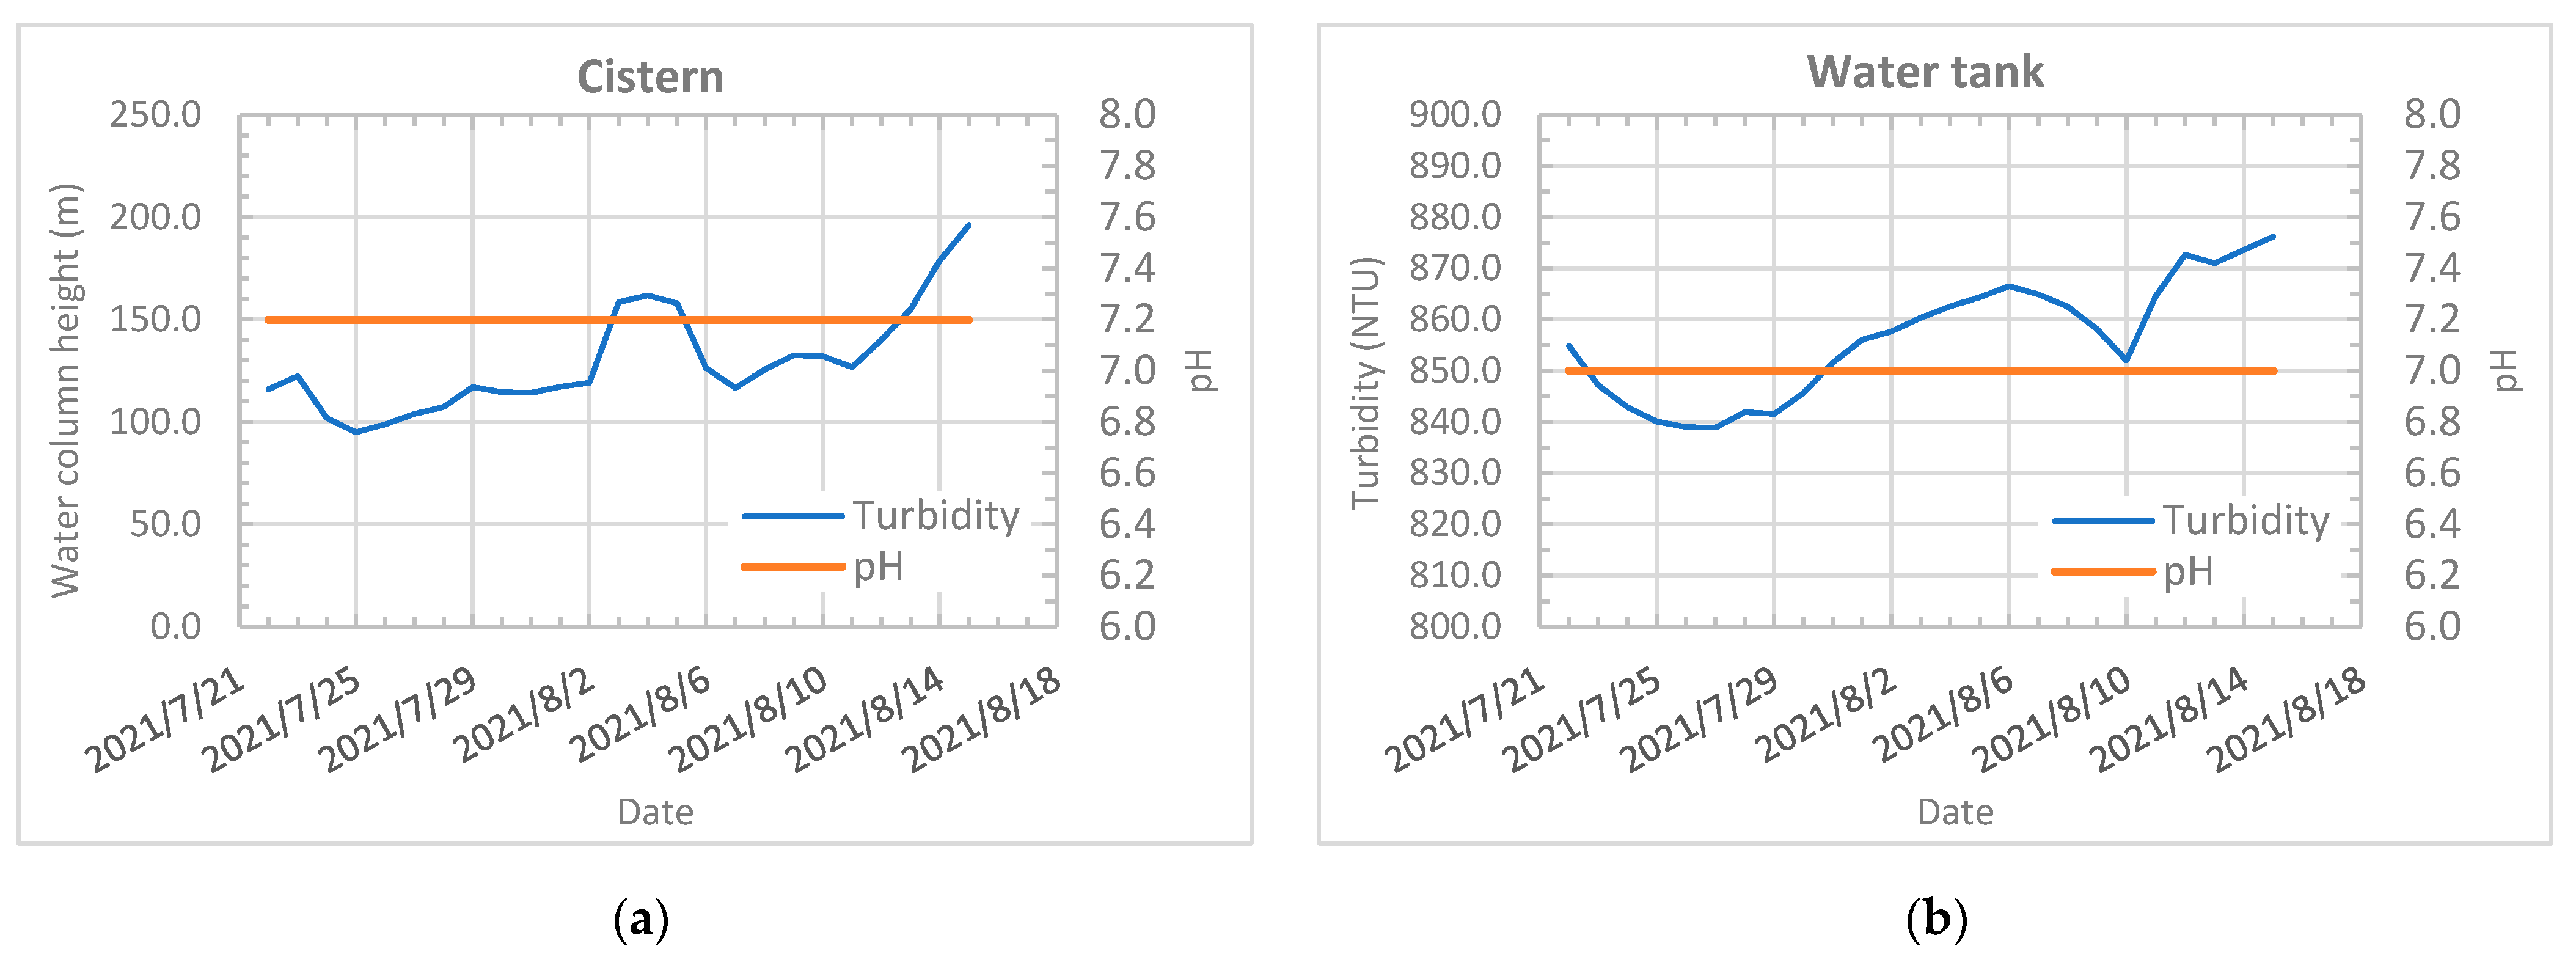
3.2. Management of Stored Water

In Mykonos Island, two open top tanks were constructed for storing rainwater from a sub-surface rainwater collection system (Figure 9).
The collected water was used for the irrigation of a 0.4 ha oregano field using the rainwater stored into the open tanks. As the intention was to minimize electrical power consumption, one small pressure booster pump in combination with electrovalves controlled by the IoT nodes was placed for controlling the water flow between the two tanks and for enabling irrigation (Figure 10a), while to determine the level of stored water into the tanks, ultrasonic sensors (SR04T, AGENSO, Athens, Greece) were used (Figure 10b).
Depending on the water quantity monitored in each tank, and according to the thresholds defined by the user, the appropriate electrovalve is opened to irrigate the crop using the water stored in one of the two tanks. Figure 11 projects the sum of the water quantity stored in both tanks during the period from 22 July 2021 to 23 September 2021. The small differences that were observed during the monitoring (±0.5 m³) come from the effect of sunlight on the accuracy of the level measured by the sensors.
Additionally, on a nearby house, a tank was constructed on its terrace to provide water for domestic use and to irrigate the 0.2 ha lavender field adjacent to it. To monitor its quantity, a node with an ultrasonic sensor was installed (Figure 12).
This tank can be refilled with rainwater collected on the rooftop or by pumping water from a nearby well. When the tank level is lower than the threshold defined by the user, the pump of the well is activated by another node. Figure 13 presents the water level of the aforementioned tank on a daily basis.
In the case of rain, the excess water on the rooftop is directed after slow sand filtration to recharge water into a nearby confined aquifer, mitigating the long-encountered problem of saline water intrusion. To monitor the water in the aquifer, a well was constructed (Figure 14a) and its water depth was monitored using a submersible pressure transducer (SR05W, AGENSO, Athens, Greece) (Figure 14b). The measurements showed that the water depth reduced day by day in an almost steady rate, leading to the discovery of a fracture on the selected aquifer, which caused this water loss.

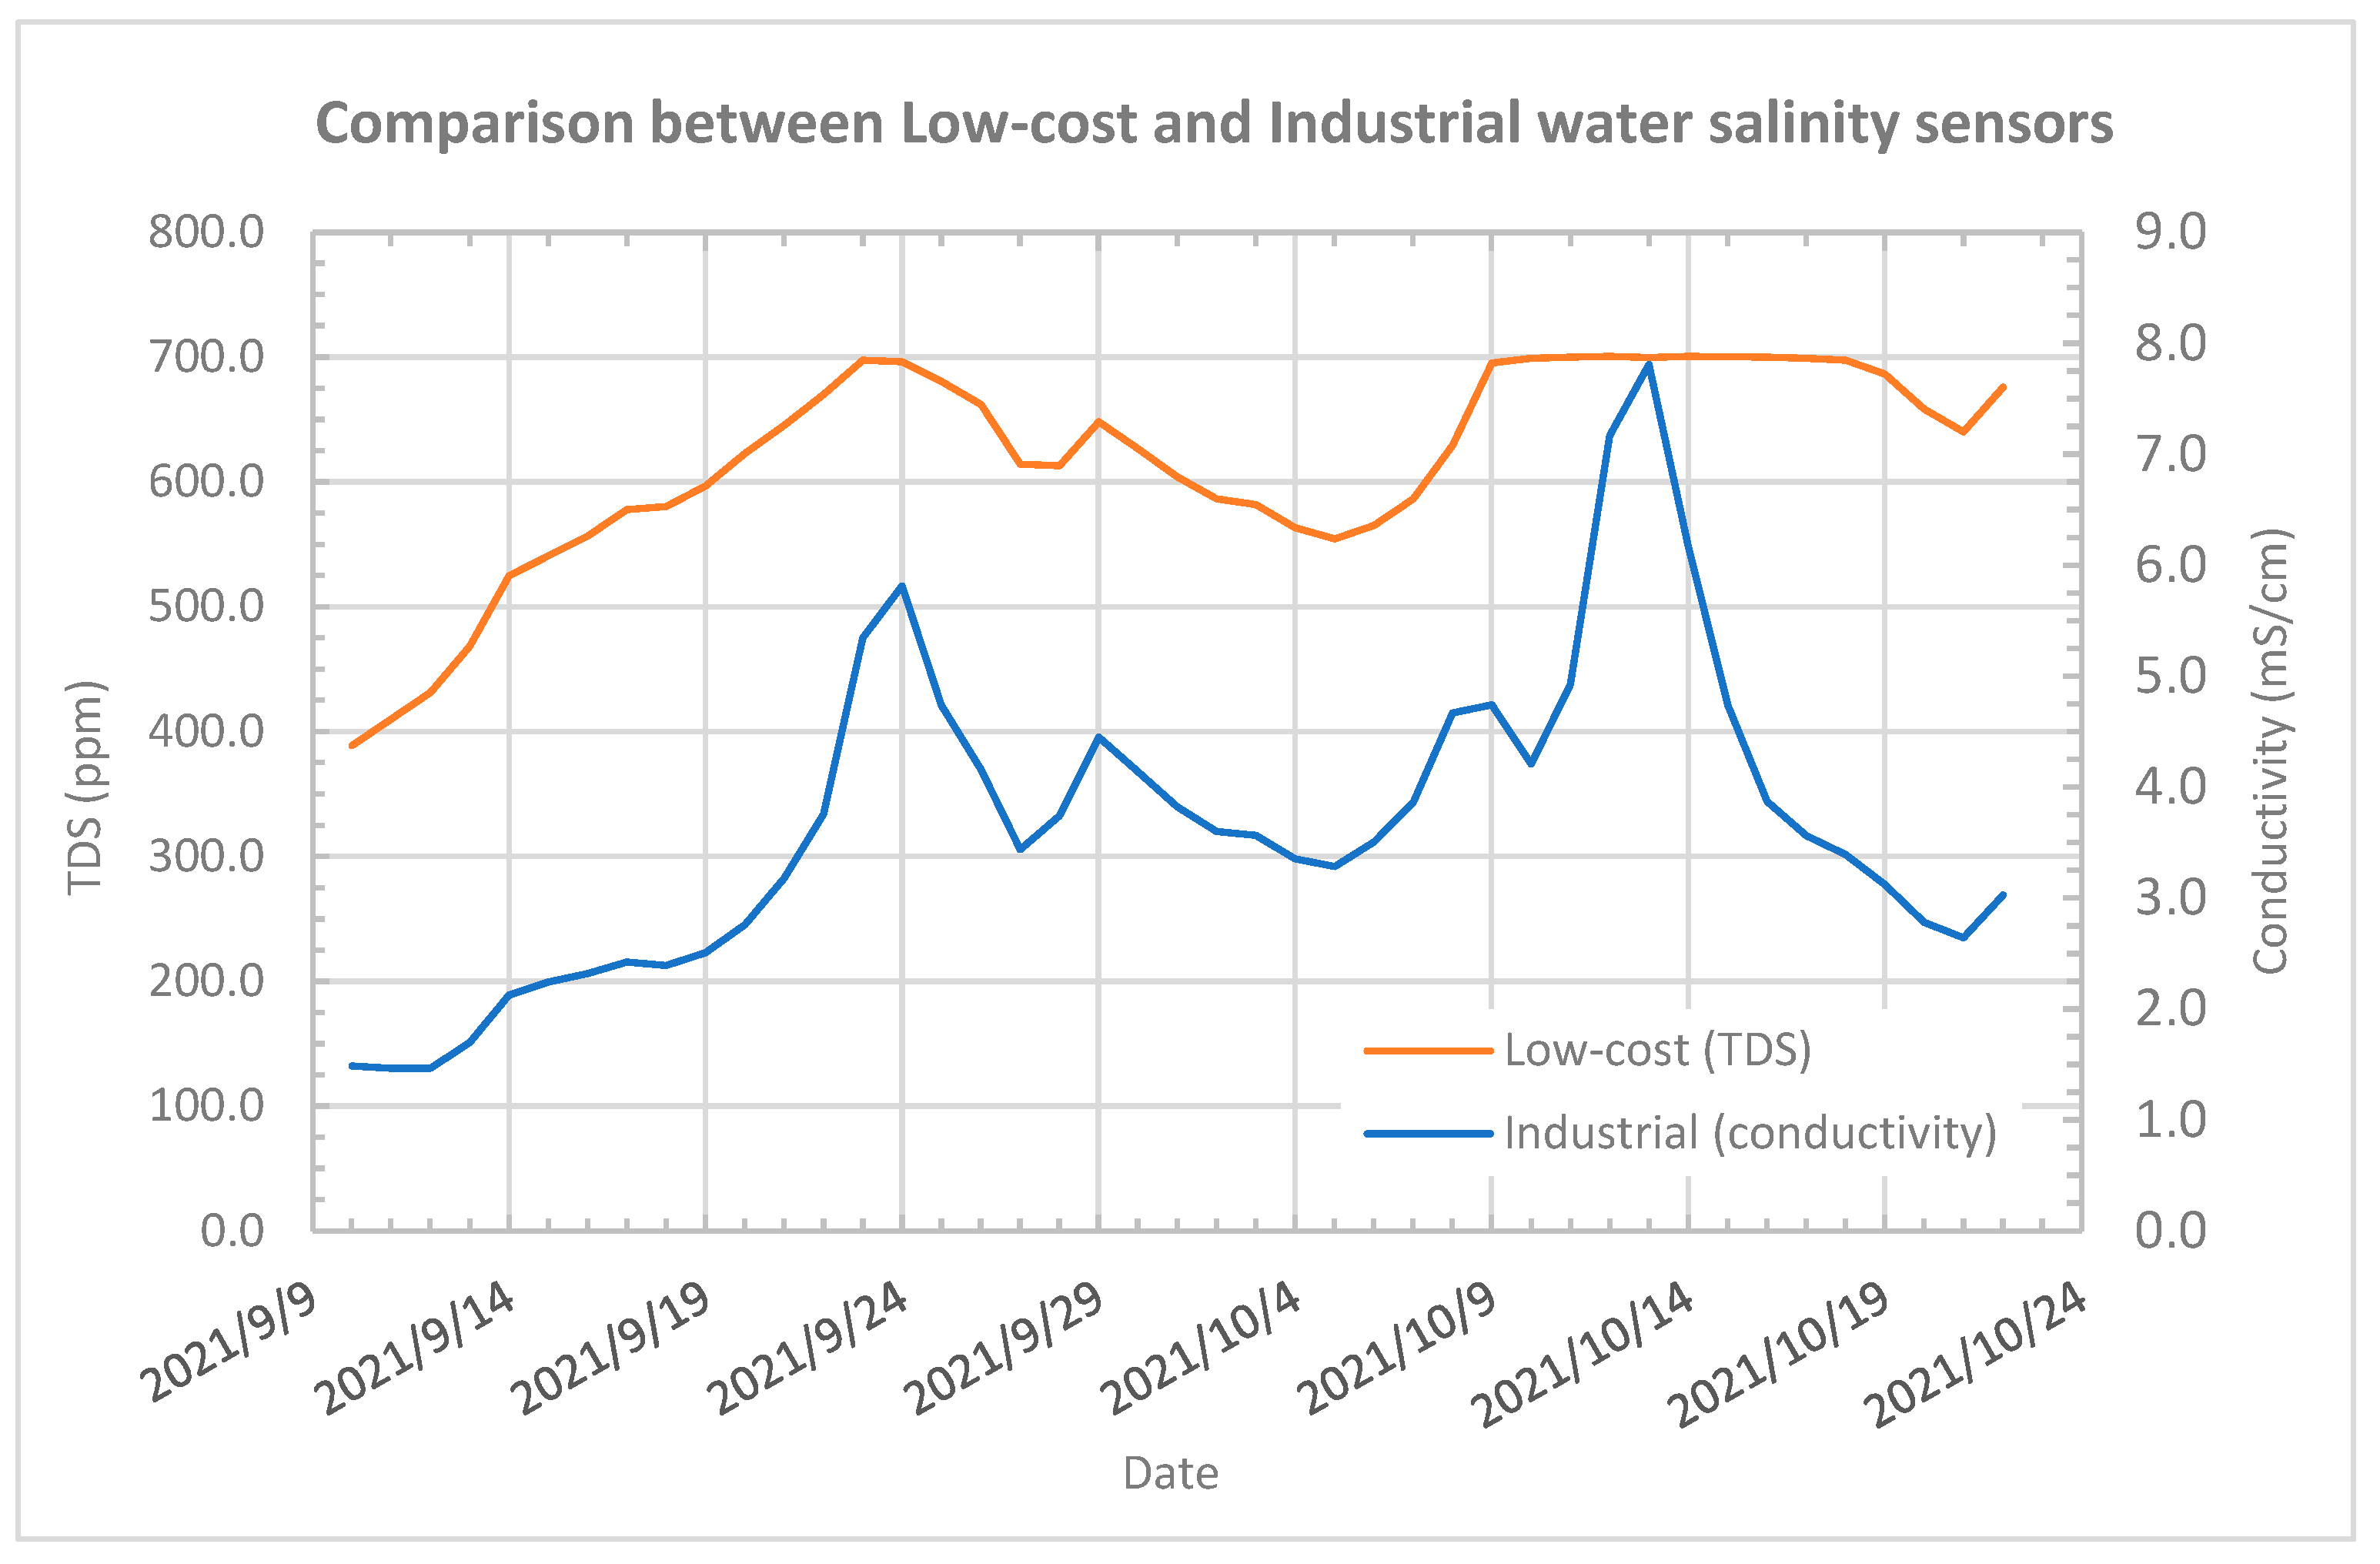
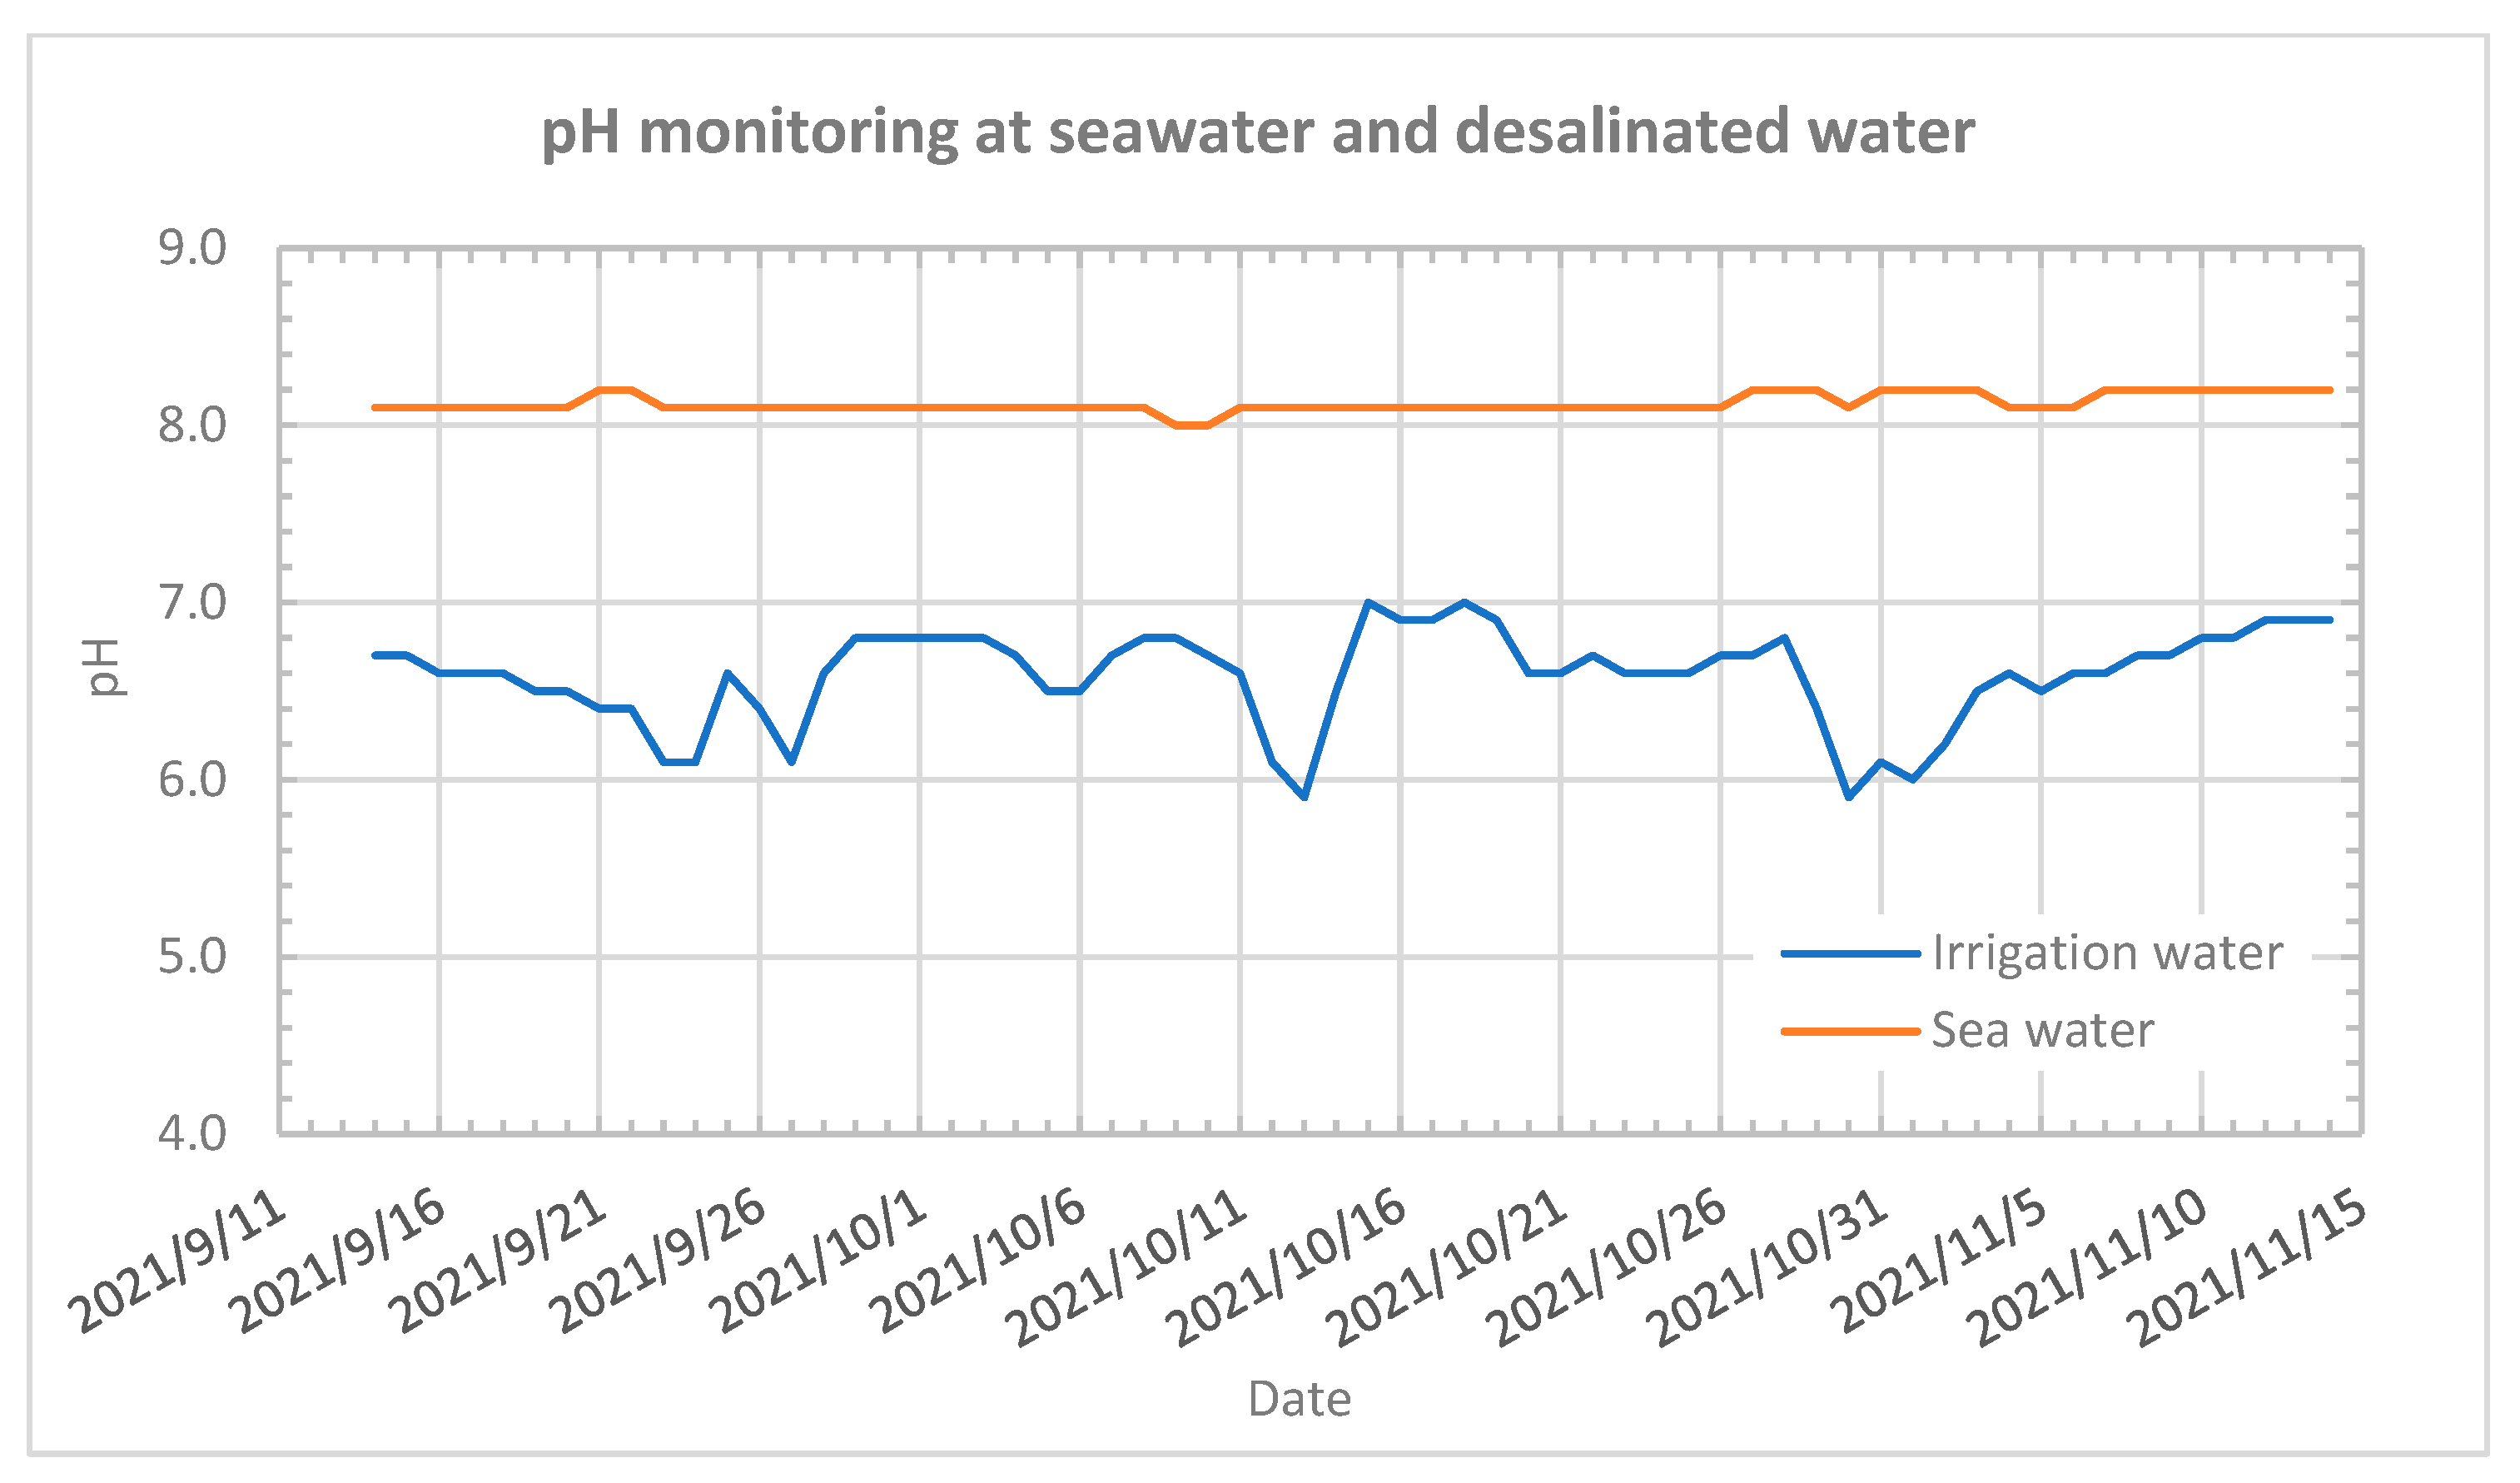
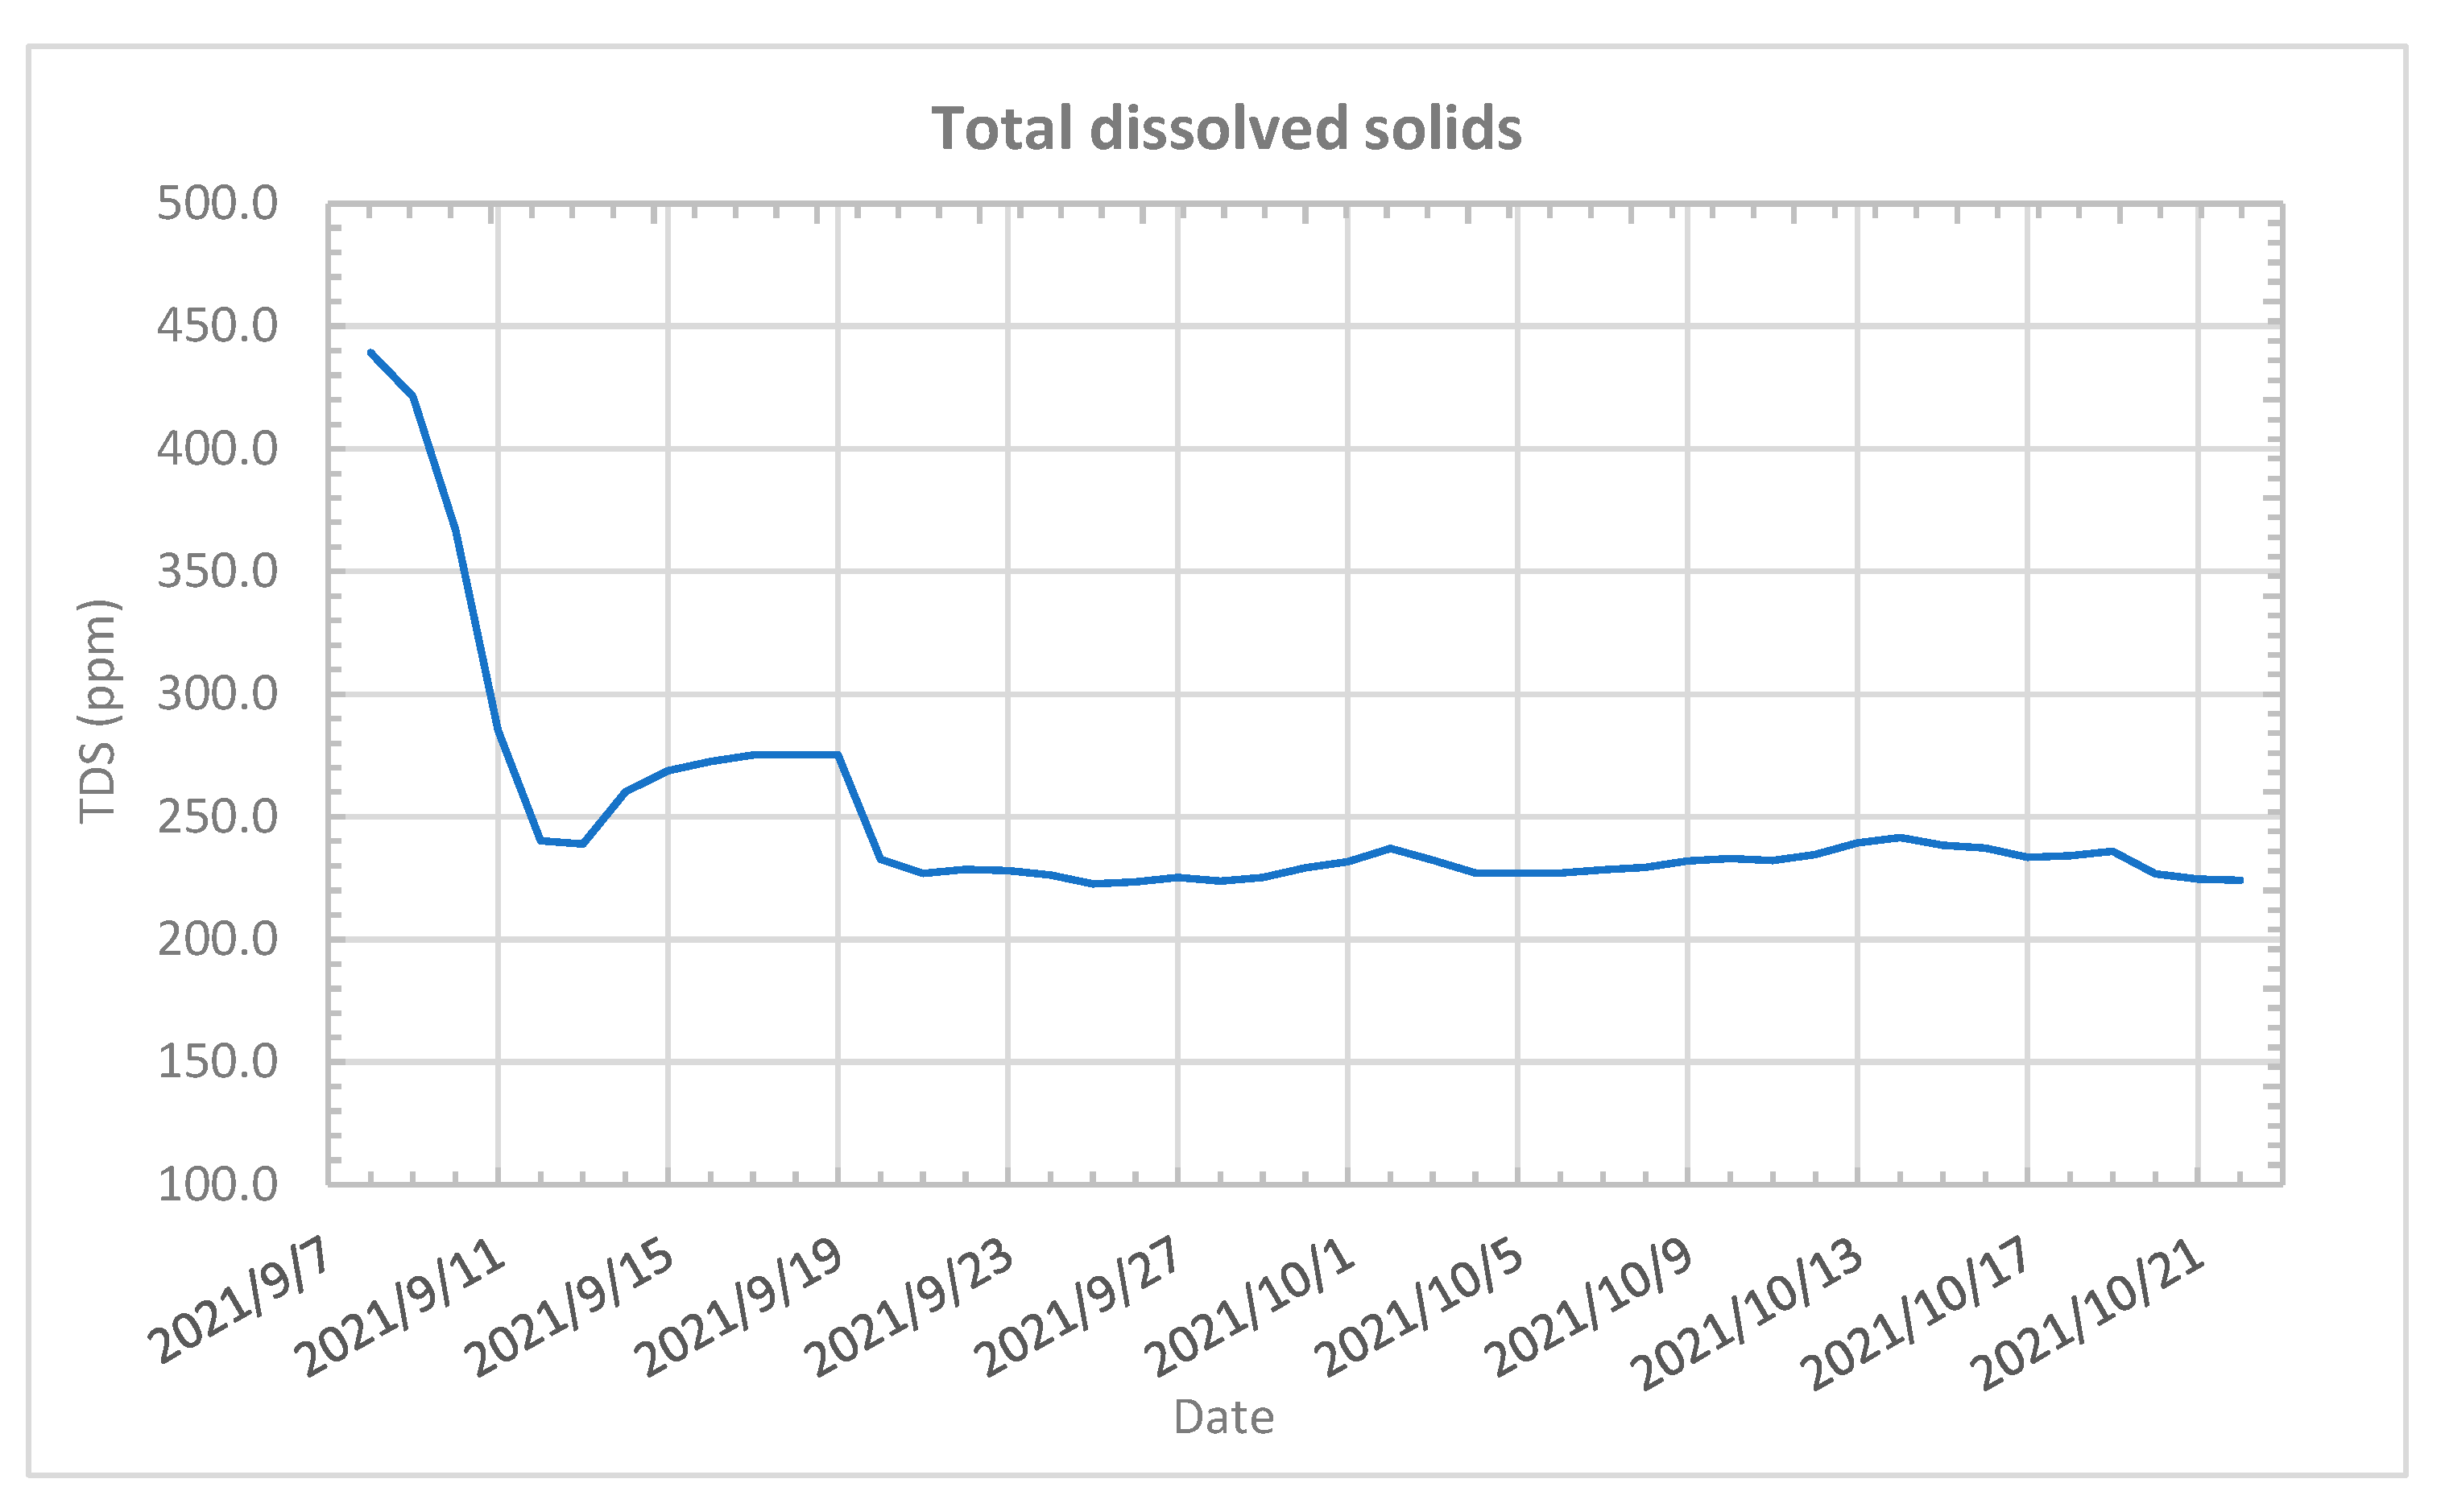
3.3. Water Quality Measurements for Decision Making According to Its Quality

In Tinos Island, a low-cost desalination system based on the principles of evaporation and condensation was developed, as shown in the lower part of Figure 15, for irrigating the crops in the greenhouse that was constructed beside it.
Seawater was pumped into a tank used for storing sea water, then transferred into the system for desalination, stored in a second tank (Figure 16a), and finally was transferred to a third bigger tank used for the irrigation of the greenhouse crops (Figure 16b).
To evaluate the performance of the desalination process, IoT nodes with water quality sensors were placed in the tanks for monitoring its quality parameters. Figure 17 presents the pH measurements in the seawater and desalinated water tanks.
The pH in the seawater tank varied between 8 and 8.2, with the desalinated water having differentiations on its pH, as it was affected by the performance of the desalination system, which varies depending on the weather conditions. As the salinity of the water can affect crop performance, the total dissolved solids (TDS) of the water stored in the irrigation tank were monitored. When TDS measurements exceeded the threshold defined by the user, tap water from the municipality’s water supply network was added into the irrigation tank for mixing the salty water and reducing its final salinity, as shown at Figure 18.
Moreover, the proposed system was used to measure the water quality and quantity of various open and closed type tanks in an eco-tourist facility. The quality measurements were used by the system to decide whether the water can be used to irrigate edible crops. In the case that the quality of the water was not acceptable for irrigation of edible crops as a result of its high turbidity, the water was used for the irrigation of non-food crops that were cultivated according to EU 2020/741 water reuse standards. Figure 16 presents the installation of the developed system in an open cistern used for collecting rainwater (Figure 19a) and in a closed tank (Figure 19b) used for collecting the reclaimed water coming from the facility. The pH and turbidity measurements of each tank are presented in Figure 20a and Figure 20b, respectively.

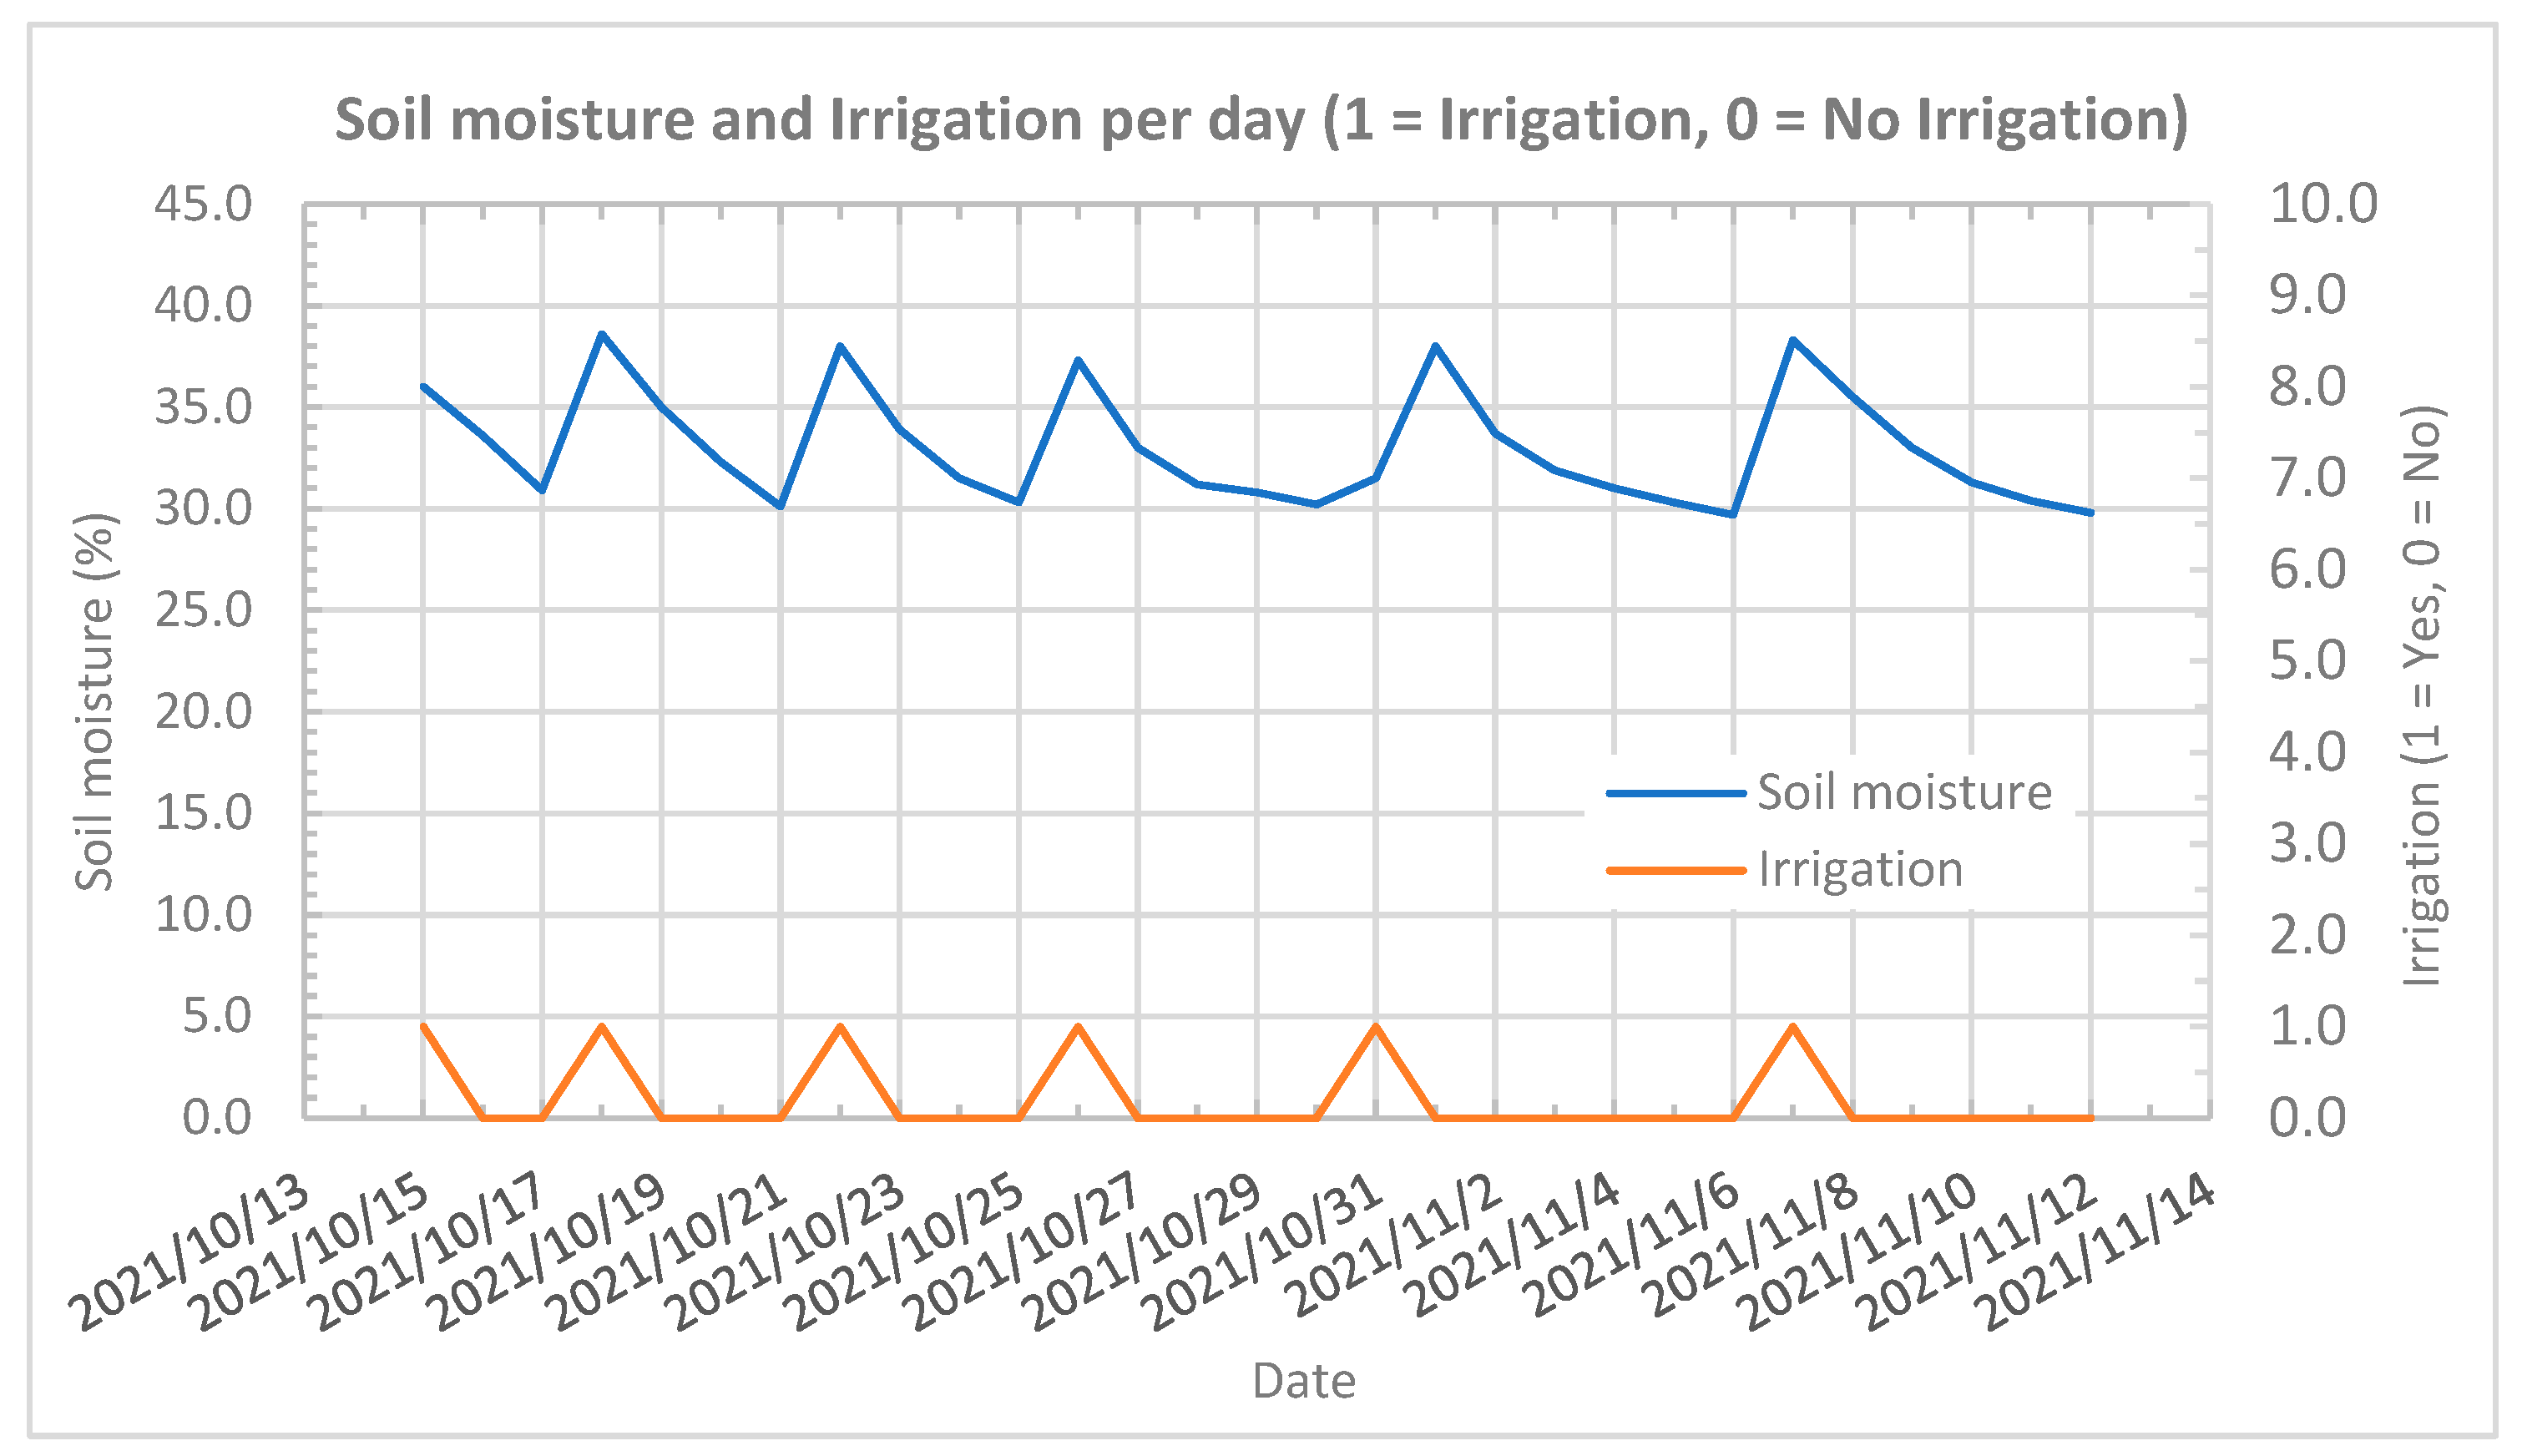
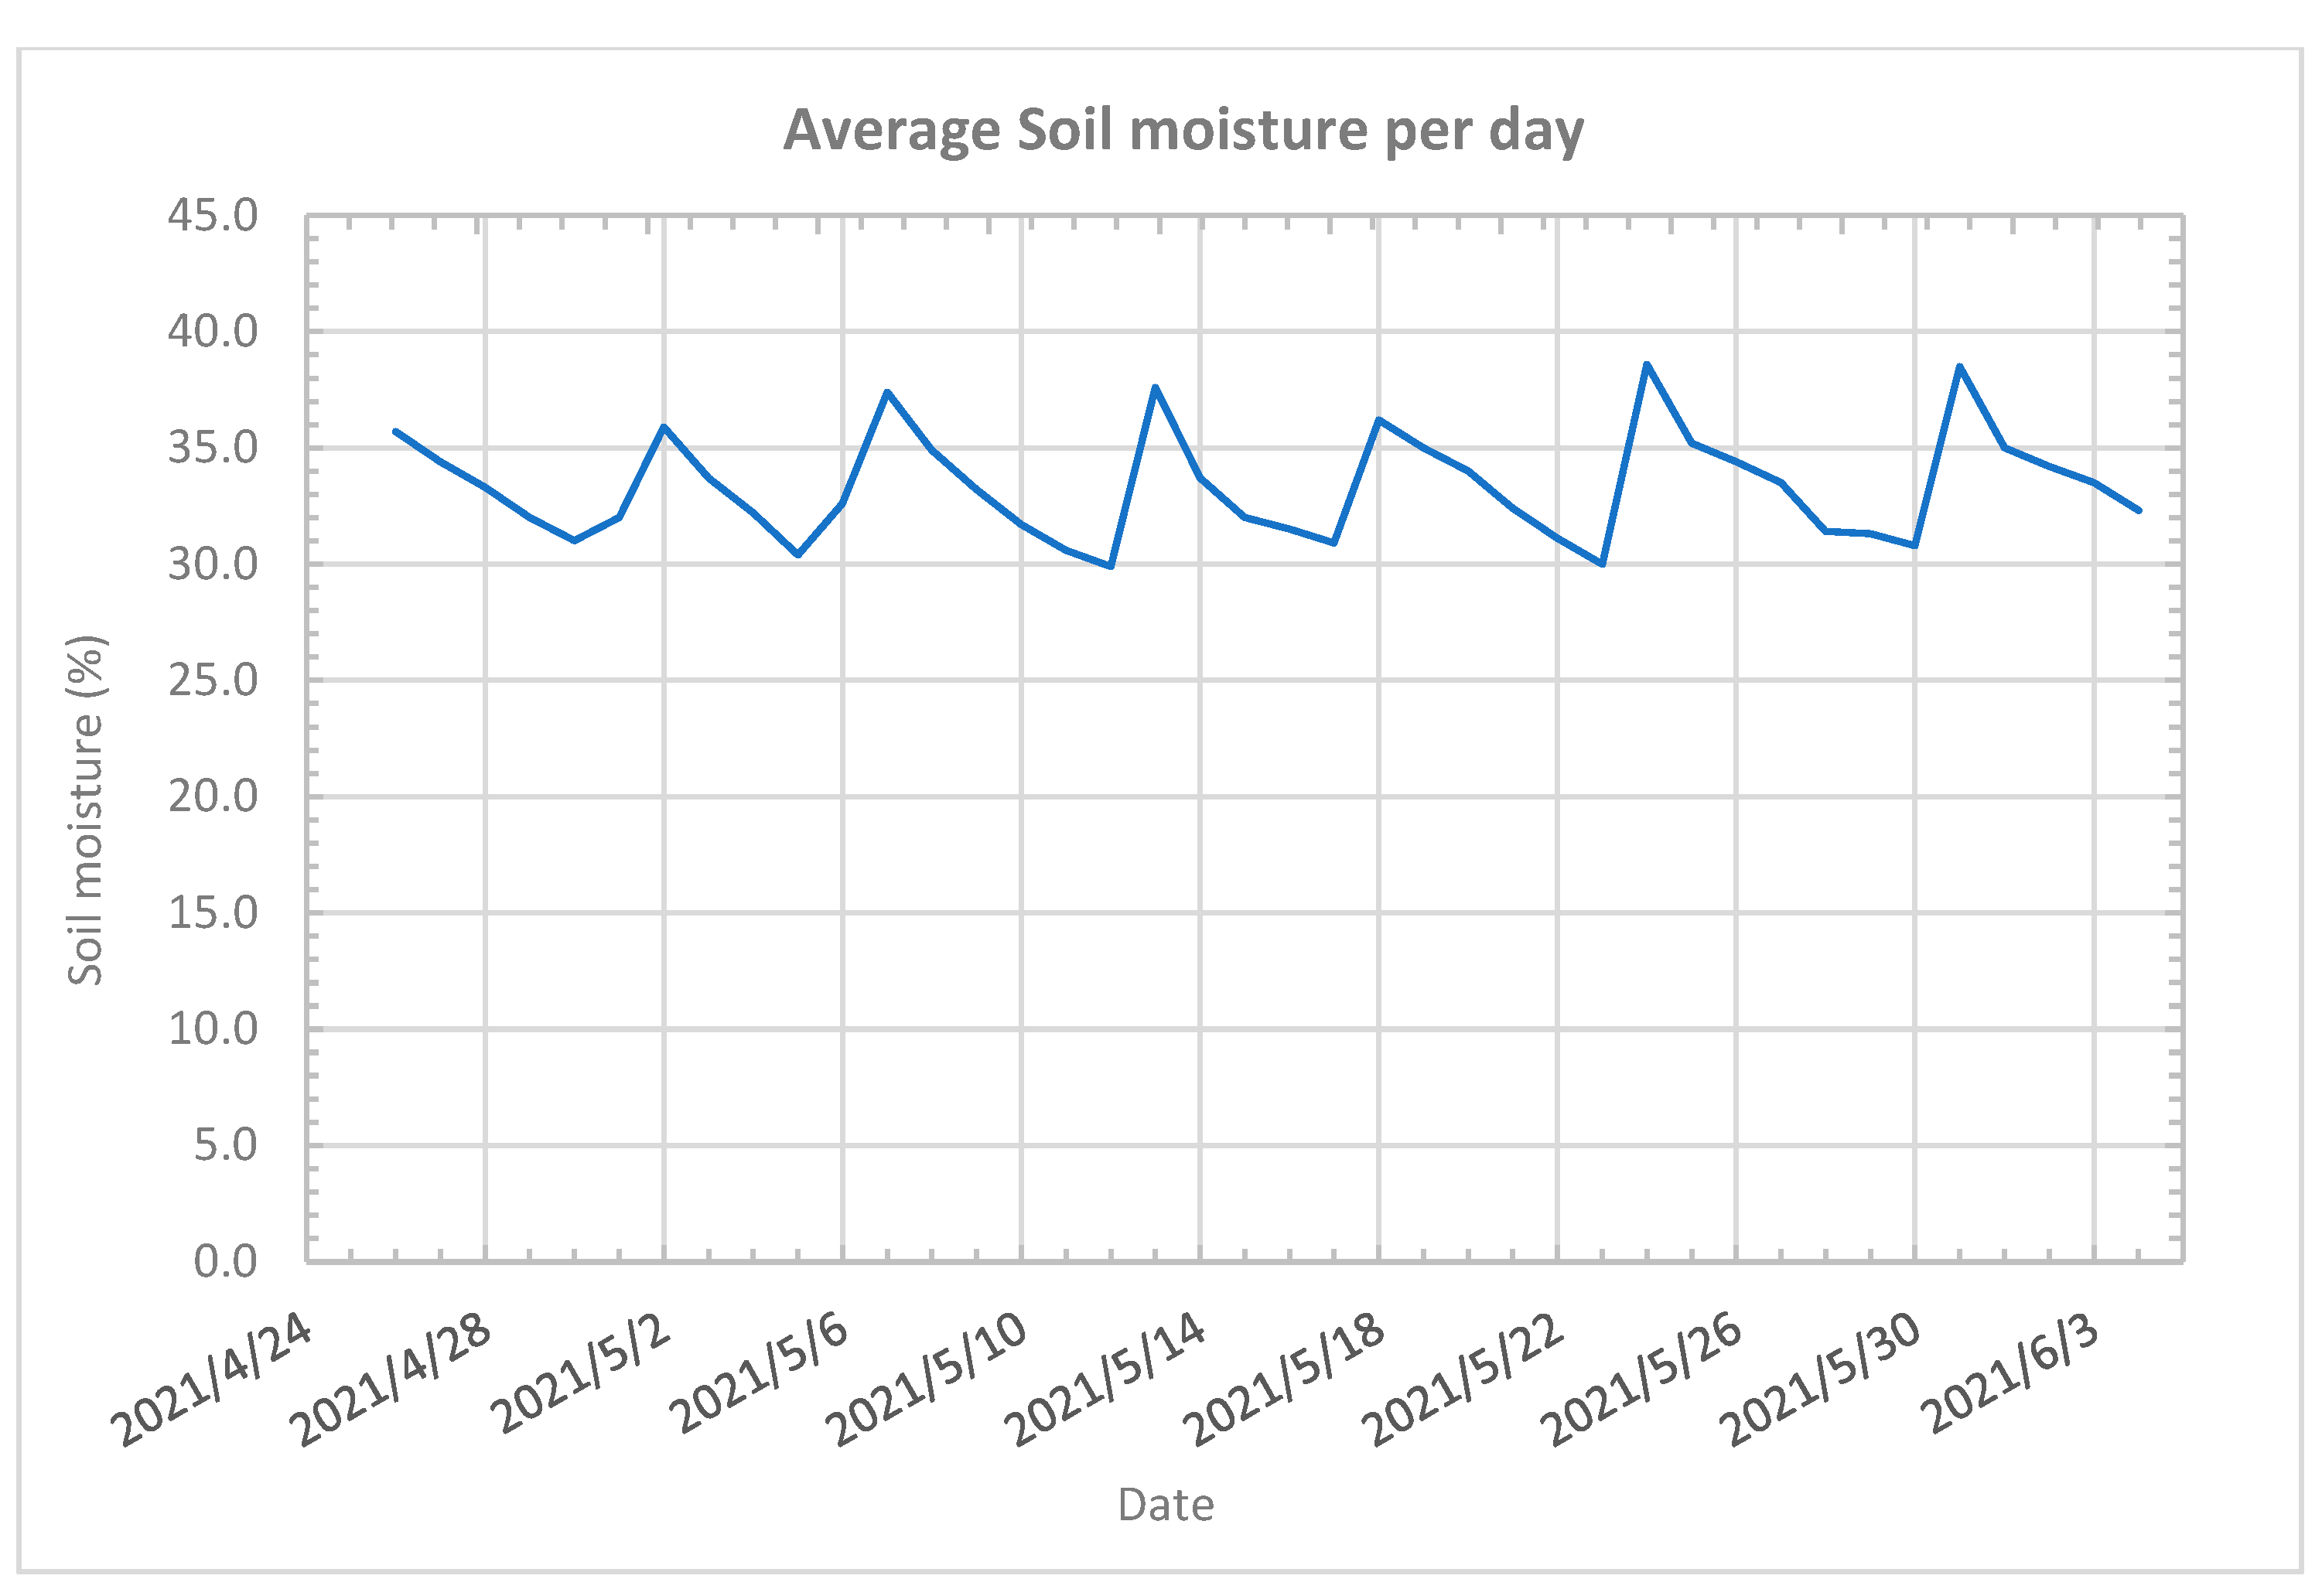
3.4. Irrigation Scheduling

The accuracy of the data provided in combination with the IoT node, which can be installed in any agricultural cropping system and activate different actuators, shapes the system’s ability to perform precise calculations of irrigation water needs and apply automated irrigation. To achieve this, the FAO56 Penman-Monteith model [41] for computing crop water requirements was used. All the parameters for determining evapotranspiration were retrieved from sensors connected to the IoT node for monitoring the microclimate and the soil, while electrovalves were controlled from the node for enabling automated irrigation. A greenhouse was split into four plots, in which different tropical crops, such as bananas and pineapples, were cultivated. The irrigation of each plot was achieved using a drip irrigation system, and the irrigation schedule was fully automated using the developed IoT node (Figure 21).
Figure 22 presents the average soil moisture per day and the days in which irrigation was applied (1 = Irrigation, 0 = No irrigation) from 15 October 2021 to 12 November 2021. From the figure, it is clear that the system was capable of efficiently irrigating the crops without stressing them, keeping soil moisture between 30 and 38%. Moreover, as evapotranspiration reduces during the winter, it clearly seems that the frequency of irrigation is lower in November compared to that in October.
The system was also tested in open crops. Figure 23 presents the average soil moisture per day, in a clay loam field cultivated with onions that was automatically irrigated by the system.

3.5. Energy Autonomy

As the developed node can provide extensive autonomy, a node was installed on 1 December 2020 in a forest, configured to have a sampling rate of 8 h for minimizing its consumption, as the high and dense canopy of the trees does not allow recharging using solar panels and negatively affects the mobile network signal strength. As a result of the weak signal, the node communicated using a normal communication protocol (GPRS–2G), which has a higher energy consumption compared to low-power protocols, but provides a higher range of coverage. After one year of operation, on 20 February 2022, the remaining battery capacity was 64%, achieving an average energy consumption of 2.4% per month.
With a sampling rate of one hour, which is acceptable in most cases of agricultural monitoring (e.g., soil moisture content measurements), the system has an energy autonomy of 210 days. This makes the IoT node ideal for using it on any annual crop, as it can work during the entire cropping period without recharging. In the case that more intensive measurements are needed, a solar panel of less than 0.5 W is capable of providing to the node the energy required for its operation.

4. Discussion

The findings in this study indicate that low-cost technologies and standards can be used for developing low-cost, highly accurate, and easy-to-use systems that can be applied to enable irrigation scheduling and water management. As the node was exclusively based on the Arduino architecture and components, its hardware cost was very low, making it affordable to any farmer. The node was developed as a pure IoT device supporting cellular network technology protocols, making it capable of working in any area in which a cellular network is available.
Furthermore, as the price of sensors is constantly dropping, farmers can purchase sensors of high accuracy that can almost provide a perfect coefficient of determination (R2 = 0.9914) at a very low price, permitting the fast depreciation of the investment for the system. As these sensors can provide data of high quality, their use can help farmers in decision making, by minimizing the inputs’ cost and increasing their production. Likewise, low-cost actuators can be applied for automating and for remote controlling water management, increasing the usability of the system.
The sensors, after small modifications mostly related to making them waterproof, were introduced to be sufficiently reliable. More testing will be needed for evaluating their durability over time in the open agricultural environment.
The system was able to provide a variety of different type of measurements, including weather data, water quantity data, water quality data, and soil data. By computing crop water requirements, it was possible to automate irrigation scheduling providing the optimal water quantity, while simultaneously minimizing its consumption. Moreover, the system proved its capabilities on managing the different water sources in real environment in an extensive pilot testing that was conducted in three different pilot sites.
The system was developed as a “plug and play” device and pushing its start button is the only action needed for making the node fully functional. By adopting this simplified user experience, there is no need of any special knowledge or training for installing and configuring it, contributing on removing the demographic traits of the farmers barriers, which affect the adoption of new technologies.
Its small size, its durability, and its extensive energy autonomy make it suitable for a lot of cases, providing its effectiveness and usability. The final prototype was ready for testing in an operational environment in January 2020, and to date more than 200 systems have been installed. The system has proved to be extremely reliable, as to date there have been no hardware fails. Its development with open source Arduino technologies makes it modular, flexible, and upgradable to support more sensors and actuators than the existing ones, finally suggesting its capability for application in a vast number of agricultural operations in the future.
As the global population is constantly increasing and the cultivated areas are decreasing, new technologies will become a necessity as the only sustainable way for increasing agricultural output. It seems that low-cost IoT technologies will play a critical role in this transition, and they will contribute to the entering in the new era of holistic farm management, assisted by the extensive monitoring of the agricultural environment and automation of field operations.
Originally, the IoT system was developed for monitoring and controlling water to enable smart irrigation in open fields. As a result of its characteristics (very small size, energy autonomy, automation capabilities, high accuracy, support of different types of sensors, IP67 protection, and its low price), the node was already tested in various environments as forestry (monitoring of environmental parameters in forests), large water infrastructures (monitoring of water quantities), meteorology (for monitoring the weather), and for smart cities with very promising initial results.

5. Conclusions

From the presented results, it can be concluded that:
  • A low-cost, low power consumption, fully autonomous system of IoT for irrigation scheduling using different water sources was developed and tested successfully;
  • The easiness of setting up by incorporating low-cost sensors was proved in the presented applications;
  • The presented applications proved the reliability, accuracy, and flexibility of the proposed configuration of the system;
  • Low-cost solutions for automating field operations can be efficiently applied in the agricultural domain;
  • Easy-to-use systems can used by small size and elderly farmers and enhance the resilience of the farms.

Author Contributions

Conceptualization, Z.T.; methodology, Z.T. and E.S.; writing—original draft preparation, Z.T.; writing—review and editing, E.S., S.F., I.G. and T.G. All authors have read and agreed to the published version of the manuscript.

Funding

This research was supported by the Horizon 2020 research and innovation program “Demonstration of water loops with innovative regenerative business models for the Mediterranean region—HYDROUSA” (grant agreement No. 776643).

Institutional Review Board Statement

Not applicable.

Informed Consent Statement

Not applicable.

Data Availability Statement

Not applicable.

Acknowledgments

This research was supported by the Horizon 2020 research and innovation program “Demonstration of water loops with innovative regenerative business models for the Mediterranean region—HYDROUSA” (grant agreement No 776643).

Conflicts of Interest

The authors declare no conflict of interest.

References

  1. Rosegrant, M.W.; Ringler, C.; Zhu, T. Water for agriculture: Maintaining food security under growing scarcity. Annu. Rev. Environ. Resour. 2009, 34, 205–222. [Google Scholar] [CrossRef]
  2. Water Resource Issues and Agriculture. Available online: https://www.fao.org/3/T0800E/t0800e0a.htm (accessed on 1 May 2022).
  3. Jamroen, C.; Komkum, P.; Fongkerd, C.; Krongpha, W. An intelligent irrigation scheduling system using low-cost wireless sensor network toward sustainable and precision agriculture. IEEE Access 2020, 8, 172756–172769. [Google Scholar] [CrossRef]
  4. Nawandar, N.K.; Satpute, V.R. IoT based low cost and intelligent module for smart irrigation system. Comput. Electron. Agric. 2019, 162, 979–990. [Google Scholar] [CrossRef]
  5. Abba, S.; Wadumi Namkusong, J.; Lee, J.A.; Liz Crespo, M. Design and performance evaluation of a low-cost autonomous sensor interface for a smart iot-based irrigation monitoring and control system. Sensors 2019, 19, 3643. [Google Scholar] [CrossRef] [PubMed] [Green Version]
  6. Krishnan, R.S.; Julie, E.G.; Robinson, Y.H.; Raja, S.; Kumar, R.; Thong, P.H. Fuzzy logic based smart irrigation system using internet of things. J. Clean. Prod. 2020, 252, 119902. [Google Scholar] [CrossRef]
  7. Goap, A.; Sharma, D.; Shukla, A.K.; Krishna, C.R. An IoT based smart irrigation management system using Machine learning and open source technologies. Comput. Electron. Agric. 2018, 155, 41–49. [Google Scholar] [CrossRef]
  8. Keswani, B.; Mohapatra, A.G.; Mohanty, A.; Khanna, A.; Rodrigues, J.J.; Gupta, D.; De Albuquerque, V.H.C. Adapting weather conditions based IoT enabled smart irrigation technique in precision agriculture mechanisms. Neural Comput. Appl. 2019, 31, 277–292. [Google Scholar] [CrossRef]
  9. Nguyen, D.C.H.; Ascough, J.C., II; Maier, H.R.; Dandy, G.C.; Andales, A.A. Optimization of irrigation scheduling using ant colony algorithms and an advanced cropping system model. Environ. Model. Softw. 2017, 97, 32–45. [Google Scholar] [CrossRef]
  10. Pereira, L.S.; Paredes, P.; Jovanovic, N. Soil water balance models for determining crop water and irrigation requirements and irrigation scheduling focusing on the FAO56 method and the dual Kc approach. Agric. Water Manag. 2020, 241, 106357. [Google Scholar] [CrossRef]
  11. Gu, Z.; Qi, Z.; Ma, L.; Gui, D.; Xu, J.; Fang, Q.; Feng, G. Development of an irrigation scheduling software based on model predicted crop water stress. Comput. Electron. Agric. 2017, 143, 208–221. [Google Scholar] [CrossRef]
  12. García, L.; Parra, L.; Jimenez, J.M.; Lloret, J.; Lorenz, P. IoT-based smart irrigation systems: An overview on the recent trends on sensors and IoT systems for irrigation in precision agriculture. Sensors 2020, 20, 1042. [Google Scholar] [CrossRef] [PubMed] [Green Version]
  13. Libelium. Available online: https://www.libelium.com/ (accessed on 1 May 2022).
  14. iMETOS 3.3-METOS by Pessl Instruments. Available online: https://metos.at/imetos33/ (accessed on 1 May 2022).
  15. WatchDog 2000 Series Weather Stations. Available online: https://www.specmeters.com/weather-monitoring/weather-stations/2000-full-stations/ (accessed on 1 May 2022).
  16. NetSens. Available online: https://www.netsens.it/en/ (accessed on 1 May 2022).
  17. Radhakrishnan, V.; Wu, W. IoT technology for smart water system. In Proceedings of the 2018 IEEE 20th International Conference on High Performance Computing and Communications, Exeter, UK, 28–30 June 2018. [Google Scholar]
  18. Xiaocong, M.; Jiao, Q.X.; Shaohong, S. An IoT-based system for water resources monitoring and management. In Proceedings of the 2015 7th International Conference on Intelligent Human-Machine Systems and Cybernetics, Hangzhou, China, 26–27 August 2015. [Google Scholar]
  19. Ramesh, M.V.; Nibi, K.V.; Kurup, A.; Mohan, R.; Aiswarya, A.; Arsha, A.; Sarang, P.R. Water quality monitoring and waste management using IoT. In Proceedings of the 2017 IEEE Global Humanitarian Technology Conference (GHTC), San Jose, CA, USA, 19–22 October 2017. [Google Scholar]
  20. Gupta, K.; Kulkarni, M.; Magdum, M.; Baldawa, Y.; Patil, S. Smart water management in housing societies using IoT. In Proceedings of the 2018 Second International Conference on Inventive Communication and Computational Technologies (ICICCT), Coimbatore, India, 20–21 April 2018. [Google Scholar]
  21. Chowdury, M.S.U.; Emran, T.B.; Ghosh, S.; Pathak, A.; Alam, M.M.; Absar, N.; Hossain, M.S. IoT based real-time river water quality monitoring system. Procedia Comput. Sci. 2019, 155, 161–168. [Google Scholar] [CrossRef]
  22. Moreno, C.; Aquino, R.; Ibarreche, J.; Pérez, I.; Castellanos, E.; Álvarez, E.; Clark, B. RiverCore: IoT device for river water level monitoring over cellular communications. Sensors 2019, 19, 127. [Google Scholar] [CrossRef] [Green Version]
  23. Skoubris, E.; Hloupis, G. An Imaging Capable, Low Cost IoT Node for River Flood Phenomena. In Proceedings of the EGU General Assembly Conference Abstracts, Göttingen, Germany, 19–30 April 2021. [Google Scholar]
  24. Intro to Arduino. Available online: https://www.coursehero.com/file/35492169/02-Intro-to-Arduinopdf/ (accessed on 1 May 2022).
  25. Fountas, S.; Carli, G.; Sørensen, C.G.; Tsiropoulos, Z.; Cavalaris, C.; Vatsanidou, A.; Tisserye, B. Farm management information systems: Current situation and future perspectives. Comput. Electron. Agric. 2015, 115, 40–50. [Google Scholar] [CrossRef] [Green Version]
  26. Agrawal, N.; Singhal, S. Smart drip irrigation system using raspberry pi and arduino. In Proceedings of the International Conference on Computing, Communication & Automation, Washington, DC, USA, 15–16 May 2015. [Google Scholar]
  27. Toai, T.K.; Huan, V.M. Implementing the Markov Decision Process for Efficient Water Utilization with Arduino Board in Agriculture. In Proceedings of the 2019 International Conference on System Science and Engineering, Dong Hoi City, Vietnam, 20–21 July 2019. [Google Scholar]
  28. Jha, R.K.; Kumar, S.; Joshi, K.; Pandey, R. Field monitoring using IoT in agriculture. In Proceedings of the 2017 International conference on intelligent computing, instrumentation and control technologies, Kannur, Kerala, India, 6–7 July 2017. [Google Scholar]
  29. Lambrou, T.P.; Anastasiou, C.C.; Panayiotou, C.G.; Polycarpou, M.M. A low-cost sensor network for real-time monitoring and contamination detection in drinking water distribution systems. IEEE Sens. J. 2014, 14, 2765–2772. [Google Scholar] [CrossRef]
  30. Wang, Y.; Rajib, S.S.M.; Collins, C.; Grieve, B. Low-cost turbidity sensor for low-power wireless monitoring of fresh-water courses. IEEE Sens. J. 2018, 18, 4689–4696. [Google Scholar] [CrossRef] [Green Version]
  31. Viani, F.; Bertolli, M.; Salucci, M.; Polo, A. Low-cost wireless monitoring and decision support for water saving in agriculture. IEEE Sens. J. 2017, 17, 4299–4309. [Google Scholar] [CrossRef]
  32. González-Teruel, J.D.; Torres-Sánchez, R.; Blaya-Ros, P.J.; Toledo-Moreo, A.B.; Jiménez-Buendía, M.; Soto-Valles, F. Design and calibration of a low-cost SDI-12 soil moisture sensor. Sensors 2019, 19, 491. [Google Scholar] [CrossRef] [Green Version]
  33. Prathibha, S.R.; Hongal, A.; Jyothi, M.P. IoT based monitoring system in smart agriculture. In Proceedings of the 2017 international conference on recent advances in electronics and communication technology, Bangalore, India, 16–17 March 2017. [Google Scholar]
  34. Feng, X.; Yan, F.; Liu, X. Study of wireless communication technologies on Internet of Things for precision agriculture. Wirel. Pers. Commun. 2019, 108, 1785–1802. [Google Scholar] [CrossRef]
  35. Hydrousa Project. Available online: https://www.hydrousa.org (accessed on 1 May 2022).
  36. Chan, K.; Schillereff, D.N.; Baas, A.C.; Chadwick, M.A.; Main, B.; Mulligan, M.; Thompson, J. Low-cost electronic sensors for environmental research: Pitfalls and opportunities. Prog. Phys. Geogr. Earth Environ. 2021, 45, 305–338. [Google Scholar] [CrossRef]
  37. Sami, M.; Khan, S.Q.; Khurram, M.; Farooq, M.U.; Anjum, R.; Aziz, S.; Qureshi, R.; Sadak, F. A Deep Learning-Based Sensor Modeling for Smart Irrigation System. Agronomy 2022, 12, 212. [Google Scholar] [CrossRef]
  38. Bauder, A.; Waskom, M.; Sutherland, L.; Davis, G.; Follett, H.; Soltanpour, N. Irrigation Water Quality Criteria; Colorado State University Extension: Fort Collins, CO, USA, 2011. [Google Scholar]
  39. Agriculture and Agri-Food Canada, Prairie Farm Rehabilitation Administration, Irrigation and Salinity. Available online: https://www1.agric.gov.ab.ca/$department/deptdocs.nsf/ba3468a2a8681f69872569d60073fde1/42131e74693dcd01872572df00629626/$file/irrsalin.pdf (accessed on 25 June 2022).
  40. Latest Condition in Trikala. Available online: https://penteli.meteo.gr/stations/trikala (accessed on 1 May 2022).
  41. Crop Evapotranspiration-Guidelines for Computing Crop Water Requirements-FAO Irrigation and Drainage Paper 56. Available online: https://www.fao.org/3/x0490e/x0490e00.htm (accessed on 1 May 2022).
Figure 1. IoT node architecture.
Agriculture 12 01044 g001
Figure 2. IoT node implementation.
Agriculture 12 01044 g002
Figure 3. Comparison of industrial and low-cost pH sensors’ measurements.
Agriculture 12 01044 g003
Figure 4. Correlation of industrial and low-cost pH sensors’ measurements.
Agriculture 12 01044 g004
Figure 5. Comparison of industrial and low-cost temperature sensors’ measurements.
Agriculture 12 01044 g005
Figure 6. Correlation of industrial and low-cost temperature sensors’ measurements.
Agriculture 12 01044 g006
Figure 7. Comparison between the low-cost TDS and industrial EC sensors to determine water salinity for irrigation needs.
Agriculture 12 01044 g007
Figure 8. Comparison of the average temperatures and the total rain recorded using the low-cost and high-end weather stations.
Agriculture 12 01044 g008
Figure 9. (a) Open top water tanks; (b) Sub-surface rainwater collection system.
Agriculture 12 01044 g009
Figure 10. (a) Electrovalve for controlling the water flow; (b) Level sensor installed in one of the tanks.
Agriculture 12 01044 g010
Figure 11. Water quantity monitoring.
Agriculture 12 01044 g011
Figure 12. Measurement of the water level in a roof tank.
Agriculture 12 01044 g012
Figure 13. Monitoring of the water level in the roof tank.
Agriculture 12 01044 g013
Figure 14. (a) Nodes for monitoring the well depth. (b) Water depth in the well (depth of the aquifer).
Agriculture 12 01044 g014
Figure 15. Solar power desalination system.
Agriculture 12 01044 g015
Figure 16. Monitoring of water quality: (a) seawater tank; (b) irrigation tank.
Agriculture 12 01044 g016
Figure 17. pH monitoring.
Agriculture 12 01044 g017
Figure 18. Salinity reduction by mixing the desalinated water with tap water.
Agriculture 12 01044 g018
Figure 19. Installations of the system for water quality and quantity measurements in: (a) open cistern; (b) closed tank.
Agriculture 12 01044 g019
Figure 20. Water quality measurements retrieved from: (a) open cistern; (b) closed tank.
Agriculture 12 01044 g020
Figure 21. IoT nodes for automating the irrigation in the greenhouse.
Agriculture 12 01044 g021
Figure 22. Automated irrigation using the IoT node.
Agriculture 12 01044 g022
Figure 23. Average soil moisture per day.
Agriculture 12 01044 g023
Table 1. Comparison of the measurements of the low-cost and industrial sensors. The different letters accompanying daily means and monthly average values of each distinct measurement type (pH and temperature) for each set of the industrial and low-cost sensors indicate a significant difference between the measurements, based on a Fisher’s least significance difference (LSD) test (p < 0.05).
DatepH
Industrial
pH
Low Cost
pH
Difference
Temperature
Industrial
Temperature
Low Cost
Temperature
Difference
10 September 20216.61a6.80b0.1925.63a26.20a0.57
11 September 20216.58a6.80b0.2226.18a27.00a0.82
12 September 20216.52a6.70b0.1826.17a27.10b0.93
13 September 20216.52a6.70b0.1826.11a26.90a0.79
14 September 20216.53a6.70b0.1725.93a26.70a0.77
15 September 20216.53a6.70b0.1726.43a27.30b0.87
16 September 20216.48a6.60b0.1227.32a28.50b1.18
17 September 20216.43a6.60b0.1727.71a29.30b1.59
18 September 20216.42a6.60b0.1828.39a29.60b1.21
19 September 20216.40a6.50b0.1028.77a30.10b1.33
20 September 20216.37a6.50b0.1329.40a30.60b1.20
21 September 20216.30a6.40b0.1029.21a30.70b1.49
22 September 20216.30a6.40b0.1028.26a29.30b1.04
23 September 20216.17a6.10a0.0724.65a25.30a0.65
24 September 20216.11a6.10a0.0125.77a26.90b1.13
25 September 20216.52a6.60a0.0825.82a27.60b1.78
26 September 20216.41a6.40a0.0125.60a26.30a0.70
27 September 20216.45a6.40a0.0524.70a25.50a0.80
28 September 20216.57a6.60a0.0323.83a24.40a0.57
29 September 20216.73a6.80a0.0722.91a23.40a0.49
30 September 20216.74a6.80a0.0622.21a22.50a0.29
1 October 20216.75a6.80a0.0522.02a22.50a0.48
2 October 20216.79a6.80a0.0121.94a22.20a0.26
3 October 20216.75a6.80a0.0522.44a22.90a0.46
4 October 20216.61a6.70b0.0922.25a22.60a0.35
5 October 20216.47a6.50a0.0322.45a22.70a0.25
6 October 20216.54a6.50a0.0423.29a23.60a0.31
7 October 20216.67a6.70a0.0324.22a24.50a0.28
8 October 20216.79a6.80a0.0124.59a25.00a0.41
9 October 20216.80a6.80a0.0023.85a23.90a0.05
10 October 20216.66a6.70a0.0422.50a22.70a0.20
Average6.53a6.61a0.0825.18a25.93a0.75
Table 2. Comparison of measurements between the low-cost and high-end weather stations. Different letters accompanying monthly means and monthly sum values of each distinct measurement type (temperature and total rain) for each set of the industrial and low-cost sensors indicate a significant difference between the measurements, based on a Fisher’s least significance difference test (p < 0.05).
DateAverage Temperature (Low-Cost Station)Average Temperature (High-End Station)Temperature DifferenceTotal Rain (Low-Cost Station)Total Rain (High-End Station)Total Rain Difference
11 December 20207.007.100.106.005.001.00
12 December 20208.308.100.200.901.600.70
13 December 20209.409.100.308.107.600.50
14 December 202011.5011.200.300.000.000.00
15 December 202010.7010.600.100.000.000.00
16 December 20208.808.900.100.000.000.00
17 December 202010.5010.100.400.000.000.00
18 December 20208.308.900.600.000.000.00
19 December 20209.509.100.400.000.000.00
20 December 202010.5010.200.300.000.000.00
21 December 202010.2010.100.100.300.600.30
22 December 20209.9010.000.100.000.000.00
23 December 20208.208.500.300.000.000.00
24 December 20208.509.100.600.000.000.00
25 December 202012.0012.800.800.000.000.00
26 December 202011.9012.901.002.102.400.30
27 December 202010.6010.700.102.101.800.30
28 December 202010.3010.100.201.201.000.20
29 December 202012.6013.100.500.000.000.00
30 December 202011.1011.500.400.000.000.00
31 December 202011.1011.000.106.607.000.40
1 January 20219.309.100.200.000.000.00
2 January 20218.007.800.204.204.800.60
3 January 20219.909.600.3027.6028.000.40
4 January 20218.508.200.3040.8042.201.40
5 January 20218.008.600.600.300.200.10
6 January 20218.608.500.100.300.200.10
7 January 202110.0010.000.000.000.000.00
8 January 202115.5015.700.200.000.000.00
9 January 202115.9015.700.200.600.800.20
10 January 202113.1012.800.302.703.000.30
11 January 202112.9012.700.2038.7039.600.90
Average10.33a10.37a0.04142.50
(Sum)
a145.80
(Sum)
a3.30
(Sum)
Publisher’s Note: MDPI stays neutral with regard to jurisdictional claims in published maps and institutional affiliations.

