Article

Deep Learning Based Disease, Pest Pattern and Nutritional Deficiency Detection System for “Zingiberaceae” Crop

1
Department of Computer Science, Pir Mehr Ali Shah Arid Agriculture University-PMAS AAUR, Rawalpindi 46000, Pakistan
2
Department of Informatics, Modeling, Electronics, and Systems (DIMES), University of Calabria, 87036 Rende, Italy
3
Department of Computer Science, COMSATS University Islamabad, Islamabad 45550, Pakistan
4
Faculty of Computing and Informatics, University Malaysia Sabah, Labuan 88400, Malaysia
5
Department of Computer Science, Institute of Space Technology, Islamabad 44000, Pakistan
*
Author to whom correspondence should be addressed.
Agriculture 2022, 12(6), 742; https://doi.org/10.3390/agriculture12060742
Submission received: 14 April 2022 / Revised: 13 May 2022 / Accepted: 18 May 2022 / Published: 24 May 2022
(This article belongs to the Special Issue The Application of Machine Learning in Agriculture)

Abstract

:
Plants’ diseases cannot be avoided because of unpredictable climate patterns and environmental changes. The plants like ginger get affected by various pests, conditions, and nutritional deficiencies. Therefore, it is essential to identify such causes early and perform the cure to get the desired production rate. Deep learning-based methods are helpful for the identification and classification of problems in this domain. This paper presents deep artificial neural network and deep learning-based methods for the early detection of diseases, pest patterns, and nutritional deficiencies. We have used a real-field dataset consisting of healthy and affected ginger plant leaves. The results show that the convolutional neural network (CNN) has achieved the highest accuracy of 99 % for disease rhizomes detection. For pest pattern leaves, VGG-16 models showed the highest accuracy of 96 % . For nutritional deficiency-affected leaves, ANN has achieved the highest accuracy ( 96 % ). The experimental results achieved are comparable with other existing techniques in the literature. In addition, the results demonstrated the potential in improving the yield of ginger using the proposed disease detection methods and an essential consideration for the design of real-time disease detection applications. However, the results are specific to the dataset used in this work and may yield different results for the other datasets.

1. Introduction

The distribution of crop diseases can affect the economy badly. The manual diagnoses of crop diseases are time-consuming and risk errors. Digital revolution is reinventing agriculture, which integrates advanced technologies, digital tools, information, and communication technologies to enhance the opportunities for agriculture improvement and performance [1]. Digital agriculture is currently emerging as a consequence of several technological developments in artificial intelligence [2], remote sensing [3], and robotic systems [4]. Such systems allow farmers to provide broad, precise, and accessible traditional agricultural products at the national and regional levels, and boost yield and quality while limiting environmental impact. It can also provide ease to the farmers for detecting plant disease [5,6,7], pests [8,9] and weeds [10].
Ginger is a medicinal herb that is commonly used in Pakistan and across the world to treat a broad range of disorders such as rheumatism, arthritis, sprains, muscular aches, and pains [11]. However, ginger is prone to various kinds of diseases such as bacterial [12] and fungal [13]. It is also affected by different pests such as leafhopper, Chinese rose beetle, ants, and caterpillar. In scientific literature, several techniques have been proposed to tackle the complex challenges in agriculture, such as decision support systems [14], plant disease detection [15], and other artificial intelligence-based techniques. Deep learning has shown most promising results for agricultural image processing such as plant disease detection, pesticides detection, plant type classification, etc. For instance, the study [16] proposed the detection of fusarium head blight disease in wheat crops. Here, deep convolutional neural network (CNN) and image processing techniques are employed to detect the diseased part of wheat leaf images. The authors in [17] exploit Bayesian deep learning for approximating the probability density for crop disease detection problems. Another deep CNN-based work [18] suggests deploying a pre-trained model learned from usual massive datasets, and transferring it into a specific task trained with their data, like VGGNet and ImageNet.
An automated wheat disease diagnostic system [19] implementable on mobile devices to conduct a real-time diagnosis is based on deep learning and multiple instance learning (MIL). Their method uses four deep learning models, VGG-FCN-VD16, VGG-FCN-S, VGG-CNN-S, VGG-CNN-VD16, and are implemented on the leaf images dataset. The accuracies of VGG-CNN-VD16 and VGG-CNN-S are 73.00%, and 93.27%, respectively. However, the suggested model cannot detect the last stage of disease of the plant. Authors of [20] applied the neural network, support vector machine, and fuzzy classifier for plant disease detection problems. They suggested that there is a need to work on diseases stage identification and quantification, real-world applications, and the reliability of a fully automatic system in agricultural sector. Ref. [16] proposes the detection of the fusarium head blight, a wheat crop disease. They developed a deep convolutional neural network (DCNN) capable of extracting distinct wheat stems from a single image with a complicated environment. They also suggest a new method for identifying fusarium head blight infected regions in each spike. In training, the model accurately detects the crop’s diseased part, and the mean average precision is 0.9201. The results are better than k-means and Otsu’s methods. However, this model requires a large dataset to detect the diseased part more accurately.
A novel plant leaf disease detection model bases on deep CNN is proposed in [21]. Transfer learning and deep CNN are used for the leaf disease detection problem. The deep CNN model could accurately differentiate 38 different groups of diseased and healthy plants using leaf images with 96.46% accuracy. Authors of [22] used texture-based segmentation and simpler linear iterative clustering (SLIC) to capture and recognize the diseases and pests at early stages in corn crops. lassification is done through binary support vector machine (BSVM) and multi-class support vector machine (MSVM). The accuracy achieved for pest detection is 52%, which can be extendable. Authors in [23] used ResNet-101, VGG-16, and ResNet-50 can see blurred images, and yolov3 for pest and disease detection in rice crop, and detected blurred boundaries and irregular shapes. However, the model showed poor performance for fewer features present in the image frames.
The study presented in [24] suggested the use of image acquisition, image pre-processing, image segmentation, feature extraction, and classification techniques for the ginger plant disease detection problem. The system is linked with a digital/web camera, allowing farmers to take images of plant leaves. The collected images are processed using image processing techniques to identify diseases symptoms, disease type and notify the farmers about disease type through global system for mobile communications (GSM) interface. Then, relay turns on the pump installed in the device to release medicine to the infected plant according to the infected disease. However, the study does not consider a standard dataset of the ginger plant leaf images, and some diseases of ginger plants and pests are not discussed. A summary of literature review is provided in Table 1.
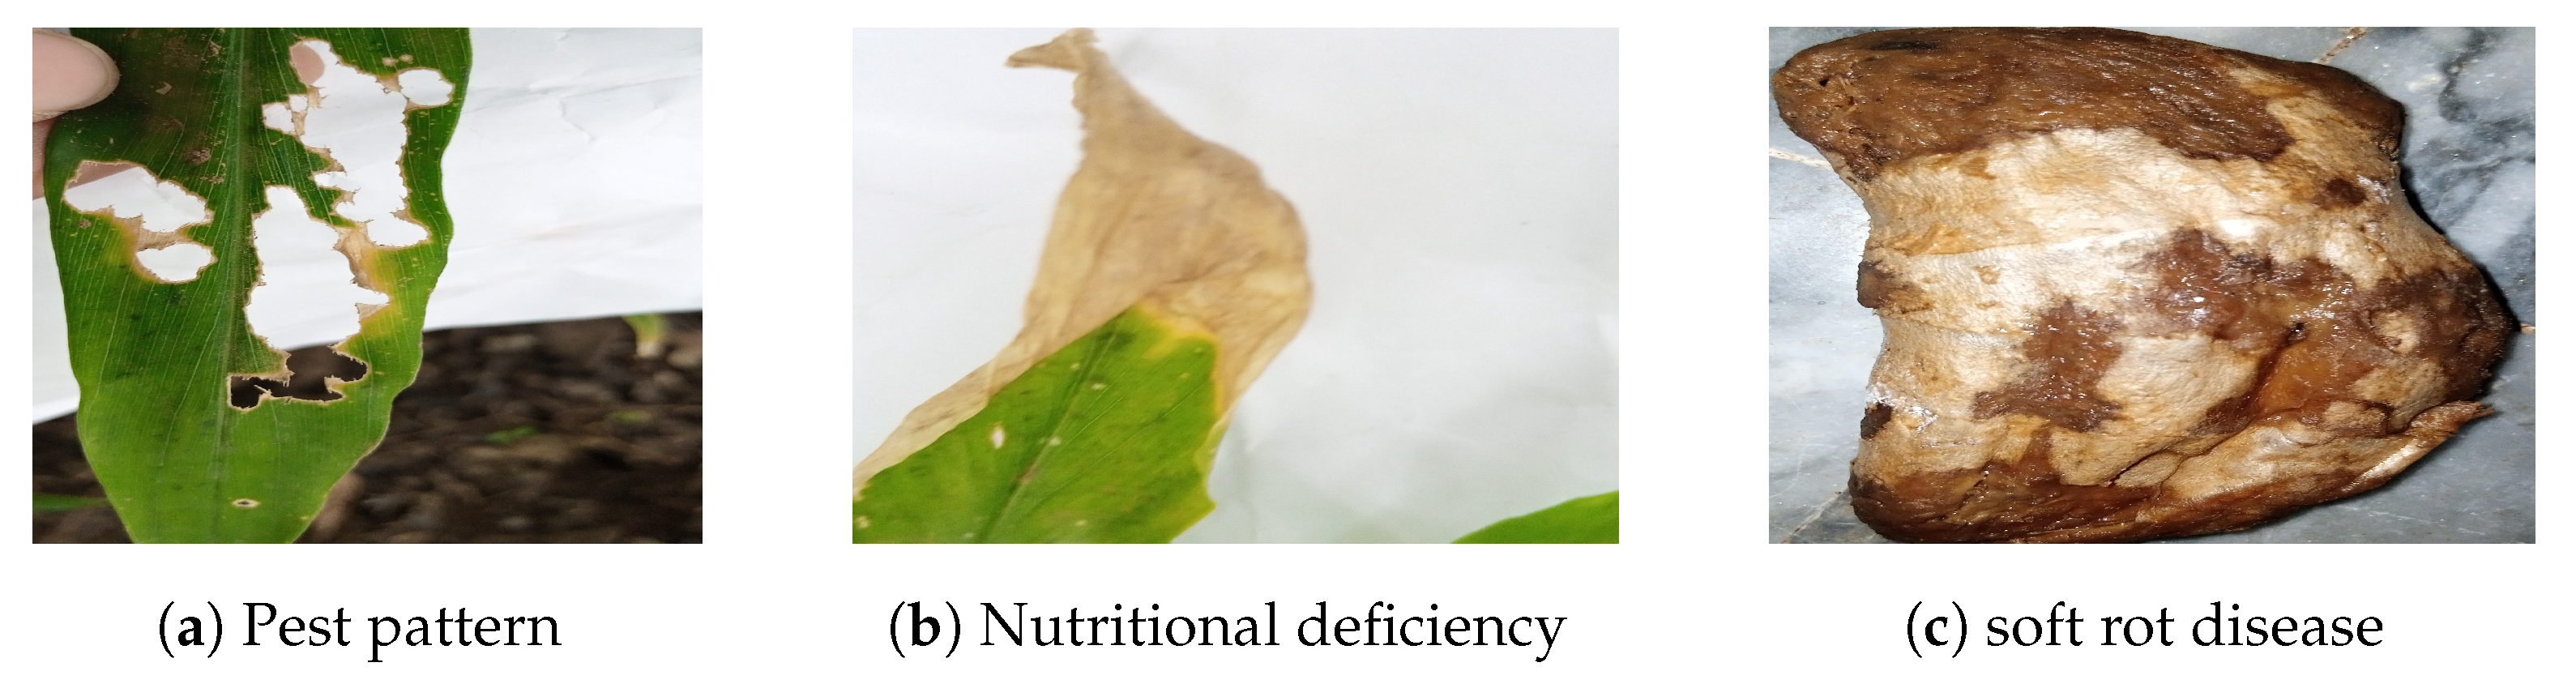
From our literature review, we have found that the ginger plant diseases, deficiency nutrients, and pest patterns are not so much studied and researched. This area of research needs considerable research efforts for the ginger plant disease, pest pattern, and deficiency nutrients detection problem at early and multiple stages. It is necessary to comprehend diseases, nutrient deficiency, and pests at early and multiple phases and recommend the treatment of the causative agents that contribute to causing the ginger plant diseases. To the best of our knowledge, the deep learning approaches are not used so far for ginger plant disease, deficiency nutrients, and pest pattern detection. Furthermore, there is no publicly available dataset of ginger plant images necessary to test the working of the available deep learning techniques for the problem of interest.
This study focuses on making an autonomous system that detects ginger plant diseases, pest patterns, and deficiency nutrients through deep artificial neural network and learning techniques, namely VGG-16, CNN and MobileNetV2 in real-time circumstances. The study also involves developing a large-scale ginger plant dataset based on different stages. We present the classification of various diseases and nutrient deficiencies, and investigate the pest patterns in the leaf images. In addition, we exhibit the performance and ability of the model to predict diseases with high accuracy. This study hopes to present the first step towards deep learning-based ginger disease, pest pattern, and deficiency nutrients detection. This research study presents the following key contributions:
  • To develop a standard dataset of the ginger plant leaf images at early stages and multiple stages.
  • To classify pest pattern, nutrients deficiency, soft rot disease from the ginger plant leaf images and rhizome.
  • To apply advance deep learning-based methods and perform a comparative analysis to identify which model works well.
The rest of the paper is structured as follows: Section 2 explains materials and methods followed by Section 3 that exhibits results and discussion, and finally Section 4 concludes the article.

2. Materials and Methods

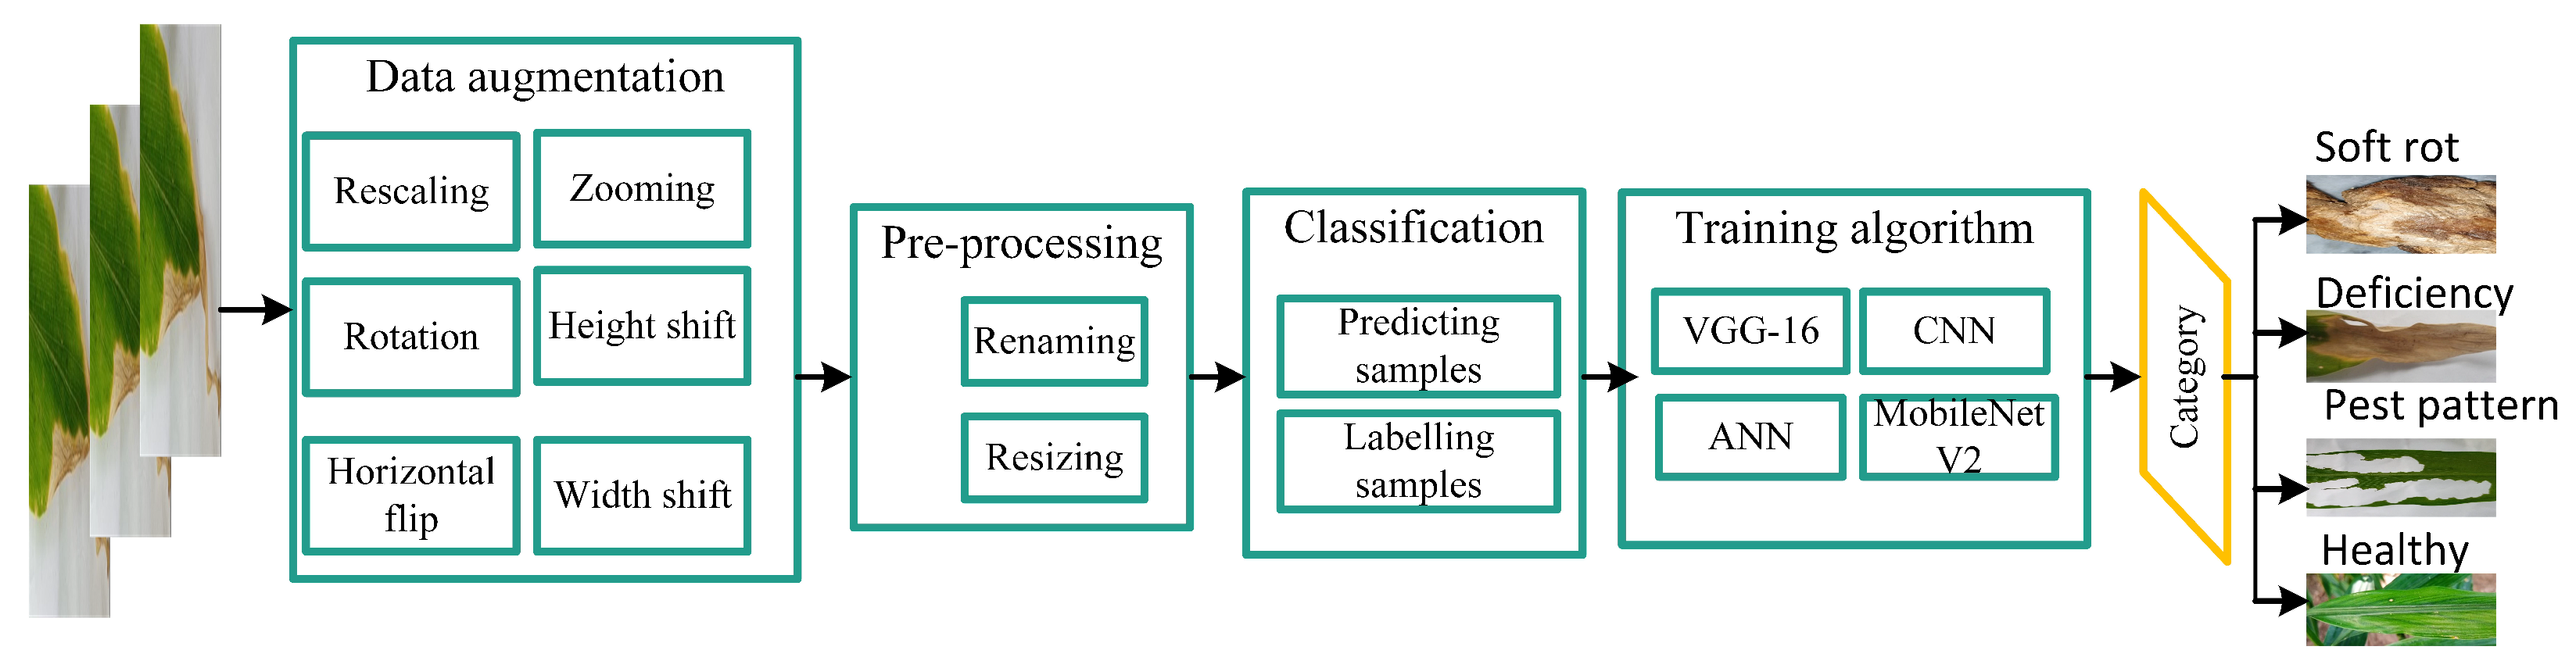
In general, the work starts from field data collection as shown in Figure 1. We collected the ginger plant leaf images, both healthy and effected at multiple stages (early and later stages). After data collection, the next step is to perform the image augmentation, including rotation, re-scaling, zooming, horizontal flip, width shift, and height shift. Further, we performed image processing steps renaming and resizing, and new sample images were generated to enrich the dataset. Next, the samples data is labeled with the help of expert knowledge. The labeled sample data is then used during the training phase of the selected deep learning algorithm. Finally, we identify and classify the understudy problems, i.e., disease, pest, and deficiency detection, and the results are compared and evaluated to identify the appropriate algorithm for a given situation.In the following, we describe each phase one by one.

2.1. Image Acquisition and Description

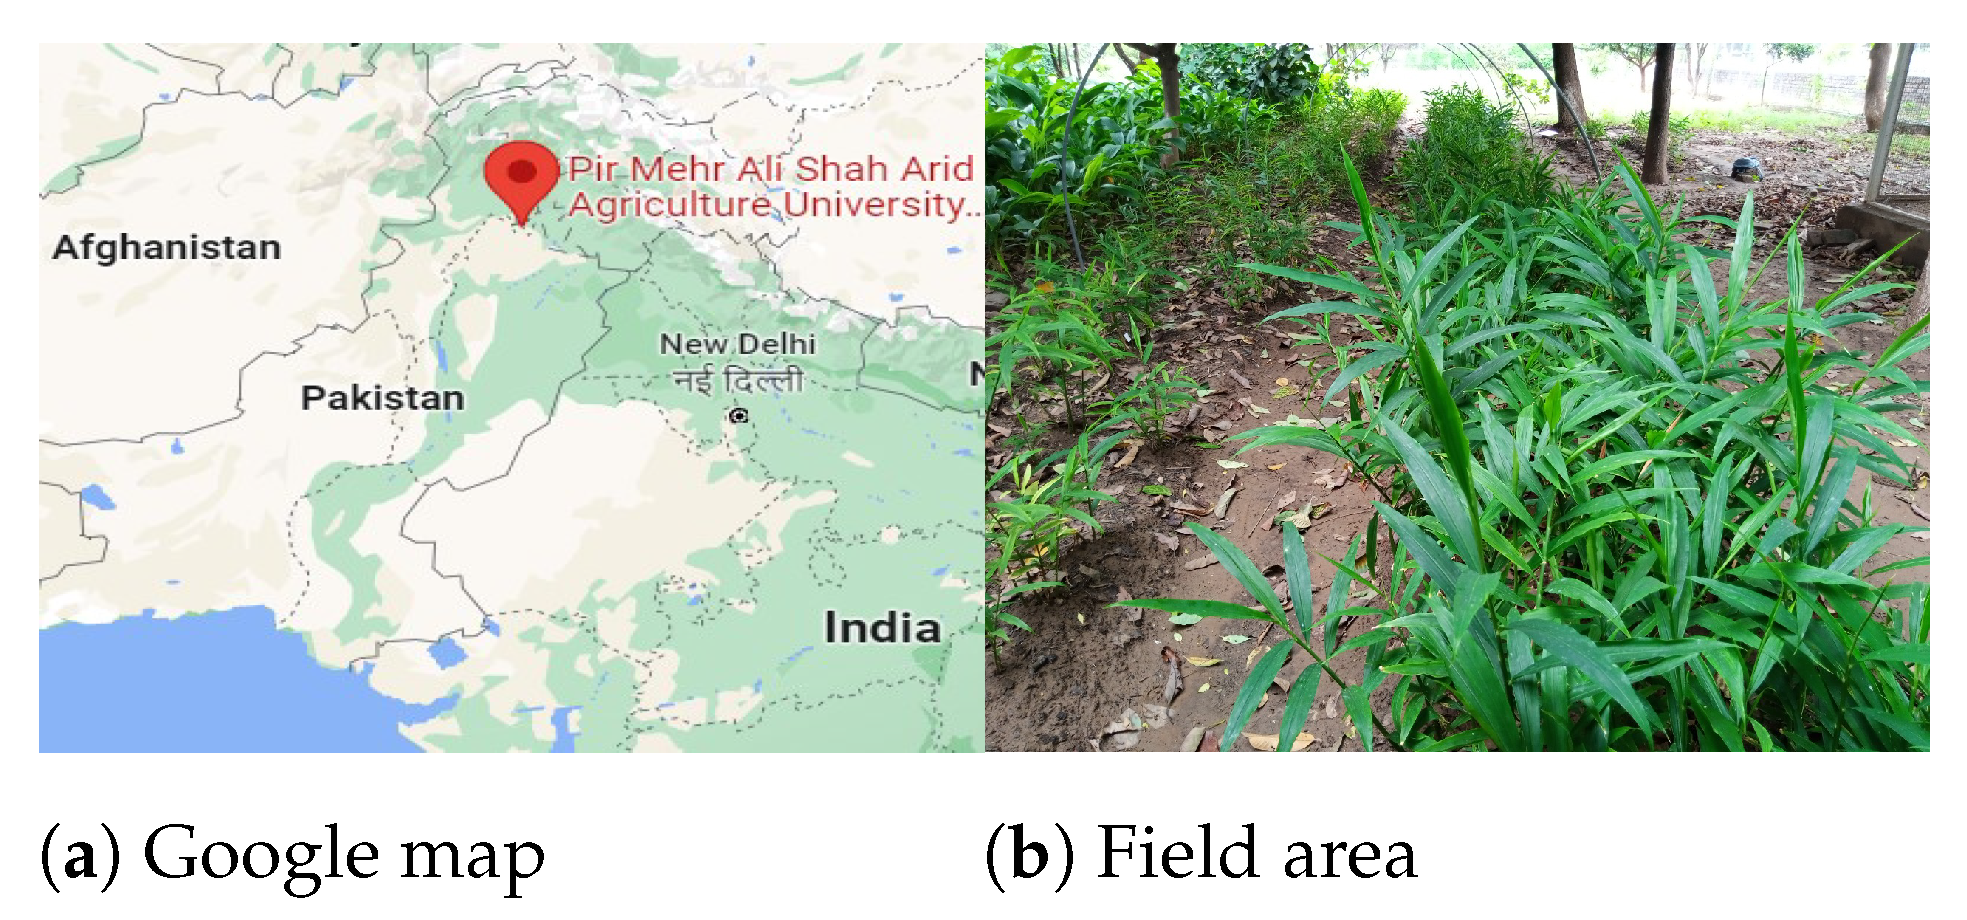
A total of 4396 images are acquired from the orchard of PMAS-Arid Agriculture University Rawalpindi. All images are taken from Infinix Hot 9 Mobile, it has 720 × 1600 pixels resolution and 16 MegaPixels camera. The size of this camera is 6 to 7 MB per image. For further processing, image acquisition acquire images from an external source. It is an essential step as the system’s performance is highly dependent on the captured images used for training the model. All images of the ginger plant leaf are collected from the orchard of PMAS Arid Agriculture University Rawalpindi as shown in Figure 2 and the market. Each plant is sown at a distance of 50 cm. Images are collected with heterogeneous background as critical factor in collecting real field images, although most of the publicly available dataset contains simple background. This makes our model to react to changes in the real-time environment.
There are 1801 images of deficient nutrients and healthy plants. 1440 images are used for training and 361 images for testing with the same number of classes. Similarly, there are 2275 images of pest patterns and healthy plants of which 1820 images are used for training, and 455 for testing. ginger plant soft rot diseases consist of 320 images of which 256 and 64 images are used for training and testing, respectively. ginger plant leaf images of pest patterns and healthy and deficient nutrients are gathered in multiple stages. Images of soft rot disease ginger are collected at the last stage of ginger rhizome. A detailed description of dataset distribution is provided in Table 2.

2.2. Data Augmentation and Processing

Data augmentation is a method of creating new training data from previous training data. We apply domain-specific techniques to samples from the training data to generate unique and distinct training instances. In this study, we augment the images by rescaling, rotating the images, changing the width and height shifts, zooming the images, and doing the horizontal flip. The obtained results are shown in Figure 3.
All the images are renamed by python code, resized by the cv2 library, and converted into RGB images for further data processing. The dimensions of the images are (150 × 150 × 3), height and width are 150 and 150, and 3 represents RGB channel (Red, Green, Blue).

2.3. Classification

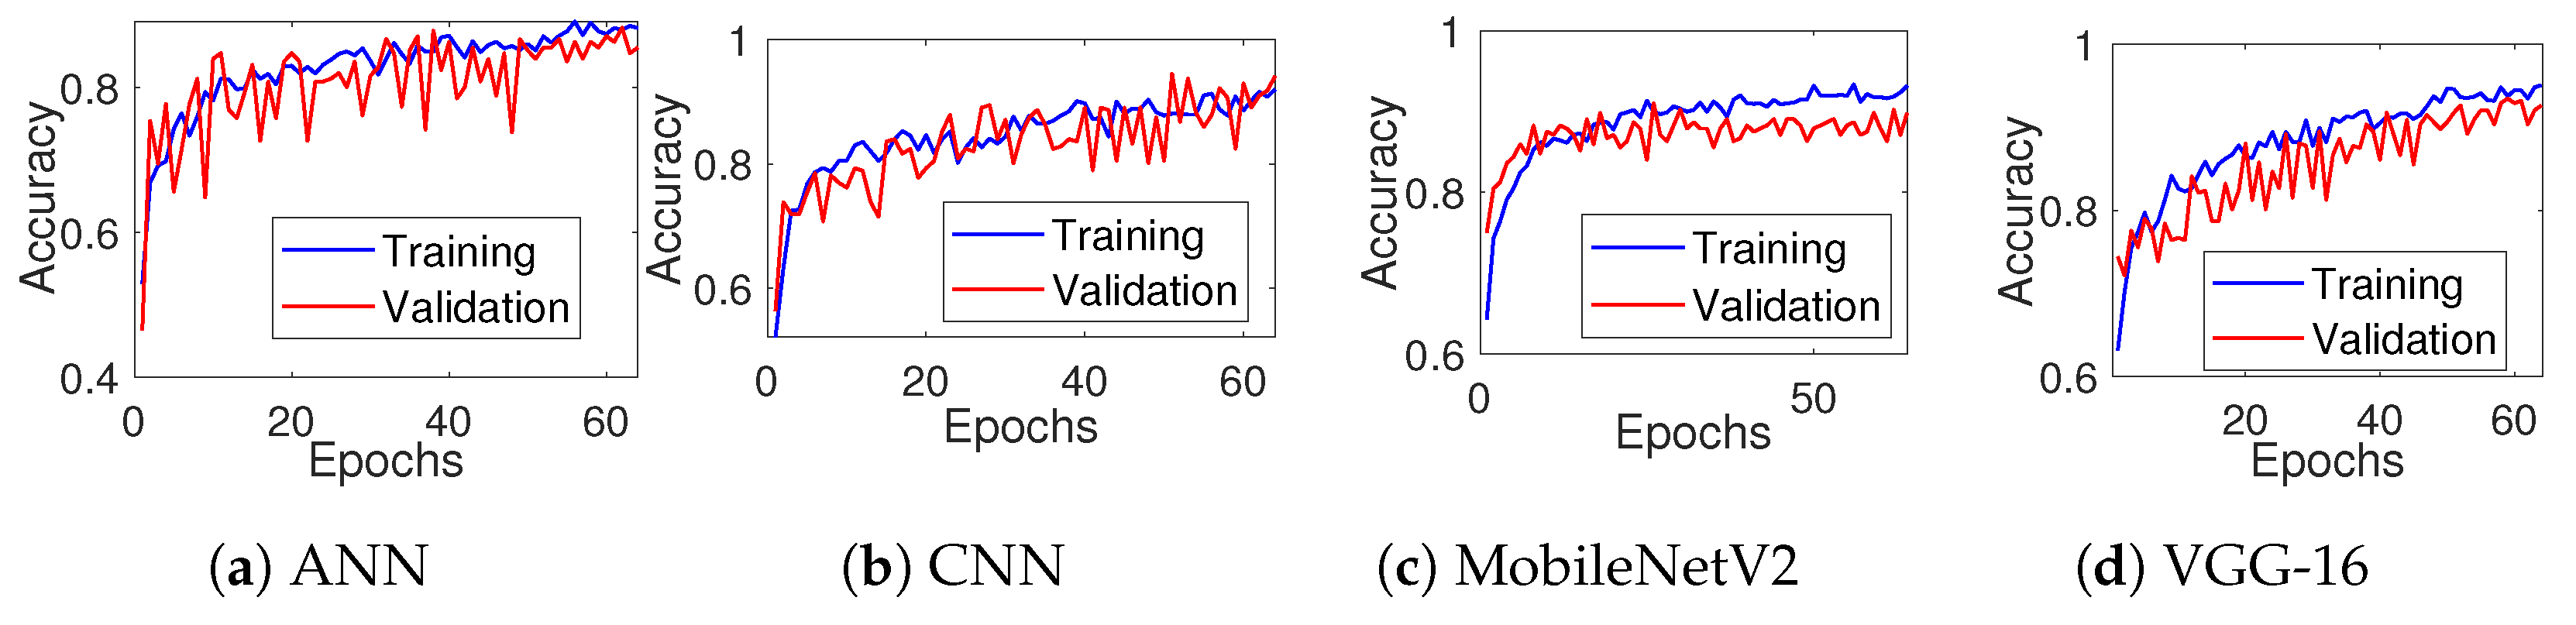
This step trains images of ginger plant disease, pest patterns, and deficiency nutrients. We use 80 % data for training and the remaining 20% data for testing—a detailed description of the deep learning algorithms is provided in the following subsections.

2.3.1. ANN Model

Artificial Neural Network (ANN) is very powerful tool for non-linear statistical modelling. The model is multi-layer, fully connected neural networks. They are made up of an input layer, many hidden layers, and an output layer. Every node in one layer is linked to every other node in the following layer.
Artificial neural network receives input and computes the weighted total of the inputs, as well as the bias. This calculation is represented by a transfer function.
i = 1 n W i × X i + b
Whereas W represents weights, X as inputs and b is represented as bias. The model is sequential because all the layers of the model are in sequence. Relu activation function and a dropout value of 0.2 are used, which reduces the overfitting of the model in this research. Sigmoid activation function is used in the last layer for classification as given by the equation.
σ ( k ) = 1 1 + e k ¯
A flatten layer is used that allows transforming a vector of 2D matrixes into a suitable format for the dense layer to comprehend. A Dense layer that is intimately linked to the layer before it, implying that the layer’s neurons are connected to every neuron of its preceding layer. This is the most often used layer. The hyper parameters used for ANN are given in Table 3.

2.3.2. CNN Model

CNN is widely employed in the field of study. Image is represented by a three-dimensional matrix is presented to CNN. Then, the convolutional layer extracts the characteristics of the image. Convolutional layer also includes ReLU activation, which reduces all negative values to zero. After convolution, the pooling layer is utilized to minimize the spatial volume of the input image. Then max pooling is used to minimize the spatial volume of the input image, and the 4 × 4 dimension input has been reduced to 2 × 2 dimensions. Then there is a fully connected layer, and the last is the logistic layer. The label, which is one-hot encoded, is contained in the output layer. A sequential model is used with Relu activation function. Dropout rate is 0.2 to reduce the over-fitting of the algorithm and sigmoid is used in the last layer. The hyper paramters used for CNN are given in Table 4.

2.3.3. VGG-16 Model

VGG-16 algorithm is used in various deep learning-based applications, and it is an easy and fast algorithm due to its quick implementation. The VGG-16 model is a simple algorithm and suitable for image classification. 
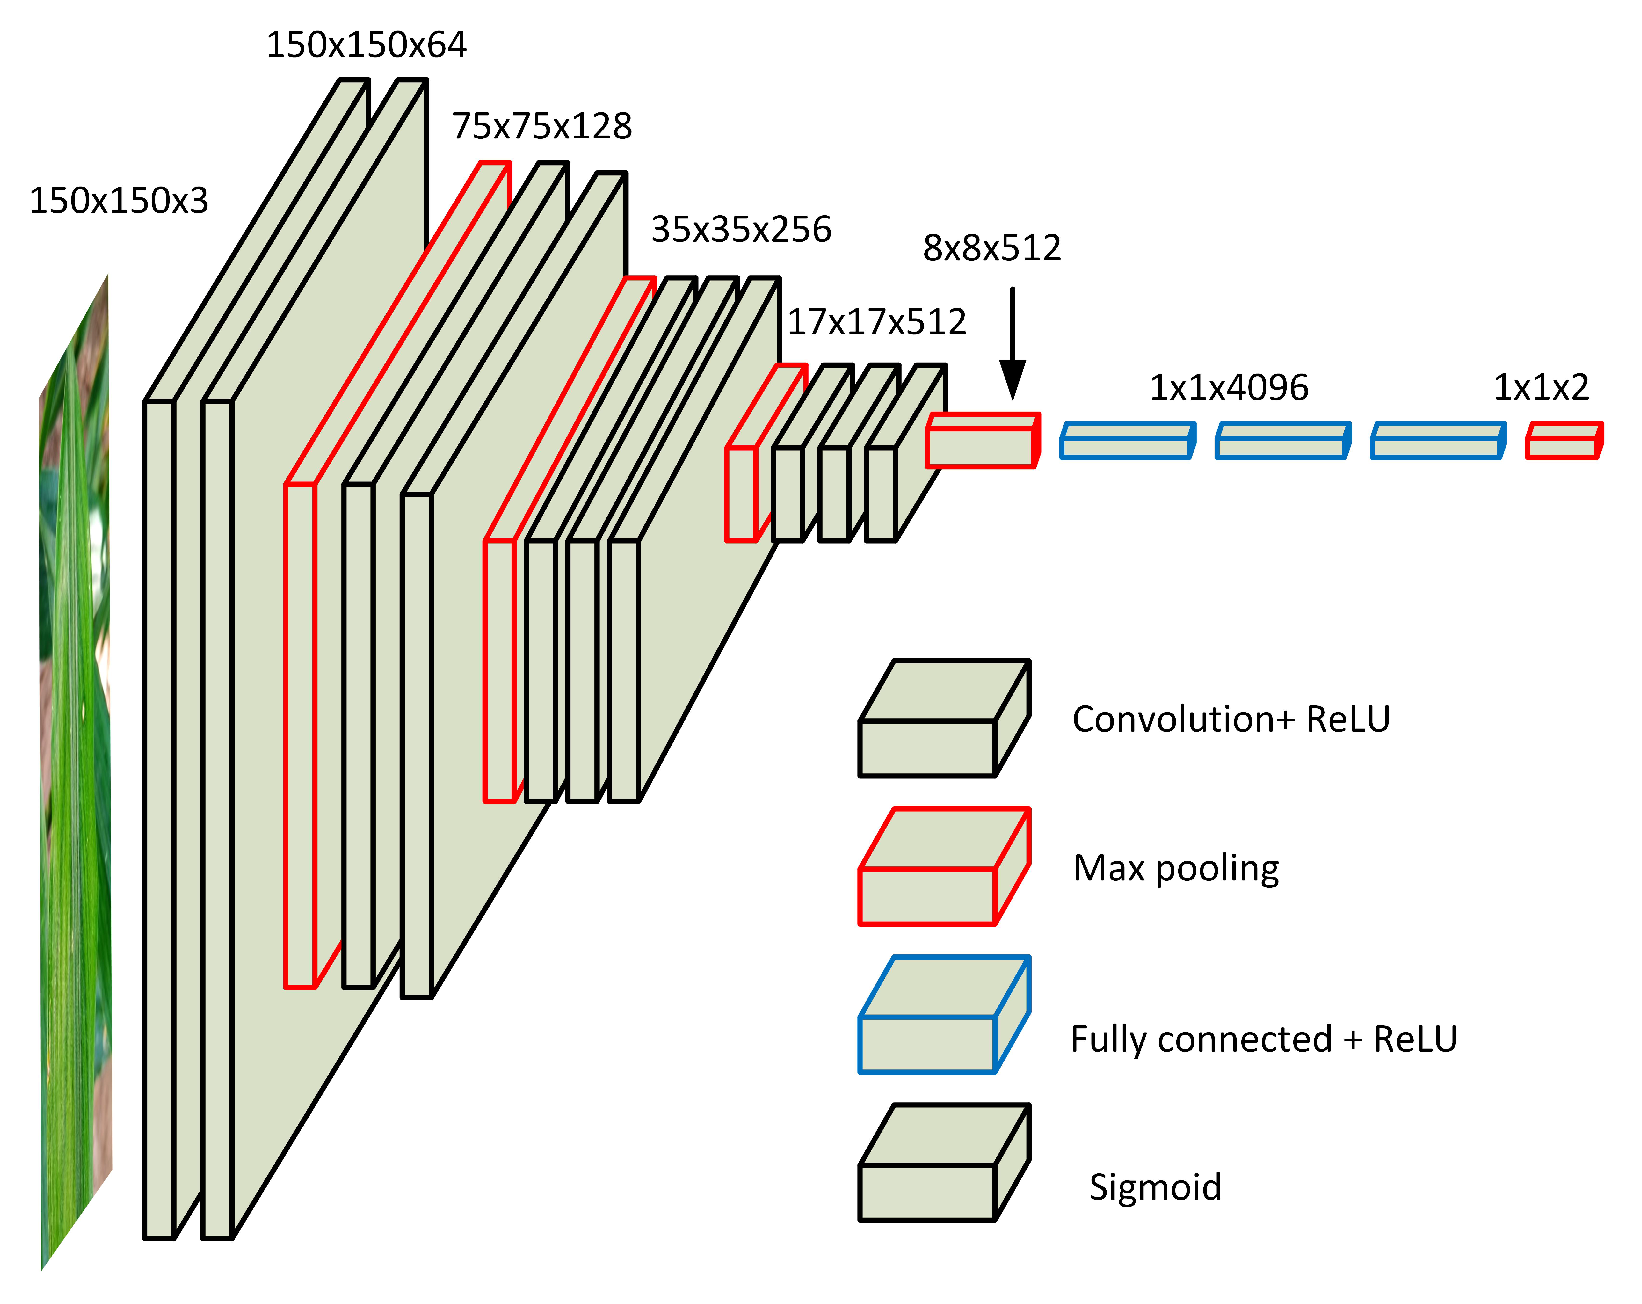
Figure 4 depicts the architecture diagram of the VGG-16 algorithm.
The convolutions are a fixed size of 150 × 150 RGB (Red Green Blue) images during training. The pre-processing performed here removes the typical RGB value computed on the training phase-out of each pixel. The image is processed using a stack of convolutional layers, which employ filters with a small field of 3 × 3. It is more complex and has non-linear effects but has fewer parameters. In one of the settings, 1 × 1 convolution filters are used, which may be thought of as a linear modification of the input channels. For 3 × 3 convolution layers, the convolution phase and spatial padding of convolution input are kept to 1 pixel, ensuring that the spatial resolution is retrained after convolution. Spatial pooling is helped by five max-pooling layers that follow part of the convolution layers. Max pooling is done with stride 2 across a 2 × 2-pixel frame. After a stack of convolution layers, there are three fully connected (FC) layers. The first two each have 4096 channels, whereas the third uses 1000 way ILSVRC classification and hence has 1000 channels, one for each class. The Softmax layer is the last layer [29]. However, because of binary classification study, the last layer used here is the sigmoid layer. In all networks, the configuration of the ultimately linked layers is the same. The hyper parameters used for VGG-16 are given in Table 5.
The first layer used the activation function rectified linear activation function (Relu). Relu is the most widely used activation function used in CNN and deep learning. It can be calculated as follows:
f ( x ) = m a x ( 0 , x )
Relu activation function is added to each layer, so all the negative values are not passed to the next layer. Flatten layer is used that passes the data to the dropout layer. Then Dropout layer is added to the algorithm that can overcome the over-fitting of the algorithm. Finally, the last layer is Sigmoid.

2.3.4. MobileNetV2 Model

MobileNetV2 is a 53 layer deep neural network. A pre-trained version of the network trained on over a million images of the imagined database may be loaded. The pretrained model can categorise images into 1000 object categories. It enables real-time classification despite computational restrictions in devices such as mobile phones. This algorithm adds a whole new CNN, the inverted residue and non-linear bottleneck layer, which enables better performance in mobile and embedding vision devices. We have used MobileNetV2 in our research. ReLu, dropout layer, flatten layer, the sigmoid activation function is used in this algorithm. Dropout operates by randomly changing the outward edges of the hidden layers to zero at every training phase iteration. The hyper parameters used for MObileNetV2 are given in Table 6.
The output of the convolutional layer is flattened to generate a single continuous feature map. It is also linked to the final classification model, which is referred to as a fully connected layer. Furthermore, we combine all of the pixel data into a single line and connect it to the final layer.

3. Results and Discussion

In this section, we present the evaluation metrics, necessary results and discussion.

3.1. Evaluation Metrics

In our work, we used the following metrics to evaluate the working of the adopted deep learning models for the ginger plant disease classification and detection tasks. Precision, recall and F1-Score [30] are calculated to evaluate the performance.
Precision is measured as the ratio of the number of correctly identified positive samples to the total number of positive samples. It can be calculated by:
P r e c i s i o n = T P / ( T P + F P ) × 100 %
where TP is truly positive and FP is a false positive. Recall is determined by dividing the total number of positive samples by the number of positive samples accurately categorized as positive.The recall is calculated by:
R e c a l l = T P / ( T P + F N ) × 100 %
F1 Score is a prominent metric for accessing a classification model’s performance. When finding a more consistent description of a model’s performance, then uses a harmonic mean of accuracy on recall.
F 1   S c o r e = 2 × ( ( P × R ) / ( P + R ) )
where P is precision and R is recall.
A Confusion matrix that depicts the class of each occurrence depending on the classifier methods used, opening the way for various performance indicators to identify the tendency of the system. The parameters of the confusion matrix are based on the number of groups. Actual Class labels are mentioned in columns and predicted in rows. Each cell is classified as TP, TN, FP, and FN.
This research analyzed the accuracy scores of the model’s fine-tuning to see how deep learning affects the system performance. The ANN and deep learning models were trained and tested using the ginger plant images at initial and multiple stages. A novel dataset is trained and tested on state-of-the-art algorithms. This study detects the three categories of ginger plants: pest pattern, deficiency affected at initial and multiple stages, and soft rot disease at the last phenological step. The various models were trained and tested on real-time background images. In this particular task, the minimum batch size was selected as 32, the maximum epochs were 64, and the initial learning rate was 0.001. Furthermore, Adam is the optimization method used for deep networks.

3.2. Pest Pattern Classification

This section presents the results of pest pattern detection. The dataset was split into two classes pest pattern and healthy having 1820 images of training and 455 images for testing. Accuracy for VGG-16, ANN, MobileNetV2 and CNN is shown in Figure 5. The number of epochs was represented on the x-axis, and it can be defined as the algorithm will learn in the number of times of the entire dataset. The y-axis represents the accuracy of the models, and accuracy is the ratio of the number of accurate predictions to the overall number of correct predictions. VGG-16 achieves better validation accuracy of 96% in pest pattern spots than other models such as Artificial Neural Network (ANN), MobileNetV2, and CNN, gaining 95%, 93%, and 92% validation accuracy. Although VGG-16 achieves better validation accuracy at the end, MobileNetV2 is the only one that achieves results more than 85% of accuracy below 10 epochs. The minimum loss, which is observed that 0.1% is achieved by VGG-16 and MobileNetV2 algorithms as compared to other models in Table 7. Here, it can be noticed that VGG-16 has demonstrated better performance in terms of accuracy compared with other techniques. Moreover, ANN achieved highest precision and recall values.
Figure 6 shows models of the Receiver Operator Characteristics (ROC) curve developed by classifying the pest pattern and healthy classes. The difference between false positive and true positive rate is plotted on ROC curve. Here, it can show the performance of classification models at all classification parameters. Compared to other states of the art models, MobileNetV2 achieves optimal ROC curve findings.
We can display image samples from the test set and their classification results. We observed that the models are capable of accurately recognizing the target classes. ANN algorithm is tested on unseen data and correctly determines which image is a healthy ginger plant image and which is infected by pest pattern in Figure 7a. CNN algorithm is evaluated on previously unknown data and accurately identifies which image is a healthy ginger plant image and which is harmed by pest pattern as depicted in Figure 7b. In Figure 7c, the MobilenetV2 algorithm is tested on unseen data and predicts accurately which is affected by pest patterns and healthy ginger plant image. In last, as depicted in Figure 7d, the VGG-16 algorithm is tested on unseen data and predicts correctly which is pest pattern affected the image and the healthy ginger plant image. Subsequently, confusion matrices for pest pattern are given in Figure 8.

3.3. Nutrient Deficiency Classification

This section explores the performance of ANN and deep learning algorithms on a real field image dataset for nutrient deficiency classification. The experimental results were analyzed using performance metrics to detect the deficiency nutrients. It contains 1440 training and 361 testing images having Deficiency and healthy classes. We divided the dataset into an 80/20 ratio, in which 80% is used for training and the remaining 20% for testing purposes. It is evident from the findings that deep learning achieved effective results on the applied dataset. For instance, the Models’ accuracy achieved is shown in Figure 9. It is clearly shown that ANN improves validation accuracy by 97% when classifying the deficiency nutrients and healthy ginger plants. Other models such as CNN score 96%, and CNN gains result nearer to ANN. MobileNetV2 and VGG-16 models reached 95% validation accuracy.
In Table 8, perfomrance measures are given. The Table shows that models give high results, so very less loss is calculated. It is noticed that ANN achieved highest accuracy rate of 97%. CNN and VGG-16 showed 0.1% loss. Other models achieved 0.2% loss. On the other side, VGG-16 demonstrated the highest precision and recall score. The ROC curve is used to evaluate the performance of the classification models. ANN, CNN, and VGG-16 roc curves are shown in Figure 10. The results showed that ANN demonstrated fast convergence rate as compared to other techniques.
The implementation of testing of the Nutrient deficiency classification problem is shown in Figure 11. Each algorithm showed the accurately detection capability for the nutrient deficiency classification from unseen leaf images of the ginger plant. The testing of ANN, CNN, MobileNetV2, and VGG-16 is shown in Figure 11a, Figure 11b, Figure 11c and Figure 11d respectively. Figure 12 shows the confusion matrices for Nutrient deficiency classification.

3.4. Soft Rot Disease Detection

This section discusses the detection of Soft rot disease and healthy rhizomes at the last stage. The dataset of soft rot disease is collected from the market. The soft rot disease arrives on the plant at the last stage. This study detects the ginger plant disease at all stages and proves to be an efficient system for ginger plant disease detection. The efficiency of ANN and deep learning models is examined in this section. It is clearly observed that CNN gains the highest 99% validation accuracy (see Figure 13) as compared to other models. CNN also demonstrated highest precision and recall score. MobileNetV2 achieves 97%, ANN, and VGG-16 96%. ROC curve achieved by ANN and CNN is shown in Figure 14 and showed better results.
ANN is tested on unseen data (20%) and predicts correctly about which is a healthy rhizome and which one is soft rot disease on ginger at the last stage, as depicted in Figure 15a. CNN, MObileNetV2 and VGG-16 testing are shown in Figure 15b, Figure 15c and Figure 15d, respectively.
All the results are summarized in Table 9. CNN and VGG-16 give the minimum loss of 0.1%. CNN and ANN demonstrated the highest precision and recall scores, results clearly showing that models correctly predict the images. Deep learning models such as MobileNetV2 and VGG-16, also give much better results as compared to ANN and CNN. F1 Score shows that ANN gives better results with 96%, as compared to other categories deficiency nutrients and pest pattern results.
The confusion matrix of the Advanced deep learning algorithms for Softrot disease detection is shown in Figure 16. Left diagonal values in the matrix are correctly classified and others are misclassified. In the case of deficiency nutrients, pest pattern, and soft rot disease correctly classified images to the target labels are 288, 364, 64 respectively. Finally, the overall precision, F1 score, and recall are shown in Figure 17. The result indicates that ANN shows much better precision than all other deep learning models.The best way to develop a model for improved categorization using neural network structure is to use deep learning.
In the following, we show the run-time of the implemented algorithms to compare efficacy and performance of the work. In Table 10, the algorithm run-time is shown for testing deficiency, pest pattern, and soft rot disease problem of the ginger plant. ANN and CNN take less time 2 s as compared to other algorithms. Similarly, in the category pest pattern, healthy 2 s time is covered when testing the images while in soft rot disease and healthy category, CNN showed 2 s.
Table 11 summarizes our study’s comparative analysis. In [31] alfalfa plant achieves the highest accuracy with 899 images. When comparing a wheat plant [32,33], both employ the Random Forest algorithm, however, ref. [32] has a better accuracy of 88%. Similarly, maize plant [34] appears to be better than [22] in terms of accuracy. In our study, CNN showed 96% accuracy rate which leads to better results. From all aspects, it is evident that the ginger plant produces highly intriguing outcomes when compared to existing solutions, and this study is quite significant.

4. Conclusions

In this study, a novel and unique dataset was developed from the orchard of Pir Mehr Ali Shah Arid Agriculture University Rawalpindi (PMAS-AAUR). The study applied ANN, CNN, MobileNetV2, and VGG-16 to classify the images in the dataset. These algorithms were used to detect pest patterns, deficiency nutrients, and soft rot disease of ginger. As a result, the VGG-16 algorithm achieved the highest 96% accuracy on pest patterns and healthy ginger image detection. When the adopted algorithms were applied to deficiency nutrients and healthy ginger images, ANN achieved the highest 97% accuracy. Finally, all algorithms detect and classify the ginger plant-affected and healthy leaves. This study demonstrated the applicability of the various algorithms namely, ANN, CNN, MobileNetV2, and VGG-16 for the disease detection of the ginger plant. The results achieved are the basis of the developed dataset and may vary for the different dataset. In future work, we are interested to develop a real-time detection system for ginger plant by using mobile application.

Author Contributions

Conceptualization, N.Z. and H.W.; methodology, H.W., W.A.; software, H.W.; validation, N.Z., H.W. and W.A.; formal analysis, N.Z., H.W., W.A., A.M., A.G. and S.u.I.; investigation, N.Z., H.W. and W.A.; resources, N.Z. and H.W.; data curation, N.Z. and H.W.; writing—original draft preparation, N.Z., H.W., W.A., A.M., A.G. and S.u.I.; writing—review and editing, N.Z., H.W., W.A., A.M., A.G. and S.u.I.; visualization, N.Z., H.W., W.A., A.M., A.G. and S.u.I. All authors have read and agreed to the submitted version of the manuscript.

Funding

This research received no external funding.

Institutional Review Board Statement

Not applicable.

Informed Consent Statement

Not applicable.

Data Availability Statement

The data presented in this study are available on request from the authors.

Acknowledgments

The authors would like to thank Touqeer Ahmed from Arid Agriculture University, Rawalpindi, Pakistan, for his valuable discussions and assistance during data collection. The authors would like to thank University Malaysia Sabah for supporting this project.

Conflicts of Interest

The authors declare no conflict of interest.

References

  1. Fountas, S.; Espejo-García, B.; Kasimati, A.; Mylonas, N.; Darra, N. The future of digital agriculture: Technologies and opportunities. IT Prof. 2020, 22, 24–28. [Google Scholar] [CrossRef]
  2. Shepherd, M.; Turner, J.A.; Small, B.; Wheeler, D. Priorities for science to overcome hurdles thwarting the full promise of the ‘digital agriculture’revolution. J. Sci. Food Agric. 2020, 100, 5083–5092. [Google Scholar] [CrossRef] [PubMed] [Green Version]
  3. Jung, J.; Maeda, M.; Chang, A.; Bhandari, M.; Ashapure, A.; Landivar-Bowles, J. The potential of remote sensing and artificial intelligence as tools to improve the resilience of agriculture production systems. Curr. Opin. Biotechnol. 2021, 70, 15–22. [Google Scholar] [CrossRef] [PubMed]
  4. Carolan, M. Automated agrifood futures: Robotics, labor and the distributive politics of digital agriculture. J. Peasant Stud. 2020, 47, 184–207. [Google Scholar] [CrossRef]
  5. Roy, A.M.; Bhaduri, J. A deep learning enabled multi-class plant disease detection model based on computer vision. AI 2021, 2, 26. [Google Scholar] [CrossRef]
  6. Goyal, L.; Sharma, C.M.; Singh, A.; Singh, P.K. Leaf and spike wheat disease detection & classification using an improved deep convolutional architecture. Inform. Med. Unlocked 2021, 25, 100642. [Google Scholar]
  7. Jiang, Z.; Dong, Z.; Jiang, W.; Yang, Y. Recognition of rice leaf diseases and wheat leaf diseases based on multi-task deep transfer learning. Comput. Electron. Agric. 2021, 186, 106184. [Google Scholar] [CrossRef]
  8. Esgario, J.G.; de Castro, P.B.; Tassis, L.M.; Krohling, R.A. An app to assist farmers in the identification of diseases and pests of coffee leaves using deep learning. Inf. Process. Agric. 2021, 9, 38–47. [Google Scholar] [CrossRef]
  9. Sabanci, K.; Aslan, M.F.; Ropelewska, E.; Unlersen, M.F.; Durdu, A. A Novel Convolutional-Recurrent Hybrid Network for Sunn Pest–Damaged Wheat Grain Detection. Food Anal. Methods 2022, 15, 1748–1760. [Google Scholar] [CrossRef]
  10. Knoll, F.J.; Czymmek, V.; Harders, L.O.; Hussmann, S. Real-time classification of weeds in organic carrot production using deep learning algorithms. Comput. Electron. Agric. 2019, 167, 105097. [Google Scholar] [CrossRef]
  11. Dake, G. Diseases of ginger (Zingiber officinale Rosc.) and their management. J. Spices Aromat. Crop. 1995, 4, 70–73. [Google Scholar]
  12. Adamu, A.; Ahmad, K.; Siddiqui, Y.; Ismail, I.S.; Asib, N.; Bashir Kutawa, A.; Adzmi, F.; Ismail, M.R.; Berahim, Z. Ginger Essential Oils-Loaded Nanoemulsions: Potential Strategy to Manage Bacterial Leaf Blight Disease and Enhanced Rice Yield. Molecules 2021, 26, 3902. [Google Scholar] [CrossRef] [PubMed]
  13. Huang, K.; Sui, Y.; Miao, C.; Chang, C.; Wang, L.; Cao, S.; Huang, X.; Li, W.; Zou, Y.; Sun, Z.; et al. Melatonin enhances the resistance of ginger rhizomes to postharvest fungal decay. Postharvest Biol. Technol. 2021, 182, 111706. [Google Scholar] [CrossRef]
  14. Yun, Y.; Ma, D.; Yang, M. Human–computer interaction-based decision support system with applications in data mining. Future Gener. Comput. Syst. 2021, 114, 285–289. [Google Scholar] [CrossRef]
  15. Abbas, A.; Jain, S.; Gour, M.; Vankudothu, S. Tomato plant disease detection using transfer learning with C-GAN synthetic images. Comput. Electron. Agric. 2021, 187, 106279. [Google Scholar] [CrossRef]
  16. Qiu, R.; Yang, C.; Moghimi, A.; Zhang, M.; Steffenson, B.J.; Hirsch, C.D. Detection of fusarium head blight in wheat using a deep neural network and color imaging. Remote Sens. 2019, 11, 2658. [Google Scholar] [CrossRef] [Green Version]
  17. Hernández, S.; Lopez, J.L. Uncertainty quantification for plant disease detection using Bayesian deep learning. Appl. Soft Comput. 2020, 96, 106597. [Google Scholar] [CrossRef]
  18. Chen, J.; Chen, J.; Zhang, D.; Sun, Y.; Nanehkaran, Y.A. Using deep transfer learning for image-based plant disease identification. Comput. Electron. Agric. 2020, 173, 105393. [Google Scholar] [CrossRef]
  19. Lu, J.; Hu, J.; Zhao, G.; Mei, F.; Zhang, C. An in-field automatic wheat disease diagnosis system. Comput. Electron. Agric. 2017, 142, 369–379. [Google Scholar] [CrossRef] [Green Version]
  20. Kaur, S.; Pandey, S.; Goel, S. Plants disease identification and classification through leaf images: A survey. Arch. Comput. Methods Eng. 2019, 26, 507–530. [Google Scholar] [CrossRef]
  21. Geetharamani, G.; Pandian, A. Identification of plant leaf diseases using a nine-layer deep convolutional neural network. Comput. Electr. Eng. 2019, 76, 323–338. [Google Scholar]
  22. Mahalakshmi, S.D.; Vijayalakshmi, K. Agro Suraksha: Pest and disease detection for corn field using image analysis. J. Ambient Intell. Humaniz. Comput. 2021, 12, 7375–7389. [Google Scholar] [CrossRef]
  23. Li, D.; Wang, R.; Xie, C.; Liu, L.; Zhang, J.; Li, R.; Wang, F.; Zhou, M.; Liu, W. A recognition method for rice plant diseases and pests video detection based on deep convolutional neural network. Sensors 2020, 20, 578. [Google Scholar] [CrossRef] [PubMed] [Green Version]
  24. Pesitm, S.; Madhavi, M. Detection of Ginger Plant Leaf Diseases by Image Processing & Medication through Controlled Irrigation. J. Xi’an Univ. Archit. Technol. 2020, 12, 1318–1322. [Google Scholar]
  25. Iqbal, Z.; Khan, M.A.; Sharif, M.; Shah, J.H.; ur Rehman, M.H.; Javed, K. An automated detection and classification of citrus plant diseases using image processing techniques: A review. Comput. Electron. Agric. 2018, 153, 12–32. [Google Scholar] [CrossRef]
  26. Lin, Z.; Mu, S.; Huang, F.; Mateen, K.A.; Wang, M.; Gao, W.; Jia, J. A unified matrix-based convolutional neural network for fine-grained image classification of wheat leaf diseases. IEEE Access 2019, 7, 11570–11590. [Google Scholar] [CrossRef]
  27. Boulent, J.; Foucher, S.; Théau, J.; St-Charles, P.L. Convolutional neural networks for the automatic identification of plant diseases. Front. Plant Sci. 2019, 10, 941. [Google Scholar] [CrossRef] [Green Version]
  28. Too, E.C.; Yujian, L.; Njuki, S.; Yingchun, L. A comparative study of fine-tuning deep learning models for plant disease identification. Comput. Electron. Agric. 2019, 161, 272–279. [Google Scholar] [CrossRef]
  29. Theckedath, D.; Sedamkar, R. Detecting affect states using VGG16, ResNet50 and SE-ResNet50 networks. SN Comput. Sci. 2020, 1, 79. [Google Scholar] [CrossRef] [Green Version]
  30. Ropelewska, E.; Cai, X.; Zhang, Z.; Sabanci, K.; Aslan, M.F. Benchmarking Machine Learning Approaches to Evaluate the Cultivar Differentiation of Plum (Prunus domestica L.) Kernels. Agriculture 2022, 12, 285. [Google Scholar] [CrossRef]
  31. Qin, F.; Liu, D.; Sun, B.; Ruan, L.; Ma, Z.; Wang, H. Identification of alfalfa leaf diseases using image recognition technology. PLoS ONE 2016, 11, e0168274. [Google Scholar] [CrossRef] [PubMed] [Green Version]
  32. Zhao, J.; Fang, Y.; Chu, G.; Yan, H.; Hu, L.; Huang, L. Identification of leaf-scale wheat powdery mildew (Blumeria graminis f. sp. Tritici) combining hyperspectral imaging and an SVM classifier. Plants 2020, 9, 936. [Google Scholar] [CrossRef] [PubMed]
  33. Johannes, A.; Picon, A.; Alvarez-Gila, A.; Echazarra, J.; Rodriguez-Vaamonde, S.; Navajas, A.D.; Ortiz-Barredo, A. Automatic plant disease diagnosis using mobile capture devices, applied on a wheat use case. Comput. Electron. Agric. 2017, 138, 200–209. [Google Scholar] [CrossRef]
  34. Adam, E.; Deng, H.; Odindi, J.; Abdel-Rahman, E.M.; Mutanga, O. Detecting the early stage of phaeosphaeria leaf spot infestations in maize crop using in situ hyperspectral data and guided regularized random forest algorithm. J. Spectrosc. 2017, 2017, 6961387. [Google Scholar] [CrossRef]
  35. Ramesh, S.; Hebbar, R.; Niveditha, M.; Pooja, R.; Shashank, N.; Vinod, P. Plant disease detection using machine learning. In Proceedings of the 2018 International Conference on Design Innovations for 3Cs Compute Communicate Control (ICDI3C), Bangalore, India, 25–28 April 2018; pp. 41–45. [Google Scholar]
  36. Sharma, P.; Berwal, Y.P.S.; Ghai, W. Performance analysis of deep learning CNN models for disease detection in plants using image segmentation. Inf. Process. Agric. 2020, 7, 566–574. [Google Scholar] [CrossRef]
  37. Padol, P.B.; Yadav, A.A. SVM classifier based grape leaf disease detection. In Proceedings of the 2016 Conference on Advances in Signal Processing (CASP), Pune, India, 9–11 June 2016; pp. 175–179. [Google Scholar]
  38. Pantazi, X.E.; Moshou, D.; Tamouridou, A.A. Automated leaf disease detection in different crop species through image features analysis and One Class Classifiers. Comput. Electron. Agric. 2019, 156, 96–104. [Google Scholar] [CrossRef]
Figure 1. Proposed method for ginger plant disease detection using deep learning models.
Agriculture 12 00742 g001
Figure 2. Data collection field.
Agriculture 12 00742 g002
Figure 3. Output images after applying data augmentation and pre-processing.
Agriculture 12 00742 g003
Figure 4. VGG-16 architectural model modified after [28].
Agriculture 12 00742 g004
Figure 5. Models accuracy on Pest pattern classification.
Agriculture 12 00742 g005
Figure 6. Models ROC on Pest pattern classification. (TPR = True positiver rate, FPR = False positive rate).
Agriculture 12 00742 g006
Figure 7. Testing of models on pest pattern classification.
Agriculture 12 00742 g007
Figure 8. Confusion matrices for pest pattern.
Agriculture 12 00742 g008
Figure 9. Models accuracy on nutrient deficiency classification. (a) ANN accuracy. (b) CNN accuracy. (c) MobileNetV2 accuracy. (d) VGG16 accuracy.
Agriculture 12 00742 g009
Figure 10. Models ROC curve on nutrient deficiency classification.
Agriculture 12 00742 g010
Figure 11. Testing of models on nutrient deficiency classification.
Agriculture 12 00742 g011
Figure 12. Confusion matrices for nutrient deficiency.
Agriculture 12 00742 g012
Figure 13. Models accuracy on Soft rot disease classification.
Agriculture 12 00742 g013
Figure 14. Models ROC on soft rot disease detection.
Agriculture 12 00742 g014
Figure 15. Testing of model on soft rot disease detection.
Agriculture 12 00742 g015
Figure 16. Confusion matrices for soft rot disease.
Agriculture 12 00742 g016
Figure 17. Comparison of Precision, F1 score and Recall values achieved on Pest Pattern, Deficiency and Soft rot classification by using ANN, CNN, MobileNetV2, and VGG-16 models.
Agriculture 12 00742 g017
Table 1. Summary of the literature review.
Ref.PlantClassifierAccuracyDataset
 [19]WheatVGG-1693.27%PlantVillage
 [25]CitrusK-means, Classification73%PlantVillage
 [20]Fruits and vegetablesSupport vector machine, fuzzy classifier, neural networkNot givenPlantVillage
 [26]WheatAlexNet, VGG-1690.01%Real Field
 [27]UnspecifiedCNN, Classification83.02%Minnesota, USA
 [16]WheatDeep convolutional neural network92%Shandong Province, China
 [21]Different plantsClassification96.46%PlantVillage
 [22]CornSVM and Clustering52%PlantVillage
 [23]RiceResNet-101, VGG-16, ResNet-5085%Anhui, Jiangxi, Hunan Province, China.
 [24]GingerSVMNot givenReal Field
Table 2. Dataset Description.
CategoryNo of ImagesDimensionsTrainingTesting
Deficiency-Healthy1801150 × 150 × 31440361
Pest pattern-Healthy2275150 × 150 × 31820455
Soft rot-Healthy320150 × 150 × 325664
Table 3. Hyper parameters tuning used for ANN.
Dataset ratioThere are two classes for soft rot disease, pest pattern and deficiency effected detection. Health and soft rot disease effected, healthy and pest attacked, healthy ginger leaves and deficiency effected leaves. 80% data is used for training and 20% data for testing for all detection cases.
PreprocessingImages are renamed and resized to 150 × 150.
Batch SizeBatch size for training the ANN algorithm is 128.
EpochsNumber of epochs for training the algorithm are 60.
Learning RateLearning rate is set at 0.001 for the proposed model.
Optimization algorithmThe proposed model is trained by Adam optimizer.
Table 4. Hyper parameters tuning used for CNN.
Dataset ratioThere are two classes for soft rot disease, pest pattern and deficiency effected detection. Health and soft rot disease effected, healthy and pest attacked, healthy ginger leaves and deficiency effected leaves. 80% data is used for training and 20% data for testing for all detection cases.
Pre-processingImages are renamed and resized to 150 × 150.
Batch sizeBatch size is 32 for training the CNN.
EpochsEpochs are set to 60 to train the CNN. algorithm.
Learning rateLearning rate of 0.001 is set for the proposed model.
Optimization algorithmThe CNN model is trained by Adam optimizer.
Table 5. Hyper parameters tuning used for VGG-16.
Dataset ratioThere are two classes for soft rot disease, pest pattern and deficiency effected detection. Health and soft rot disease effected, healthy and pest attacked, healthy ginger leaves and deficiency effected leaves. 80% data is used for training and 20% data for testing for all detection cases.
Pre-processingImages are renamed and resized to 150 × 150.
Batch SizeThe batch size for training the algorithm is 32.
EpochsThe model was trained with 60 epochs.
Learning RateLearning rate is set at 0.001 the proposed model.
Optimization algorithmThe proposed model is trained by adaptive moment estimation optimizer (ADAM).
Table 6. Hyper parameters tuning used for MobileNetV2.
Dataset RatioSoft rot disease = 256 image, healthy rhizome contains = 256 images, Pest pattern class = 910 images, healthy ginger = 910 images, Deficiency nutrients and healthy leaves of ginger contain 720 images each class. 80% data is for training and remaining 20% for testing.
PreprocessingAll the images are renamed and resized to 150 × 150.
Batch SizeThe batch size of the mobileNetV2 algorithm is 128.
EpochsTotal epochs for training the MobileNetV2 algorithm are 60.
Learning RateThe learning rate of this algorithm uses 0.001
Optimization AlgorithmAdam optimizer is used in this proposed methodology.
Table 7. Pest pattern results.
AlgorithmAccuracyLossPrecisionF1 ScoreRecall
VGG-1696%0.1%97%75%98%
ANN95%0.2%100%78%100%
MobileNetv293%0.1%98%85%99%
CNN92%0.2%95%84%99%
Table 8. Deficiency results.
AlgorithmAccuracyLossPrecisionF1 ScoreRecall
ANN97%0.2%99%65%100%
CNN96%0.1%99%86%98%
MobileNetV295%0.2%98%89%97%
VGG-1695%0.1%100%65%100%
Table 9. Softrot disease results.
AlgorithmAccuracyLossPrecisionF1 ScoreRecall
CNN99%0.1%100%91%100%
MobileNetv297%0.2%99%95%99%
ANN96%0.25%100%96%100%
VGG-1696%0.1%98%94%99%
Table 10. Running time of Algorithms.
CategoryAlgorithmsRunning Time
Deficiency and HealthyANN2 s
CNN2 s
MobileNetV23 s
VGG-164 s
Pest Pattern and HealthyVGG-162 s
ANN3 s
MobileNetV24 s
CNN4 s
Soft rot disease and HealthyCNN2 s
MobileNetV23 s
ANN3 s
VGG-163 s
Table 11. Performance comparison of proposed work with other existing works.
Ref.PlantSize of DatasetMethodAccuracy
[32]Wheat75SVM, PCA, RF88%
[34]Maize260Guided Regulized Random Forest88%
[22]Maize-Binary Support Vector Machine52%
[35]Papaya160Random Forest70%
[36]Tomato713CNN82%
[37]Grapes137SVM88%
[31]Alfalfa899Regression Tree, PCA94%
[33]Wheat3500Random Forest, Naive base78%
[38]Tomato3535SVM81%
Our studyGinger4396ANN, CNN, VGG-16 and MobileNetV297%, 96%, 96%, and 97%, respectively
Publisher’s Note: MDPI stays neutral with regard to jurisdictional claims in published maps and institutional affiliations.

