Article

Assessment of Feed Efficiency and Its Relationship with Egg Quality in Two Purebred Chicken Lines and Their Reciprocal Crosses

Key Laboratory of Animal (Poultry) Genetics Breeding and Reproduction, Ministry of Agriculture and Rural Affairs, Institute of Animal Science, Chinese Academy of Agricultural Sciences, Beijing 100193, China
*
Author to whom correspondence should be addressed.
These authors contributed equally to this work.
Agriculture 2022, 12(12), 2171; https://doi.org/10.3390/agriculture12122171
Submission received: 18 October 2022 / Revised: 8 December 2022 / Accepted: 14 December 2022 / Published: 17 December 2022
(This article belongs to the Section Farm Animal Production)

Abstract

:
Crossbreeding is normally applied to improve the economical traits of chickens. However, feed efficiency and its relationship with egg quality have rarely been explored in crossbreds. Herein, White Leghorn and Beijing You chickens were selected to generate purebreds (WW, YY) and reciprocal crossbreds (YW, WY), which were evaluated in terms of daily feed intake (DFI), feed conversion ratio (FCR), and residual feed intake (RFI) at 43 to 46 and 69 to 72 weeks of age, respectively. We found that WY was more efficient than YW in both laying periods. The correlation analysis showed that RFI was highly correlated with DFI (0.49 to 0.84) but unrelated to egg mass, and FCR was negatively correlated with egg mass (−0.77 to −0.43) in both purebreds and crossbreds. Moreover, RFI was not correlated with egg quality traits within each genetic group, except for the egg yolk ratio (0.27) in WW. FCR was negatively correlated with eggshell weight and thickness (−0.33 to −0.19) in WW and WY. Compared to FCR, selection for RFI could improve feed efficiency without significant changes in egg mass and quality in chickens. These findings provide new insights into the improvement of feed efficiency using rational parental lines in chicken crossbreeding.

1. Introduction

Crossbreeding is one of the most effective strategies to improve the production of many crops and animals [1,2]. Heterosis and breed complementarity are the primary benefits realized from a properly planned crossbreeding program. Heterosis is the increase in the performance of the offspring above what is expected based on their parents’ average performance [3]. In the poultry industry, crossbreeding has been exhaustively exploited to improve the performance of local chicken breeds [4,5,6]. Various crossbreeding schemes involving elite chicken lines and local chicken breeds have reported heterosis for growth [7,8,9], egg production [10,11], and egg quality [6,12,13]. China possesses hundreds of uniquely indigenous breeds, which play a vital role in the development of society, human livelihoods, and ecological conditions. However, their production performance is inferior to that of commercial breeds. Crossbreeding allows a breeder to utilize the characteristics of different breeds to improve their performance.
Feed consumption accounts for 60–70% of the total production costs [14]. Increasing feed prices and the impact of poultry production on the environment have limited the development of the poultry industry [15]. Thus, improving the feed efficiency of chickens will continue to be critical for the overall growth of the poultry industry. The feed conversion ratio (FCR), defined as input over output, is a commonly used measure of feed utilization efficiency [16,17,18]. Another way to measure feed utilization efficiency is residual feed intake (RFI), which was first proposed by Koch et al. [19]. RFI is defined as the difference between the observed feed intake and the feed intake predicted from metabolic body weight, body weight gain, and egg mass in laying hens. Individuals with a lower RFI tend to have a lower feed intake and higher feed efficiency with normal production performance. Previous studies documented RFI heritability ranging from 0.3 to 0.6 in laying hens. Moreover, RFI appears to be independent of production traits and is regarded as an ideal standard for the genetic improvement of feed efficiency in egg-type chickens [18,20,21,22].
Crossbreeding is a common method deployed to improve the productivity of chickens. Does crossbreeding improve the feed efficiency of chickens? However, the phenotypic changes in feed efficiency and their relationships with other economic traits remain largely unknown in crossbred chicken populations. Therefore, the objectives of this study were: (1) to measure feed efficiency and estimate the phenotypic correlation between feed efficiency and its related traits in two purebred populations and their reciprocal crossbred populations, and (2) to explore and compare the relationships between feed efficiency and egg quality in purebreds and crossbreds. Our findings may help increase the understanding of the effects of crossbreeding on feed efficiency, egg quality, and their relationships, as well as contribute to the crossbreeding of chickens.

2. Materials and Methods

2.1. Experimental Population and Management

The experimental population was generated by the reciprocal crossing of Beijing You chickens (YY) and White Leghorn chickens (WW). YY is a Chinese native breed with superior egg quality but low egg production efficiency. WW is a world-famous breed intensively selected for its high egg production. At 43 weeks of age, the roosters were selected based on their development, similar weight, and semen quality. Through artificial insemination, thirty WW males were mated to 150 WW females and 150 YY females to generate WW and WY, respectively. Thirty YY males were mated to 150 different YY females and 150 different WW females to generate YY and YW, respectively. The birds were vaccinated for Marek disease at birth and reared in identical houses following the same standard brooding procedures from 1 to 18 weeks of age. After that, hens were transferred to identical laying houses and kept in individual cages (37 × 34 × 34 cm). The pullets were fed the same diet containing 16% CP, 2800 kcal/kg ME, 2% Ca, and 0.32% non-phytate P from 8 weeks of age to 5% egg production. During the laying period, a diet containing 16.5% CP, 2700 kcal/kg ME, 3.5% Ca, and 0.32% non-phytate P was offered ad libitum. The lighting regime consisted of a systematic reduction in light from 24 h at one-day-old to 10 h at 8 weeks of age. Light was supplied for 9 h throughout the growing period from 8 to 20 weeks of age. Thereafter, the lighting period was successively increased, adding 1 h each week until 29 weeks of age. Constant lighting for 16 h from 06:00 to 22:00 was maintained from 30 weeks of age. During the feeding trial, all hens were managed under the same standard conditions at the experimental farm of the Institute of Animal Sciences, Chinese Academy of Agricultural Sciences.

2.2. Feed Efficiency Determination

For each bird, feed intake, egg mass, body weight, and body weight gain were measured in the two 4-week laying periods [18] including 43 to 46 weeks of age (T1) and 69 to 72 weeks of age (T2), respectively. T1 was the mid-laying period in egg-type chickens, during which production traits, such as egg production, fertility traits, and feed efficiency were intensively measured for breeding. T2 was the late laying period and the beginning of the prolonged laying period. The feed efficiency during this period has rarely been reported, so this investigation may contribute to the further genetic analysis and breeding of chickens. All performance traits were recorded by the same attendants using the same instruments throughout the experiments. In the feeding trial, each bird was equipped with an individual feeding pan by partitioning the feeding trough using metal baffles. Feed was added daily by hand, and the total weight of feed provided was recorded. Total feed intake for each hen was calculated by summing the feed offered and then transformed into the daily feed intake (DFI) for each hen. Metabolic body weight (MBW) and body weight gain (BWG) were calculated based on the average body weight measured at the start and end of the trial. Egg laying and collection were carried out once a day for each hen to calculate total egg mass (EM), which was transformed into the daily egg mass (DEM). The feed conversion ratio (FCR) for each hen was expressed as the ratio of feed intake to egg mass. The following formula was fitted for all birds to calculate RFI based on feed intake (FI), metabolic BW, EM, and BWG:
RFI = FI b 0 + b 1 × MBW 0.75 + b 2 × EM + b 3 × BWG
where b0, b1, b2, and b3 are partial regression coefficients. Chickens that did not lay any eggs were excluded in the two laying periods. Thus, the presented descriptive statistics of all measured traits were based on 904 hens including 198 WW, 245 YY, 238 YW, and 223 WY in T1 and 860 hens including 181 WW, 209 YY, 256 YW, and 214 WY in T2.

2.3. Egg Quality Evaluation

Due to the late laying period in our experiment, we collected fresh eggs for 5 successive days to ensure three eggs per hen at 54 weeks of age and 72 weeks of age, respectively. In total, 2712 and 2580 eggs were measured for egg quality traits at two weeks of age, respectively. Egg length and width were measured using an FHK egg dimension meter (Fujihira Ind. Co. Ltd., Tokyo, Japan), and the egg shape index (ESI) was calculated as the ratio of egg width to egg length. Eggshell thickness (EST) was measured at the acute, equator, and obtuse end of each egg using a dial gauge micrometer to the nearest 0.01 mm. Eggshell strength (ESS) was measured at the obtuse pole of the egg using an Egg Force Reader (Orka Food Technology Ltd., Tel Aviv, Israel). The Haugh unit (HU) was measured using an Egg Analyzer (Orka Food Technology Ltd.). Eggshell weight (ESW) and egg yolk weight (EYW) were measured using a digital scale with a sensitivity of 0.01 g. The eggshell ratio (ESR) was calculated as the percentage of ESW to EW, and the egg yolk ratio (EYR) was calculated as the percentage of EYW to EW.

2.4. Statistical Analysis

The percentage of heterosis (H%) of the traits was calculated according to the following equation:
H % = F 1 ( P m +   P f ) / 2 ( P m +   P f ) / 2 × 100 %
where F 1 , P m , and P f are the average phenotypic value of the crossbreed, maternal line, and paternal line, respectively.
The data for feed efficiency and egg quality traits among the four genetic groups were analyzed using one-way ANOVA. The model encompassed the fixed effect of genetic groups as follows: X i j = μ + a i + e i j , where X i j , μ , a i , and e i j are observation, overall mean, genetic group, and residuals, respectively. Multiple comparisons between groups were carried out using Tukey’s test. Pearson partial correlations among the investigated traits were estimated for the whole population using genetic group as the covariate. Additionally, Pearson correlations among the investigated traits were separately estimated for each genetic group. All analyses and plots were implemented in R software (https://www.R-project.org/, accessed on 1 March 2022), and a p value less than 0.01 was considered to represent a significant difference.

3. Results

3.1. Descriptive Statistics of Traits

The feed efficiency traits, including DFI, FCR, and RFI, for the two laying periods are presented in Table 1. The values are presented as mean, standard deviation (SD), coefficient of variation (CV), and maximum and minimum for each trait. The average DFI was 97.38 g/d, ranging from 90.84 to 103.27 g/d in the four genetic groups at T1, while the average DFI increased to 102.94 g/d, ranging from 94.80 to 110.41 g/d, at T2. The DFI of YW was higher than that of the other three groups at both stages. At T1, the average FCR of the hens in the four groups was 2.76, ranging from 2.09 to 3.32. WY had the lowest FCR. At T2, the average FCR increased to 3.91, ranging from 3.54 to 4.09 in the four genetic groups. However, no significant difference in FCR was observed among the four genetic groups in the two laying periods. The average RFI of WW and YW was 1.87 g/d and 3.70 g/d, respectively, while the average RFI of YY and WY was −2.28 g/d and −3.10 g/d, respectively. Conversely, only hens in the YY genetic group had a significantly lower RFI during T2. The negative RFI for YY hens during the two periods proved that the hens had higher feed efficiency than hens from the other genetic groups. Furthermore, the large CV of RFI was related to the calculation method used, i.e., the residual of the regression model (FI = b0 + b1MBW^0.75 + b2EM + b3BWG). Therefore, the RFI always followed RFI~N (0, δ2), and the small mean value led to a large CV for RFI.
The average DEM for the four genetic groups was 45.31 g/d and 40.97 g/d in T1 and T2, respectively. WY and YW showed similarly positive heterosis for DEM, which was more significant in T2 (Table 2). The body weight of WY and YW showed over-parent heterosis, which was higher in YW than in WY (Table 2). Regarding the egg quality traits in both T1 and T2, the average value of each trait changed slightly between the two laying periods (Supplementary Tables S1 and S2). The EYW, EST, and ESW in WY and YW showed high parent heterosis, while the HU of the crossbreds showed low parent heterosis in both laying periods. The ESS and ESR of WW were lower than those of the other three genetic groups, while the HU of WW was higher than that of the other three genetic groups in the two laying periods. YY showed the highest EYR and lowest ESW in the two laying periods.

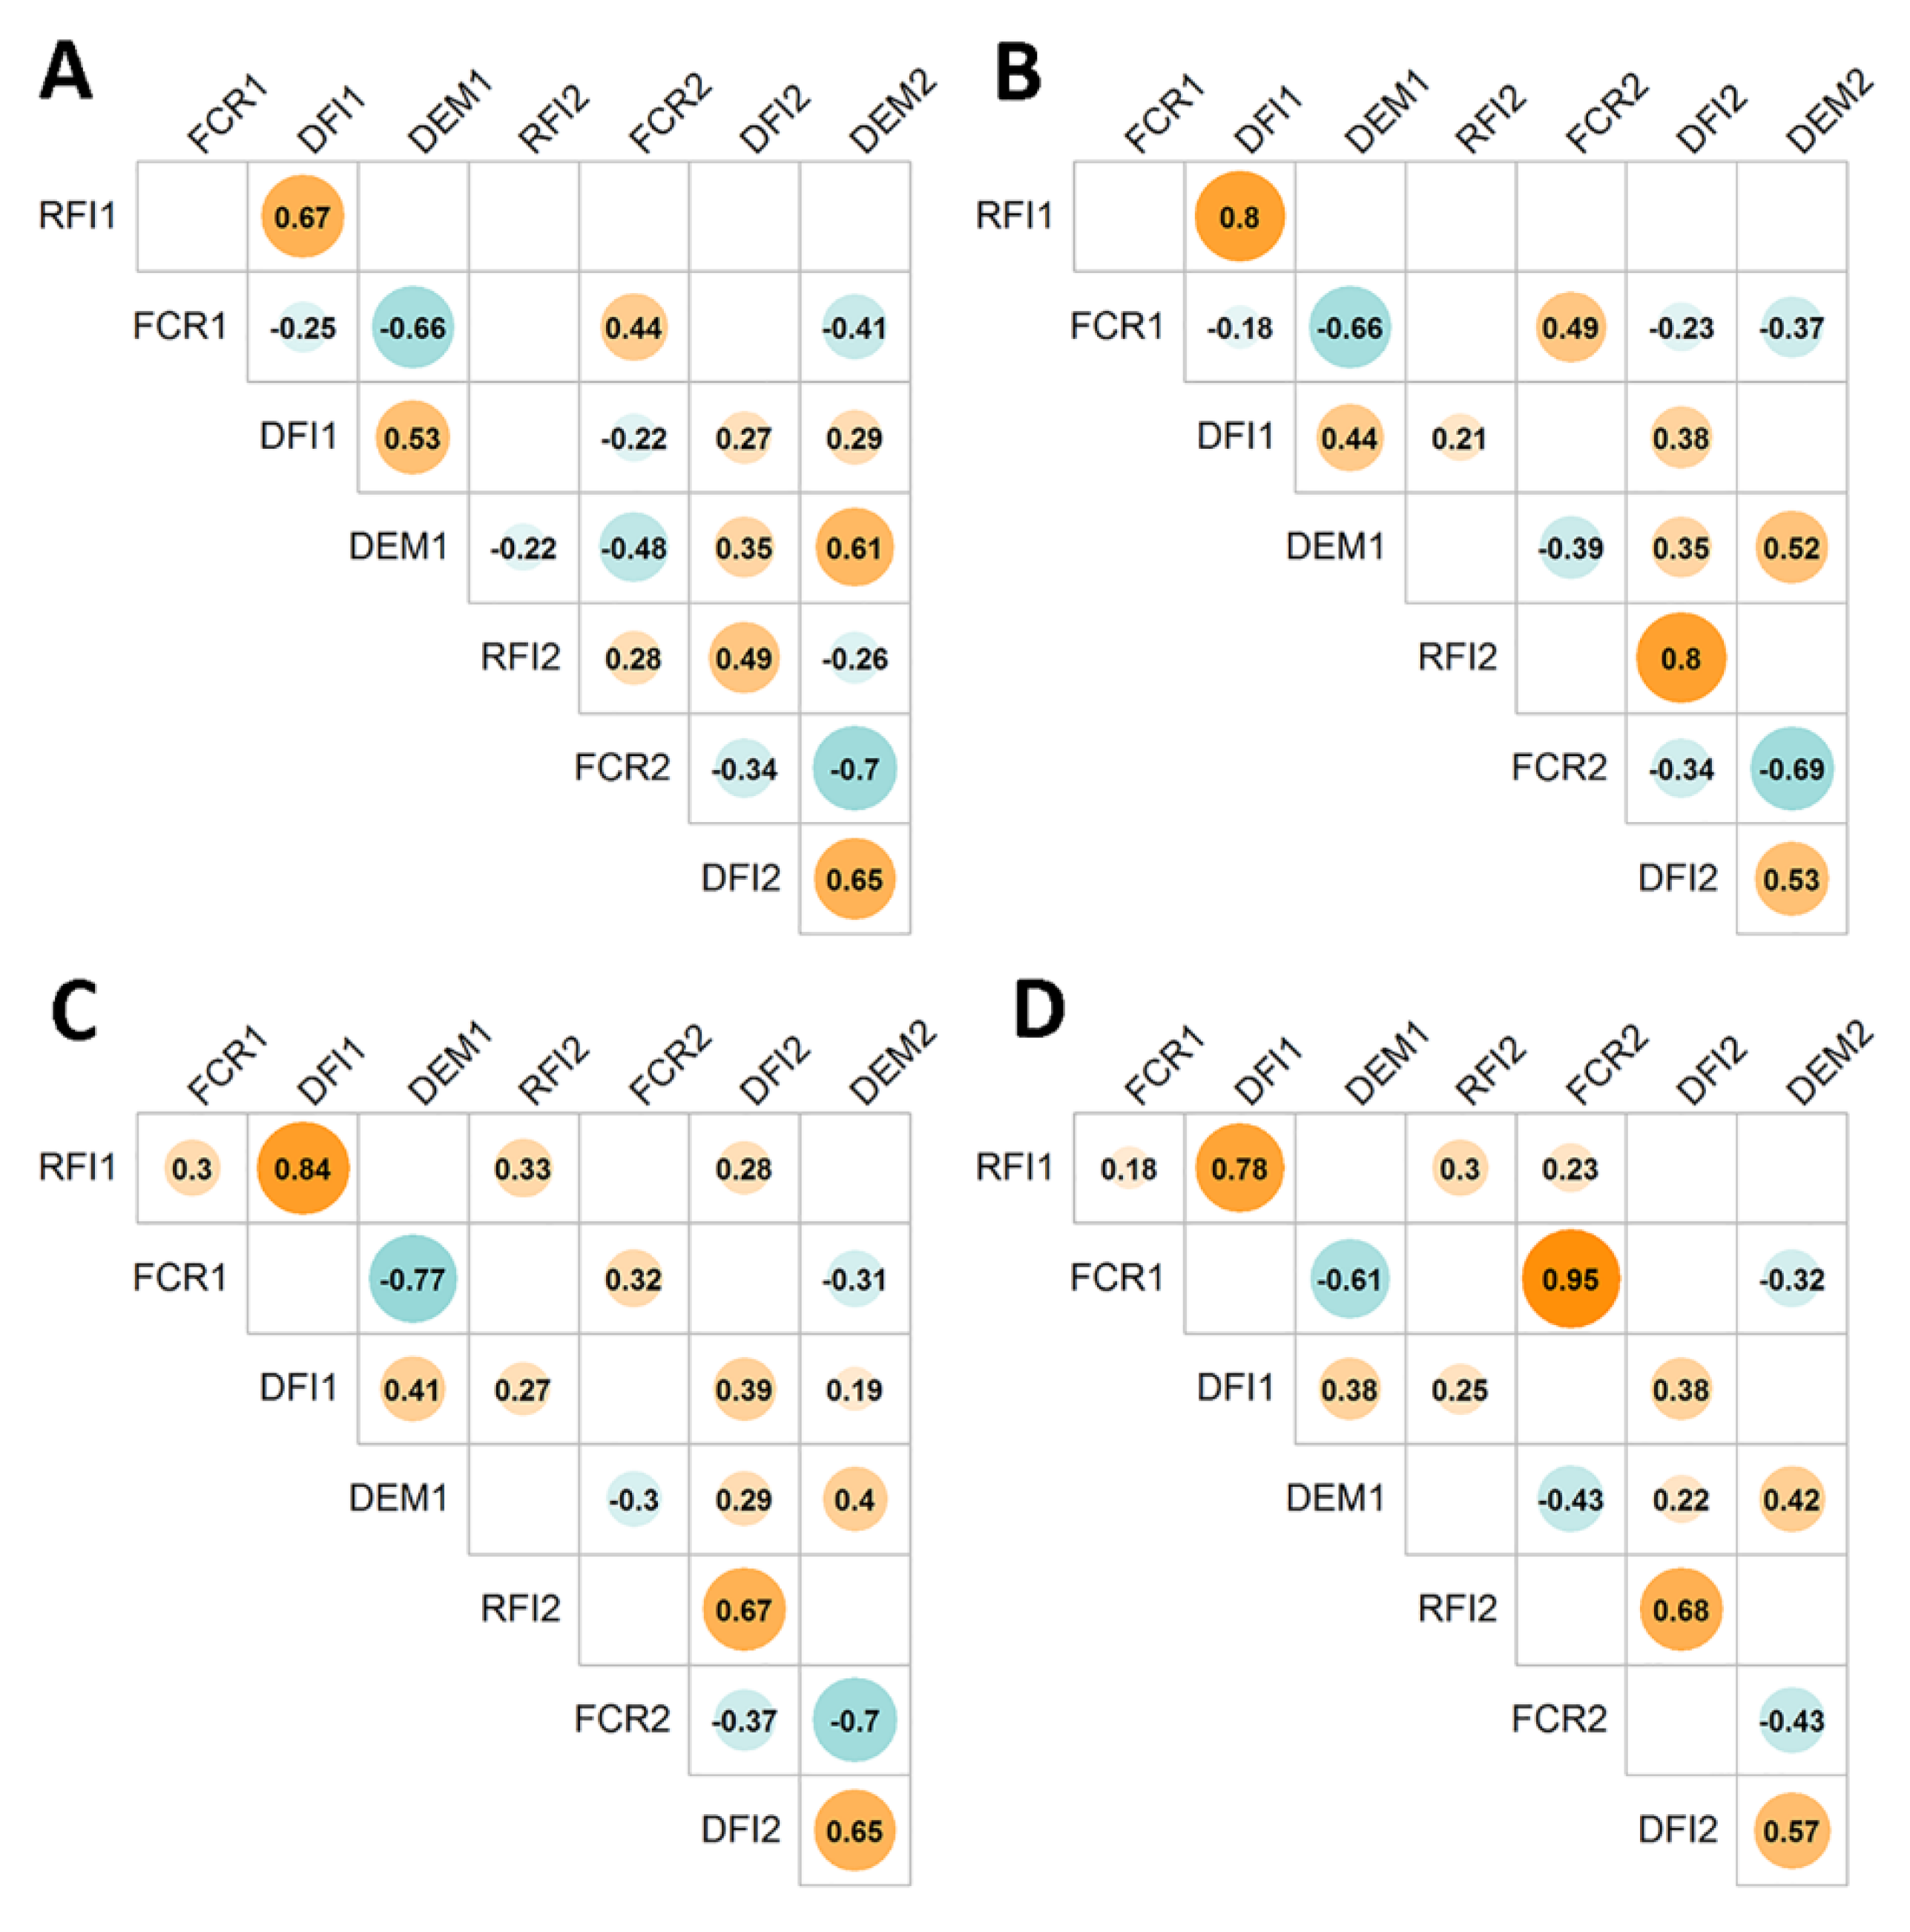
3.2. Phenotypic Correlations among DFI, FCR, and RFI

The partial correlation among feed efficiency and related traits within and between the two laying periods is shown in Supplementary Figure S1. High and positive correlations were found between RFI and DFI in both T1 (0.79) and T2 (0.68), whereas the correlation between FCR and DFI was slightly negative (−0.11 and −0.22). The correlation between FCR and DEM was highly negative in the two laying periods, and the correlation coefficients were −0.59 and −0.53, respectively. As expected, RFI was not significantly correlated with DEM during the two laying periods, which confirmed that selection for RFI would have a minor impact on egg mass. The correlation between FCR and RFI was weak within each laying period. Moreover, FCR1 and FCR2 (0.67) and RFI1 and RFI2 (0.26) were all positively correlated. RFI1 was positively correlated with FCR2 and DFI2, and the correlation coefficients were 0.12 and 0.18, respectively. These results suggested that selection for feed efficiency traits in the early laying period would favor these traits, with a similar selection response in the late laying period.
To explore the effect of the reciprocal cross on the relationship between feed intake and efficiency, the phenotypic correlations were calculated for each genetic group. As shown in Figure 1, RFI had a high and positive correlation with DFI in both laying periods, and the correlation coefficients ranged from 0.49 to 0.84, with the correlation in T1 being greater than that in T2. In T1, the correlation coefficients between FCR and DFI in the purebreds were −0.25 and −0.18 (Figure 1A,B), whereas the correlations were not significant for the crossbreds (Figure 1C,D). In T2, FCR was significantly and negatively correlated with DFI in WW (−0.34), YY (−0.34), and WY (−0.37). The RFI between the two periods showed no correlation in the purebreds but positive correlation in the crossbreds (0.33 and 0.30, Figure 1C,D). These results suggested that it was more effective to select for low-RFI birds in the early laying period among the crossbreds. Moreover, the correlations between RFI and DEM within the same laying period were weak in the four genetic groups, except for WW (−0.26) in T2. The FCR was highly negatively correlated with DEM (−0.43 to −0.77) in the four genetic groups.

3.3. Relationships between Feed Efficiency and Egg Quality Traits

The phenotypic correlations among feed efficiency (RFI and FCR) and egg quality traits for all birds in the two laying periods are shown in Supplementary Figure S2. In T1, there was no correlation between RFI and egg quality traits. FCR showed significant correlation with ESW (−0.10.) and EST (−0.10). In T2, RFI had a weak positive correlation with EYW (0.10). However, FCR was not correlated with any egg quality trait. Similarly, RFI1 was not significantly correlated with any egg quality trait in T2. Conversely, FCR1 showed significant correlation with EST2 (−0.10) and EYR2 (0.10). It can be seen that selection for RFI had a minor influence on egg quality traits.
The correlation between feed efficiency and egg quality in purebreds is shown in Table 3. In T1, RFI was not correlated with any egg quality trait. FCR was moderately correlated with ESW and EST in WW, with coefficients of −0.33 and −0.30, respectively. In T2, the RFI of WW was significantly correlated with EYR (0.27), while FCR was significantly correlated with ESW (−0.23). Regarding the correlation between feed efficiency in T1 and egg quality in T2, RFI1 was negatively correlated with ESI2 for YY (−0.19). FCR1 had a significant correlation (ranging from −0.21 to 0.26) with ESW2, ESR2, EYW2, and EYR2 in WW, and with EST2, ESW2, and EYR2 in YY. The correlations between feed efficiency and egg quality were also separately calculated in the crossbreds. In T1, RFI and FCR were not significantly correlated with egg quality traits. In T2, FCR was significantly but weakly correlated with EST (−0.19) and ESW (−0.19) in WY (Table 4). Regarding the correlation between feed efficiency during T1 and egg quality traits in T2, RFI1 was significantly correlated with ESI2 (0.17), EST2 (−0.18), and ESR2 (−0.18) for WY but not with egg quality traits in YW hens (Table 4). FCR1 was significantly correlated with various egg traits including ESI2, ESS2, EST2, ESW2, and ESR2 in WY, whereas it was only correlated with ESR2 in YW. Overall, the relationship between feed efficiency and egg quality traits varied between the reciprocal crossbreds. Moreover, the age at first egg (AFE) was not correlated with RFI or FCR in both laying periods, except for RFI2, which was negatively correlated with AFE (−0.21).

4. Discussion

Crossbreeding has significantly increased the productivity of animal and plant species by 15–50%, exerting a great impact on agriculture and human beings. Many studies on feed efficiency and its related traits have been carried out in chicken, duck, and quail purebreds [17,22,23,24,25]. However, feed efficiency and its relationship with economic traits in crossbreds have rarely been reported. In layer chickens, egg quality characteristics remain important economic traits, since egg shape, eggshell color, and eggshell strength are directly associated with retail egg value [26]. In the current study, we estimated the phenotypic correlation between feed efficiency and its related traits in reciprocal crossbred populations to explore the relationships between feed efficiency and egg quality in crossbreds.
From 43 to 46 weeks of age, the average daily feed intake of White Leghorn chickens was comparable to previous data reported in an F2 chicken population at a similar age [18], while the average daily feed intake of Beijing You chickens was lower than that of Beijing You chickens raised at a high stocking density from 31 to 38 weeks [27]. The feed intake of crossbred YW chickens showed negative heterosis during the two laying periods covered in this study, which could have been due to dominant, epistatic, and maternal effects [28]. The FCR values in this study were higher than those previously reported in White Leghorn chickens [18,29,30], while the FCR of Beijing You chickens was lower than in a previous study [27]. Generally, in the late laying period, hens laid fewer eggs due to functional degradation, with a consequent increase in feed consumption for those with a greater body weight. Hence, higher FCR values were observed in both the purebreds and the crossbreds within this period. Notably, the RFI values of YW and WY were similar to those of WW and YY, respectively, suggesting that RFI was regulated by the maternal genotype, in agreement with the results of a previous study [31]. Other studies have shown that the maternal genotype played an influential role in growth traits in crossbred lambs and fast-growing chickens [32,33]. Thus, selecting Beijing You chickens as a maternal parent for hybridization may produce offspring with a low RFI.
Selection for low RFI as an indicator for reduced DFI in purebreds has also been suggested by previous investigations in layer chickens [18,22], broiler chickens [24], and ducks [25]. A low correlation between RFI and DEM was also reported in these studies, indicating that the maintenance of energy expenditure contributed to the variation in RFI more than egg production [34,35]. The correlation between FCR and DEM was highly negative in the purebreds and crossbreds, which confirmed that the improvement in FCR came mainly from the increased egg mass in egg-type chickens [36]. In contrast to Yuan et al. [18], who did not observe any clear relationship between FCR and DFI, a moderately negative correlation between FCR and DFI was found in both laying periods. Nevertheless, purebreds demonstrated greater correlation between the traits than crossbreds. The discrepancy could be explained by the difference in breed combination and the slight differences in the age of the hens. RFI showed a positive correlation between the two laying periods in both the purebreds and the crossbreds, indicating that birds with superior feed efficiency in the early laying period also had superior feed efficiency in the late laying period [18].
The success of the layer chicken industry lies not only in improving the feed efficiency, but also in supplying high-quality eggs with reduced transport losses that attract a premium price. Regarding the purebreds, in another study, a higher eggshell strength was reported for WW at 52 weeks of age than in our study. Regarding the crossbreds, the heterosis of eggshell strength was comparable to that of a Rhode Island Red × White Leghorn reciprocal cross [12], suggesting that crossing could be an effective strategy to improve ESS. RFI had weak phenotypic correlations with the major egg quality traits. This was in accordance with findings reported for brown egg layers [22] and ducks [25], which showed a phenotypic correlation between RFI and egg quality close to zero. Several studies have suggested significant interactions between daily feed intake and egg yolk weight and ratio [37,38]. Given the high correlation between RFI and DFI, it is not a far leap to speculate that RFI is significantly correlated with the egg yolk ratio. It has been reported that FCR is associated with multiple egg quality traits, including the Haugh unit and egg yolk weight [39]. Our study suggested that selecting for FCR could affect eggshell weight and eggshell thickness. Moreover, the significant correlation between RFI in the early laying period and egg shape index, eggshell thickness, and eggshell ratio in the late laying period only occurred in the WY population, and not in its reciprocal cross YW, suggesting that the non-additive inheritance differential affected the relationship between feed efficiency and egg quality [40], which was mainly related to the variation in RFI between the two crossbreds.

5. Conclusions

In conclusion, the RFI of the crossbreds was significantly affected by the maternal genotype. The correlations among feed efficiency and its related traits differed slightly between the reciprocal crossbreds. RFI may be a more appropriate index to improve feed efficiency in layer chickens, and selecting birds with a low RFI can improve feed efficiency without negative consequences on the egg production and quality traits of crossbreds. Our results provide new insights into the relationship between feed efficiency and egg quality and could help in the development of breeding schemes to improve the feed efficiency of layer crossbreeds.

Supplementary Materials

The following supporting information can be downloaded at: https://www.mdpi.com/article/10.3390/agriculture12122171/s1, Figure S1: The correlations among feed efficiency and related traits for all chickens, Figure S2: The phenotypic correlations among feed efficiency and egg quality traits for all chickens, Table S1: Descriptive statistics of egg quality traits at 54 weeks of age, Table S2: Descriptive statistics of egg quality traits at 72 weeks of age.

Author Contributions

J.Z.: data acquisition, data analysis, visualization, writing (original draft). J.Y.: conceptualization, methodology, data acquisition, data analysis, writing (original draft), manuscript review. Y.S.: conceptualization, methodology, data acquisition, data analysis, writing (review). Y.W.: data acquisition and writing (review). A.N.: data acquisition and data analysis. Y.L.: data acquisition and data analysis. H.M.: data acquisition and writing (review). P.W.: data acquisition and writing (review). L.S.: data acquisition and writing (review). P.G.: data acquisition. S.B.: data acquisition. Y.Z.: data acquisition. J.C.: conceptualization, methodology, writing (review), funding acquisition, project administration. All authors have read and agreed to the published version of the manuscript.

Funding

This research was funded by the China Agriculture Research System of MOF and MARA, grant number CARS-40, and the Agricultural Science and Technology Innovation Program, grant number ASTIP-IAS04.

Institutional Review Board Statement

Not applicable.

Data Availability Statement

None of the data or models were deposited in an official repository, but they are available from the corresponding author upon request.

Acknowledgments

The authors would like to thank the staff at the Changping poultry experimental station for their participation in data recording.

Conflicts of Interest

The authors declare no conflict of interest.

References

  1. Srivastava, K.R.; Bollam, S.; Pujarula, V.; Pusuluri, M.; Singh, R.B.; Potupureddi, G.; Gupta, R. Exploitation of Heterosis in Pearl Millet: A Review. Plants 2020, 9, 807. [Google Scholar] [CrossRef] [PubMed]
  2. Mehraj, H.; Kawanabe, T.; Shimizu, M.; Miyaji, N.; Akter, A.; Dennis, E.S.; Fujimoto, R. In Arabidopsis thaliana Heterosis Level Varies among Individuals in an F1 Hybrid Population. Plants 2020, 9, 414. [Google Scholar] [CrossRef] [PubMed] [Green Version]
  3. Wang, Y.; Sun, Y.; Ni, A.; Li, Y.; Yuan, J.; Ma, H.; Wang, P.; Shi, L.; Zong, Y.; Zhao, J.; et al. Research Note: Heterosis for egg production and oviposition pattern in reciprocal crossbreeds of indigenous and elite laying chickens. Poult. Sci. 2022, 24, 102201. [Google Scholar] [CrossRef] [PubMed]
  4. Bain, M.M.; Nys, Y.; Dunn, I.C. Increasing persistency in lay and stabilizing egg quality in longer laying cycles. What are the challenges? Br. Poult. Sci. 2016, 57, 330–387. [Google Scholar] [CrossRef] [PubMed] [Green Version]
  5. Ibrahim, D.; Goshu, G.; Esatu, W.; Cahaner, A. Dual-purpose production of genetically different chicken crossbreeds in Ethiopia. 2. Egg and meat production of the final-crossbreed females and males. Poult. Sci. 2019, 98, 3405–3417. [Google Scholar] [CrossRef] [PubMed]
  6. Singh, M.; Lim, A.J.; Muir, W.I.; Groves, P.J. Comparison of performance and carcass composition of a novel slow-growing crossbred broiler with fast-growing broiler for chicken meat in Australia. Poult. Sci. 2021, 100, 100966. [Google Scholar] [CrossRef]
  7. Mai, C.; Wen, C.; Xu, Z.; Xu, G.; Chen, S.; Zheng, J.; Sun, C.; Yang, N. Genetic basis of negative heterosis for growth traits in chickens revealed by genome-wide gene expression pattern analysis. J. Anim. Sci. Biotechnol. 2021, 12, 52. [Google Scholar] [CrossRef]
  8. Sutherland, D.A.T.; Honaker, C.F.; Dorshorst, B.; Andersson, L.; Siegel, P.B. Asymmetries, heterosis, and phenotypic profiles of red junglefowl, White Plymouth Rocks, and F1 and F2 reciprocal crosses. J. Appl. Genet. 2018, 59, 193–201. [Google Scholar] [CrossRef]
  9. Williams, S.M.; Price, S.E.; Siegel, P.B. Heterosis of growth and reproductive traits in fowl. Poult. Sci. 2002, 81, 1109–1112. [Google Scholar] [CrossRef]
  10. Amuzu-Aweh, E.N.; Bovenhuis, H.; de Koning, D.; Bijma, P. Predicting heterosis for egg production traits in crossbred offspring of individual White Leghorn sires using genome-wide SNP data. Genet. Sel. Evol. 2015, 47, 27. [Google Scholar] [CrossRef]
  11. Soliman, M.A.; Khalil, M.H.; El-Sabrout, K.; Shebl, M.K. Crossing effect for improving egg production traits in chickens involving local and commercial strains. Vet. World 2020, 13, 407–412. [Google Scholar] [CrossRef] [PubMed] [Green Version]
  12. Isa, A.M.; Sun, Y.; Shi, L.; Jiang, L.; Li, Y.; Fan, J.; Wang, P.; Ni, A.; Huang, Z.; Ma, H.; et al. Hybrids generated by crossing elite laying chickens exhibited heterosis for clutch and egg quality traits. Poult. Sci. 2020, 99, 6332–6340. [Google Scholar] [CrossRef] [PubMed]
  13. Saleh, M.; Kokoszyński, D.; Mousa, M.A.; Abuoghaba, A.A. Effect of Date Palm Pollen Supplementation on the Egg Production, Ovarian Follicles Development, Hematological Variables and Hormonal Profile of Laying Hens. Animals 2021, 11, 69. [Google Scholar] [CrossRef] [PubMed]
  14. Yuan, J.; Wang, K.; Yi, G.; Ma, M.; Dou, T.; Sun, C.; Qu, L.J.; Shen, M.; Qu, L.; Yang, N. Genome-wide association studies for feed intake and efficiency in two laying periods of chickens. Genet. Sel. Evol. 2015, 47, 82. [Google Scholar] [CrossRef] [Green Version]
  15. Sell-Kubiak, E.; Wimmers, K.; Reyer, H.; Szwaczkowski, T. Genetic aspects of feed efficiency and reduction of environmental footprint in broilers: A review. J. Appl. Genet. 2017, 58, 87–498. [Google Scholar] [CrossRef] [Green Version]
  16. Aggrey, S.E.; Karnuah, A.B.; Sebastian, B.; Anthony, N.B. Genetic properties of feed efficiency parameters in meat-type chickens. Genet. Sel. Evol. 2010, 42, 25. [Google Scholar] [CrossRef] [Green Version]
  17. Figueiredo, D.M.; Mercadante, M.; Pires, A.V.; Branco, R.H.; Ribeiro, E.G.; Dallago, G.M.; Schorer, M.; Rocha, P.R. The phenotypic relationship between residual intake and gain and other feed efficiency traits in Nellore cattle. Trop. Anim. Health Prod. 2019, 51, 449–456. [Google Scholar] [CrossRef]
  18. Yuan, J.; Dou, T.; Ma, M.; Yi, G.; Chen, S.; Qu, L.; Shen, M.; Qu, L.; Wang, K.; Yang, N. Genetic parameters of feed efficiency traits in laying period of chickens. Poult. Sci. 2015, 94, 1470–1475. [Google Scholar] [CrossRef]
  19. Koch, R.M.; Swiger, L.; Chambers, D.; Gregory, K. Efficiency of feed use in beef cattle. J. Anim. Sci. 1963, 22, 486–494. [Google Scholar] [CrossRef]
  20. Luiting, P.; Urff, E.M. Residual feed consumption in laying hens. 2. Genetic variation and correlations. Poult. Sci. 1991, 70, 1663–1672. [Google Scholar] [CrossRef]
  21. Schulman, N.; Tuiskula-Haavisto, M.; Siitonen, L.; Mäntysaari, E. Genetic variation of residual feed consumption in a selected Finnish egg-layer population. Poult. Sci. 1994, 73, 1479–1484. [Google Scholar] [CrossRef] [PubMed]
  22. Wolc, A.; Arango, J.; Jankowski, T.; Settar, P.; Fulton, J.E.; O’Sullivan, N.P.; Fernando, R.; Garrick, D.J.; Dekkers, J.C.M. Pedigree and genomic analyses of feed consumption and residual feed intake in laying hens. Poult. Sci. 2013, 92, 2270–2275. [Google Scholar] [CrossRef] [PubMed]
  23. Varkoohi, S.; Pakdel, A.; Babak, M.M.S.; Javaremi, A.N.; Kause, A.; Zaghari, M. Genetic parameters for feed utilization traits in Japanese quail. Poult. Sci. 2011, 90, 42–47. [Google Scholar] [CrossRef] [PubMed]
  24. Wen, C.; Yan, W.; Zheng, J.; Ji, C.; Zhang, D.; Sun, C.; Yang, N. Feed efficiency measures and their relationships with production and meat quality traits in slower growing broilers. Poult. Sci. 2018, 97, 2356–2364. [Google Scholar] [CrossRef]
  25. Zeng, T.; Zhang, H.; Liu, J.; Chen, L.; Tian, Y.; Shen, J.; Lu, L. Genetic parameters of feed efficiency traits and their relationships with egg quality traits in laying period of ducks. Poult. Sci. 2018, 97, 758–763. [Google Scholar] [CrossRef]
  26. Gao, J.; Xu, W.; Zeng, T.; Tian, Y.; Wu, C.; Liu, S.; Zhao, Y.; Zhou, S.; Lin, X.; Cao, H.; et al. Genome-Wide Association Study of Egg-Laying Traits and Egg Quality in LingKun Chickens. Front. Vet. Sci. 2022, 20, 877739. [Google Scholar] [CrossRef]
  27. Geng, A.L.; Liu, H.G.; Zhang, Y.; Zhang, J.; Wang, H.H.; Chu, Q.; Yan, Z.X. Effects of indoor stocking density on performance, egg quality, and welfare status of a native chicken during 22 to 38 weeks. Poult. Sci. 2020, 99, 163–171. [Google Scholar] [CrossRef]
  28. Mai, C.; Wen, C.; Sun, C.; Xu, Z.; Chen, S.; Yang, N. Implications of Gene Inheritance Patterns on the Heterosis of Abdominal Fat Deposition in Chickens. Genes 2019, 10, 824. [Google Scholar] [CrossRef]
  29. Abdalla, E.A.; Makanjuola, B.O.; van Staaveren, N.; Wood, B.J.; Baes, C.F. Accuracy of genomic selection for reducing susceptibility to pendulous crop in turkey (Meleagris gallopavo). Poult. Sci. 2022, 101, 101601. [Google Scholar] [CrossRef]
  30. Klein, V.D.S.A.; Berghof, T.V.L.; Arts, J.A.J.; Parmentier, H.K.; Poel, V.D.J.J.; Bovenhuis, H. Genetic relations between natural antibodies binding keyhole limpet hemocyanin and production traits in a purebred layer chicken line. Poult. Sci. 2015, 94, 875–882. [Google Scholar] [CrossRef]
  31. Moore, M.P.; Whiteman, H.H.; Martin, R.A. A mother’s legacy: The strength of maternal effects in animal populations. Ecol. Lett. 2019, 22, 1620–1628. [Google Scholar] [CrossRef] [PubMed]
  32. Berger, Q.; Guettier, E.; Bernard, J.; Ganier, P.; Chahnamian, M.; le Bihan-Duval, E.; Mignon-Grasteau, S. Profiles of genetic parameters of body weight and feed efficiency in two divergent broiler lines for meat ultimate pH. BMC Genom. Data 2022, 23, 18. [Google Scholar] [CrossRef] [PubMed]
  33. Vargas, J.N.; Notter, D.R.; Taylor, J.B.; Brown, D.J.; Mousel, M.R.; Lewis, R.M. Model definition for genetic evaluation of purebred and crossbred lambs including heterosis. J. Anim. Sci. 2022, 100, 188. [Google Scholar] [CrossRef] [PubMed]
  34. Herd, R.M.; Arthur, P.F. Physiological basis for residual feed intake. J. Anim. Sci. 2009, 87, 64–71. [Google Scholar] [CrossRef] [PubMed]
  35. Luiting, P. Genetic variation of energy partitioning in laying hens: Causes of variation in residual feed consumption. World Poult. Sci. J. 1990, 46, 133–152. [Google Scholar] [CrossRef]
  36. Flock, D.K. Genetic-economic aspects of feed efficiency in laying hens. World Poult. Sci. J. 1998, 54, 225–239. [Google Scholar] [CrossRef]
  37. Hurnik, J.F.; Summers, J.D.; Reinhart, B.S.; Swierczewska, E.M. Effect of Age on the Performance of Laying Hens during the First Year of Production. Poult. Sci. 1977, 56, 222–230. [Google Scholar] [CrossRef]
  38. Li, F.; Xu, L.M.; Shan, A.S.; Hu, J.W.; Zhang, Y.Y.; Li, Y.H. Effect of daily feed intake in laying period on laying performance, egg quality and egg composition of genetically fat and lean lines of chickens. Br. Poult. Sci. 2011, 52, 163–168. [Google Scholar] [CrossRef]
  39. Anene, D.O.; Akter, Y.; Thomson, P.C.; Groves, P.; Liu, S.; Shea, C.J.O. Hens That Exhibit Poorer Feed Efficiency Produce Eggs with Lower Albumen Quality and Are Prone to Being Overweight. Animals 2021, 11, 2986. [Google Scholar] [CrossRef]
  40. Gu, H.; Qi, X.; Jia, Y.; Zhang, Z.; Nie, C.; Li, X.; Li, J.; Jiang, Z.; Wang, Q.; Qu, L. Inheritance patterns of the transcriptome in hybrid chickens and their parents revealed by expression analysis. Sci. Rep. 2019, 9, 5750. [Google Scholar] [CrossRef]
Figure 1. Pearson correlations among feed efficiency and related traits for White Leghorn (A), Beijing You (B), and their reciprocal crosses WY (C) and YW (D). Correlations that reached the significance threshold of p < 0.01 are highlighted in the squares of the heatmap. RFI1, FCR1, DFI1, and DEM1 represent residual feed intake, feed conversion ratio, daily feed intake, and daily egg mass from 43 to 46 weeks, respectively. RFI2, FCR2, DFI2, and DEM2 represent residual feed intake, feed conversion ratio, daily feed intake, and daily egg mass from 69 to 72 weeks, respectively. The orange and turquoise shows positive and negative correlation, respectively, and the darker the color is, the more correlated between traits.
Agriculture 12 02171 g001
Table 1. Descriptive statistics for feed intake and efficiency.
Trait 1Group 2NMean 3SDCV (%)MaximumMinimumHeterosis (%) 4
DFI1 (g/d)WW198100.41 a11.7111.66133.8762.17-
YY24590.84 c12.0113.22119.1259.79-
YW238103.27 a14.9914.52143.7859.797.99
WY22395.00 b12.2512.89128.6952.13−0.65
FCR1 (g/g)WW1982.705.15190.7150.021.70-
YY2453.325.97180.1858.731.75-
YW2382.945.11173.6757.141.72−1.99
WY2232.090.6330.518.121.70−30.98
RFI1 (g/d)WW1981.87 a9.51508.5634.79−36.97-
YY245−2.28 b8.98−393.8627.21−32.57-
YW2383.70 a12.39334.8648.39−39.04ns
WY223−3.10 b10.45−337.1027.92−46.87ns
DFI2 (g/d)WW181102.37 b14.8314.49138.4148.13-
YY20994.80 c15.4416.28134.9328.16-
YW256110.41 a16.5014.94154.5060.1912.28
WY214104.16 b15.8615.22145.2849.105.97
FCR2 (g/g)WW1814.097.25177.3155.631.71-
YY2093.995.30132.6444.131.79-
YW2563.5412.27345.9247.571.72−4.28
WY2144.007.11177.8567.331.71−0.99
RFI2 (g/d)WW181−0.22 ab10.68−4938.9635.86−36.38-
YY209−2.91 b12.19−418.4925.97−55.74-
YW2562.25 a11.50511.0039.75−40.59ns
WY2140.34 ab11.153325.8538.56−40.40ns
1 DFI1, FCR1, and RFI1 represent daily feed intake, feed conversion ratio, and residual feed intake from 43 to 46 weeks, respectively; DFI2, FCR2, and RFI2 represent daily feed intake, feed conversion ratio, and residual feed intake from 69 to 72 weeks, respectively. 2 WW = White Leghorn, YY = Beijing You, WY = offspring of White Leghorn sires crossed to Beijing You dams, YW = offspring of Beijing You sires crossed to White Leghorn dams. 3 Values within a column with different superscripts differ significantly at p < 0.01. 4 The ns symbol denotes that heterosis could not be calculated properly.
Table 2. Descriptive statistics of feed-efficiency-relevant traits.
Traits 1Group 2NMean 3SDCV (%)MaximumMinimumHeterosis (%) 4
MBW1, gWW1981656.50 c206.2412.452478.801077.50-
YY2451826.15 b220.4312.072595.751277.05-
YW2381923.33 a273.5014.222821.251286.2510.45
WY2231812.30 b202.0611.152476.101292.854.08
DEM1, g/dWW19851.87 a11.9923.1265.731.48-
YY24536.81 c7.9721.6560.091.32-
YW23845.32 b9.6421.2662.221.812.21
WY22347.23 b7.5315.9560.409.356.52
BWG1, g/dWW198−1.35 b2.06−152.695.08−11.68-
YY245−0.07 a4.65−6776.8932.68−35.76-
YW238−1.59 bc3.10−195.1619.94−12.27ns
WY223−2.54 c3.55−139.865.10−18.01ns
MBW2, gWW1811724.88 c225.8513.092459.301143.45-
YY2091964.11 b251.3912.802810.801309.85-
YW2562055.24 a296.3014.422910.751388.7511.54
WY2141933.13 b236.0512.212759.551252.454.72
DEM2, g/dWW18144.55 a15.9235.7463.001.81-
YY20932.67 b9.8430.1253.621.53-
YW25644.32 a11.4125.7463.490.4314.80
WY21442.34 a12.7230.0457.441.399.38
BWG2, g/dWW1810.133.242492.3111.66−10.45-
YY209−0.203.29−1645.009.81−16.76-
YW256−0.363.12−866.6711.98−14.50ns
WY214−0.693.62−524.6411.63−17.99ns
AFE, dWW216156.49 c7.314.67178139-
YY290177.84 a9.875.55227161-
YW307166.07 b8.335.03203141−0.66
WY242165.36 b10.236.20193139−1.08
1 MBW1, DEM1, and BWG1 represent mean body weight, daily egg mass, and body weight gain from 43 to 46 weeks, respectively; MBW2, DEM2, and BWG2 represent mean body weight, daily egg mass, and body weight gain from 69 to 72 weeks, respectively. 2 WW = White Leghorn, YY = Beijing You, WY = offspring of White Leghorn sires crossed to Beijing You dams, YW = offspring of Beijing You sires crossed to White Leghorn dams. 3 Values within a column with different superscripts differ significantly at p < 0.01. 4 The ns symbol denotes that heterosis could not be calculated properly.
Table 3. The phenotypic correlations among feed efficiency and egg quality traits for purebreds 1.
Traits 2ESI1ESS1EST1ESW1ESR1HU1EYW1EYR1ESI2ESS2EST2ESW2ESR2HU2EYW2EYR2AFE
WW
RFI1−0.050.110.130.050.15−0.13−0.040.070.03−0.15−0.004−0.090.11−0.06−0.100.12−0.09
(0.5)(0.1)(0.06)(0.5)(0.03)(0.07)(0.6)(0.3)(0.7)(0.03)(1)(0.2)(0.1)(0.4)(0.2)(0.09)(0.30)
FCR10.02−0.09−0.3−0.33−0.150.01−0.100.170.0016−0.170.11−0.210.19−0.13−0.210.180.04
(0.8)(0.2)(1 × 10⁻⁵)(1 × 10⁻⁶)(0.03)(0.9)(0.2)(0.01)(1)(0.01)(0.1)(0.002)(0.005)(0.06)(0.003)(0.008)(0.65)
RFI20.010.01−0.08−0.06−0.03−0.110.100.17−0.060.04−0.01−0.15−0.06−0.110.10.27−0.13
(0.9)(0.9)(0.2)(0.4)(0.7)(0.1)(0.2)(0.01)(0.4)(0.5)(0.9)(0.03)(0.4)(0.1)(0.1)(6 × 10⁻⁵)(0.13)
FCR2−0.17−0.06−0.19−0.16−0.190.180.040.060.05−0.07−0.12−0.23−0.16−0.1−0.060.13−0.001
(0.01)(0.4)(0.007)(0.02)(0.005)(0.01)(0.6)(0.4)(0.5)(0.3)(0.08)(6 × 10⁻⁴)(0.02)(0.1)(0.4)(0.06)(0.99)
YY
RFI1−0.12−0.070.090.06−0.020.040.090.004−0.190.010.010.150.100.120.020.020.05
(0.06)(0.3)(0.2)(0.3)(0.8)(0.5)(0.1)(0.9)(0.001)(0.9)(0.9)(0.01)(0.1)(0.04)(0.7)(0.7)(0.47)
FCR10.03−0.002−0.01−0.020.01−0.060.060.12−0.03−0.1−0.19−0.16−0.1−0.0010.010.260.12
(0.6)(1)(0.8)(0.8)(0.9)(0.3)(0.3)(0.04)(0.6)(0.09)(0.002)(0.007)(0.1)(1)(0.9)(2 × 10 −5)(0.10)
RFI2−0.030.02−0.01−0.05−0.04−0.070.150.2−0.01−0.05−0.01−0.04−0.04−0.030.110.110.21
(0.6)(0.7)(0.9)(0.4)(0.5)(0.3)(0.01)(0.001)(0.9)(0.5)(0.8)(0.6)(0.5)(0.6)(0.07)(0.08)(0.006)
FCR20.05−0.04−0.12−0.15−0.06−0.01−0.110.002−0.020.001−0.05−0.14−0.040.06−0.15−0.02−0.01
(0.4)(0.5)(0.05)(0.02)(0.3)(0.9)(0.08)(1)(0.7)(1)(0.4)(0.02)(0.5)(0.3)(0.02)(0.7)(0.92)
1 The correlation coefficients and p values (in brackets) are shown within the cells (bold font, p < 0.01); 2 RFI1 and FCR1 represent residual feed intake and feed conversion ratio from 43 to 46 weeks, respectively. RFI2 and FCR2 represent residual feed intake and feed conversion ratio from 69 to 72 weeks, respectively. ESI1, ESS1, EST1, ESW1, ESR1, HU1, EYW1, and EYR1 represent eggshell index, eggshell strength, eggshell thickness, eggshell weight, eggshell ratio, Haugh unit, egg yolk weight, and egg yolk ratio at 54 weeks of age, respectively. ESI2, ESS2, EST2, ESW2, ESR2, HU2, EYW2, and EYR2 represent eggshell index, eggshell strength, eggshell thickness, eggshell weight, eggshell ratio, Haugh unit, egg yolk weight, and egg yolk ratio at 72 weeks of age, respectively. AFE denotes age at first egg.
Table 4. The phenotypic correlations among feed efficiency and egg quality traits for crossbreds 1.
Traits 2ESI1ESS1EST1ESW1ESR1HU1EYW1EYR1ESI2ESS2EST2ESW2ESR2HU2EYW2EYR2AFE
WY
RFI10.14−0.13−0.13−0.12−0.11−0.110.060.090.17−0.090.18−0.140.18−0.023−0.0120.007−0.002
(−0.13)(0.04)(0.04)(0.07)(0.08)(0.08)(0.4)(0.2)(0.007)(0.1)(0.005)(0.03)(0.005)(0.7)(0.9)(0.9)(0.99)
FCR10.13−0.06−0.04−0.09−0.04−0.080.060.140.20.170.290.210.22−0.070.001−0.0150.09
(0.04)(0.3)(0.5)(0.2)(0.5)(0.2)(0.4)(0.03)(0.001)(0.006)(4 × 10⁻⁶)(8 × 10⁻⁴)(6 × 10⁻⁴)(0.3)(1)(0.8)(0.37)
RFI20.05−0.15−0.13−0.140.18−0.040.090.07−0.03−0.04−0.030.007−0.090.0140.044−0.05−0.14
(0.4)(0.02)(0.04)(0.02)(0.004)(0.5)(0.2)(0.3)(0.7)(0.5)(0.6)(0.9)(0.1)(0.8)(0.5)(0.4)(0.18)
FCR20.15−0.12−0.04−0.08−0.070.006−0.0140.0260.037−0.0710.190.19−0.160.15−0.040.120.01
(0.01)(0.07)(0.5)(0.2)(0.2)(0.3)(0.8)(0.7)(0.6)(0.3)(0.002)(0.002)(0.01)(0.01)(0.5)(0.06)(0.92)
YW
RFI1−0.020.080.03−0.010.018−0.07−0.0070.05−0.11−0.015−0.030.050.07−0.010.0110.05−0.20
(0.8)(0.2)(0.6)(0.9)(0.8)(0.3)(0.9)(0.4)(0.07)(0.8)(0.6)(0.4)(0.3)(0.8)(0.8)(0.4)(0.11)
FCR10.020.03−0.011−0.0090.04−0.006−0.050.00060.0420.0550.070.110.150.11−0.051−0.021−0.15
(0.7)(0.6)(0.9)(0.9)(0.5)(0.9)(0.4)(1)(0.5)(0.3)(0.2)(0.06)(0.008)(0.06)(0.4)(0.7)(0.23)
RFI2−0.0420.073−0.065−0.063−0.13−0.097−0.028−0.004−0.041−0.08−0.08−0.066−0.120.020.070.06−0.08
(0.5)(0.2)(0.3)(0.3)(0.03)(0.09)(0.6)(0.9)(0.5)(0.2)(0.2)(0.3)(0.03)(0.7)(0.2)(0.3)(0.46)
FCR20.080.06−0.04−0.040.006−0.1−0.020.050.05−0.07−0.020.050.070.12−0.03−0.03−0.002
(0.2)(0.3)(0.5)(0.5)(0.9)(0.1)(0.7)(0.4)(0.4)(0.3)(0.7)(0.3)(0.2)(0.03)(0.6)(0.6)(0.98)
1 The correlation coefficients and p values (in brackets) are shown within the cells (bold font, p < 0.01); 2 RFI1 and FCR1 represent residual feed intake and feed conversion ratio from 43 to 46 weeks, respectively. RFI2 and FCR2 represent residual feed intake and feed conversion ratio from 69 to 72 weeks, respectively. ESI1, ESS1, EST1, ESW1, ESR1, HU1, EYW1, and EYR1 represent eggshell index, eggshell strength, eggshell thickness, eggshell weight, eggshell ratio, Haugh unit, egg yolk weight, and egg yolk ratio at 54 weeks of age, respectively. ESI2, ESS2, EST2, ESW2, ESR2, HU2, EYW2, and EYR2 represent eggshell index, eggshell strength, eggshell thickness, eggshell weight, eggshell ratio, Haugh unit, egg yolk weight, and egg yolk ratio at 72 weeks of age, respectively. AFE denotes age at first egg.
Publisher’s Note: MDPI stays neutral with regard to jurisdictional claims in published maps and institutional affiliations.

