Article

Effect of Nitrogen Fertilization of Apple Orchard on Soil Mineral Nitrogen Content, Yielding of the Apple Trees and Nutritional Status of Leaves and Fruits

by
Wojciech Kowalczyk
*,
Dariusz Wrona
and
Sebastian Przybyłko
Department of Pomology and Horticulture Economics, Institute of Horticultural Sciences SGGW, Nowoursynowska 159 Str., 02-787 Warsaw, Poland
*
Author to whom correspondence should be addressed.
Agriculture 2022, 12(12), 2169; https://doi.org/10.3390/agriculture12122169
Submission received: 14 November 2022 / Revised: 7 December 2022 / Accepted: 12 December 2022 / Published: 17 December 2022
(This article belongs to the Special Issue The Impact of Environmental Factors on Fruit Quality)

Abstract

:
Contemporary trends in horticulture are aimed at limiting the use of mineral fertilizers to the necessary minimum, which is to guarantee adequate profitability of production while maintaining high-quality fruit and at the same time preventing environmental pollution. Thus, in the presented study, we investigate the effect of diversified nitrogen fertilization on soil mineral nitrogen content during vegetation season, yielding of apple trees and the nutritional status of apple leaves and fruits. We compared several ammonium nitrate treatments as well as growth without fertilization as a control. The results of our study show that under the conditions of humus-rich soils and with appropriate agrotechnics, N mineralization from the organic matter available in the soil may completely cover demand of apple trees for this component. Achieved outcomes clearly revealed that nitrogen fertilization in the amount of 100 kg N · ha−1 on the entire soil surface carries a real risk of groundwater contamination, and the same nitrogen dose applied within the grassland does not bring any production effects, therefore it should be considered as unjustified. Obtained results revealed that in a rationally managed, fully fruiting apple orchard, the annual dose of N should not exceed 50 kg N∙ha−1. This dosage of N should fully secure the nutritional needs of apple trees, guaranteeing their high yield and complete safety for the environment. What is important is, nitrogen fertilization strongly affects macroelemental composition of apple leaves and fruits.

1. Introduction

In recent decades, conventional horticulture has been consistently heading towards the maximum intensification of production, mainly by ongoing growth of the productivity caused by increasing use of fertilizers, pesticides and water, with a indisputably negative impact on the environment and produce quality [1]. Unfortunately, despite the far-reaching intensification of fruit production methods, the constant changes in the global apple market and the evolution of consumers preferences caused, more and more orchardmen have increasing problems with obtaining satisfactory income. Overproduction of apples induces decline in the profitability of conventional production and increasing problems with its sale. Contemporary consumer requires delivery of apples that are not only visually attractive and with high sensory values but also rich in valuable nutrients and health-promoting substances (vitamins and minerals, phytochemicals, antioxidants, dietary fiber, etc.), produced at the most rational use of natural resources and minimized negative impact on the environment. What is important is, introduction of new technologies of organic apple production, enabling following the needs of consumers, requires perfect knowledge of the functioning of complex agrocenoses, maintaining their high diversity and enabling the obtaining of a high-quality product with strong respect for the natural resources of the planet. These requirements cause an increased interest in the search for alternative methods of preserving and maintaining the natural fertility of the soil, stimulating and/or enhancing natural processes [2,3,4,5].
Proper mineral nutrition is one of the most important agro-technical practices in modern horticulture; it determines the health, resistance, yield, quality of fruit and their storage capacity. Nitrogen (N) is one of the most important (next to carbon, oxygen and hydrogen) minerals necessary for the proper growth, development and yielding of plants [6,7,8,9]. In the plant organism, nitrogen is a key element of nucleotides, energy-carrying molecule, such as ATP and GTP, carriers of electrons and hydrogen cations (NADH, NADPH, FADH2) and acyl residues (coenzyme A). N is also an important element of such important plant compounds in the cell as chlorophyll, cytochromes, cytokinins, porphyrins and a number of vitamins [6,7]. Thus, proper N supply of plants is crucial for proper cell division, synthesis of cell walls, and cytoskeleton and in results, growth of young tissues [10]. N also has a huge impact on the processes of assimilation and distribution of all macro- and microelements necessary for plant growth and yielding [6,7,8,9,10,11,12]. Additionally, important secondary plant metabolites, such as alkaloids or glycosides, also contain a large amount of N. Nitrogen also enhances the metabolic processes that influence the physicochemical environment at the soil–root interface. Moreover, this nutrition element is therefore an essential part of almost all changes taking place in plant organisms, as most of the N in the plant is involved in the construction of the photosynthetic apparatus. Thus, the high N content in the leaves has a positive effect on photosynthesis, which is related to the high share of this element in enzymes involved in photosynthesis, photosynthetic pigments and its direct impact on the size, number and composition of chloroplasts. N deficiency causes inhibition of protein and chlorophyll synthesis, leading to the formation of low-yield chloroplasts, which causes chronic plant malnutrition and a drastic decrease in yields, as well as a marked increase in susceptibility to various pathogens. For these reasons, N is the element required by plants in the greatest amount. The availability of N is one of the most important factors limiting the growth and development of plants and thus their yield and quality of the obtained crops [7,8,9,10,11,12].
On the other hand, due to its high costs, proper N fertilization is also one of the largest financial burdens in plant production. The use of excessive doses of N that has not been taken up by plants or stabilized in the root zone causes obvious financial losses, negative changes in the soil structure (by stimulating acidification, disturbing the ionic balance between individual macro- and microelements, limiting microbiological activity, introducing harmful substances/elements and induction of salinity) and environmental pollution. N leached from the soil by precipitation reduces the quality of groundwater and surface waters, and denitrified leads to atmospheric pollution [13,14,15,16,17,18,19]. Additionally, several studies clearly revealed that the use of synthetic nitrogen fertilizers reduces soil organic matter (SOM) by increasing mineralization [20,21], with important negative effects on soil fertility. Thus, the key to effective N fertilization and reduction of environmental pollution is to establish the relationship between the abundance of this component in the soil, the degree of plant nutrition, and the needs of fertilization.
What is important is, contemporary views on nitrogen fertilization of apple orchards and its impact on fruiting are not consistent. Most of the field experiments concerning N fertilization of apple trees in conditions of high soil fertility prove the lack of any significant effects of this type of treatment [22,23,24]; additionally, the doses, dates and methods of introducing N fertilizers to the soil are also widely discussed. Contemporary trends in horticulture are aimed at limiting the use of mineral fertilizers to the necessary minimum, which is to guarantee adequate profitability of production while maintaining high-quality fruits and at the same time preventing environmental pollution. In this situation, it is necessary to develop a rational method of N fertilization of apple orchards, allowing minimization of the use of fertilizers (reduction of costs) and reduction of the risk of contamination of the soil with an excess of nitrates, while achieving optimal tree growth, yield and fruits quality. Regarding these facts, a number of research is being carried out on sustainable N fertilization, which requires a detailed understanding of the mechanisms shaping the natural abundance of this component in the soil.
Facing the above presented contemporary challenges of fruit farming and necessity of balanced N fertilization, the current paper presents a comprehensive analysis of the effect of multi-year, differentiated N fertilization of apple trees on their yielding, nutritional status of apple trees and soil nitrogen content, with particular emphasis on the natural abundance of this component in the soil.

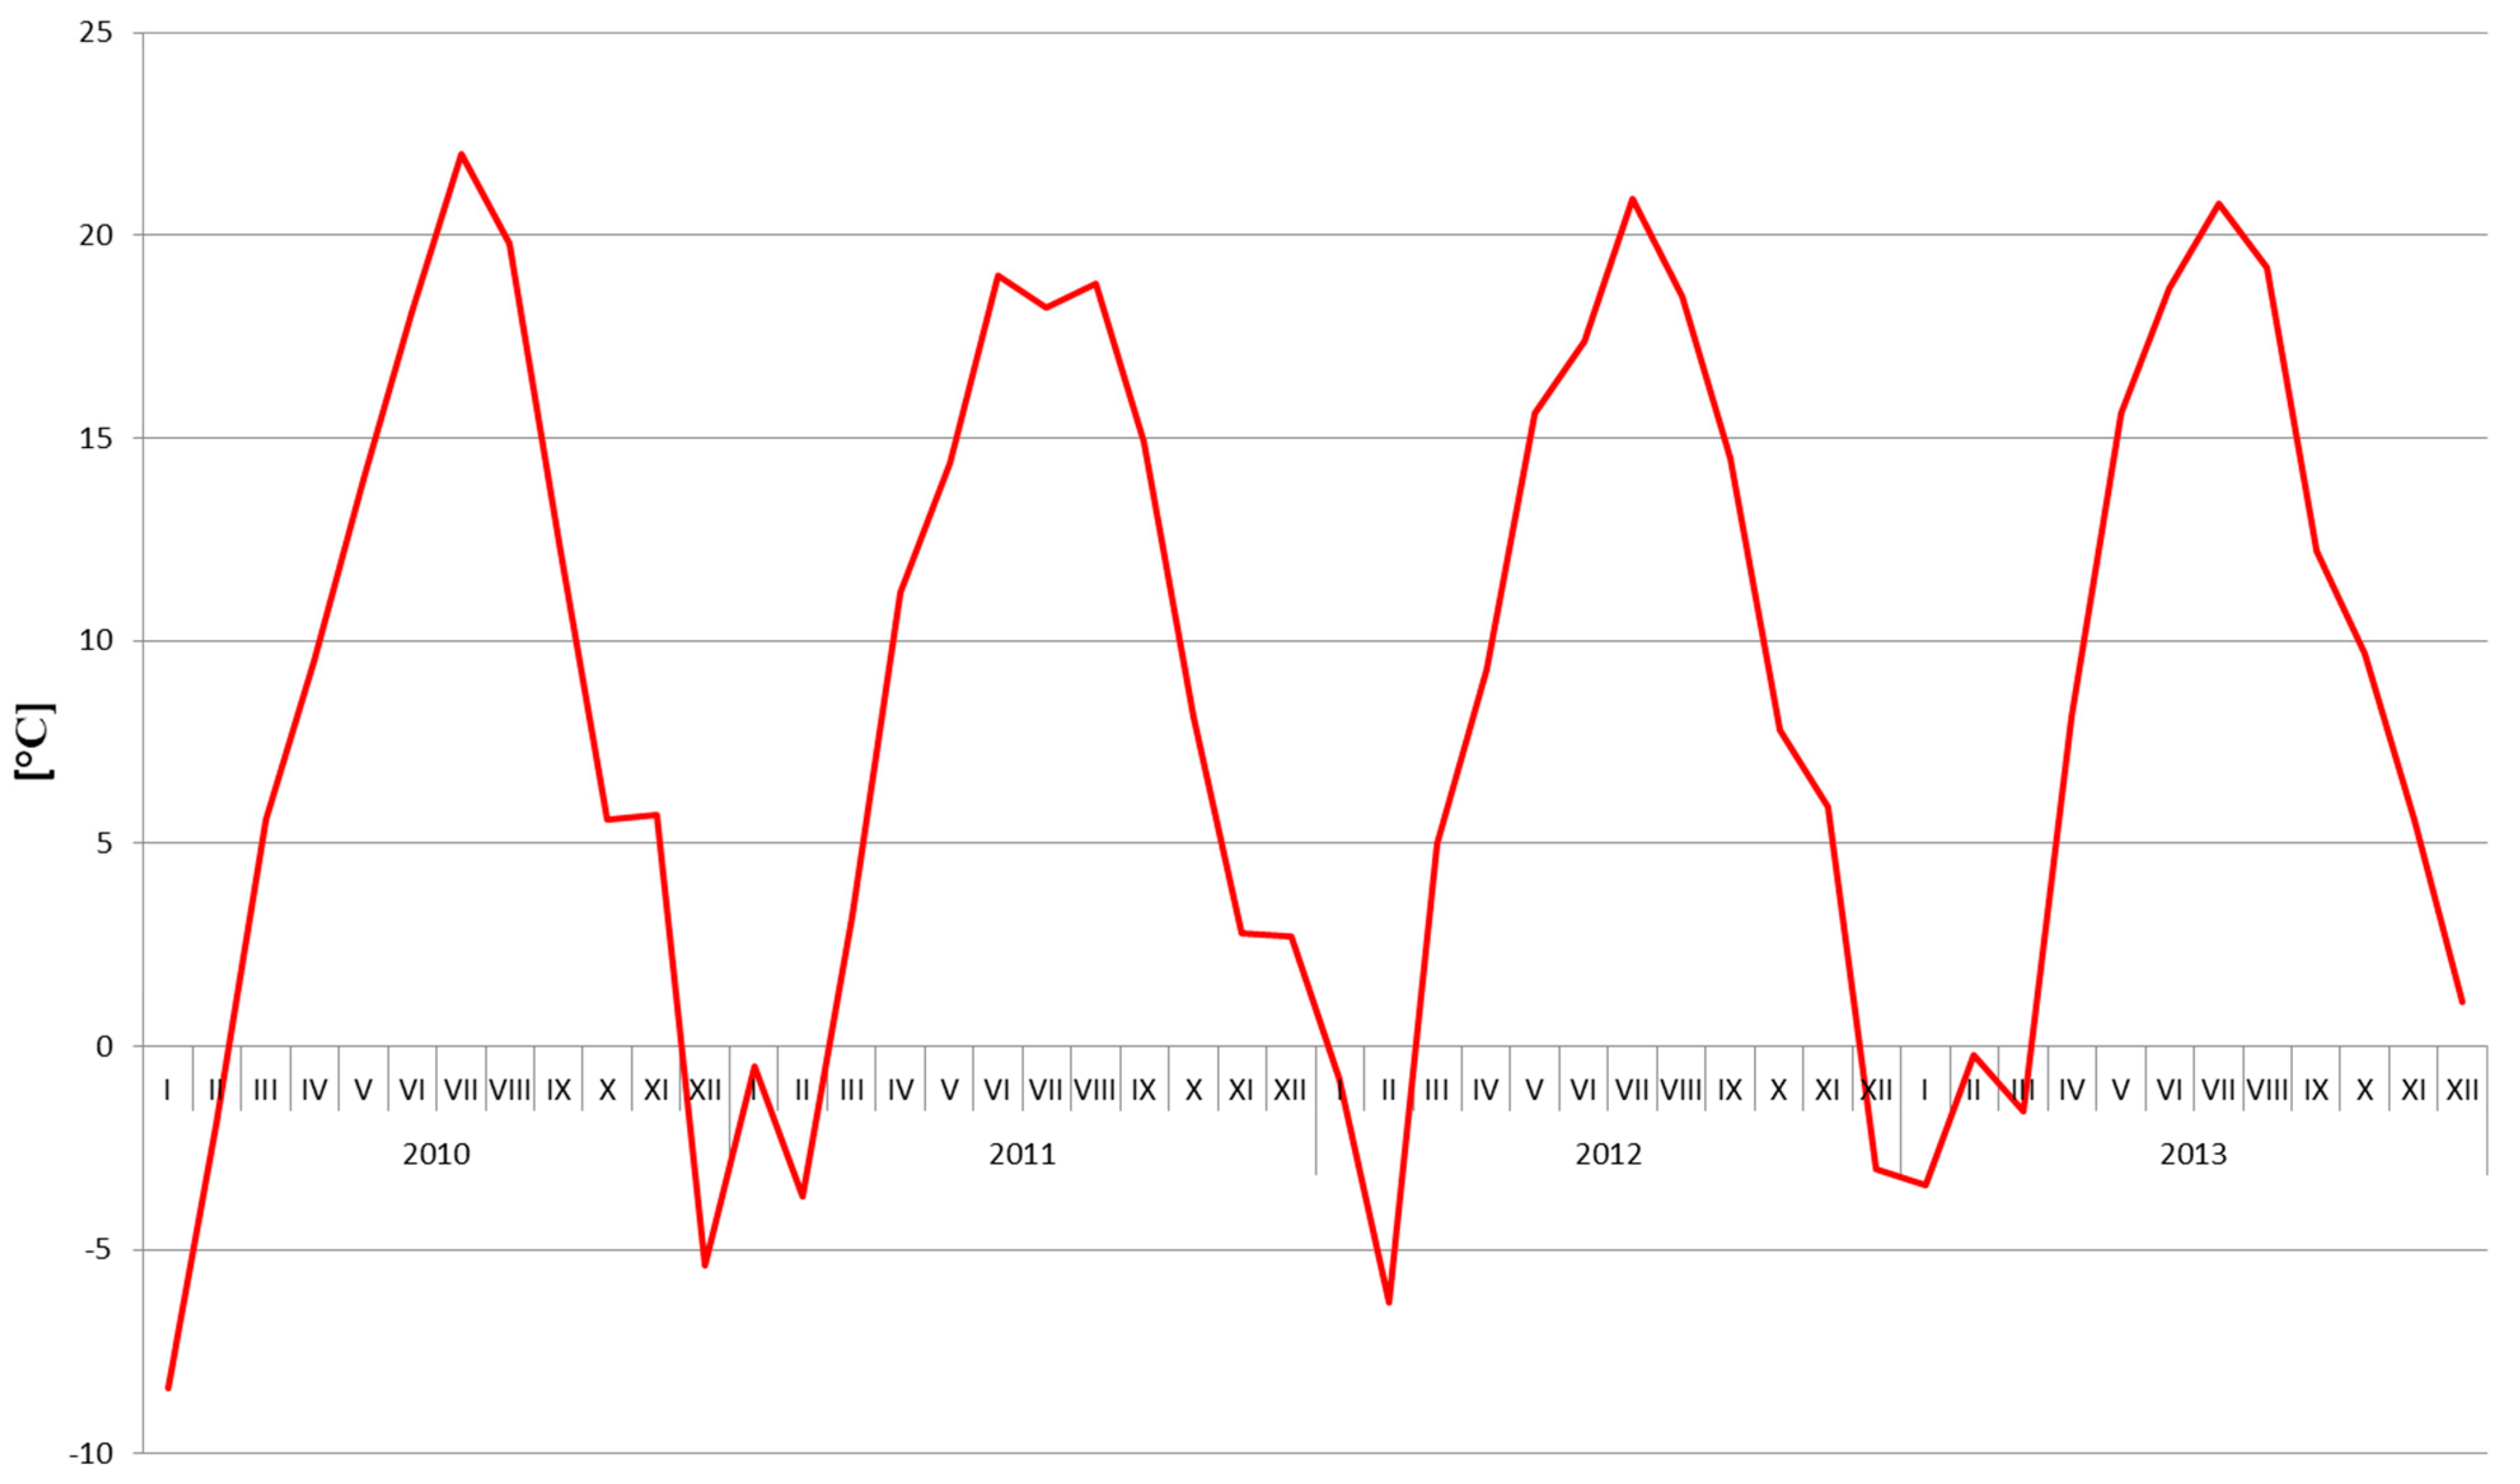
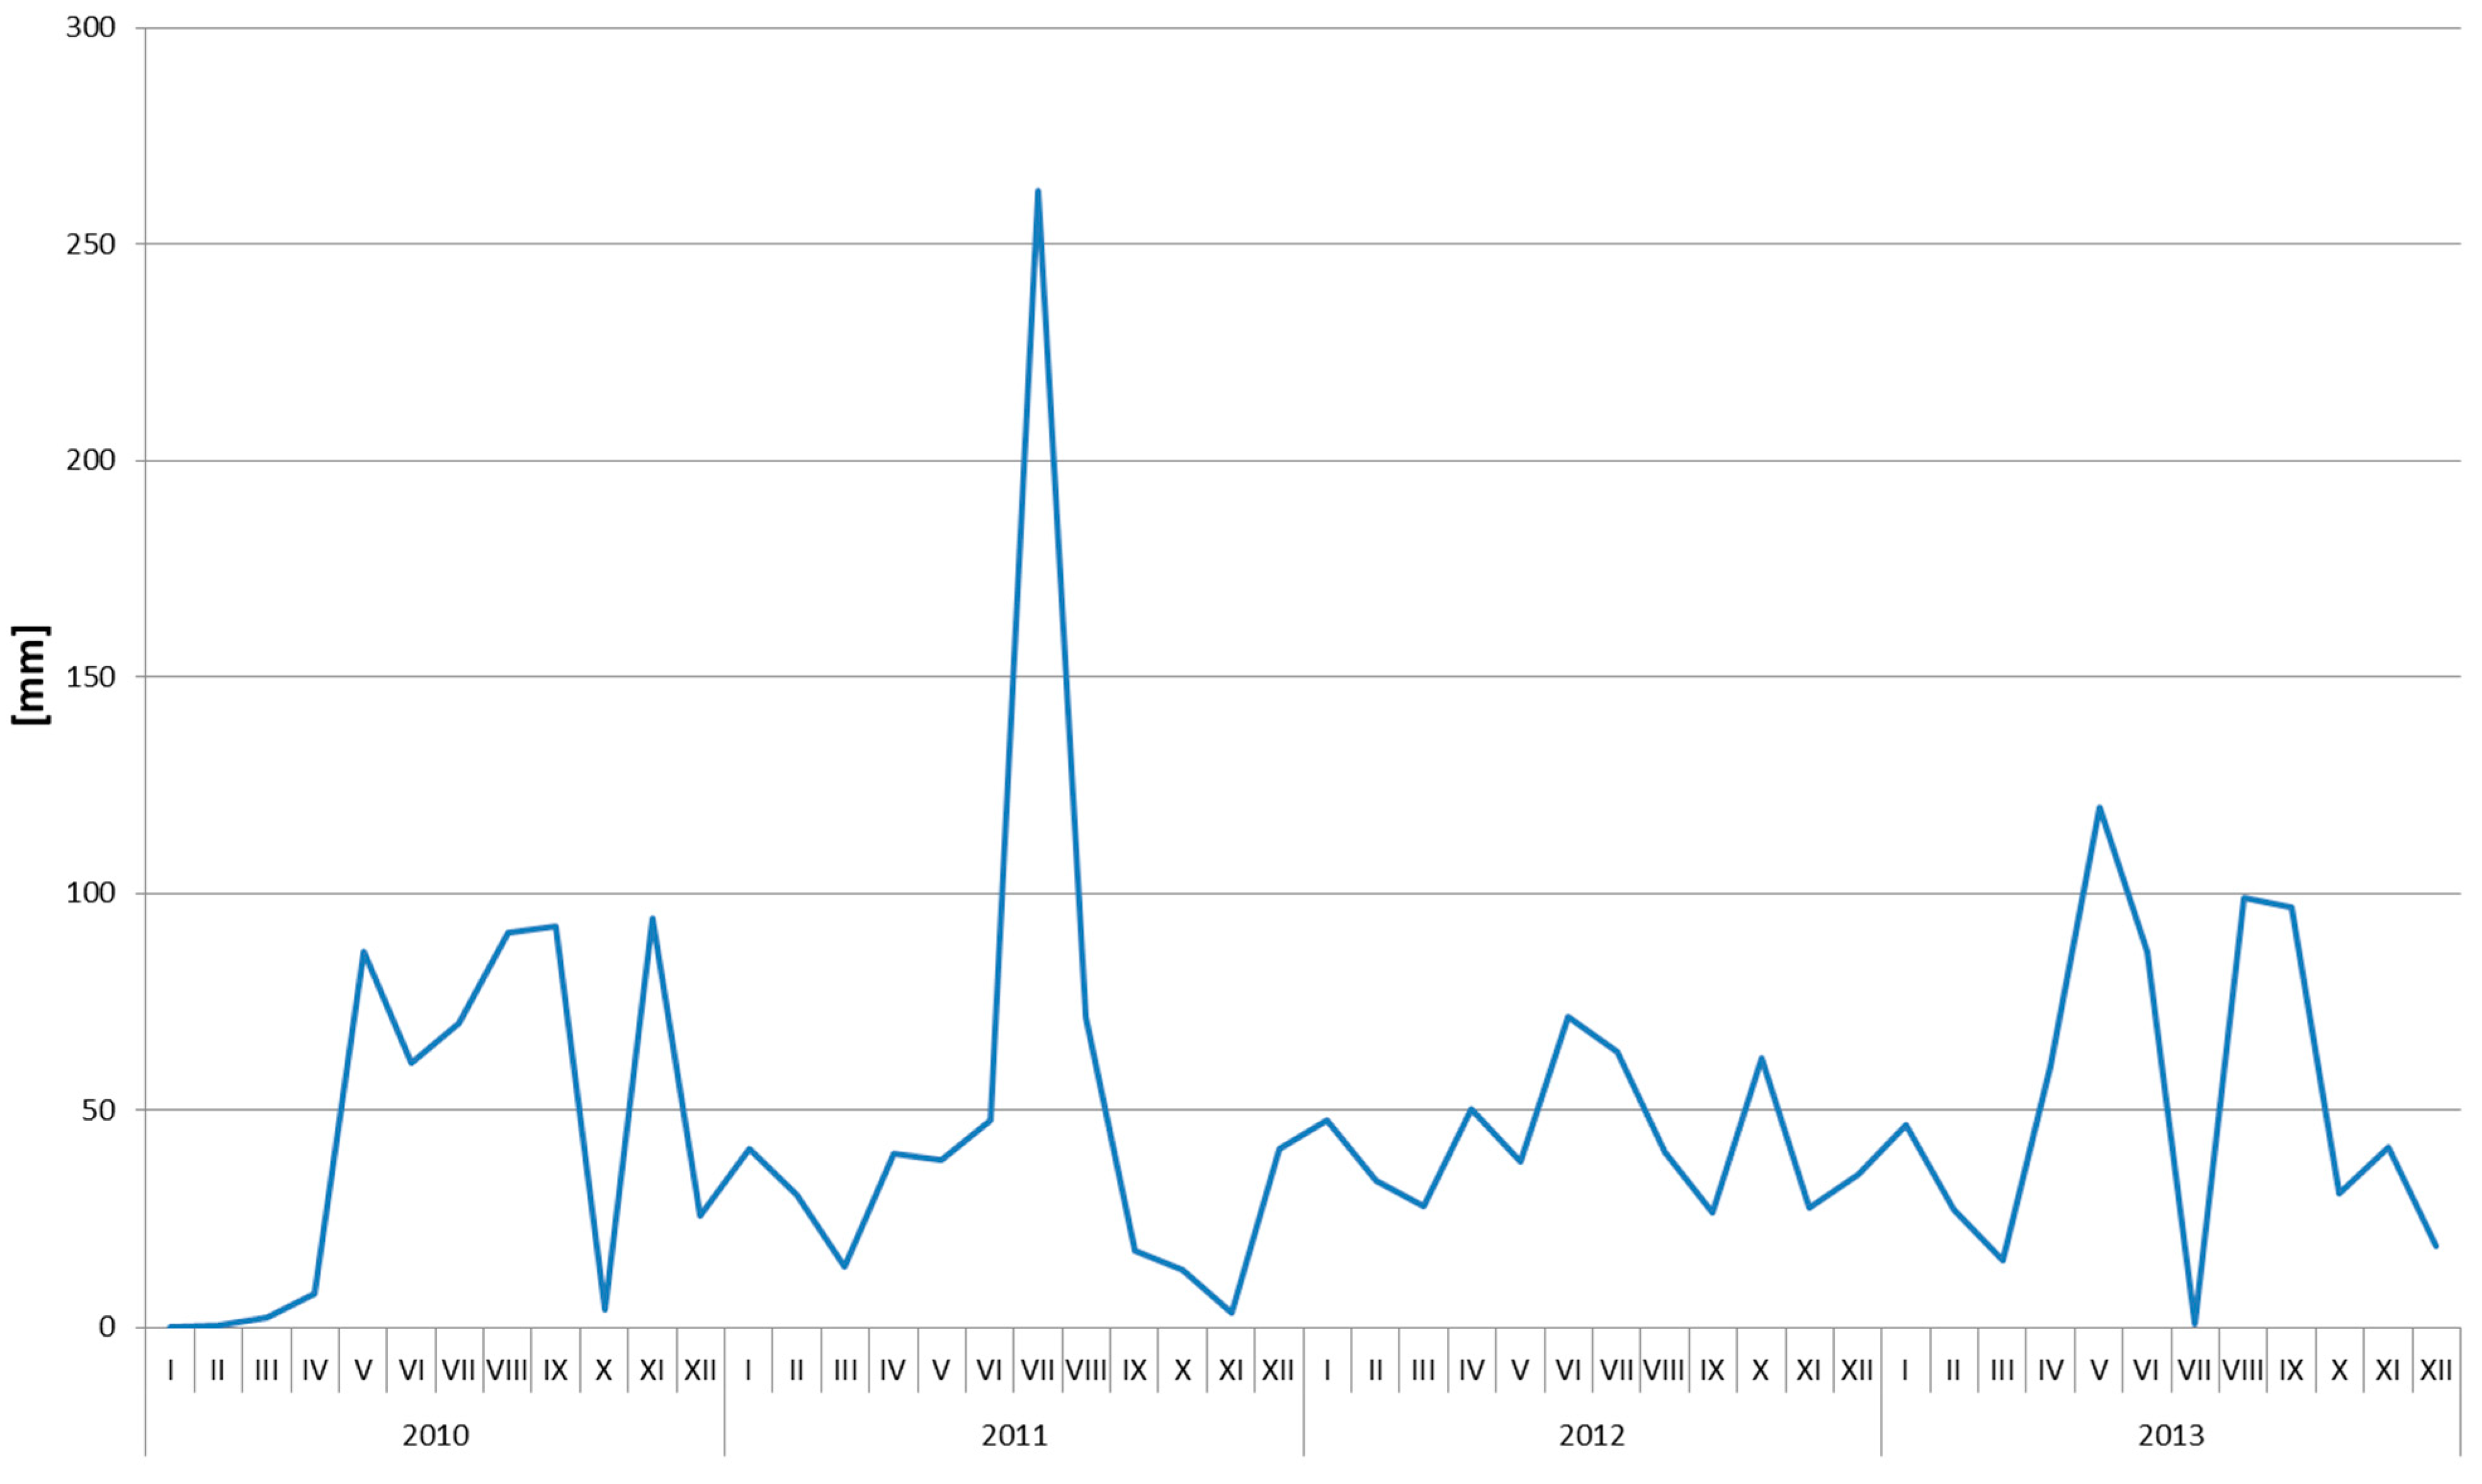
2. Materials and Methods

The experiment was conducted in years 2010–2013 in the experimental orchard of the Warsaw University of Life Sciences, Wilanów, Poland (52°9′036.1″ N, 21°5′058.2″ E). The plant material consisted of apple Malus × domestica Borkh. Variety ‘Jonagored’ grafted onto M9. T339 rootstock. Trees were planted in 2000 in 3.5 × 1.5 m plots on brown sludge made of clay dust, deposited on sandy loam. This soil is characterized by a high content of humus (2.5–3%) and very good physicochemical properties. Planted trees were grown in a spindle-bush system. The soil management system in the orchard included turf grass in the alleyways mowed several times during the season, and a 1 m wide herbicide strip within tree rows sprayed with glyphosate using a commercially available Roundup 360 SL formulation at a dose of 4 L·ha−1. The herbicide was used at the beginning of June and after fruit harvesting at the beginning of October in each year of the experiment.
The weather conditions during the course of the trial are presented in Figure 1 and Figure 2.
Data were collected during the experiment using the Davis Vantage Pro 7 field weather station (Davis Instruments, Hayward, CA, USA) installed in the experimental orchard. The experiment was set up using a split-block design: single test plot included six trees and covered an area of 31.5 m2 (7 × 4.5 m).
Different N fertilization treatments were applied to all plots of the experiment. The following ammonium nitrate (containing 33.5% of N) applications, previously described by Wrona [24] were compared to the control without N fertilization (N-0): (1) 50 kg N·ha−1 applied to the entire surface of the plot (N-50); (2) 100 kg N·ha−1 applied to the entire surface of the plot (N-100); (3) 100 kg N·ha−1 applied to the turf grass in the alleyways (N-100G). Each combination was replicated five times on the plots, each consisting of six trees. N fertilization was applied annually, once in the vegetation season, in early spring approximately two weeks before the expected beginning of flowering of apple trees (usually mid-April).
The same practices of pruning and disease and pest control were applied in all plots in accordance with the standards of integrated pest management.

2.1. Soil Nitrogen Content

To determine the content of available forms of mineral N, soil samples were collected in 2011 and 2012. Samples were collected separately from the herbicide strips and grass alleyways from three depths: 0–30 cm, 30–60 cm and 60–90 cm, three times during each vegetation season:
(1)
Before applying nitrogen fertilizer (April);
(2)
Five weeks after applying nitrogen fertilizer (May);
(3)
Nine weeks after applying nitrogen fertilizer (June).
Immediately after collection, the samples were frozen and then the content of available N-NH4 and N-NO3 was determined right after thawing, in moist soil. Measurements of the concentration of nitrate and ammonium ions in the soil extract were conducted using 1% potassium sulphate solution and the San Plus System flow auto-analyzer (Skalar Analytical B.V., Breda, The Netherlands), according to manufacturer protocols.

2.2. Yielding of the Apple Trees

The fruits were harvested in the phase of harvesting maturity, determined using the induced ethylene method. The fruits were collected from each plot separately, then the average yield was calculated for a given combination of nitrogen fertilization, expressed in kg · tree−1.

2.3. Nutritional Status of Leaves and Fruits

To assess the nutritional status of the trees, 100 leaves were randomly collected each year from each plot of trees in the phase of phenological development corresponding to BBCH-91 (usually end of July). Healthy, fully developed leaves were collected from the middle part of the one-year-old shoots, dried at 70 °C for 24 h in paper bags, than grounded and weighed out to make 1 g samples. The nitrogen content in obtained samples was measured using the Kjeldahl method [25].
The measure of content of P, K, Mg, and Ca in leaves was done, as dried samples were burnt in the muffle furnace (Czylok, Jastrzębie Zdrój, Poland) at 550 °C, digested in a 0.5 M solution of HCl and analyzed using the ICP-AES method with a Thermo Scientific iCAP 6500 Duo spectrometer (Thermo Fischer Scientific, Waltham, MA, USA), according to manufacturer protocols.
To determine the content of minerals (N, P, K, Mg, and Ca) in the flesh of the apples, 30 randomly selected fruits from each plot were collected from which a fragment of the fruit flesh without the peel and seed socket was collected and dried. The next steps were the same as for assessing the concentration of macroelements in the leaves. These measurements allowed for calculating the leaf and fruit saturation with minerals, which is presented in % of dry mass (% d.m.).

2.4. Statistical Analysis

Performed Shapiro–Wilk and Levene’s tests revealed normality of the distribution of all obtained data and homogeneity of their variances, thus further statistical analysis was conducted using analysis of variance (ANOVA) tests. Separation of the mean values was carried out with the Newman–Keuls multiple range test at a significance level of p < 0.05. All analysis was performed using the Statistica 13 software package (StatSoft, Cracow, Poland).

3. Results

3.1. Mineral Nitrogen Content in the Soil

The statistical data analysis of obtained results clearly showed that mineral N content in soil depended significantly on all basic factors used in the experiment (year, sampling place and time, nitrogen fertilization and soil layers) and sometimes on a combination of these factors (Table 1 and Table 2). Indisputably, fertilization with different doses of ammonium nitrate significantly influenced the content of available N forms in all layers of soil. What is important, N content in soil increased with the applied dose of fertilizer, achieving higher content in the combination in which 100 kg N · ha−1 was applied to the entire soil surface. Moreover, content of N in soil was strongly affected by year of the study, however this effect was significant only in the two highest soil layers (Table 1).
The soil under herbicide strips was characterized by a higher content of mineral forms of N than the soil under the grass alleyways, and importantly, significant differences in the content of mineral N between the grass alleyways and the herbicide strips were detected in almost all soil layers, except the upper layer, where these differences were not significant (Table 1 and Table 2).
What is important is, content of available forms of N (also in control, non-fertilized plots) in the soil increased significantly from April to June in all soil layers (Table 1).

3.2. Leaf Nutrient Status

Obtained data clearly revealed that the N content in apple leaves was significantly dependent on the N fertilization and year of the study (Table 3).
In all years of the experiment, the significant lowest N content was recorded in the leaves of apple trees growing on non-fertilized plots, compared to trees fertilized with this macroelement, however N dose did not differentiate significantly the content of N in the leaves (Table 3). On the other hand, the N content in the leaves of apple trees growing on the plots where N fertilization was applied at doses of 50 kg ha−1 and 100 kg N · ha−1 on the entire soil surface was characterized by significant between-year variation: a substantially higher N content in leaves was found in 2011 when compared to 2010 (Table 3). Such a relationship was not observed within apple trees growing on non-fertilized plots and plots fertilized with the use of the higher N dose applied only on the grass alleyways (Table 3).
Interestingly, the phosphorus (P) content in apple leaves was significantly dependent only on the applied nitrogen dose (Table 3). Significantly higher P content was detected in the leaves of apple trees from the control plots in comparison to the other combinations of nitrogen fertilization (Table 3). What is important is, N dose did not differentiate significantly the P content in the leaves (Table 3). Additionally, no significant differences in P content were noted between particular years of experiments (Table 3).
In obtained data, potassium (K) content in apple leaves was significantly dependent both on the year of the study and the N fertilization (Table 3). In all analyzed years, the leaves of apple trees growing on non-fertilized (control) plots were characterized by a significantly higher K content than in the plots fertilized with various N doses (Table 3). However, the amount of applied N did not significantly affect the K content in the leaves, except the combination in which 100 N kg ha−1 was applied only on grass alleyways in 2010, where the K content in the leaves was statistically indistinguishable from the other fertilized plots (Table 3).
Similarly, magnesium (Mg) content in apple leaves was also significantly dependent both on N fertilization and the year of the study (Table 3). Regardless of the year of the experiment, a significantly higher Mg content was found in the leaves of apple trees growing in plots where N fertilization was applied, compared to trees growing in control (non-fertilized) plots (Table 3). What is important is, applied N dose did not differentiate significantly the Mg content in the leaves (Table 3). Additionally, in all plots (including control, non-fertilized plots), significant differences in the Mg content in apple trees within individual years were detected: the apple leaves in 2011 were characterized by a significantly higher magnesium content compared to 2010 (Table 3), while the Mg content in leaves in 2012 did not differ statistically from the Mg content in the other years (Table 3).
Calcium (Ca) content in apple leaves was not significantly dependent on nitrogen fertilization and year of the experiment (Table 3).

3.3. Yielding of Apple Trees

In all analyzed seasons, obtained yield did not differ significantly depending on the N fertilization (Table 4), however achieved results clearly proved that the apple yield was significantly dependent on the year of the study (Table 4).
In the case of non-fertilized plots and plots fertilized with the dose of 50 kg N ha−1, apple trees yielded significantly higher in 2012 compared to 2010, while the yield obtained in 2011 did not differ significantly from the one revealed in other analyzed years (Table 4). Trees growing in plots fertilized with dose of 100 kg N ha−1 applied, both to the entire soil surface and only within the grass alleyways, a significantly higher yield in 2012 compared to previous years (2010 and 2011) (Table 4).

3.4. Fruit Nutrient Status

Obtained results clearly revealed that N content in the fruit was significantly affected only by N fertilization (Table 5).
In 2010, the N content in apple fruits from plots fertilized by 100 kg N ha−1 to the entire soil surface, was significantly higher than in fruits from control plots (non-fertilized) and plots fertilized with 100 kg N · ha−1 applied on grass alleyways (Table 5). Moreover, the N content in apples from plots where ammonium nitrate was applied at a dose of 50 kg N · ha−1 was significantly higher than in fruits from control plots (Table 5). In 2011 and 2012, apple fruits from the plots, where N fertilization had been applied were characterized by a significantly higher N content, compared to the control plots, except for the plots fertilized with 100 kg N · ha−1, which was statistically indistinguishable from other plots (Table 5). No significant differences in nitrogen content in apple fruits were noted between particular years of experiments (Table 5).
Interestingly, content of P in the fruits depended both on the N fertilization and the year of the study (Table 5). Comparing the content of this macroelements in fruits in particular years of the experiment, it was established that apple fruits from non-fertilized (control) plots, in 2010 and 2012 had a significantly higher content of P, compared to 2011 (Table 5). Moreover, apple fruits from the plots, where N was applied at a dose of 100 kg · ha−1 (both to the entire soil surface and only on grass alleyways) had a significantly higher content of P in fruits in 2010 compared to 2011 (Table 5). In the plots, where N was applied at the dose of 50 kg · ha−1, no significant differences in the P content in fruits within particular years of the study were observed (Table 5). What is important, significant differentiation in content of P in apple fruits was recorded only in 2012, when apples from control, non-fertilized plots were characterized by a significantly higher content of P compared to the fruits from plots, where nitrogen was applied in the dose of 100 kg · ha−1 to the entire soil surface (Table 5).
What is important is, also K content in the apple fruits depended both on the nitrogen fertilization and year of the experiment (Table 5). In all years of the study, as the N dose was increased, the K content in apples decreased, however significant differentiation of the K content in fruits in relation to N fertilization was revealed only in 2012, when fruits from apple trees growing on non-fertilized (control) plots were characterized by a significantly higher content of K, compared to the fruits from apple trees growing on the plots where N was applied at the dose of 100 kg · ha−1 (both on entire soil surface, and on grass alleyways) (Table 5). Interestingly, significant differences in the K content in apple fruits between particular years of the experiment were detected only within the plots where 50 kg N ha−1 was applied, where apples were characterized by a significantly higher K content in 2012 compared to 2010 (Table 5).
Mg and Ca content in apple fruits was not dependent significantly on N fertilization and the year of the experiment (Table 5).

4. Discussion

In the face of fast advancing climate change, plant production is necessary to guarantee that the N management system maintains a suitable soil structure and characteristics, while also providing the right quantity and quality of production, with minimal negative impact on the environment. Establishing numerous relationships between the natural abundance of N in the soil, the level of plant nutrition and their fertilization requirements, its impact on the soil environment, the chemical composition of plants, as well as quantitative and qualitative yield parameters is crucial to meet these requirements. Regarding these facts, the issue of N fertilization of orchards has been one of the widely discussed problems in modern fruit production for the last few years. The legitimacy of using N fertilizers is discussed, depending on the local climatic and soil conditions as well as possible doses, methods and dates of nitrogen fertilization. The results obtained in this study showed an ambiguous but significant effect of the applied doses of N fertilization on soil properties, the content of minerals in apple leaves and fruits. It should also be emphasized that in the case of many analyzed variables, the weather conditions prevailing in a given year had a stronger influence on them than the applied N doses.
What is important is fertilization with different doses of ammonium nitrate significantly influenced the content of available N in the soil. Its content increased with the applied dose of fertilizer, achieving significantly higher content in the combination in which 100 kg N · ha−1 was applied to the entire soil surface, which is consistent with the results previously obtained by Wrona [24]. Most likely, under the conditions of the soil rich in organic matter, the dose of 50 kg N ha−1 turned out to be too small to significantly affect the content of available N forms in the soil, while the application of 100 kg N ha−1 within grass alleyways created favorable conditions for the development of vegetation, which absorbed a large part of the available N, preventing a significant increase in nitrogen content in the soil. The soil under herbicide strips fertilized with N was characterized by a higher content of available forms of N than the soil under the grass alleyways. What is important is, significant differences in the content of available forms of mineral N between the grass alleyways and the herbicide strips were visible at all identified depths, which is consistent with the results obtained by other authors [26,27], suggesting the migration of N compounds into the soil profile under herbicide fallow. Thus, it was confirmed that excessive N fertilization of apple orchards with N in relation to the soil content (in the presented experiment, the dose of 100 kg N · ha−1 for the entire soil surface should be considered as such) carries a real risk of groundwater contamination. Moreover, very interesting are data concerning occurrence of N from natural sources in the soil (in control plots). Obtained results clearly showed that the estimated content of mineral N originating from natural soil processes varies significantly depending on the weather conditions prevailing in a given year and month (in the presented studies it ranged from 51 to over 150 kg N · ha−1 per month), however, taking into account the slight fertilization needs of apple trees, it can be considered as completely sufficient or even exceeding the apple’s demand for this element, necessary to maintain high yield and proper condition of trees. What is important is, content of mineral forms of N in the soil from control (not fertilized) plots is the result of the processes of mineralization and immobilization occurring in soil, as well as oxidation and reduction, which are significantly influenced by the entire set of factors. The natural abundance of organic matter in the soil plays a key role here. It is assumed that the mineralization of 1% of organic matter in the soil, depending on the humidity conditions in a given growing season, can provide 30 to 60 kg N ∙ ha−1 annually [28]. High temperature and humidity had a positive effect on the activity of soil micro-organisms, which in the mineralization process released large amount of available forms of mineral N, causing strong between-year variability of N resulting from natural processes in soil. However, these processes are completely different within grass alleyways and herbicide strips. Content of available N forms within the turf in the soil not fertilized with N may also result from the fact that the vegetation of the turf, by binding nutrients, including N, stabilizes their content in the soil. Within herbicide strips, the only factor that can stabilize the N content is the activity of soil micro-organisms involved in denitrification processes and the absorption of N by the roots of trees and turf plants, which makes the variability of N content in the soil under herbicide strips much greater than in the soil under the grassland. Moreover, a significant amount of organic residues from mown grass alleyways is deposited on the herbicide strips, rapidly mineralizing the pool of assimilable N compounds available to plants, which, according to various sources, amounts to 10 to 98 kg N ∙ ha−1 per year [29,30]. All these factors mean that the soil under herbicide fallow is usually characterized by a higher content of available forms of N than the soil under the grassland [29,31]. Thus, even in the soil not fertilized with N and relatively rich in organic matter (in the presented experiment, brown sludge with a humus content of 2.5–3% in the upper layer), there may be a clear tendency to increase the abundance of soil under herbicide strips with N, which was found in presented experiment. Thus, with their relatively low nitrogen demand, apple trees are not able to absorb all the forms of this nutrient available in the soil, which results in its leaching into the deeper layers of the soil. Moreover, in conditions of high N content in soil, the supply of this nutrient may be higher than the demand, which may explain the lack of any increase in apple yield in response to increased N fertilization, observed in the presented study and described in a number of papers [23,32]. What is important, excessive supply of this nutrient component in the soil caused a significant decrease in fruit quality, increased the susceptibility of trees to pathogens and intensified the leaching of N from the soil [23,28,33,34]. The significance of this phenomenon and the precise identification of the possible threats to ecosystems requires further, detailed analysis. The most rational method of reducing this phenomenon would be to use green mulch in the rows of trees to trap the nitrogen released in situ and prevent it from penetrating into the groundwater. In addition to fixing nitrogen and carbon and drastically reducing the use of herbicides, such a soil maintenance system protects the soil much better against erosion [35,36]. The appropriate selection of cover plants can significantly improve the biological activity of the soil, its structure, pH and nutrient content [36]. At the moment, the competition of green mulch plants with trees for water and nutrients remains an unresolved issue, which results in significant reductions in yield [35,36,37]. The natural processes of mineralization of organic matter and the release of atmospheric N by soil micro-organisms also take place within the turf, of course, but they are stabilized by the immediate absorption of nitrogen by plants, which can be seen in the significant variation in the content of available N forms in individual soil layers. In both, 2011 and 2012, most of the N compounds available to plants within the grass alleyways were accumulated in the upper soil layers. Thus, it was confirmed that the turf prevents N leaching into the deeper layer of the soil and reduces the risk of their penetration into groundwater. Some authors (e.g., Fallahi et al. [38]) suggest that in the case of soils poor in organic matter (0.5%), apple trees should be fertilized with very high N doses, reaching 250 kg · ha−1. TerAvest et al. [39] also stated that the use of such high doses of N may be justified in the case of soils poor in organic matter and nutrients. In the presented research, we confirmed that in case of soils rich in humus, with appropriate agrotechnics, N mineralization from soil organic matter can fully satisfy the fertilization needs of apple trees, which was previously pointed out by Wrona and Sadowski [29,40] and Wrona [23,24]. This clearly shows that possible N fertilization of apple orchards should be strictly adapted to local climatic and soil conditions. In our perspective, in a rationally managed, fully fruiting dwarf apple orchard the annual dose of N should not exceed 50 kg N · ha−1. With this amount of N, apple trees should have all the nourishment they need to produce a satisfactory yield, while simultaneously keeping the environment safe.
Despite the above described impact on the soil environment, the different doses of N fertilization used in the presented experiment, also strongly affected nutrient status of apple leaves and fruits. Leaf content analysis is a commonly used diagnostic method enabling the approximate evaluation of the status of mineral nutrition of fruit trees. According to Marcelle [41], the assessment of the macro- and microelements composition of leaves and fruits is useful in determining nutritional status of plant trees and quality of obtained fruits.
In the presented studies, the N content in apple leaves was significantly dependent on nitrogen fertilization and the year of the study: it was significantly higher in all plots where N fertilization was applied in comparison to non-fertilized, control plots. What is important is, the amount of applied N did not significantly differentiate the content of this element in the leaves, which is consistent with the earlier observations of Fallahi et al. [42] and Pacholak et al. [43]). According to the literature data, N fertilization usually increases the N content in apple leaves [4,43,44,45], nevertheless Ernani et al. [46] and Thalheimer and Paoli [27] did not find any significant effect of N fertilization on the content of this macroelement in leaves. However, what is important is, except fertilization, several other factors (rootstock and climatic conditions, mainly the lack of precipitation and high temperatures) can strongly affect the mineral content of the leaves [42,43,47]. According to Pacholak et al. [43], water shortage reduces the content of N, K and P in the leaves, and increases the content of Mg, which may result from a greater share in the nutrition of root trees located in the deeper layers of the soil, poorer in nutrients [47]. Thus, it cannot be excluded that the significantly higher N content in the leaves detected in all fertilized plots is an effect of exceptionally supportive weather conditions (intense rainfall) prevailing this vegetation season. What is crucial, N fertilization, apart from clearly increasing the nitrogen content in leaves, may also cause changes in the content of other minerals: synergism, antagonism or lack of interactions between different nutrition elements were widely described in the literature; for details, see e.g., [48]. According to Meheriuk et al. [49], in leaves in apple trees an increase of the nitrogen level simultaneously decreased the content of potassium, and in some studies, it also increased the content of manganese and magnesium [42,47,50]. Pacholak et al. [43] found that the increase in nitrogen levels in leaves caused by intensive nitrogen fertilization was accompanied by a significant decrease in phosphorus content. Importantly, under conditions of strong vegetative growth, a decrease in the content of N and other elements is often observed in the leaves of trees, referred to as “growth dilution” [51,52,53,54], which makes the obtained results unreliable. Indisputably, N fertilization, regardless of the applied dose, has a positive effect on the content of this component in the leaves, while the increase in the nitrogen dose causes an increase in the nitrogen level in the leaves only up to a certain level, above which the increase in fertilization is no longer accompanied by an increase in the content of this component in the leaves [23,29,50].
The content of Mg in apple leaves, as in the case of nitrogen, was also dependent on nitrogen fertilization and the year of research. Content of this macroelement in apple leaves was significantly higher in all plots where nitrogen was applied, compared to control plots. What is important is the dose of N did not significantly differentiate the Mg content. Importantly, as in the case of nitrogen, the significantly highest Mg content was found in the leaves in 2011. Significant variability of Mg content in apple leaves depending on N dose, with a clear tendency to its increase with increasing doses of this component, was also observed by several authors [42,43,44,47,48,49,51], however Ernani et al. [46] and Kühn et al. [45] found no significant effect of N fertilization on the Mg content in apple leaves. Contrary to the results received by Pacholak et al. [43] and Ernani et al. [46], the results obtained in the presented work clearly showed that N fertilization also had a significant effect on the K content in leaves, but in the case of this macroelement, the applied N doses negatively influenced its level. The K content in apple leaves was significantly higher in the control, non-fertilized plots as compared to the other study plots where nitrogen was applied, and the potassium content in apple leaves also depended on the year of the study. In the case of plots where N was applied at a dose of 50 and 100 kg N · ha−1, a significantly higher level of K in the leaves was found in 2010 compared to 2011. The decrease in K content in apple leaves as a result of N fertilization has already been described in the literature [42,45,47,49]. As in the case of K, N fertilization also negatively influenced the content of P in leaves in the obtained results, which is consistent with the results previously obtained by Kühn et al. [45]. The highest P content was found in apple leaves collected from non-fertilized (control) plots, and its content significantly decreased with increasing N fertilization. What is important, P content in apple leaves did not depend on the year of the study. Decrease of P content in apple leaves as a consequence of N fertilization observed in the presented study is inconsistent with the results stated by Sotirupoulos et al. [51], who observed a positive correlation between the applied N doses and the P content in leaves using combined nitrogen-calcium fertilization. The only macroelement in which content in leaves was not dependent on nitrogen fertilization and the year of the study, was Ca. A lack of significant effect of nitrogen fertilization on the content of Ca in apple leaves was also described in the literature [32,42,43,45,46]. On the other hand, Fallahi and Mohan [47], noted a positive effect of N fertilization on the Ca content in leaves, but it was significant only in some vegetation seasons. Pacholak et al. [43] also emphasizes the fact that the content of certain elements in tree leaves may also be influenced by such a factor as the age of the trees. The leaves of older trees are usually characterized by a lower N and P content than the leaves of younger trees.
The content of nutrients in fruits can provide a lot of valuable information about the important quality characteristics of apples, such as the ability to colour, firmness, content of biologically active substances and their storage potential [49]. The high N content in the apple fruits causes its susceptibility to some physiological abnormalities and diseases during storage [41,55,56,57], although Ernani et al. [46] did not notice a significant effect of high N doses on the storage of apples. Cheng and Raba [58] indicate that the content of minerals in fruits is characterized by high variability during their development and maturation, so determining the nutritional status of trees on this basis seems to be burdened with considerable error. As in the case of leaves, different doses of N fertilization significantly influenced the concentration of minerals in the fruit. Obtained data clearly proved that the N content of apple fruit was significantly dependent on N fertilization, however, unlike the N content in leaves, it was not significantly dependent on year of experiment. Importantly, in 2010 and 2011, the N content in fruits was significantly dependent on N fertilization, reaching a higher level on plots, where 50 kg N ha−1 and 100 kg N ha−1 were applied over the entire soil surface, compared to other combinations. In 2012, the content of this element in fruits, compared to the control combination, was differentiated only by the fact of N fertilization. The significant effect of N fertilization on the increase of N content in fruits has been widely described and discussed in the literature [32,42,44,55,59]. On the other hand, Ernani et al. [46] found no significant effect of N fertilization on the content of this macroelement in apple fruits. Interesting relationships characterized the Mg content in the fruits, unlike the leaves, and did not vary significantly depending on N fertilization and the year of the study, which is consistent with the earlier observations of Pacholak et al. [43] and Uysal [59]. On the other hand, according to Awad and de Jager [55], an increase in N fertilization resulted in a decrease in the magnesium content in fruits. Contrary to the content of magnesium, the content of phosphorus and potassium in apple fruits varied significantly according to applied nitrogen dose and the vegetation season. Along with the increase in nitrogen fertilization, the content of these macroelements decreased, which is consistent with the relationships observed in the case of leaves. The data obtained confirm observations of Awad and de Jager [55] according to which an increase in nitrogen fertilization resulted in a decrease in the phosphorus content in fruits. On the other hand, Uysal [59] did not confirm a significant effect of nitrogen fertilization on the potassium and phosphorus content in apples. In the presented research, the content of potassium and phosphorus in the fruits was positively correlated with the content of potassium and phosphorus in the leaves. As in the case of the factors influencing the calcium content in leaves, in the presented study no significant effect of nitrogen fertilization and the growing season on the calcium content in apple fruits was detected, which confirmed results of earlier studies provided by Pacholak et al. [43] and Ernani et al. [46].

5. Conclusions

The results of our study show that under the conditions of humus-rich soils and with appropriate agrotechnics, nitrogen mineralization from the organic matter available in the soil may completely cover and, under supportive conditions, can exceed the demand of apple trees for this component. Moreover, obtained results suggest that in the case of soils rich in organic matter, with the classic system of soil maintenance in the orchard (herbicide strips in rows of trees and grass alleyways), even in the absence of nitrogen fertilization, there may be a risk of nitrogen compounds from natural processes to deeper soil layers and the possibility of contamination of groundwater. However, the significance of this phenomenon and the precise identification of possible threats to ecosystems associated with it requires further analysis. Additionally, achieved outcomes clearly revealed that nitrogen fertilization in the amount of 100 kg N · ha−1 on the entire soil surface carries a real risk of groundwater contamination, and the same nitrogen dose applied within the grassland does not bring any production effects, therefore it should be considered as unjustified. In our opinion, in a rationally managed, fully fruiting apple orchard, the annual dose of N should not exceed 50 kg N∙ha−1. This dosage of N should fully secure the nutritional needs of apple trees, guaranteeing their high yield and complete safety for the environment.

Author Contributions

Conceptualization, W.K. and D.W.; methodology, W.K., S.P. and D.W.; formal analysis, W.K. and S.P.; investigation, W.K. and S.P.; data curation, W.K. and S.P.; writing—original draft preparation, W.K.; writing—review and editing, W.K., S.P. and D.W.; visualization, W.K.; supervision, D.W. All authors have read and agreed to the published version of the manuscript.

Funding

This research received no external funding.

Institutional Review Board Statement

Not applicable.

Data Availability Statement

Not applicable.

Conflicts of Interest

The authors declare no conflict of interest.

References

  1. Stefanelli, D.; Goodwin, I.; Jones, R. Minimal nitrogen and water use in horticulture: Effects on quality and content of selected nutrients. Food Res. Int. 2010, 43, 1833–1843. [Google Scholar] [CrossRef]
  2. Dong, S.; Neilsen, D.; Neilsen, G.; Fuchigami, L.H. Foliar N application reduced soil NO3-N leaching loss in apple orchard. Plant Soil 2005, 268, 357–366. [Google Scholar] [CrossRef]
  3. Tagliavini, M.; Millard, P. Fluxes of nitrogen within deciduous fruit trees. Acta Sci. Pol. Hortorum Cultus 2005, 4, 21–30. [Google Scholar]
  4. Raese, J.T.; Drake, S.R.; Curry, E.A. Nitrogen fertilizer influences fruit quality, soil nutrition and cover crops, leaf colour and nitrogen content, biennial bearing and cold hardiness of ‘Golden Delicious’. J. Plant Nutr. 2007, 30, 1585–1604. [Google Scholar] [CrossRef]
  5. Bokszczanin, K.Ł.; Wrona, D.; Przybyłko, S. The effect of microbial inoculation under various nitrogen regimes on the uptake of nutrients by apple trees. Agronomy 2021, 11, 2348. [Google Scholar] [CrossRef]
  6. Marschner, P. Marschner's Mineral Nutrition of Higher Plants, 3rd ed.; Academic Press: Cambridge, MA, USA, 2012. [Google Scholar]
  7. Epstein, E.; Bloom, A. Mineral Nutrition of Plants: Principles and Perspectives, 2nd ed.; Sinauer Associates, Inc.: Sunderland, MA, USA, 2005. [Google Scholar]
  8. Fernandes, M.S.; Rosiello, R.O.P. Mineral nitrogen in plant physiology and plant nutrition. Crit. Rev. Plant Sci. 1995, 14, 111–148. [Google Scholar] [CrossRef]
  9. Cruz-Alvarez, O.; Hernández-Rodríguez, O.A.; Jacobo-Cuellar, J.L.; Ávila-Quezada, G.; Morales-Maldonado, E.; Parra-Quezada, R.A.; Robles-Hernandez, L.; Ojeda-Barrios, D.L. Nitrogen fertilization in pecan and its effect on leaf nutrient concentration, yield and nut quality. Rev. Chapingo Ser. Hortic. 2020, 26, 163–173. [Google Scholar] [CrossRef]
  10. Lawlor, D.W. Carbon and nitrogen assimilation in relation to yield: Mechanisms are the key to understanding production systems. J. Exp. Bot. 2002, 53, 773–787. [Google Scholar] [CrossRef]
  11. Tagliavini, M.; Quartieri, M.; Millard, P. Remobilised nitrogen and root uptake of nitrate for leaf growth, flowers and developing fruits of pear (P. communis) trees. Plant Soil 1997, 195, 137–142. [Google Scholar] [CrossRef]
  12. Menino, M.R.; Carranca, C.; de Varennes, A. Distribution and remobilization of nitrogen in young non-bearing orange trees grown under Mediterranean conditions. J. Plant Nutr. 2007, 30, 1083–1096. [Google Scholar] [CrossRef]
  13. Tilman, D.; Cassman, K.G.; Matson, P.A.; Naylor, R.; Polasky, S. Agricultural sustainability and intensive production practices. Nature 2002, 418, 671–677. [Google Scholar] [CrossRef] [PubMed]
  14. Environmental Defense Fund. The Case for Reforming Farm Programs to Preserve the Environment and Help Family Farmers, Ranchers, and Foresters; Environmental Defense Fund: Washington, DC, USA, 2001. [Google Scholar]
  15. Elser, J.J.; Bennett, E. A broken biogeochemical cycle. Nat. Cell Biol. 2011, 478, 29–31. [Google Scholar] [CrossRef] [PubMed]
  16. Tubiello, F.N.; Salvatore, M.; Ferrara, A.F.; House, J.; Federici, S.; Rossi, S.; Biancalani, R.; Golec, R.D.C.; Jacobs, H.; Flammini, A.; et al. The contribution of agriculture, forestry and other land use activities to global warming, 1990–2012. Glob. Change Biol. 2015, 21, 2655–2660. [Google Scholar] [CrossRef] [PubMed] [Green Version]
  17. Bauer, S.E.; Tsigaridis, K.; Miller, R. Significant atmospheric aerosol pollution caused by world food cultivation. Geophys. Res. Lett. 2016, 43, 5394–5400. [Google Scholar] [CrossRef] [Green Version]
  18. Tilman, D.; Clark, M.; Williams, D.; Kimmel, K.; Polasky, S.; Packer, C. Future threats to biodiversity and pathways to their prevention. Nat. Cell Biol. 2017, 546, 73–81. [Google Scholar] [CrossRef] [PubMed]
  19. Kramer, S.B.; Reganold, J.P.; Glover, J.D.; Bohannan, B.J.M.; Mooney, H.A. Reduced nitrate leaching and enhanced denitrifier activity and efficiency in organically fertilized soils. Proc. Natl. Acad. Sci. USA 2006, 103, 4522–4527. [Google Scholar] [CrossRef] [Green Version]
  20. Mulvaney, R.L.; Khan, S.A.; Ellsworth, T.R. Synthetic nitrogen fertilizers deplete soil nitrogen: A global dilemma for sustainable cereal production. J. Environ. Qual. 2009, 38, 2295–2314. [Google Scholar] [CrossRef] [Green Version]
  21. Russell, A.E.; Cambardella, C.A.; Laird, D.A.; Jaynes, D.B.; Meek, D.W. Nitrogen fertilizer effects on soil carbon balances in Midwestern U.S. agricultural systems. Ecol. Appl. 2009, 19, 1102–1113. [Google Scholar] [CrossRef] [Green Version]
  22. Ernani, P.R.; Dias, J. Soil nitrogen application in the spring did not increase apple yield. Cienc. Rural 1999, 29, 645–649. [Google Scholar] [CrossRef] [Green Version]
  23. Wrona, D. Effects on growth, cropping and fruit quality of ‘Šampion’ apple trees during 9 years of planting. Folia Hortic. 2004, 16, 55–60. [Google Scholar]
  24. Wrona, D. The influence of nitrogen fertilization on growth, yield and fruit size of ‘Jonagored’ apple trees. Acta Sci. Pol. Hortorum Cultus 2011, 10, 3–10. [Google Scholar]
  25. Kjeldahl, J. Neue Methode zur Bestimmung des Stickstoffs in organischen Körpern. Anal. Bioanal. Chem. 1883, 22, 366–382. [Google Scholar] [CrossRef] [Green Version]
  26. Paltineanu, C.; Iancu, M.; Chatzoulakis, K.S. Orchard groundcover management effects on nitrate leaching in an irrigated heavy-clay soil. Acta Hort. 1997, 449, 739–745. [Google Scholar] [CrossRef]
  27. Thalheimer, M.; Paoli, N. Effects of time of nitrogen fertilization of apple trees on fruit quality and soil nitrogen content. Italus Hortus 2006, 13, 80–84. [Google Scholar]
  28. Jadczyszyn, T.; Kowalczyk, J.; Lipiński, W. Fertilization Recommendations for Field Crops and Permanent Grasslands; Institute of Soil Science; Plant Cultivation-State Research Institute: Puławy, Poland, 2010. [Google Scholar]
  29. Wrona, D.; Sadowski, A. Effects of nitrogen fertilisation and soil management on soil mineral nitrogen in the apple orchard. J. Fruit Ornam. Plant Res. 2004, 12, 191–199. [Google Scholar]
  30. Engel, A.; Blanke, M.; Lenz, F. Nutrient translocation from the grass alleyway to the tree strip with mulching in a fruit orchard. Erwerbs-Obstbau 2009, 51, 151–161. [Google Scholar] [CrossRef]
  31. Komosa, A. Changes in some chemical properties of the soil under grass sward and herbicide strips in apple orchard. Acta Hortic. 1990, 274, 223–230. [Google Scholar] [CrossRef]
  32. Deckers, T.; Schoofs, H.; Daemen, E.; Missotten, C. Effect of long term soil and leaf nitrogen applications to apple cv. Jonagold and Boskoop on N-min in the soil and on leaf and fruit quality. Acta Hortic. 2001, 564, 269–278. [Google Scholar] [CrossRef]
  33. Rupp, D. Nitrogen fertilization in apple orchards-relationships between available nitrogen in soil samples, nitrates in water and leaching of nitrogen. Acta Hortic. 1995, 383, 401–409. [Google Scholar] [CrossRef]
  34. Unuk, T.; Hribar, J.; Tojnko, S.; Simcic, M.; Pozrl, T.; Plestenjak, A.; Vidrih, R. Effect of nitrogen application and crop load on external and internal fruit quality parameters of apples. Dtsch. Lebensmitt. Rundsch. 2008, 104, 127–135. [Google Scholar]
  35. Tahir, I.I.; Svensson, S.-E.; Hansson, D. Floor management systems in an organic apple orchard affect fruit quality and storage life. HortScience 2015, 50, 434–441. [Google Scholar] [CrossRef] [Green Version]
  36. Żelazny, W.R.; Licznar-Małańczuk, M. Soil quality and tree status in a twelve-year-old apple orchard under three mulch-based floor management systems. Soil Tillage Res. 2018, 180, 250–258. [Google Scholar] [CrossRef]
  37. Granatstein, D.; Sánchez, E. Research knowledge and needs for orchard floor management in organic tree fruit systems. Int. J. Fruit Sci. 2009, 9, 257–281. [Google Scholar] [CrossRef]
  38. Fallahi, E.; Fallahi, B.; Neilsen, G.H.; Neilsen, D.; Peryea, F.J. Effects of mineral nutrition on fruit quality and nutritional disorders in apples. Acta Hortic. 2010, 868, 49–60. [Google Scholar] [CrossRef]
  39. TerAvest, D.; Smith, J.L.; Boggs, L.C.; Hoagland, L.; Granatstein, D.; Reganold, J.P. Influence of orchard floor management and compost application timing on nitrogen partitioning in apple trees. HortScience 2010, 45, 637–642. [Google Scholar] [CrossRef] [Green Version]
  40. Wrona, D.; Sadowski, A. Effects of nitrogen fertilisation in young apple orchard. Acta Hortic. 1997, 448, 481–486. [Google Scholar] [CrossRef]
  41. Marcelle, R.D. Mineral nutrition and fruit quality. Acta Hortic. 1995, 383, 219–226. [Google Scholar] [CrossRef]
  42. Fallahi, E.; Colt, W.M.; Baird, C.R.; Fallahi, B.; Chun, I.-J. Influence of nitrogen and bagging on fruit quality and mineral concentrations of ‘BC-2 Fuji’ apple. Horttechnology 2001, 13, 462–466. [Google Scholar] [CrossRef] [Green Version]
  43. Pacholak, E.; Zachwieja, M.; Zydlik, Z. Effect of nitrogen fertilization on the content of mineral components in soil, leaves and fruits of ‘Šampion’ apple trees. Acta Sci. Pol. Hortorum Cultus 2004, 3, 207–2017. [Google Scholar]
  44. Raese, J.T.; Drake, S.R. Nitrogen fertilization and elemental composition affects fruit quality of 'Fuji' apples. J. Plant Nutr. 1997, 20, 1797–1809. [Google Scholar] [CrossRef]
  45. Kühn, B.F.; Bertelsen, M.; Sørensen, L. Optimising quality-parameters of apple cv. ‘Pigeon’ by adjustment of nitrogen. Sci. Hortic. 2011, 129, 369–375. [Google Scholar] [CrossRef]
  46. Ernani, P.R.; Rogeri, D.A.; Proença, M.M.; Dias, J. Addition of nitrogen had no effect on yield and quality of apples in an high density orchard carrying a dwarf rootstock. Rev. Bras. Frutic. 2008, 30, 1113–1118. [Google Scholar] [CrossRef] [Green Version]
  47. Fallahi, E.; Mohan, K.S. Influence of nitrogen and rootstock on tree growth precocity, fruit quality, leaf mineral nutrients and fire blight in ‘Scarlet Gala’ apple. HortTechnology 2000, 10, 589–592. [Google Scholar] [CrossRef] [Green Version]
  48. Rietra, R.P.J.J.; Heinen, M.; Dimkpa, C.O.; Bindraban, P.S. Effects of nutrient antagonism and synergism on yield and fertilizer use efficiency. Commun. Soil Sci. Plant Anal. 2017, 48, 1895–1920. [Google Scholar] [CrossRef] [Green Version]
  49. Meheriuk, M.; Neilsen, G.M.; Hogue, E.J. The influence of nitrogen fertilization, season of application and orchard floor management on fruit quality and leaf mineral content of ‘Golden Delicious’ apple trees. Fruit Var. J. 1992, 46, 71–75. [Google Scholar]
  50. Rupp, D.; Hübner, H. Impact of nitrogen fertilization in apple orchards. Results of a long year fertilizing trial. Erwerbs-Obstbau 1995, 37, 29–31. [Google Scholar]
  51. Sotiropoulos, T.E.; Therios, I.N.; Dimassi, K.N.; Tsirakoglou, V. Effects of applications of a complex and Na-Ca fertilizer on leaf and fruit nutrient concentrations and some fruit quality parameter in two apple cultivars. Hortic. Sci. 2005, 43, 725–729. [Google Scholar] [CrossRef] [Green Version]
  52. Cmelik, Z.; Tojnko, S.; Unuk, T. Fruit quality of ‘Fuji’ apple as affected by crop load and rates of nitrogen. Acta Hortic. 2006, 721, 147–152. [Google Scholar] [CrossRef]
  53. Fallahi, E.; Fallahi, B.; Retamales, J.B.; Valdes, C.; Tabatabei, S.J. Prediction of apple fruit quality using preharvest mineral nutrients. Acta Hortic. 2006, 721, 259–264. [Google Scholar] [CrossRef]
  54. Tahir, I.I.; Johansson, E.; Olsson, M.E. Improving the productivity, quality and storability of ‘Katja’ apple by better orchard management procedures. Hortic. Sci. 2008, 43, 725–729. [Google Scholar] [CrossRef] [Green Version]
  55. Awad, M.A.; de Jager, A. Relationships between fruit nutrients and concentrations of flavonoids and chlorogenic acid in `Elstar' apple skin. Sci. Hortic. 2002, 92, 265–276. [Google Scholar] [CrossRef]
  56. Ludders, P. The effect of nitrogen nutrition on bitter pit in apples. Commun. Soil Sci. Plant Anal. 1979, 10, 401–415. [Google Scholar] [CrossRef]
  57. Perring, M. Effects of area of herbicide and grass sward treatments and amount of nitrogen fertilizer on the mineral composition during development. J. Hortic. Sci. 1984, 62, 17–25. [Google Scholar]
  58. Cheng, L.; Raba, R. Accumulation of macro- and micronutrients and nitrogen demand-supply relationship of ‘Gala’/‘Malling 26’ apple trees grown in sand culture. J. Am. Soc. Hortic. Sci. 2009, 134, 3–13. [Google Scholar] [CrossRef]
  59. Uysal, E. Influence of different nitrogen applications on mineral content of fruits in apple. Tarim Bilim. Derg. 2015, 8, 50–53. [Google Scholar]
Figure 1. Temperature conditions on experiment area in years 2010–2013.
Agriculture 12 02169 g001
Figure 2. Precipitation on experiment area in years 2010–2013.
Agriculture 12 02169 g002
Table 1. Mineral nitrogen content in the soil (mg N·100 g soil−1; mean ± SD) in particular soil layers in relation to year, sampling place, sampling time and nitrogen fertilization.
YearSampling PlaceSampling TimeNitrogen
Fertilization
Soil Layer [cm]
0–3030–6060–90
2011herbicyde stripsAprilN-029.80 ± 0.7012.32 ± 4.936.72 ± 2.98
N-5033.10 ± 6.1424.03 ± 10.9816.56 ± 9.19
N-10026.46 ± 4.5324.06 ± 8.0433.76 ± 13.16
N-100G41.62 ± 2.8924.13 ± 7.5314.78 ± 9.19
MayN-026.73 ± 5.6420.83 ± 5.1211.86 ± 5.50
N-5066.97 ± 15.2426.56 ± 8.0019.96 ± 7.80
N-10055.87 ± 10.9049.97 ± 18.3635.90 ± 10.24
N-100G30.24 ± 5.8425.27 ± 7.5813.74 ± 12.33
JuneN-022.97 ± 8.7323.80 ± 2.0419.70 ± 5.54
N-5035.73 ± 2.0933.93 ± 7.5031.40 ± 15.99
N-10067.93 ± 16.6970.47 ± 24.0672.93 ± 16.90
N-100G28.63 ± 7.5242.20 ± 28.5431.50 ± 15.39
grass alleywaysAprilN-030.46 ± 12.0517.23 ± 4.407.11 ± 3.02
N-5034.77 ± 5.0717.40 ± 5.1614.29 ± 8.66
N-10038.80 ± 3.4220.20 ± 1.9115.50 ± 4.61
N-100G23.00 ± 9.8614.43 ± 0.6111.95 ± 3.86
MayN-034.80 ± 12.4522.57 ± 11.1611.59 ± 5.72
N-5026.33 ± 6.1524.93 ± 5.1319.97 ± 4.67
N-10079.30 ± 14.2633.03 ± 12.5521.47 ± 9.23
N-100G71.93 ± 16.0835.80 ± 6.5043.30 ± 13.88
JuneN-022.33 ± 7.3122.27 ± 11.9816.43 ± 4.78
N-5025.87 ± 8.5618.96 ± 2.1514.80 ± 6.82
N-10063.23 ± 39.6934.43 ± 2.9937.03 ± 23.70
N-100G32.77 ± 6.2325.63 ± 7.1114.66 ± 4.55
2012herbicyde stripsAprilN-035.80 ± 6.9317.63 ± 8.3110.49 ± 2.84
N-5048.40 ± 9.1728.30 ± 13.8116.58 ± 6.32
N-10056.00 ± 17.1594.40 ± 7.0369.03 ± 24.18
N-100G39.87 ± 10.9237.80 ± 5.1227.17 ± 8.77
MayN-038.50 ± 3.6226.66 ± 6.7720.63 ± 11.91
N-5099.67 ± 4.9338.03 ± 22.2615.53 ± 0.40
N-10098.90 ± 22.6766.20 ± 16.0057.10 ± 17.23
N-100G38.56 ± 12.2629.26 ± 0.809.85 ± 2.59
JuneN-034.43 ± 16.0049.63 ± 31.2645.93 ± 4.37
N-5053.93 ± 37.7018.27 ± 8.6018.37 ± 9.66
N-100160.70 ± 59.88105.97 ± 8.5990.33 ± 10.03
N-100G65.80 ± 24.1126.73 ± 6.3211.53 ± 5.23
grass alleywaysAprilN-026.00 ± 9.7211.56 ± 3.118.68 ± 1.58
N-5047.47 ± 13.4221.40 ± 1.1321.17 ± 13.96
N-10030.93 ± 9.0125.67 ± 11.5712.29 ± 6.30
N-100G28.33 ± 11.3519.46 ± 7.4620.45 ± 7.57
MayN-032.30 ± 10.1414.06 ± 9.0910.90 ± 4.62
N-5036.40 ± 7.7619.23 ± 3.958.46 ± 1.99
N-10067.20 ± 0.0044.50 ± 26.4426.60 ± 20.90
N-100G79.23 ± 2.5639.96 ± 25.1319.67 ± 5.61
JuneN-052.17 ± 26.5521.53 ± 13.0125.53 ± 22.68
N-5055.47 ± 26.3223.63 ± 3.2122.97 ± 15.47
N-10074.87 ± 18.5035.00 ± 0.107.91 ± 3.84
N-100G21.07 ± 6.7329.47 ± 22.7615.00 ± 3.83
Yearp = 0.002p = 0.039p = 0.475
Sampling placep = 0.095p < 0.0001p < 0.0001
Time of the samplingp = 0.003p = 0.047p = 0.020
Nitrogen fertilizationp < 0.0001p < 0.0001p < 0.0001
Year × sampling placep = 0.003p = 0.071p = 0.14
Year × time of the samplingp = 0.14p = 0.058p = 0.44
Year × nitrogen fertilizationp = 0.298p = 0.024p = 0.277
Sampling place × time of the samplingp = 0.544p = 0.254p = 0.061
Sampling place × nitrogen fertilizationp = 0.12p < 0.0001p < 0.0001
Time of the sampling × nitrogen fertilizationp = 0.001p = 0.556p = 0.250
Year × sampling place × time of samplingp = 0.828p = 0.601p = 0.870
Year × sampling place × nitrogen fertilizationp = 0.049p = 0.020p = 0.013
Year × sampling place × nitrogen fertilization × time of samplingp = 0.176p = 0.065p = 0.10
Table 2. Mineral nitrogen content in the soil (mg N·100 g soil−1; mean ± SD) in particular plots of the experiment in relation to year, sampling place, sampling time and soil layer.
YearSampling PlaceSampling TimeSoil Layer [cm]Nitrogen Fertilization
N-0N-50N-100N-100G
2011herbicyde stripsApril0–3029.80 ± 0.7033.10 ± 6.1426.46 ± 4.5341.62 ± 2.89
30–6012.32 ± 4.9324.03 ± 10.9824.06 ± 8.0424.13 ± 7.53
60–906.72 ± 2.9816.56 ± 9.1933.76 ± 13.1614.78 ± 9.19
May0–3026.73 ± 5.6466.97 ± 15.2455.87 ± 10.9030.24 ± 5.84
30–6020.83 ± 5.1226.56 ± 8.0049.97 ± 18.3625.27 ± 7.58
60–9011.86 ± 5.5019.96 ± 7.8035.90 ± 10.2413.74 ± 12.33
June0–3022.97 ± 8.7335.73 ± 2.0967.93 ± 16.6928.63 ± 7.52
30–6023.80 ± 2.0433.93 ± 7.5070.47 ± 24.0642.20 ± 28.54
60–9019.70 ± 5.5431.40 ± 15.9972.93 ± 16.9031.50 ± 15.39
grass alleywaysApril0–3030.46 ± 12.0534.77 ± 5.0738.80 ± 3.4223.00 ± 9.86
30–6017.23 ± 4.4017.40 ± 5.1620.20 ± 1.9114.43 ± 0.61
60–907.11 ± 3.0214.29 ± 8.6615.50 ± 4.6111.95 ± 3.86
May0–3034.80 ± 12.4526.33 ± 6.1579.30 ± 14.2671.93 ± 16.08
30–6022.57 ± 11.1624.93 ± 5.1333.03 ± 12.5535.80 ± 6.50
60–9011.59 ± 5.7219.97 ± 4.6721.47 ± 9.2343.30 ± 13.88
June0–3022.33 ± 7.3125.87 ± 8.5663.23 ± 39.6932.77 ± 6.23
30–6022.27 ± 11.9818.96 ± 2.1534.43 ± 2.9925.63 ± 7.11
60–9016.43 ± 4.7814.80 ± 6.8237.03 ± 23.7014.66 ± 4.55
2012herbicyde stripsApril0–3035.80 ± 6.9348.40 ± 9.1756.00 ± 17.1539.87 ± 10.92
30–6017.63 ± 8.3128.30 ± 13.8194.40 ± 7.0337.80 ± 5.12
60–9010.49 ± 2.8416.58 ± 6.3269.03 ± 24.1827.17 ± 8.77
May0–3038.50 ± 3.6299.67 ± 4.9398.90 ± 22.6738.56 ± 12.26
30–6026.66 ± 6.7738.03 ± 22.2666.20 ± 16.0029.26 ± 0.80
60–9020.63 ± 11.9115.53 ± 0.4057.10 ± 17.239.85 ± 2.59
June0–3034.43 ± 16.0053.93 ± 37.70160.70 ± 59.8865.80 ± 24.11
30–6049.63 ± 31.2618.27 ± 8.60105.97 ± 8.5926.73 ± 6.32
60–9045.93 ± 4.3718.37 ± 9.6690.33 ± 10.0311.53 ± 5.23
grass alleywaysApril0–3026.00 ± 9.7247.47 ± 13.4230.93 ± 9.0128.33 ± 11.35
30–6011.56 ± 3.1121.40 ± 1.1325.67 ± 11.5719.46 ± 7.46
60–908.68 ± 1.5821.17 ± 13.9612.29 ± 6.3020.45 ± 7.57
May0–3032.30 ± 10.1436.40 ± 7.7667.20 ± 0.0079.23 ± 2.56
30–6014.06 ± 9.0919.23 ± 3.9544.50 ± 26.4439.96 ± 25.13
60–9010.90 ± 4.628.46 ± 1.9926.60 ± 20.9019.67 ± 5.61
June0–3052.17 ± 26.5555.47 ± 26.3274.87 ± 18.5021.07 ± 6.73
30–6021.53 ± 13.0123.63 ± 3.2135.00 ± 0.1029.47 ± 22.76
60–9025.53 ± 22.6822.97 ± 15.477.91 ± 3.8415.00 ± 3.83
Yearp = 0.006p = 0.18p = 0.004p = 0.719
Sampling placep = 0.192p = 0.013p < 0.0001p = 0.881
Time of the samplingp = 0.002p = 0.395p = 0.001p = 0.052
Soil layerp < 0.0001p < 0.0001p = 0.002p < 0.0001
Year × sampling placep = 0.079p = 0.876p < 0.0001p = 0.484
Year × time of the samplingp = 0.018p = 0.979p = 0.851p = 0.639
Year × soil layerp = 0.652p = 0.005p = 0.425p = 0.358
Sampling place × time of the samplingp = 0.018p = 0.979p = 0.851p = 0.639
Sampling place × soil layerp = 0.322p = 0.079p = 0.259p = 0.598
Time of the sampling × soil layerp = 0.156p = 0.183p = 0.185p = 0.206
Year × sampling place × time of samplingp = 0.907p = 0.196p = 0.424p = 0.941
Year × sampling place × soil layerp = 0.437p = 0.680p = 0.524p = 0.430
Year × sampling place × soil layer × time of samplingp = 0.271p = 0.996p = 0.871p = 0.0006
Table 3. Effect of year and nitrogen fertilization on macroelements content in apple leaves, expressed in % of dry mass (% d.m.—mean ± SD).
MacroelementYearNitrogen Fertilization
N-0N-50N-100N-100G
N2010a 1.91 ± 0.11 Aa 2.11 ± 0.07 Ba 2.15 ± 0.10 Ba 2.11 ± 0.03 B
2011a 1.92 ± 0.29 Ab 2.32 ± 0.09 Bb 2.37 ± 0.08 Ba 2.28 ± 0.11 B
2012a 1.81 ± 0.07 Aab 2.23 ± 0.06 Bab 2.26 ± 0.07 Ba 2.21 ± 0.08 B
P2010a 0.29 ± 0.001 Ba 0.16 ± 0.01 Aa 0.15 ± 0.002 Aa 0.17 ± 0.01 A
2011a 0.30 ± 0.07 Ba 0.18 ± 0.01 Aa 0.16 ± 0.01 Aa 0.17 ± 0.01 A
2012a 0.29 ± 0.03 Ba 0.17 ± 0.01 Aa 0.16 ± 0.002 Aa 0.17 ± 0.008 A
K2010a 1.54 ± 0.04 Bb 1.22 ± 0.10 Ab 1.31 ± 0.11 Aa 1.34 ± 0.18 AB
2011a 1.56 ± 0.17 Ba 1.06 ± 0.08 Aa 1.24 ± 0.03 Aa 1.14 ± 0.17 A
2012a 1.55 ± 0.09 Bab 1.15 ± 0.06 Aab 1.28 ± 0.07 Aa 1.24 ± 0.17 A
Mg2010a 0.18 ± 0.01 Aa 0.27 ± 0.01 Ba 0.24 ± 0.02 Ba 0.24 ± 0.03 B
2011b 0.25 ± 0.02 Ab 0.30 ± 0.02 Bb 0.29 ± 0.02 Bb 0.30 ± 0.03 B
2012ab 0.22 ± 0.02 Aab 0.28 ± 0.01 Bab 0.27 ± 0.01 Bab 0.27 ± 0.02 B
Ca2010a 2.14 ± 0.04 Aa 2.14 ± 0.03 Aa 2.14 ± 0.06 Aa 2.12 ± 0.03 A
2011a 2.18 ± 0.05 Aa 2.15 ± 0.05 Aa 2.13 ± 0.04 Aa 2.16 ± 0.06 A
2012a 2.17 ± 0.02 Aa 2.14 ± 0.01 Aa 2.15 ± 0.01 Aa 2.15 ± 0.02 A
Note: lowercase letters before the means indicate significant differences between years, and uppercase letters indicate significant differences between different nitrogen fertilization (at p ≤ 0.05, according to the Newman–Keuls test).
Table 4. Effect of year and nitrogen fertilization on yielding of apple trees, expressed in kg per tree −1 ± SD.
YearNitrogen Fertilization
N-0N-50N-100N-100G
2010a 9.52 ± 2.61 A a 12.01 ± 1.62 Aa 13.25 ± 2.23 Aa 11.31 ± 1.41 A
2011ab 16.77 ± 6.97 Aab 20.13 ± 8.48 Ab 18.27 ± 3.13 Ab 18.21 ± 6.51 A
2012b 24.60 ± 5.62 Ab28.25 ± 3.90 Ac 30.79 ± 2.84 Ac 28.46 ± 3.22 A
Note: lowercase letters before the means indicate significant differences between years, and uppercase letters indicate significant differences between different nitrogen fertilization (at p ≤ 0.05, according to the Newman–Keuls test).
Table 5. Effect of year and nitrogen fertilization on macroelements content in apple fruits, expressed in % of dry mass (% d.m.—mean ± SD).
MacroelementYearNitrogen Fertilization
N-0N-50N-100N-100G
N2010a 0.27 ± 0.044 Aa 0.32 ± 0.024 BCa 0.33 ± 0.0095 Ca 0.28 ± 0.011 AB
2011a 0.21 ± 0.069 Aa 0.32 ± 0.032 Ba 0.34 ± 0.024 Ba 0.28 ± 0.017 AB
2012a 0.24 ± 0.055 Aa 0.32 ± 0.029 Ba 0.33 ± 0.011 Ba 0.32 ± 0.010 B
P2010b 0.10 ± 0.0047 Aa 0.094 ± 0.0067 Ab 0.096 ± 0.0084 Ab 0.095 ± 0.0046 A
2011a 0.086 ± 0.0043 Aa 0.085 ± 0.0065 Aa 0.080 ± 0.0026 Aa 0.083 ± 0.0064 A
2012b 0.098 ± 0.0029 Ba 0.089 ± 0.0061 ABab 0.089 ± 0.0042 Aab 0.090 ± 0.054 AB
K2010a 0.78 ± 0.071 Aa 0.68 ± 0.047 Aa 0.71 ± 0.066 Aa 0.67 ± 0.016 A
2011a 0.74 ± 0.031 Ab 0.75 ± 0.011 Aa 0.69 ± 0.016 Aa 0.72 ± 0.075 A
2012a 0.76 ± 0.022 Bab 0.72 ± 0.019 ABa 0.70 ± 0.039 Aa 0.69 ± 0.035 A
Mg2010a 0.033 ± 0.0022 Aa 0.032 ± 0.0019 Aa 0.036 ± 0.0079 Aa 0.031 ± 0.0013 A
2011a 0.032 ± 0.0030 Aa 0.035 ± 0.00033 Aa 0.033 ± 0.002 Aa 0.034 ± 0.0021 A
2012a 0.033 ± 0.0043 Aa 0.032 ± 0.00016 Aa 0.035 ± 0.0064 Aa 0.032 ± 0.0011 A
Ca2010a 0.043 ± 0.0012 Aa 0.036 ± 0.0067 Aa 0.037 ± 0.0024 Aa 0.035 ± 0.0065 A
2011a 0.035 ± 0.0074 Aa 0.031 ± 0.0037 Aa 0.032 ± 0.0059 Aa 0.032 ± 0.0087 A
2012a 0.041 ± 0.0035 Aa 0.034 ± 0.0010 Aa 0.036 ± 0.0029 Aa 0.033 ± 0.0042 A
Note: lowercase letters before the means indicate significant differences between years, and uppercase letters indicate significant differences between different nitrogen fertilization (at p ≤ 0.05, according to the Newman–Keuls test).
Publisher’s Note: MDPI stays neutral with regard to jurisdictional claims in published maps and institutional affiliations.

