Article

The Improvement of a Traction Model for Agricultural Tire–Soil Interaction

1
Faculty of Agriculture, Iaşi University of Life Sciences, 700490 Iaşi, Romania
2
The National Institute of Research—Development for Machines and Installations Designed for Agriculture and Food Industry—INMA Bucharest, 013813 Bucharest, Romania
*
Author to whom correspondence should be addressed.
Agriculture 2022, 12(12), 2035; https://doi.org/10.3390/agriculture12122035
Submission received: 31 October 2022 / Revised: 24 November 2022 / Accepted: 25 November 2022 / Published: 28 November 2022

Abstract

:
The goodness-of-fit analysis performed over the results provided by a model presented in a previous paper proved that the theoretical data were very well correlated with the experimental data with regard to the traction force (with Pearson coefficient r2 over 0.9); however, the model was less accurate in predicting traction efficiency, with r2 = 0.203. In order improve the model and obtain a better fit between the theoretical and experimental data (especially for the traction efficiency), the model was updated and modified by taking into account the geometry of the tire cross section, which was considered to be a deformable ellipse. Due to the deformable cross section, the minor axis of the tire–ground contact super ellipse decreased compared with the previous model (from 0.367 m to 0.222 m), while the major axis increased (from 0.530 m to 0.534 m). As a result, different data for the traction force and traction efficiency were obtained. The effect of the wheel travel reduction (wheel slip) over the tire–soil shear area was also investigated, and the hypothesis of a constant shear area (independent of wheel slip) provided the most accurate results. The goodness-of-fit analysis performed using the data predicted by the modified model showed that the Pearson coefficient increased significantly with regard to the traction efficiency (from 0.203 to 0.838), while it decreased by only 2.7% with regard to the data for the traction force, still preserving a high value (r2 = 0.896).

1. Introduction

The improvement of the technological performance of the running systems of wheeled agricultural machinery is one of the main concerns of researchers worldwide [1].
In the case of agricultural tractors, the engine power of a wheeled tractor is transmitted to the terrain by means of the mechanical interface represented by the agricultural tire [2]. The soil–vehicle interface is the primary cause of low traction efficiency, which is estimated to be on the order of 60% on farmland [3]. Consequently, as the final element of the drive train, the tire plays a significant role in energy efficiency and fuel consumption [4].
In order to improve the performance of the agricultural tractor, researchers and designers use computer models or simulation software to predict tractor response. This approach reduces field trials and constitutes an essentially cost-free alternative to the determination of the relative importance of a number of factors affecting actual tractor operation [3].
Moreover, the accurate prediction of the mobility on deformable terrains allows the evaluation of tractor performance, including the drawbar pull and rolling resistance [5].
There are currently three main approaches for the study of soil–wheel interaction: experimental research, theoretical modeling, and numerical simulation [6]; Bekker was the first researcher to conduct a systematic research study on soil–wheel interaction using experimental analysis and theoretical modeling.
Experimental research was the basis for the development of the empirical models, which are very useful tools for evaluating the performance of the wheeled vehicles in conditions similar to the test environment and with tire properties similar to the test tire [7].
Semi-empirical (analytical) models are based on both theoretical modeling and experimental tests [7] and require a reduced number of soil parameters. They are based on empirical relations in addition to analytical approaches in order to achieve high-fidelity results while keeping the computational effort and number of model variables low [7].
In these semi-empirical models, the behavior of soil under vertical load is often described by the theory of Bekker [8], while the tangential effects of the soil–tire interface are predicted by the approach of Janosi and Hanamoto [9]. Soil shear strength is taken into account as a parameter that affects the circumferential force (and therefore the traction force) of the tire [10].
While analytical models presume a certain geometry of the contact patch between tire and ground sections of a circle for the Bekker approach, parabola, etc.—the real geometry of the contact area results from mutual deformation of tire and ground, which can be better described by numerical simulation [11]. Numerical simulations use discrete element method (DEM) and finite element method (FEM) modeling for describing the tire–soil interaction. These models incorporate methods including computational physics and numerical analysis to construct an applied framework for the complex problem of soil-tire interaction but require high computational resources (hardware and software) to handle their highly discretized structures [7]. The precision is conditioned by the accurate knowledge of many soil characteristics; calibration of the model, with the help of experimental tests, is also required.
Based on the on the above-mentioned facts, our research was focused on the development and improvement of a semi-empirical model that which started with a traction model presented in a previous paper [12]. In that paper, the deformation of the tire cross section was taken into account only by the means of tire deflection under load, with no reference to its geometry.
In the present study, the previous model was further enhanced by taking into account the geometry and deformation of the cross section of the loaded tire while considering a modified width of the contact patch, aiming to obtain a better goodness of fit between the model and test data than the one achieved by the initial model. The theoretical results regarding the traction force and traction efficiency were validated against the experimental ones using a goodness-of-fit was analysis.

2. Materials and Methods

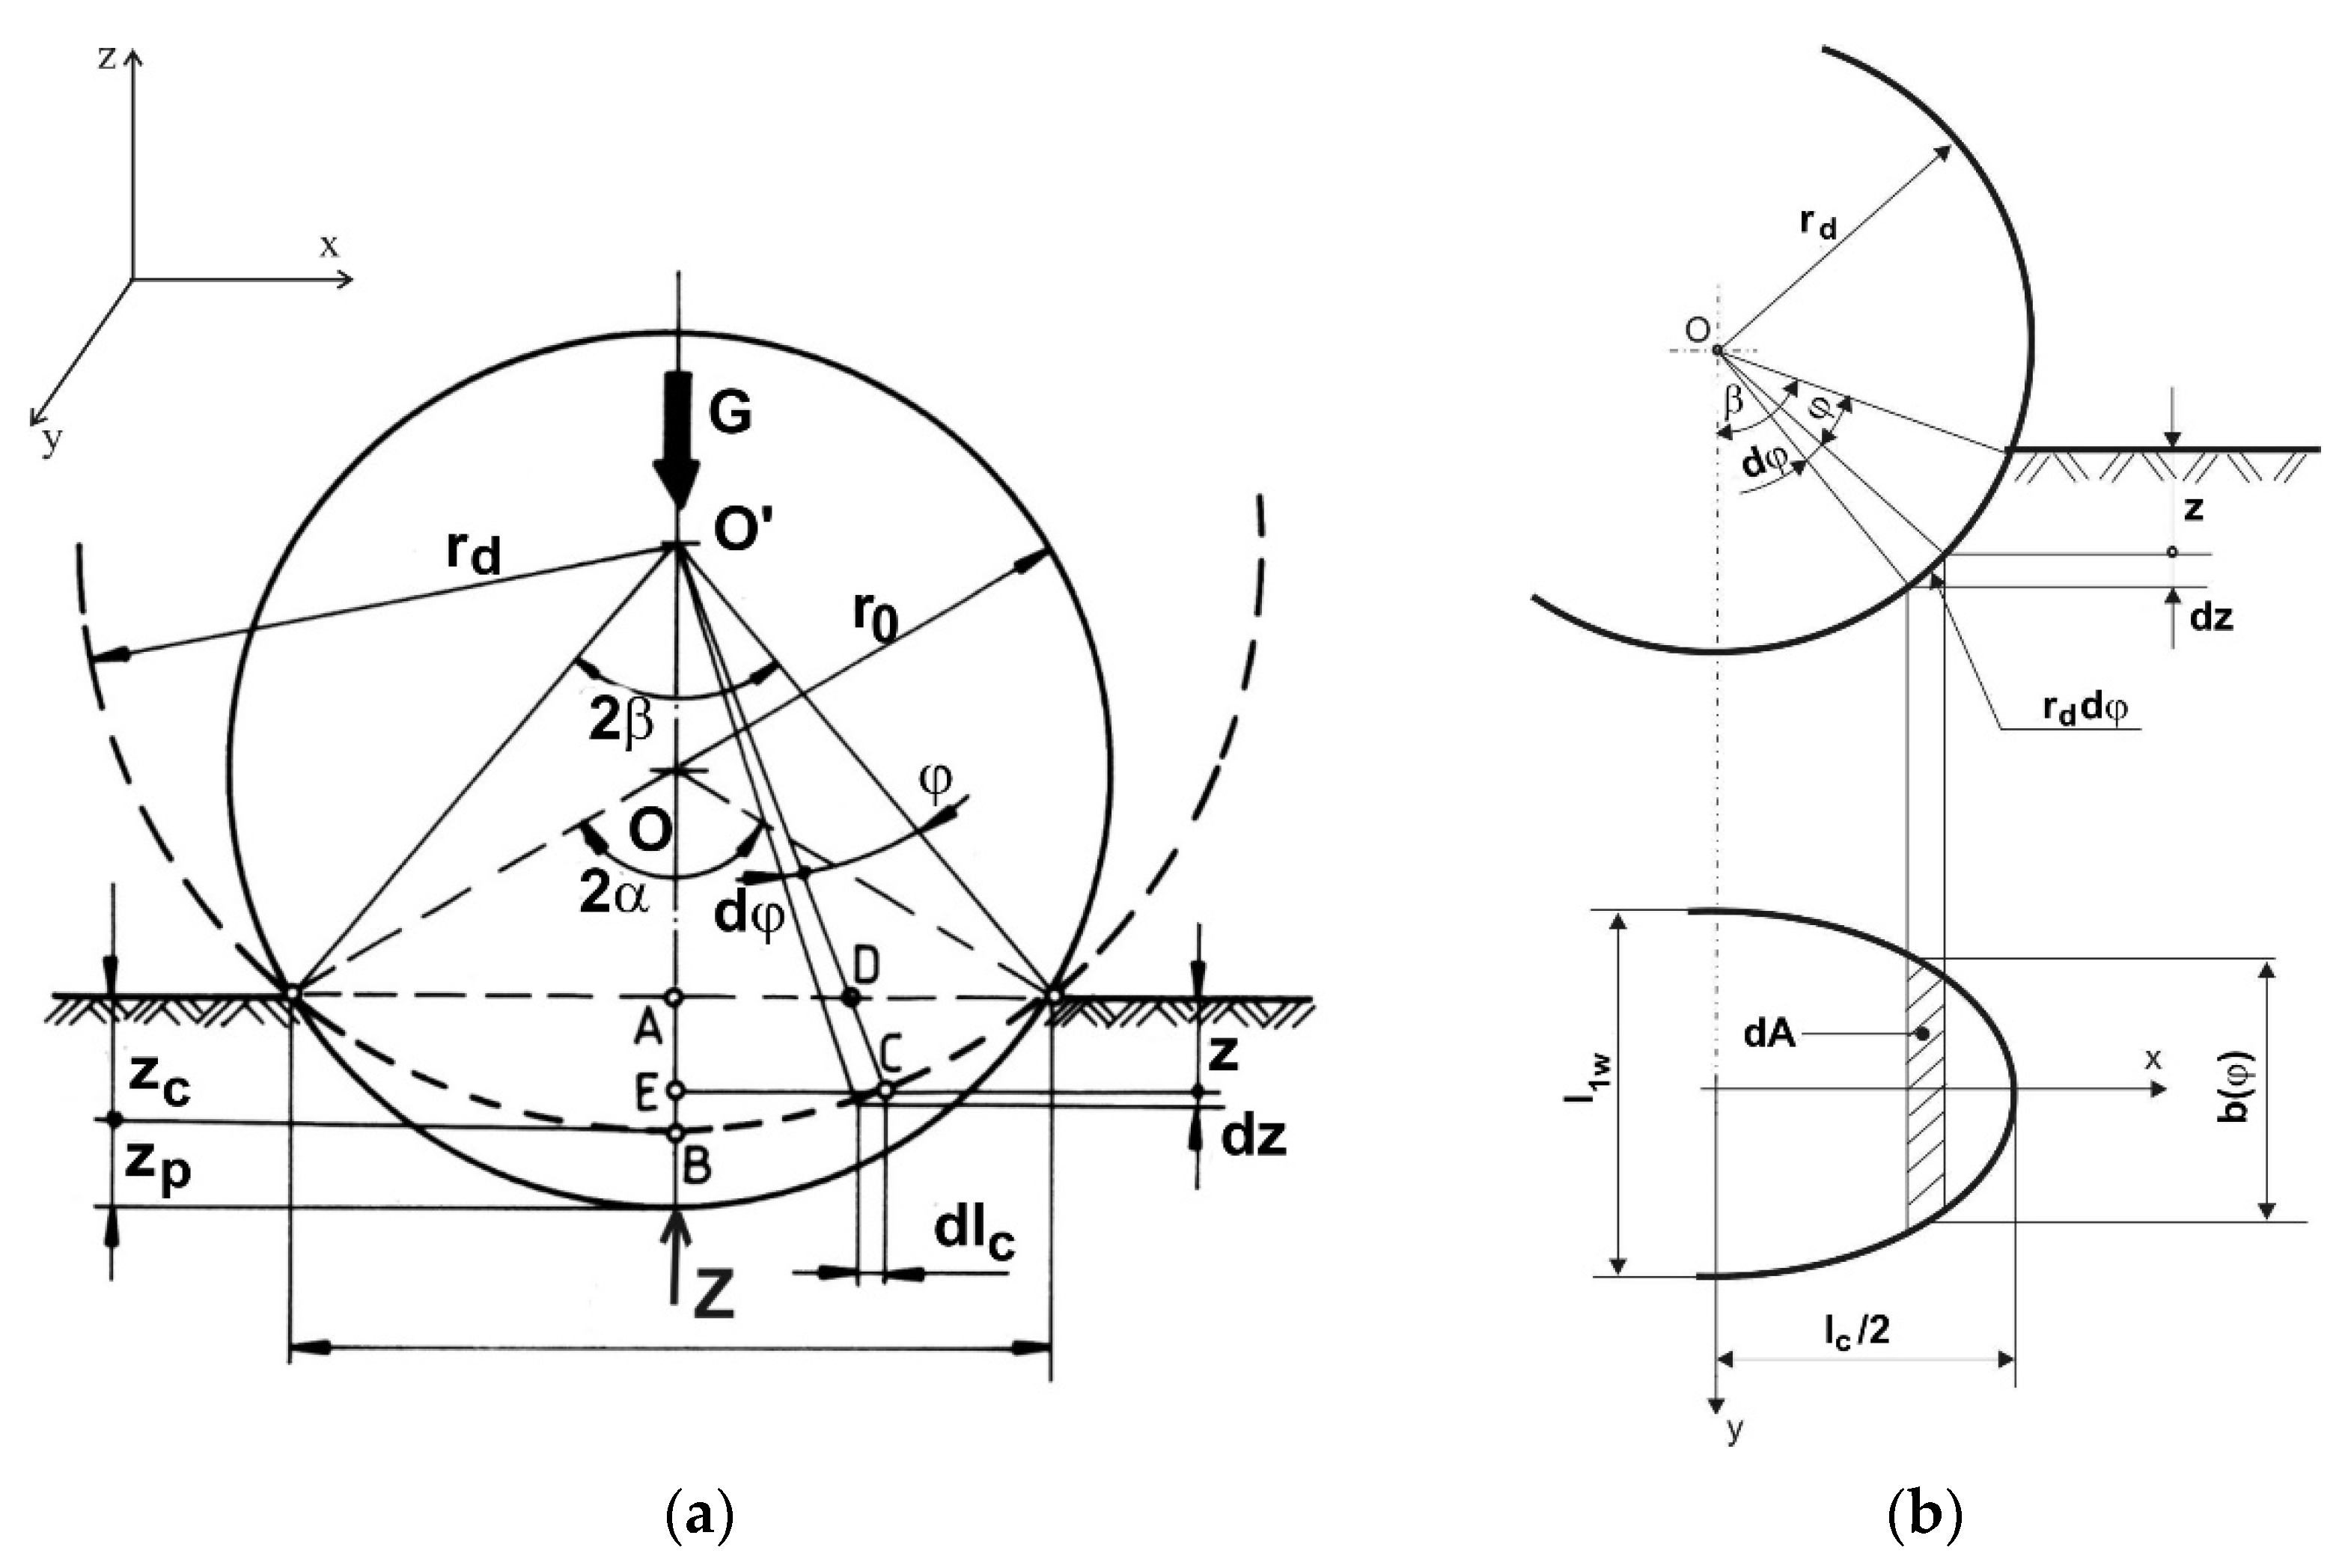
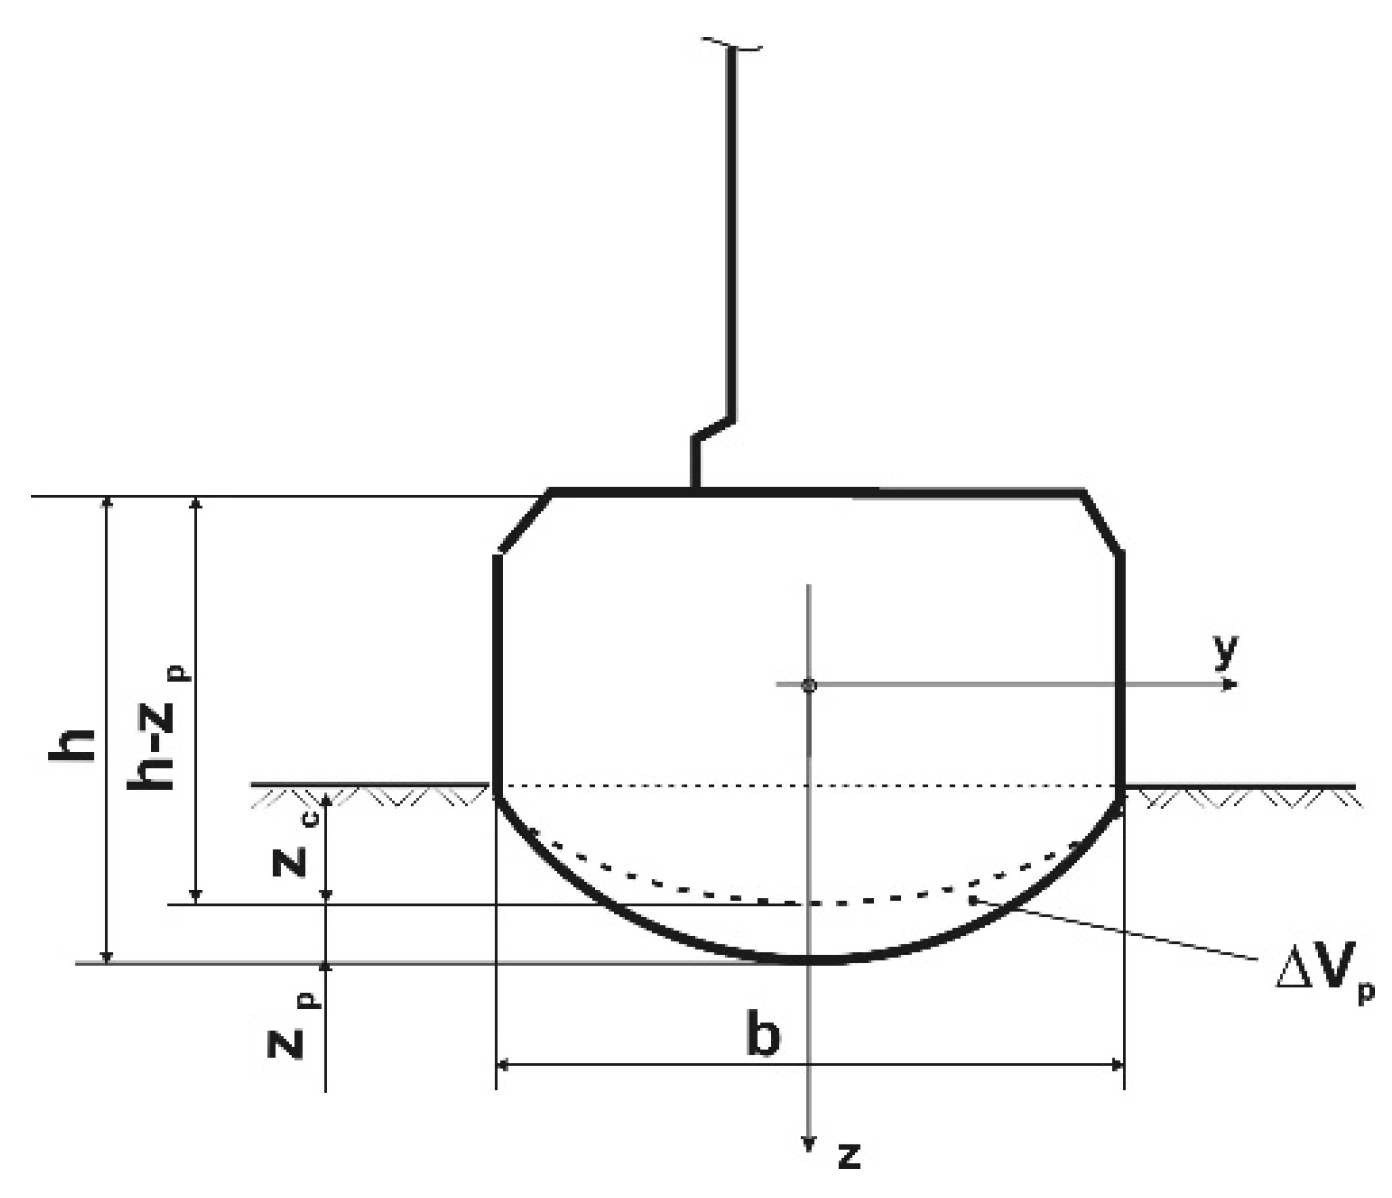
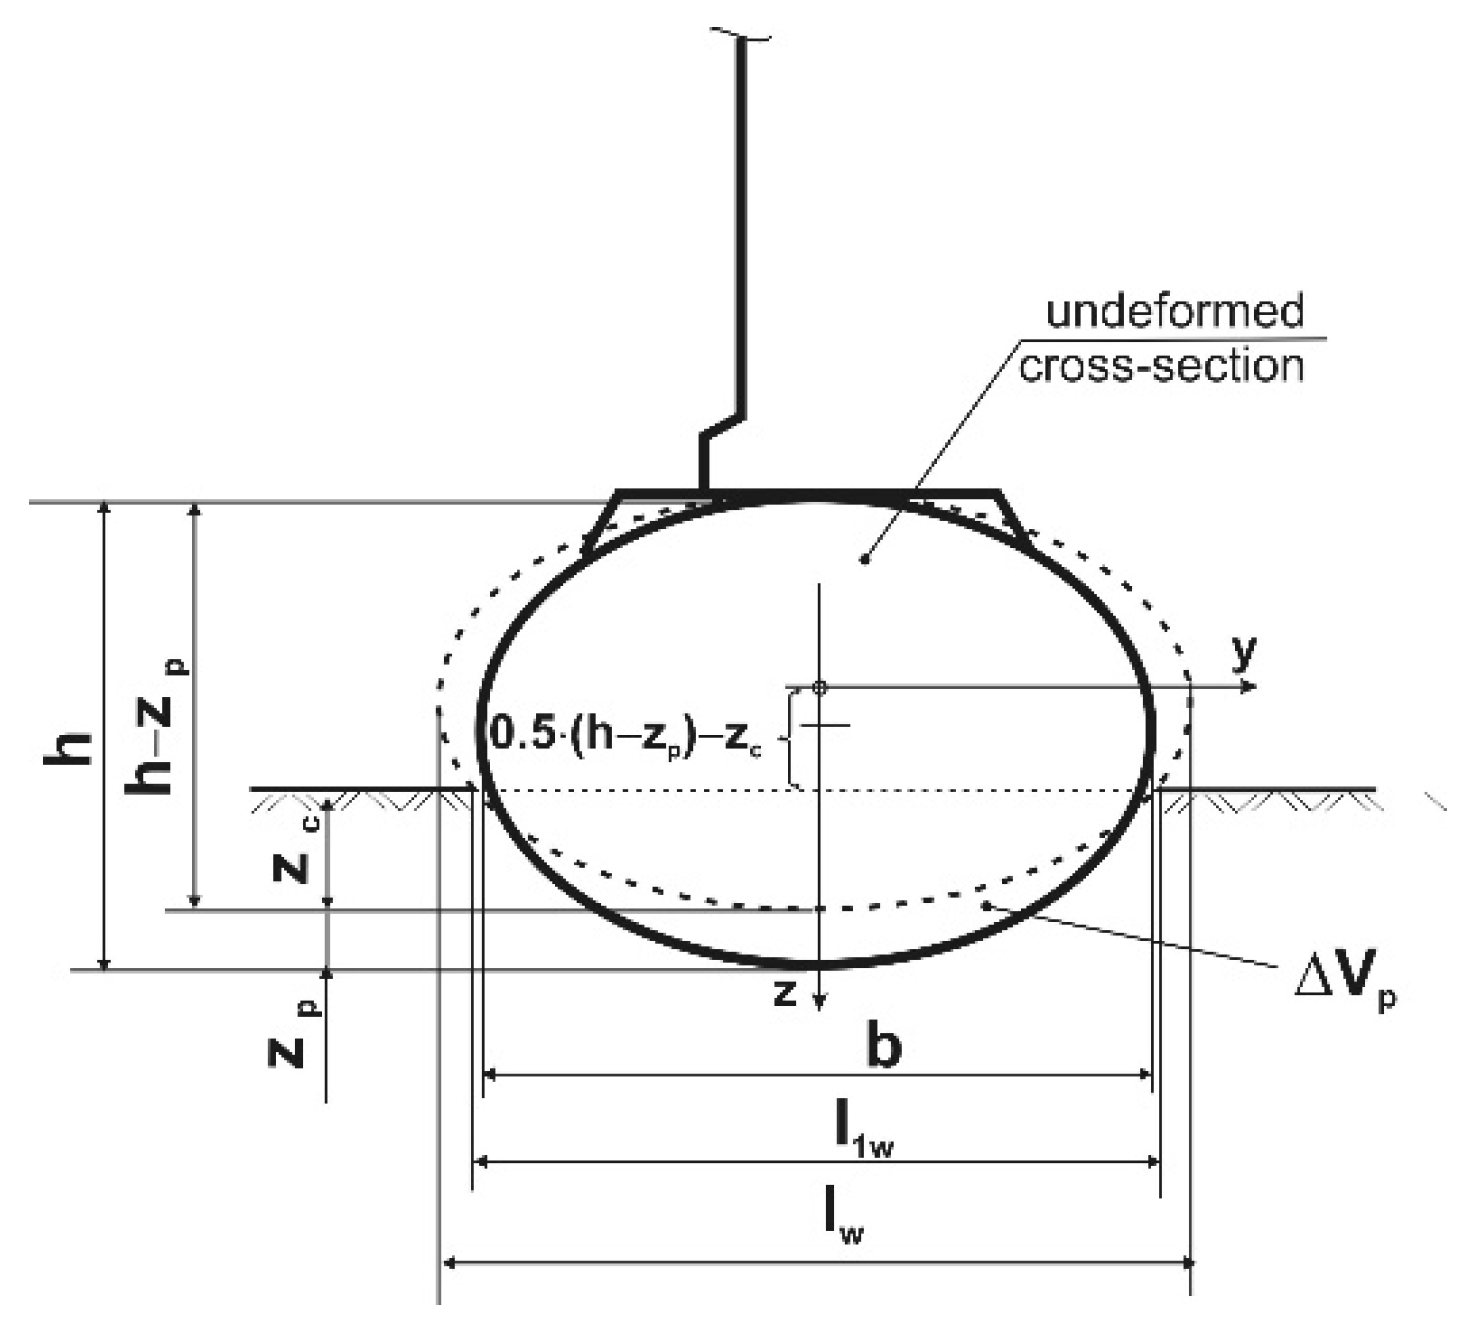
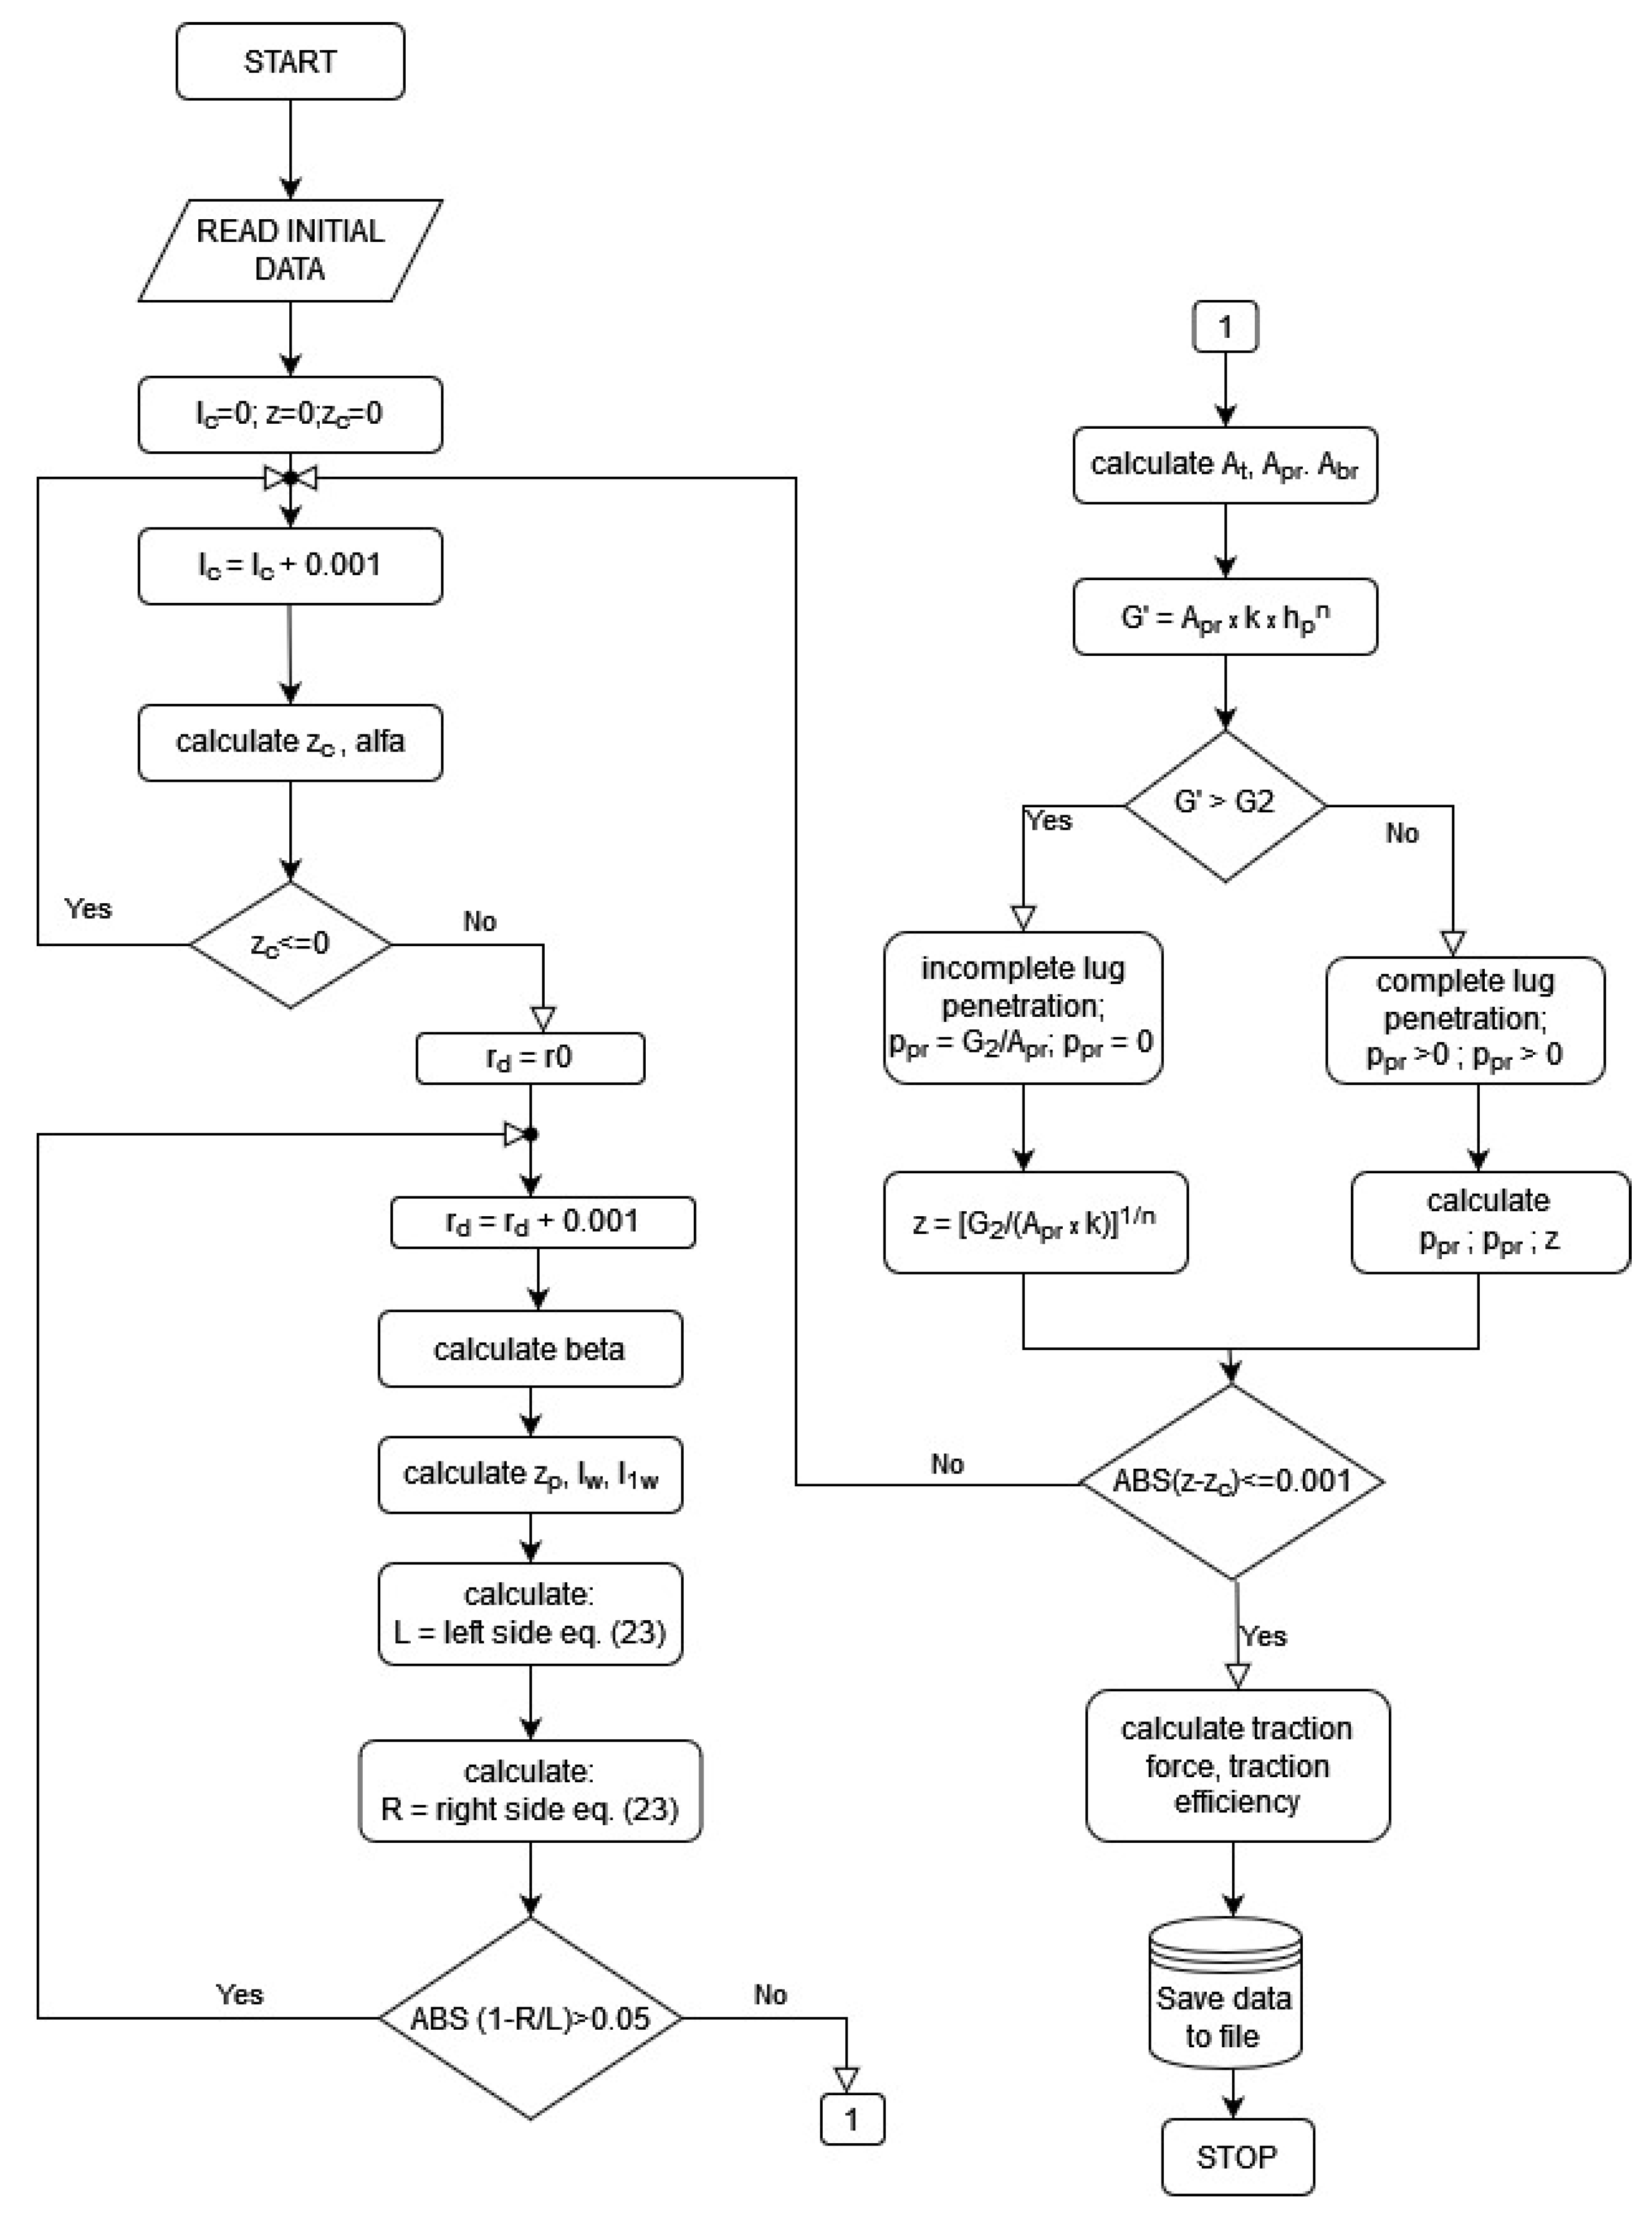
2.1. Formulation of the Improved Model

The evaluation of the tire–ground contact area is based on the schematics shown in Figure 1, starting from the one presented by Rosca, Carlescu, and Tenu (2014) [12]. It was modified according to the assumption that the width of the contact patch is smaller than the width of the tire (Figure 2 and Figure 3).
According to the schematics shown in Figure 1a, as an effect of the vertical load G applied to the wheel the height of the tire section decreases with zp and the radius of the tire, in the contact area, increases from r0 to rd; in the same time, the tire sinks into the soil at the depth zc. The shape of the tire–ground contact patch was considered to be a super ellipse [13].
Based on schematics presented in Figure 1, the following equations may be obtained:
lc = 2 · rd · sinβ = 2 · r0 · sinα,
z c = r 0 z p r 0 cos β ,
z p = r 0 ( 1 cos α ) r d ( 1 cos β ) .
While in the initial model the width of the contact patch was considered to be equal with the width b of the tire (Figure 2), in the present model it was considered that the tire cross section was deformed due to vertical load, preserving its elliptical shape, so that the width of the tire increased from b to lw and the minor axis of the super ellipse contact patch became l1w < lw (Figure 3).
The width of the tire under load, lw, was calculated assuming that the perimeter of elliptical cross-section is the same for the no load/load conditions:
l w = b 2 + 2 h z p z p 2 .
Using the geometry presented in Figure 1 and Figure 3 the minor axis of the super ellipse contact area was calculated with the equation:
l 1 w = l w 1 ( h z p 2 z c ) 2 ( h z p ) 2 .
Assuming that the tire is perfectly elastic we get [14]:
G = Z = q p Δ V ,
where qp is the volume stiffness of the tire and ΔVp is the variation of the tire volume (no load/load conditions) in the tire–ground contact zone.
With the notations shown in Figure 3, the tire volume change ΔVp becomes:
Δ V p = 0.5 π [ α r 0 b h β r d l w ( h z p ) ] .
The relationship between vertical pressure p and sinkage z [15]:
p = k z n ,
was applied for the tire under vertical load, finally leading to:
G = k 0 2 β r d n + 1 [ cos ( β ϕ ) cos β ] n b ( ϕ ) cos ( β ϕ ) d ϕ ,
where φ is the current angle, as shown in Figure 1b, and b(φ) was obtained assuming that the contact patch is a super ellipse:
b ( ϕ ) = 2 y = l c 2 l 1 w k [ 2 l 1 w r d sin ( β ϕ ) ] k l c k k ,
where k is the exponent of the super ellipse.
As the tire was considered to be perfectly elastic, Equations (6), (7) and (9) led to:
k 0 2 β b ( ϕ ) r d n + 1 [ cos ( β ϕ ) cos β ] n cos ( β ϕ ) d ϕ = q p 0.5 π [ α r 0 b h β r d l w ( h z p ) ] .
The system consisting of Equations (1)–(3) and (11) must be solved in order to obtain the parameters of the contact patch (minor axis, major axis, tire deflection under load, tire sinkage, area of the contact patch). A computer program was created for solving the system, based on an iterative process, in which the value of the major axis of the contact patch was increased by one millimeter at each calculation step until the relative difference between the calculated tire deflection and the measured one became lower than 1%. Figure 4 presents the flowchart of the computer program.
After the parameters of the tire–ground interface were obtained, the same procedure as the one presented in [12] was used to calculate the traction force and traction efficiency; thus, it was considered that the traction force developed by the tire depends on the shear stress in the tire–soil interface, which was calculated using the Janosi and Hanamoto equation [16]:
τ = τ max ( 1 e J K ) ,
where K is the soil shear deformation modulus and J is the shear displacement
The maximum shear stress τmax was evaluated based on soil cohesion, c [kPa], the vertical pressure, p [kPa] and the internal friction angle, γ, which were taken into account for the Mohr-Coulomb equation [17]:
τ max = c + p t g γ .
The maximum shear stress was calculated for both the lug-soil contact (τmaxp) and for the under tread-soil contact (τmaxb) [18,19]:
τ max = A p r A t τ max p + ( 1 A p r A t ) τ max b ,
where Apr is the area of the contact surface between the tire lugs and ground and A is the overall area of the tire–ground contact patch:
A t = 2 0 l c / 2 b ( ϕ ) d x .
According to some authors [20] the surface of the area where soil shear occurs, under the effect of the tangential force exerted by the tire, is affected by wheel slip:
A s h = A t [ 1 ( 1 s ) e c 1 l c n s m ] ,
where s is the wheel travel reduction (wheel slip) and c1, m and n are constants. It was decided that this assumption must also be investigated and, as a result, the tangential force of the wheel was calculated as:
  • F t = τ A t , when the entire contact area was considered as sheared area;
  • F t = τ A s h , when the hypothesis of the variable shear area was considered.
The net traction force and traction efficiency were calculated using the formulae given by the ASAE D497.7 standard [21]:
F N = F t R r ,
η t r = ( 1 s ) ( 1 R r / F t )
where Rr is the rolling resistance of the wheel, based on the wheel numeric, Bn, cone index, CI, and tire sidewall height, h [21]:
R r = G ( 1 B n + 0.04 + 0.5 s B n ) [ k N ] ,
B n = C I b d G ( 1 + 5 z p h 1 + 3 b d ) .

2.2. Goodness-of-Fit Analysis

A goodness-of-fit analysis was performed for the validation of the predicted data against the experimental data; the analysis took into account the following criteria [22]:
  • percentage of points within the 95% confidence interval of data (Pw95CI);
  • mean absolute deviation (MAD):
M A D = i = 1 n | m i d i | n ,
where mi is the model value for point i, di is the corresponding experimental data average value and n is the total number of points;
  • root mean squared deviation (RMSD):
    R M S D = i = 1 n ( m i d i ) 2 n ,
  • mean scaled absolute deviation (MSAD);
    M S A D = i = 1 n | m i d i | n i n s i ,
    where ni is the number of values contributing to each experimental data mean di (ni = 9) and si is the standard deviation for each data mean (e.g., MSAD = 1.5 means that the average difference between model and experimental data is 1.5 standard errors);
  • Pearson correlation coefficient r2.

2.3. Tested Variants

As the aim of the study was to produce a better model for the wheel–soil interaction, three theoretical models were investigated:
  • The initial model, as presented in a previous paper [12];
  • The improved model, which took into account the deformation of the tire cross section and a variable shear area (Equation (16));
  • The improved model, considering the tire cross-section deformation and a constant shear area (Equation (15)).
All the above models were developed for the case of the 2WD tractor with an output power of 65 HP (U-650, Tractorul, Brasov, Romania), and Table 1 summarizes its characteristics. The soil parameters required by the models are presented in Table 2.
The data for the goodness-of-fit analysis were obtained through field tests. The tests were performed during ploughing operations, when wheel slip achieves a maximum value of 30%, and higher wheel slip could cause topsoil damage, soil compaction and soil erosion [23].
The tractor was equipped with a dynamometric contraption for measuring the traction force; drive wheel slip was measured using rotation sensors mounted on the wheels.

3. Results and Discussion

3.1. Geometry of the Tire–Ground Contact Patch and Maximum Shear Stress
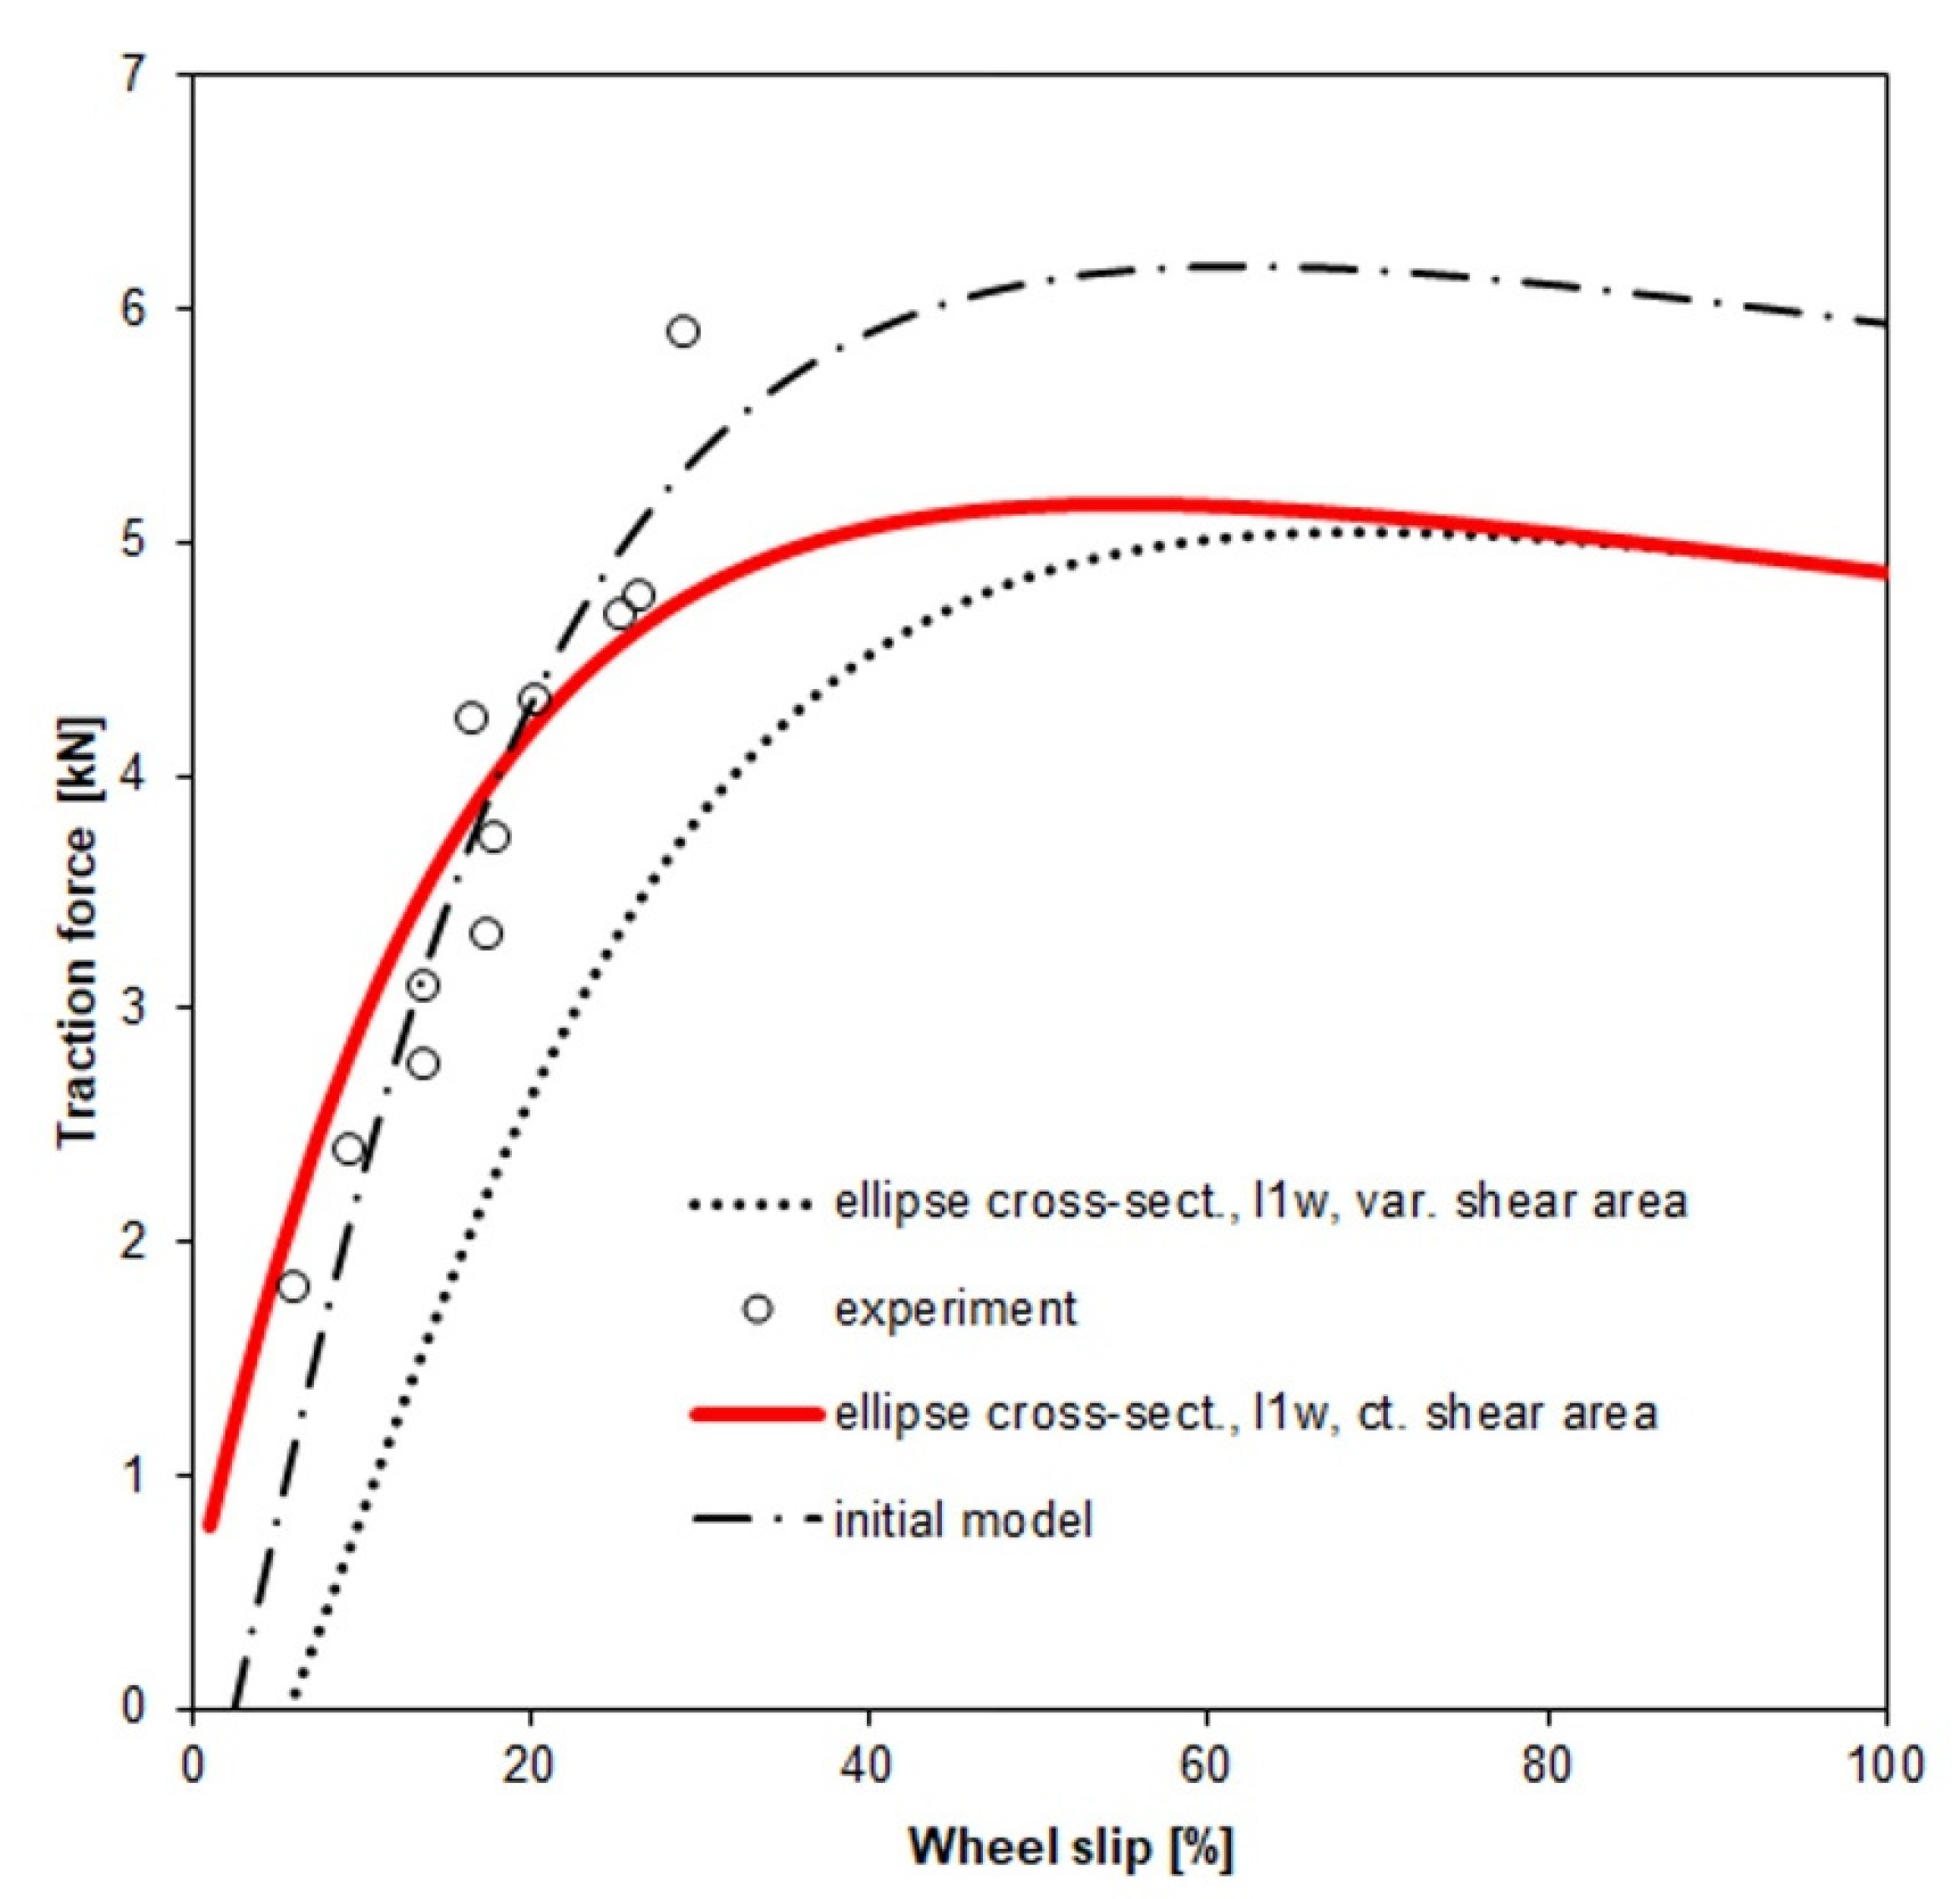
The results presented in Table 3 clearly show that for the improved model, the hypothesis of constant/variable shear area had no effect on the geometry of the contact patch; this was to be expected because the shear area was taken into account in a later stage of the calculation process, when the traction force and traction efficiency were evaluated.
The improved model predicted a slightly greater major axis of the tire–ground contact super ellipse, lc (0.534 m vs. 0.53 m for the initial model).
In the meantime, for the improved model, the minor axis of the contact super ellipse decreased to 0.222 m (compared with 0.367 m, the tire width in the initial model; thus, the predicted area of the contact tire–soil surface diminished from 0.145 m2 for the initial model to 0.1086 m2 for the improved model.
The smaller area of the contact patch led to the tire sinking deeper into the soil (2.75 cm for the improved model compared with 2.71 cm for the initial model) and also to a higher maximum shear stress (61 kPa vs. 53 kPa).

3.2. Traction Force

The results regarding the traction force of the tire (theoretical and experimental data) are presented in Figure 5; as was mentioned before, wheel slip was not allowed to exceed 30% during the field tests, so no data was available for wheel slips higher than 30%.
The data shown in Figure 5 indicate the modified model based on the deformable tire cross-section and constant tire—soil shear area, and the initial one provided the most reliable results. These models predicted quite similar results for wheel slips up to 25%. For higher wheel slip, the traction force predicted by the initial model exceeded the values provided by the modified model by 8.3–21.8%. As there were no experimental results available for this situation, it is not clear which model would more adequately describe the tire–soil interaction in terms of traction force under these circumstances, although the operation of the tractor-agricultural implement in these conditions is not recommended [23].
The model based on the deformable cross section of the tire and variable shear area (affected by wheel slip) predicted much lower traction force when compared with the experimental data. This result led to the conclusion that this model did not adequately describe the tire–soil interaction.
However, for the modified model, the differences between the traction force predicted by the variable and constant shear area assumptions diminished when wheel slip exceeded 60%; the cause of this remains to be investigated, although this situation must be avoided in practice, as mentioned above.
In order to get a better assessment of the correspondence between calculated and experimental data, Table 4 presents the results regarding the goodness-of-fit analysis.
The results show that although the modified model based on the constant tire–soil shear area achieved a slightly lower r2 when compared with the initial model (but only by 2.7%), it led to more favorable the goodness-of-fit criteria: PwCI = 88.9%, MSAD = 1.184 (the lowest value) and an acceptable RMSD (0.4952, which was only 13% higher than the value achieved by the initial model). These results led to the conclusion that this model more accurately described the tire–soil interaction process and justified the need for developing a more reliable model.
The modified model based on the variable tire–soil shear area led to the highest Pearson coefficient (0.981), which seemed to be encouraging. Unfortunately, all the other parameters considered for the goodness-of-fit analysis achieved unfavorable values: The average difference between the model and experimental data was 1.685 standard errors, only 11.1% of the model data points were within the 95% confidence interval of the corresponding experimental data, and the mean scaled absolute deviation recorded a very high value of 8.817. It should be noted that some of these parameters describe a model that was even worse, in some aspects, than the initial one.

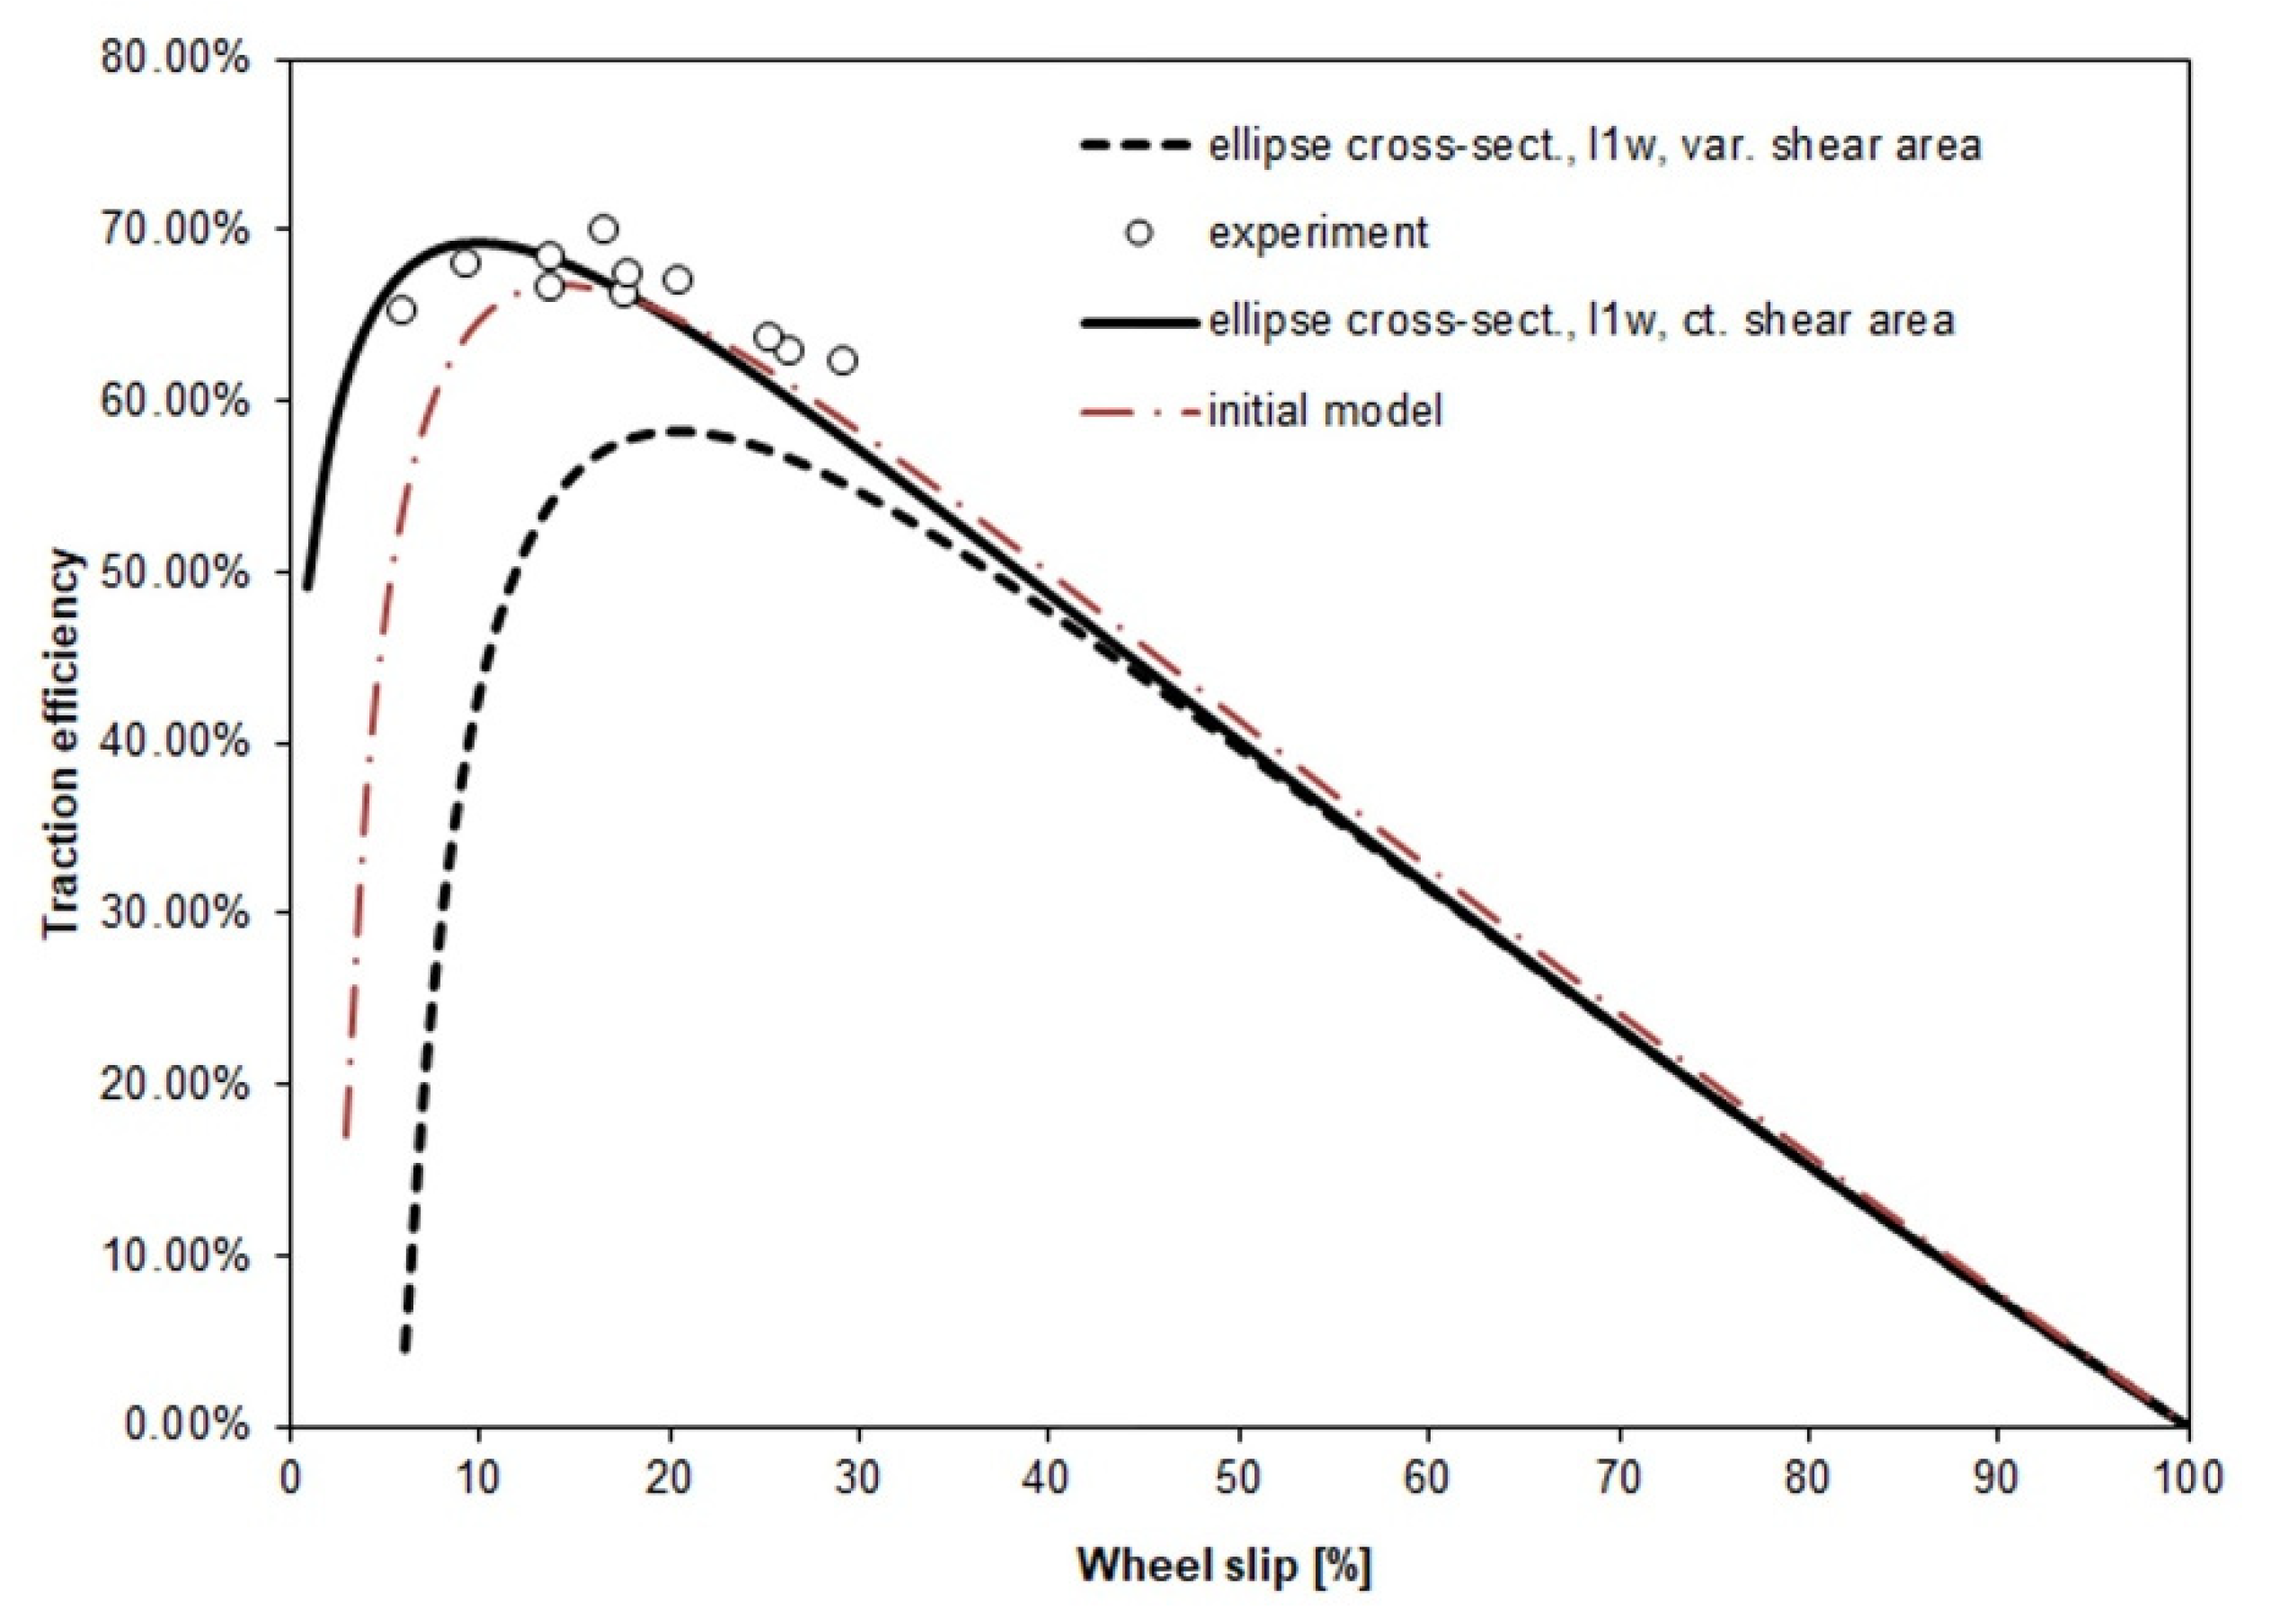
3.3. Traction Efficiency

The data presented in Figure 6 indicated that the modified model based on the deformable tire cross section and a tire–soil shear area independent of wheel slip provided the most reliable results in comparison with the experimental findings.
In the meantime, the initial model and the one based on the constant tire–soil shear area provided quite similar data when wheel slip was in the range of 15–30%. For lower values of wheel travel reduction, the values predicted by the initial model were lower than the experimental ones.
The model based on the deformable tire cross-section and variable shear area proved to be the most inaccurate also in terms of traction efficiency, providing much lower values for wheel slip up to approx. 30% (which is the domain of interest in agricultural field operations).
For wheel slip exceeding 30 to 40%, all the analyzed models predicted practically similar values of the traction efficiency, with the differences being lower than 5% with reference to the initial model. The cause of this remains to be investigated in the future in order to develop a model suited for these conditions.
The results of the goodness-of-fit analysis, shown in Table 5 confirm that the aim of the paper was reached: the modified model based on the deformable tire cross-section and a constant shear area was more accurate in predicting the traction efficiency of the tire. The Pearson coefficient significantly increased, from 0.203 in the initial model to 0.838; MAD, MSAD and RMSD decreased significantly (approx. 3 times for MAD and RMSD and even 16.6 times for MSAD; remarkably, the percentages of model data points were within the 95% confidence interval of the corresponding experimental data points).

4. Conclusions

A tire–soil interaction model was discussed in this paper; the model is an improved variant of a previous one, and it aimed to provide better predictions regarding the traction efficiency of an agricultural tire. While the previous model provided good theoretical results in terms of wheel traction force, it showed relatively poor results regarding the traction efficiency, emphasized by the goodness of fit between the theoretical and experimental data. In the new model, the deformation of the tire cross section under vertical load was taken into account.
The hypothesis of the deformable tire cross section led to different results regarding the geometry of the tire–ground contact and also changed the results regarding the traction force and traction efficiency.
The results of the goodness-of-fit analysis proved that the aim of this enterprise was achieved, at least for wheel slip, within the recommended limits for agricultural operations (0–30%). For the traction force, the Pearson coefficient only slightly decreased, while the percent of model data points within the 95% confidence interval of the experimental data significantly increased.
The most important achievement of the new model was the improvement of the predictions for the traction efficiency: the Pearson coefficient significantly increased, while all the other parameters of the goodness-of-fit analysis improved.
Future research should be aimed at developing a model for high wheel-slip conditions (over 30%); moreover, as in this stage, the presented results are valid only for the specific soil conditions from the test field; more experiments on terrains with different soil characteristics should be performed with the aim of extending the validity of the upgraded model based on the constant shear area.

Author Contributions

Conceptualization, R.R. and I.Ţ.; methodology, P.C. and C.P.; software, R.R.; validation and formal analysis, P.C. and V.V.; investigation, R.R. and V.V.; writing—original draft preparation, R.R.; writing—review and editing, R.R. and P.C.; supervision, I.Ţ. All authors have read and agreed to the published version of the manuscript.

Funding

This research received no external funding.

Data Availability Statement

The data presented in this study are available on request from the corresponding author.

Conflicts of Interest

The authors declare no conflict of interest.

References

  1. Sheludchenko, B.; Sarauskis, E.; Kukharets, S.; Zabrodsky, A. Graphic analytical optimization of design and operating parameters of tires for drive wheels of agricultural machinery. Soil Tillage Res. 2022, 215, 1–6. [Google Scholar] [CrossRef]
  2. Aniofantis, A.S.; Cutini, M.; Bietresato, M. An experimental-numerical approach for modeling the mechanical behavior of a pneumatic tyre for agricultural machines. Appl. Sci. 2020, 10, 3481. [Google Scholar] [CrossRef]
  3. Catalan, H.; Linares, P.; Mendez, V. Tractor_PT: A traction prediction software for agricultural tractors. Comput. Electron. Agric. 2008, 60, 289–295. [Google Scholar] [CrossRef]
  4. Farhadi, P.; Golmohammadi, A.; Malvajerdi, A.S.; Shahgholi, G. Tire and soil effects over power loss: Measurement and comparison with finite element results. J. Terramech. 2020, 92, 13–22. [Google Scholar] [CrossRef]
  5. Yamashita, H.; Jayakumar, P.; Alsaleh, M.; Sugiyama, H. Physics-based deformable tire-soil interaction model for off-road mobility simulation and experimental validation. J. Comput. Nonlinear Dyn. 2018, 13, 021002. [Google Scholar] [CrossRef]
  6. Hu, C.; Gao, J.; Song, X.; Tan, X. Analytical modeling and DEM analysis of soil-wheel interaction under cornering and skidding conditions in off-road vehicles. AIP Adv. 2021, 11, 085122. [Google Scholar] [CrossRef]
  7. Taheri, S. A Hybrid Soft Soil Tire Model (HSSTM) for Vehicle mobility and Deterministic Performance Analysis in Terramechanics Applications. Ph.D. Thesis, Mechanical Engineering, Virginia Polytechnic Institute and State University, Blacksburg, VA, USA, 28 August 2015. [Google Scholar]
  8. He, R.; Sandu, C.; Khan, A.K.; Guthrie, A.G.; Els, P.S.; Hamersma, H.A. Review of terramechanics models and their applicability to real-time application. J. Terramech. 2019, 81, 3–22. [Google Scholar] [CrossRef] [Green Version]
  9. Zieher, O.; Meiywer, M. Investigation of tire-soil-interactions using the discrete-element-method. In Proceedings of the IV International Conference on Particle-Based Methods—Fundamentals and Application “PARTICLES 2015”, Barcelona, Spain, 28–30 September 2015. [Google Scholar]
  10. Emam, M.A.A.; Shaaban, S.; El-Demerdash, S.; El-Zomor, H. A tyre-terrain interaction model for off-road vehicles. J. Mech. Eng. Res. 2011, 3, 226–238. [Google Scholar]
  11. Schmid, I.C. Interaction of the vehicle terrain results from 10 years research at IKK. J. Terramech. 1995, 32, 3–27. [Google Scholar] [CrossRef]
  12. Rosca, R.; Cârlescu, P.; Ţenu, I. A semi-empirical traction prediction model for an agricultural tyre, based on the super ellipse shape of the contact surface. Soil Tillage Res. 2014, 141, 10–18. [Google Scholar] [CrossRef]
  13. Keller, T. A model for prediction of the contact area and the distribution of vertical stress below agricultural tyres from readily available tyre parameters. Biosyst. Eng. 2005, 92, 85–96. [Google Scholar] [CrossRef]
  14. Ghiulai, C.; Vasiliu, C. Ground Vehicles Dynamics (In Romanian); Teaching and Pedagogy Publishing House: Bucharest, Romania, 1975; pp. 83–86. [Google Scholar]
  15. Rashidi, M.; Gholami, M. Muliplate penetration tests to predict soil pressure-sinkage behaviour. World Appl. Sci. J. 2008, 3, 705–710. [Google Scholar]
  16. Janosi, Z.; Hanamoto, B. The analytical determination of drawbar pull as a function of slip, for tracked vehicles in deformable soils. In Proceedings of the 1st Intl. Conference Mech. Soil-Vehicle Systems, Turin, Italy, 12–16 June 1961. [Google Scholar]
  17. Maclaurin, B. Comparing the NRMM (VCI), MMP and VLCI traction models. J. Terramech. 2007, 44, 43–51. [Google Scholar] [CrossRef]
  18. Abd El-Gawwad, K.A.; Crolla, D.A.; Soliman, A.M.A.; El-Sayed, F.M. Off-road tyre modelling I: The multispoke tyre model modified to include the effect of straight lugs. J. Terramech. 1999, 36, 3–24. [Google Scholar] [CrossRef]
  19. Adams, B.T. Central Tyre Inflation for Agricultural Vehicles. Ph.D. Thesis, Graduate College, University of Illinois at Urbana-Champaign, Champaign, IL, USA, 2002. [Google Scholar]
  20. Komandi, G. Reevaluation of the adhesive relationship between the tyre and the soil. J. Terramech. 1993, 30, 77–83. [Google Scholar] [CrossRef]
  21. American Society of Agricultural Engineers. ASAE D497.7:2011. Agricultural Machinery Management Data. Available online: https://elibrary.asabe.org/abstract.asp?aid=36431 (accessed on 20 June 2018).
  22. Schunn, C.D.; Wallach, D. Evaluating goodness-of-fit in comparison of models to data. In Psychologie der Kognition: Reden and Vorträge Anlässlich der Emeritierung; Tack, W., Ed.; University of Saarland Press: Saarbrueken, Germany, 2005; pp. 115–154. [Google Scholar]
  23. Battiato, A.; Diserens, E.; Laloui, L.; Sartori, L. A mechanistic approach to topsoil damage due to slip of tractor tyres. J. Appl. Sci. Appl. 2013, 2, 160–168. [Google Scholar] [CrossRef]
Figure 1. Schematics of the model [10]: (a) tire and soil deformation; (b) contact patch; zp—tire deflection under load; zc—tire sinkage into the soil; lc—length of the contact patch; l1w—width of the contact patch; G—vertical load; r0—radius of unloaded tire; rd—radius of loaded tire, in the contact area; α, β—contact angles; φ—current angle.
Agriculture 12 02035 g001
Figure 2. Tire cross section in the contact area (initial model).
Agriculture 12 02035 g002
Figure 3. Deformation of the tire cross−section in the contact area (upgraded model).
Agriculture 12 02035 g003
Figure 4. Flowchart of the computer program.
Agriculture 12 02035 g004
Figure 5. Traction force of the 2 WD tractor with 65 HP.
Agriculture 12 02035 g005
Figure 6. Traction efficiency of the 2 WD tractor with 65 HP.
Agriculture 12 02035 g006
Table 1. Characteristics of the U-650 tractor and drive wheels.
ItemSymbolValue
Load on the driving wheel, [kN]G11.75
Type of tire-14.00–38
Overall diameter of tire [m]d01.58
Tire width [m]b0.367
Lug width [m]bw0.04
Lug length [m]bL0.24
Lug height [m]bH0.025
Distance between lugs [m]-0.195
Table 2. Soil characteristics.
ItemSymbolValue
Soil deformation modulus [m]K0.05
Coefficients for the sinkage equationk55
n1.3
Soil cohesion [kPa]c25
Angle of internal friction [°]φ32
Cone penetrometer index [kPa]CI970
Table 3. Parameters for tire–ground interaction.
ItemModel
Initial ModelImproved Model,
Variable Shear Area
Improved Model,
Constant Shear Area
lc [m]0.5300.5340.534
lw [m]0.3670.3840.384
l1w [m]-0.2220.222
zc [m]0.02710.02750.0275
rd [m]1.4001.2571.257
At [m2]0.1450.10860.1086
τmax [kPa]53.361.261.2
Table 4. Goodness-of-fit analysis: traction force of the 2 WD tractor with 65 HP.
Parameter 1Tire–Ground Model
Initial ModelModified Model,
Variable Shear Area
Modified Model,
Constant Shear Area
r20.9210.9810.896
MAD0.33531.64080.3981
MSAD3.1168.8171.184
Pw95CI66.711.188.9
RMSD0.43791.6850.4952
1 r2—Person coefficient; MAD—Mean Absolute Deviation; MSAD—Mean Scaled Absolute Deviation; Pw95CI—Percentage of points within the 96% Confidence Interval; RMSD—Root Mean Squared Deviation.
Table 5. Goodness-of-fit analysis: traction efficiency of the 2 WD tractor with 65 HP.
ParameterTire–Ground Model Type
Initial ModelModified Model,
Variable Shear Area
Modified Model,
Constant Shear Area
r20.2030.7260.838
MAD0.05690.09530.0198
MSAD5.1471.9660.309
Pw95CI55.688.9100
RMSD0.0750.12790.0231
Publisher’s Note: MDPI stays neutral with regard to jurisdictional claims in published maps and institutional affiliations.

