Review

Pomegranate Quality Evaluation Using Non-Destructive Approaches: A Review

by
Emmanuel Ekene Okere
1,2,
Ebrahiema Arendse
1,
Alemayehu Ambaw Tsige
1,*,
Willem Jacobus Perold
2 and
Umezuruike Linus Opara
1,3,*
1
SARChI Postharvest Technology Research Laboratory, Africa Institute for Postharvest Technology, Faculty of AgriSciences, Stellenbosch University, Stellenbosch 7600, South Africa
2
Department of Electrical and Electronic Engineering, Stellenbosch University, Private Bag X1, Matieland 7602, South Africa
3
UNESCO International Centre for Biotechnology, Nsukka 410001, Nigeria
*
Authors to whom correspondence should be addressed.
Agriculture 2022, 12(12), 2034; https://doi.org/10.3390/agriculture12122034
Submission received: 14 October 2022 / Revised: 13 November 2022 / Accepted: 18 November 2022 / Published: 28 November 2022

Abstract

:
Pomegranate (Punica granatum L.) is one of the most healthful and popular fruits in the world. The increasing demand for pomegranate has resulted in it being processed into different food products and food supplements. Researchers over the years have shown interest in exploring non-destructive techniques as alternative approaches for quality assessment of the harvest at the on-farm point to the retail level. The approaches of non-destructive techniques are more efficient, inexpensive, faster and yield more accurate results. This paper provides a comprehensive review of recent applications of non-destructive technology for the quality evaluation of pomegranate fruit. Future trends and challenges of using non-destructive techniques for quality evaluation are highlighted in this review paper. Some of the highlighted techniques include computer vision, imaging-based approaches, spectroscopy-based approaches, the electronic nose and the hyperspectral imaging technique. Our findings show that most of the applications are focused on the grading of pomegranate fruit using machine vision systems and the electronic nose. Measurements of total soluble solids (TSS), titratable acidity (TA) and pH as well as other phytochemical quality attributes have also been reported. Value-added products of pomegranate fruit such as fresh-cut and dried arils, pomegranate juice and pomegranate seed oil have been non-destructively investigated for their numerous quality attributes. This information is expected to be useful not only for those in the grower/processing industries but also for other agro-food commodities.

1. Introduction

For most fruit and vegetables, the four attributes that distinctly indicate quality are: color (appearance), flavor (taste, smell and aroma), texture and nutritional value [1,2,3] These attributes affect consumer acceptance, consumption and the usage of fruits and vegetables as well as their products [4]. In the last few decades, the improvement in society’s standard of living has led to a significant increase in fruit consumption [5]. Some of the most consumed fruits include apple, orange, kiwifruit, peach, grape, strawberry, grape, jujube, banana, mango and pomegranate, among others.
Fruit quality control, inspection and sorting are essential to ensure adequate quality and safety for fresh consumption and to earn a high return on investment [6,7,8]. A high-quality product is still of utmost importance, especially for the export market [9].
Pomegranate fruit is one of the most important fruits of the world and is consumed both as fresh and in processed form such as dried arils, juice, seed oil, etc. (Figure 1). It is a fruit-bearing spherically-shaped deciduous shrub or small tree [10]. It is composed of internal edible portions called arils, and each aril contains a seed that is surrounded by a translucent sac containing juice [11,12] and an outer hard thick covering called the peel [10]. In the past decades, the demand for pomegranate fruit has increased due to its nutritional and health benefits [13,14,15]. This global awareness has resulted in a considerable increase in the commercial farming of pomegranate fruit [16,17]. Recently, pomegranate fruit’s value-added produce has included its peels utilization as animal feed [18,19], as well as rich antioxidant, metabolomic peel extract [20,21].
Recent attention in food quality and safety have resulted in industry taking greater responsibility in finding alternative technological approaches for estimating the fresh quality of pomegranate fruit and its value-added produce [22,23,24].
Grading is one of the activities conducted in the industry to distinguish fruit quality. It is usually performed based on weight, size and external rind appearance [25]. At present, pomegranate fruit are sorted for external appearance based on just their thick rind [4,9]. However, the arils, which are delicate, can be damaged during handling and assuring their quality is crucial [23]. On the other hand, pomegranate fruit sorting should be simple and reliable [4,9]. Hence, fast and effective non-destructive methods have become urgently needed for quality detection.
Non-destructive/non-invasive approaches are recent advances in the evaluation and detection of the quality of horticultural fruit and their products [26,27,28,29,30]. Non-destructive testing (NDT) provides quantitative and qualitative fruit quality data without destruction of the sample [31]. Compared to traditional quality analysis methods, NDT allows analysis of intact fresh fruit without cutting open or destroying the fruit, making it best suited for online inspection.
Some of the widely used NDT techniques include: visible–infrared spectroscopy, Raman spectroscopy, nuclear magnetic resonance spectroscopy, X-ray CT and spectral imaging [32]. These techniques have been investigated for their potential as analytical tools for the quality evaluation of different food samples. Near-infrared spectroscopy (NIRS) and machine vision systems (MVS) have been the most successful technologies in the past few decades for the automatic quality inspection of fruits and vegetables [4]. Spectral imaging, which involves hyperspectral and multispectral imaging, is a hybrid system that utilizes imaging and spectral data for fruit quality analysis [22,23].
There are several published reviews that focus on the non-destructive quality measurement of fruits such as mangos [31], citrus [33] and watermelon [34]. Particularly for pomegranate fruit, several authors have written extensively on postharvest quality attributes and the benefits of pomegranate and its products [11,15,35,36]. To the best of our knowledge, no review has been published focusing on the non-destructive assessment of pomegranate fruit despite several applications of non-destructive assessment technologies for the quality assessment of pomegranate fruit. Therefore, the objective of this review is to evaluate recent technological advancements and applications of various non-destructive methods for the measurement and prediction of the external and internal quality attributes of pomegranate fruit and its products.

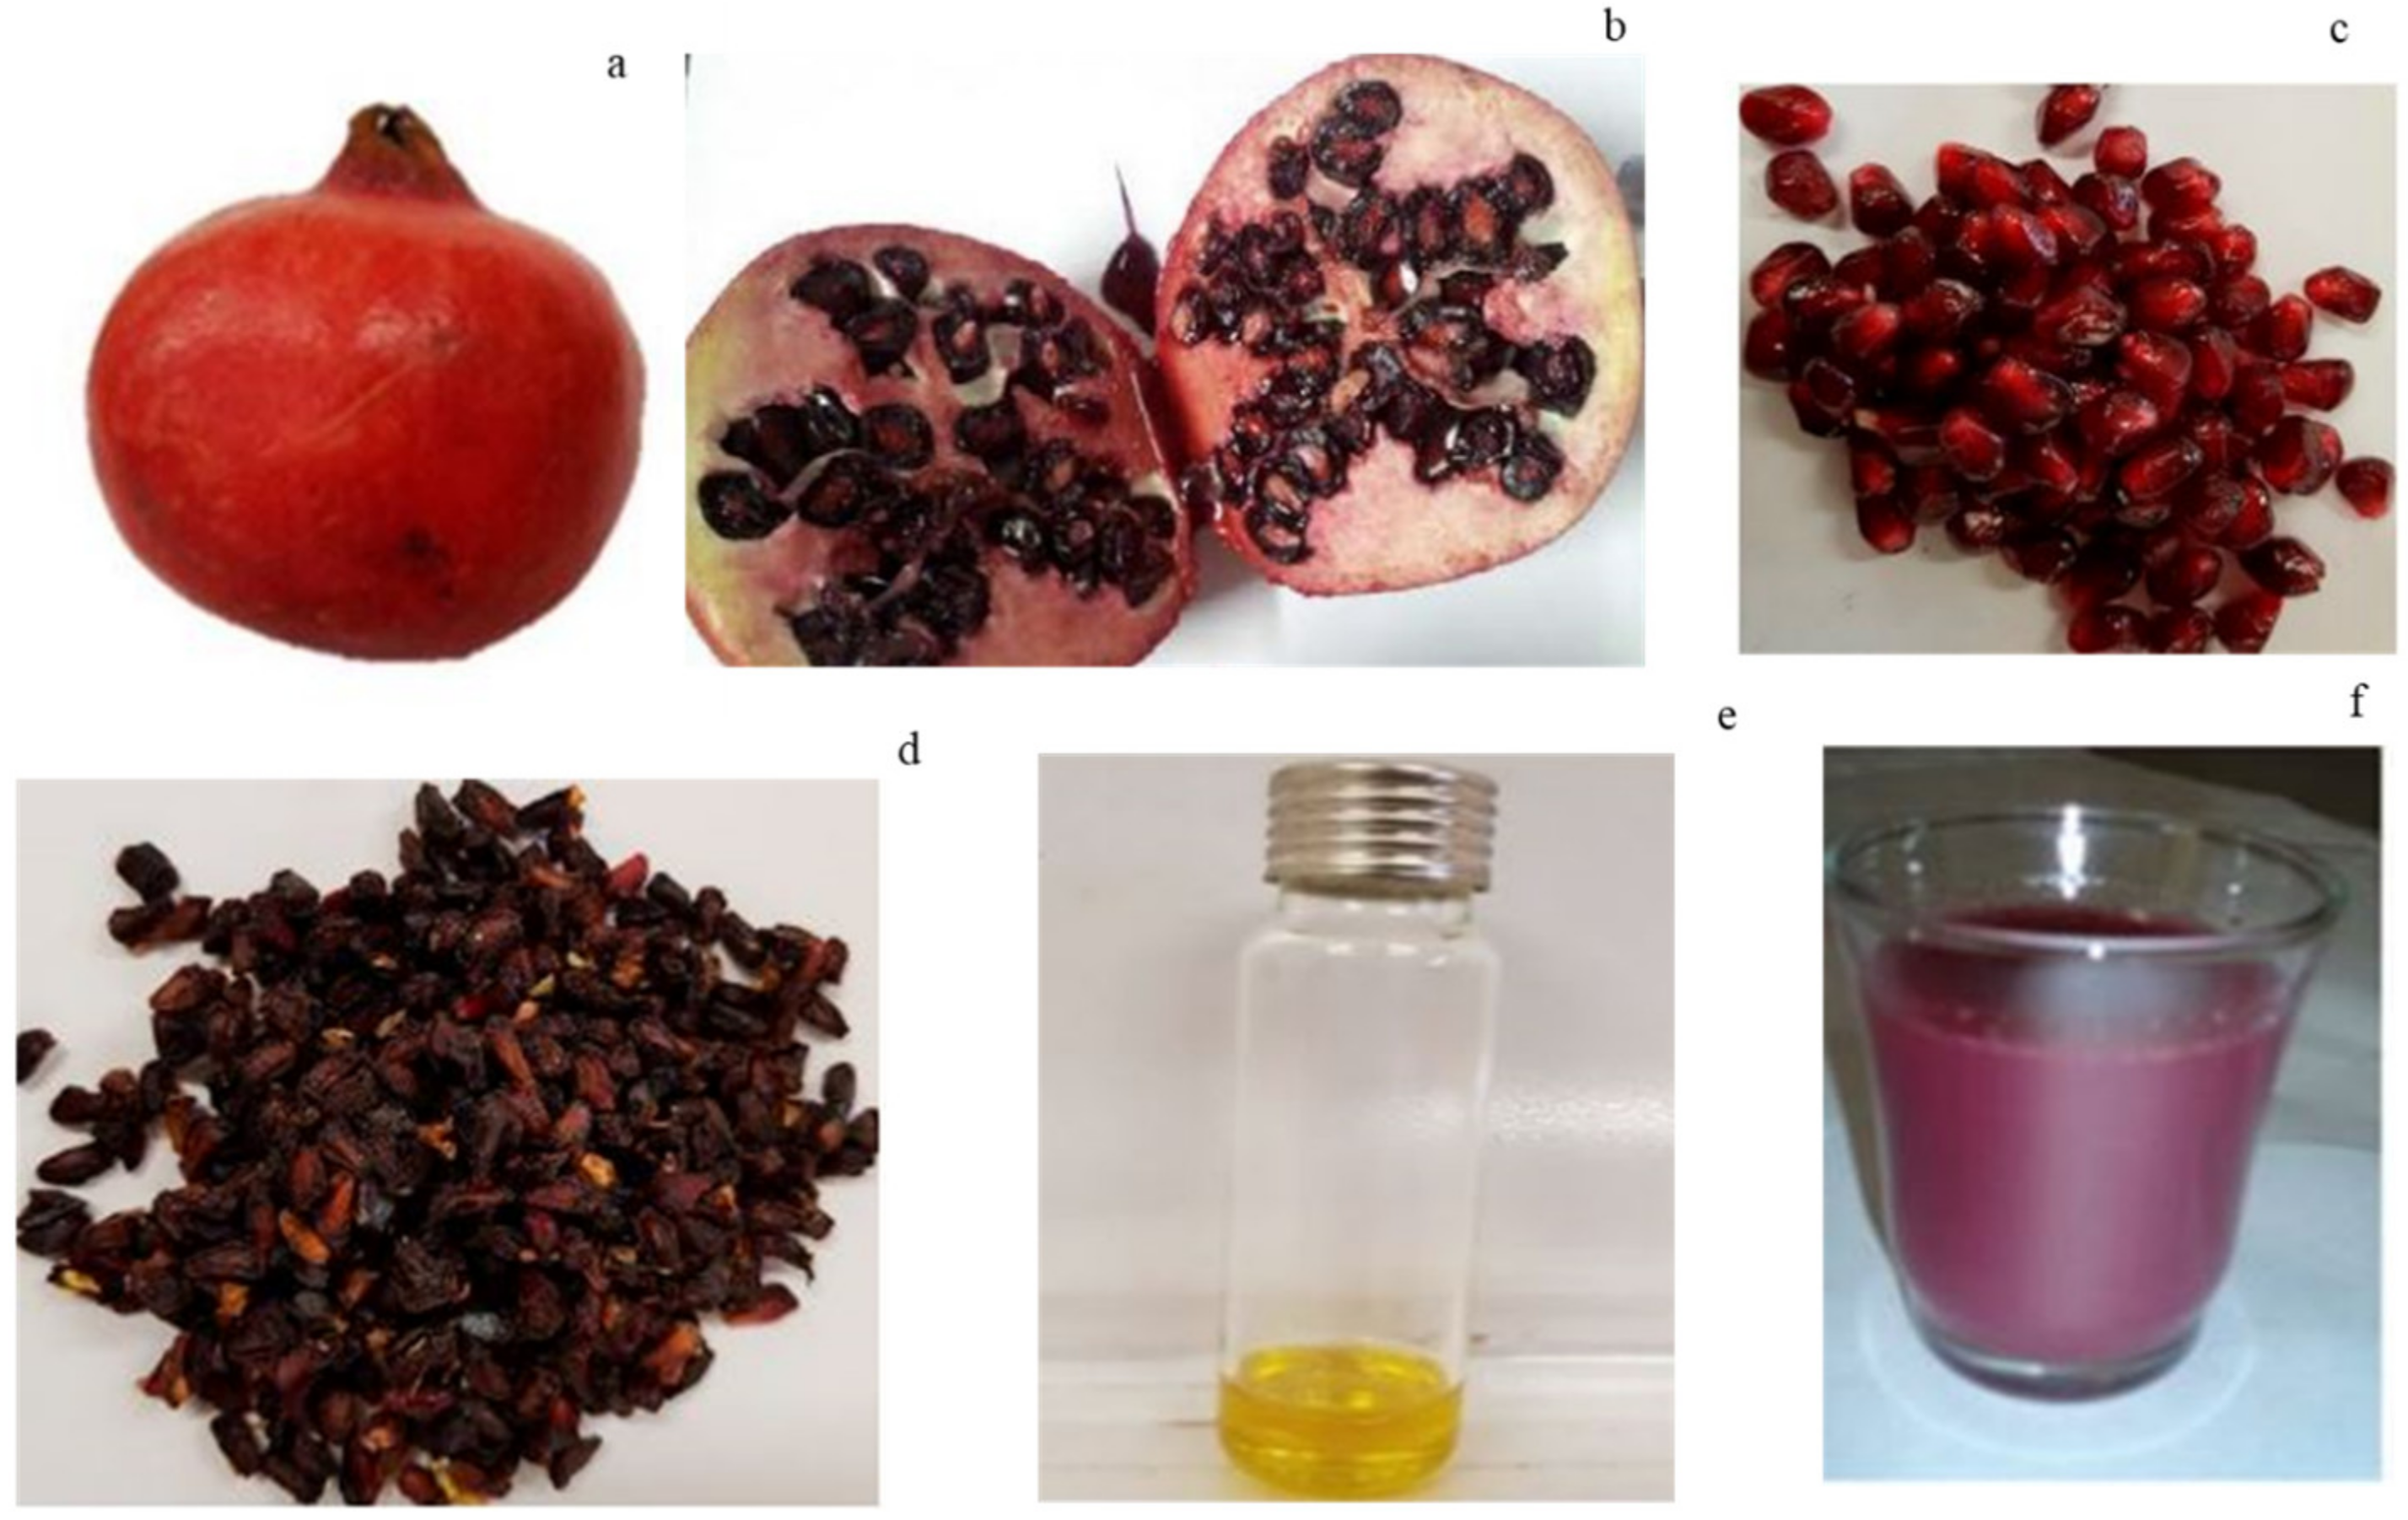
2. Quality Attributes of Pomegranate Fruit

The term “quality” can connote the subjective perception of different explicit parameters, which can be analyzed from different viewpoints [1,37,38]. Pomegranate fruit maturity is perceived by its color, firmness, surface features (glossiness and shriveling) and physicochemical qualities (TSS, TA, TSS/TA, pH) [3,13]. These attributes inform consumer acceptance, consumption and usage of this fruit as well as its products [4,39,40]. Quality assessment of pomegranate fruit evaluates a combination of appearance, taste, aroma and textural properties. Consumers judge initial quality based on external properties such as fruit mass, shape and skin appearance (color, free of cracks, sun scalds and bruises). Their repeated purchase is based on organoleptic properties related to internal attributes; these include total soluble solids (TSS), titratable acidity (TA), and flavor (sugar/acid ratio) and phenolic content [13]. Fruit external features such as sunburn, cracks and splits, and other mechanical damages such as bruises are also indices used to measure fruit quality and marketability by industry and packhouse operators [41,42]. There are over 1000 different pomegranate fruit cultivars with different internal and external quality attributes. These quality attributes may also vary depending on the growing region, growing season, fruit maturity status and cultivation practices [13,16]. Therefore, this section provides only a brief overview of the quality attributes used for evaluating pomegranate fruit and its products.

2.1. External Quality Attributes of Pomegranate Fruit

Fruit physical properties and condition (aril volume and juice content) play a key role in its commercialization (marketability, processing and profitability of the fruit). This is because these attributes influence the quality of processed products from the fruit and influence consumer behaviors on the consumption of fruits [13,16]. Color is one of the most important quality attribute as it determines whether a fruit is considered fresh or not [43]. To this end, color is one of the most widely measured product quality attributes in the postharvest handling and food processing industries. The color of pomegranate fruit is derived from its natural pigments. It changes over time as the fruit goes through maturation and ripening. The color of the pomegranate fruit is measured using colorimeter or Mansell color charts. For the colorimeter, color measurement is based on the CIE L*, a* and b* values. The L*, a*, and b* and C* values define the color space on which human color perception is based [44]. In defining these attributes, Pathare et al. [43] described the L* value as representing lightness, the a* value representing redness (+a*) or greenness (−a*), and the b* value representing yellowness (+b*) or blueness (−b*). Another index derived from color includes glossiness. Studies show the loss of gloss to be undesired and fruits with matt peel are rejected by consumers [6,8]. Consumer preference is towards fruit with a deep red, glossy, smooth and slightly shiny surface appearance [45]. Typical values for color attributes for pomegranate fruit at harvest maturity and its products are presented in Table 1.
Textural properties help to indicate how pomegranate fruit should be handled [46]. Furthermore, the texture of pomegranate informs how the fruit responds to physiological or pathological changes during maturation, ripening or storage [47]. Textural properties, which include the firmness, hardness and toughness of the kernel, are indicators of fruit resistance to bruise damage. Firmer pomegranate fruit and arils are reported to have low membrane lipid catabolism and a stable shelf-life and are thus less likely to be bruised during postharvest handling [46,48]. The typical firmness of pomegranate grown in South Africa varies between 312.05 N and 390.60 N for whole fruit firmness, 75.53 and 83.76 N (fresh aril) and 220.50 and 253.98 N (dried aril), as shown in Table 1.
Table 1. Summary of typical quality indicator values for intact pomegranate fruit and products.
Quality AttributesCultivarIntact FruitTypical ValuesReferences
Fresh ArilDried ArilSeed OilJuice
Weight (g)Bhagwa, Ruby250.0–509.8 [39,49]
Shape indexBhagwa, Ruby0.91–1.10 [39]
Volume (cm3) 220–300 [39]
Sphericity 1.02–1.08 [39]
Aril yield (%) 46.76–58.82 [39]
CIE colour coordinates (L*)Oman, Bhagwa, Ruby44.15–46.5125.00–30.8820.54–33.62 [10,15,39,49]
(a*) 40.33–43.1316.06–23.0712.26–24.44 3.37–4.73
(b*) 6.63–7.77 0.15–0.52
(C*) 48.35–53.3915.75–17.8212.84–29.83 3.38–4.77
(h°) 30.61–33.0723.85–25.81 12.00–27.10 3.12–3.30
Moisture (%)Oman, Bhagwa, Ruby 66.00–75.58
Total soluble solids (%)Ruby, Wonderful 28.917.5–22.2 50.1–77.3[49,50]
TSS (°Brix) 13.70–15.211.14–3.15 5.8–14.27
TA (%CA) 3.29–3.93
pHBhagwa, Ruby, Wonderful 3.60–3.87 [15,49]
Anthocyanins (mg/100 g)Wonderful 9.73 [49]
TPC (mg/100 g) 7.03 ± 0.19
TSS/TA [49]
PV (meqO2/kg)Wonderful, Herskawitz, Acco 0.04–0.35 [51]
RI 1.5215–1.5218
AV 43.39–125.262.00–14.22
TOTOX 105.92.53–14.30
TCC (mg β-carotene/100 g)Wonderful, Herskawitz, Acco 19.25–22.26 [52]
TPC (mg GAE/g) 1.91–3.45 [50,52]
YI (25 °C) 75.53–83.76 65.47–91.52
Firmness (N)Shavel, Bhagwa, Ruby101.33–154.6367.44–99.20 [45,46]
AV = anisidine value, TOTOX = total oxidation value, RI = refractive, PV = peroxide value, TPC = total phenolic content, TCC, total carotenoids content, GAE = gallic acid equivalence, YI, yellowness index, L*, lightness, a*, redness, b*, yellowness, C*, chroma, h°, hue.

2.2. Internal Quality Attributes of Pomegranate Fruit

The internal quality attributes of pomegranate fruit include the physicochemical, vitamin C content, etc. [15]. These quality attributes range in value depending on different factors [53]. Some of the significant amounts of bioactive compounds that constitute the internal quality attributes of pomegranate fruit includes phenolic acids, flavonoids and tannins. The internal fruit attributes indicate whether fruits can be processed or consumed fresh. Indicators such as the total soluble solids (TSS) and titratable acidity (TA) of a fruit are frequently used (Table 1). For instance, a high TSS and a low TA of a fruit means it can be consumed while fresh. Moreover, the ratio of TSS to TA of a fruit defines its maturity index (MI) [11,39].

2.3. Quality Attributes of Pomegranate Products

Minimally processed pomegranate arils are ready to eat and serve as an excellent dietary source [17]. The appearance of fresh arils varies from white to deep red depending upon the variety [17]. Fresh pomegranate arils have a short shelf-life of between 5 and 8 days [50]. Therefore, to extend their shelf-life, pomegranate arils are often processed into dried arils (Figure 1).
Dried pomegranate arils are products of pomegranate fruit and often referred to as “anardana” [54,55]. They are prepared by pretreating fresh pomegranate arils to a constant temperature of 60 ± 2 °C [54,56] until they reach a moisture content of between 9.33 and 15.73% [57]. The dehydrated arils have a sugar content between 13.7 and 15.1 °Brix and an acidic content ranging between 0.24 and 0.38%. Table 1 shows the different parameters used to evaluate the quality attributes for dried pomegranate arils. One area of quality lapse is the processing of immature and unripe fruits in the production of anardana, which usually result in dried arils with poor color and quality. Typically, dried aril is prepared with matured fruit [58]. The effects of processing techniques on dried aril have been investigated [50]. In this study, the authors compared the hot-air and freeze-drying methods to process dried aril. They recommended freeze-drying, which lowered the degradation for parameters such as color, total phenolic content and total anthocyanin content.
Pomegranate seed oil comprises 12–20% of the total seed weight [59]. The seed oil is comprised of more than 80% conjugated octadecatrienoic fatty acids, with a high content of punicic acid (9-cis, 11-trans, 13-cis, 18:3). The fatty acids comprise over 95% of the oil, of which 99% is triacylglycerols [60]. Seed oil can yield oil ranging from 13.70 to 18.55% depending on the extraction method, solvent used and seed pretreatment [51,61]. Pomegranate seed oil is esteemed for its refractive index, yellowness index, peroxide value, total carotenoids content and total phenolic content [59,61]. The literature suggests that seed oil quality varies with respect to cultivar, fruit growing region and seed oil processing techniques [61,62].
Pomegranate juice is another value-added by-product of pomegranate fruit. Juice yield varies between 67.75 and 74.05 mL per 100 g arils depending on the cultivar, maturity stage and growing location [40,63]. The juice contains 85.4% water, 10.6% total sugars, 1.4% pectin and 0.2–1.0% polyphenols [12,60]. The reported quality indexes of the juice are different due to differences in juice extraction methods, cultivar and fruit maturity [40,63,64].

3. Non-Destructive Methods for Quality Evaluation of Intact Pomegranate Fruit

3.1. Infrared (IR) Spectroscopy

Infrared technology employs the principle of interactions between matter that contains molecular bonds with the electromagnetic radiation in the near- and mid-infrared range. NIR and MIR spectroscopy cover an electromagnetic range of 12,500–4000 cm−1 or 800–2500 nm (NIR) and 4000–400 cm−1 or 2500–25,000 nm (MIR), respectively [26,65]. In recent years, the application of near-infrared spectroscopy (NIRS) in agricultural products has been growing in terms of instrumentation and spectra analysis techniques to measure the SSC, fruit firmness, pH and TA of fruits [29,66,67].

3.1.1. Application on Intact Fruit

Pomegranate fruit quality attributes have been assessed non-destructively using the NIRS by several researchers. Attributes such as TSS, TA and pH are most frequently correlated with NIRS measurements and predicted with high accuracy [68,69]. Arendse et al. [69] compared two NIRS acquisition modes to evaluate both the external and internal quality of intact pomegranate fruit. This study evaluated the external attributes to include fruit weight, firmness and color components (a*, chroma, hue angle), and internal attributes such as TSS, pH, TA, sugar to acid ratio (TSS:TA), Brim A, total phenolics, total anthocyanin and vitamin C. The authors reported good prediction statistics for both acquisition methods, namely, emission head and integrating sphere. The emission head acquisition method was observed to yield the best prediction for 9 quality attributes of the 13 analysed.
Khodabakhshian et al. [70] estimated maturity and several quality parameters of the “Ashraf” variety of pomegranate fruit. Attributes including TSS, TA and pH were assessed during four distinct maturity stages and a model was developed using partial least squares regression. The authors applied several preprocessing methods and obtained R2 values for prediction ranging from 0.73 to 9.2. Their results showed model performance to improve with the preprocessing of data. The best performing model was obtained when a combination of SNV, median filter, D1 and mean center was applied.
For whole pomegranate fruit, Arendse et al. [71] developed models for several color components (a*, C*, h°). The authors reported prediction statistics for a* (R2 = 0.90 and RPD = 3.34), C* (R2 = 0.83 and RPD = 2.43) and h° (R2 = 0.83 and RPD = 2.50). Another incidence of physiological disorder, prevalent in pomegranate fruit, is husk scald [71]. Arendse et al. [69] applied the Fourier transform near-infrared reflectance spectroscopy technique to evaluate biochemical markers associated with the development of husk scald. The authors qualitatively discriminated between healthy and scalded fruit by classifying fruit into three categories, namely, healthy, moderate scald and severe scald. Using orthogonal partial least squares discriminant analysis (OPLS-DA), they achieved a classification accuracy of 100% healthy, 92.6% moderate scald and 93% severe scald showing a high prediction model.

3.1.2. For Internal Quality Parameters

Infrared spectroscopy is one of the most used non-destructive techniques for pomegranate quality assessment. It has found application in quality inspection, variety and specie discrimination and even as quality control over disease infections. Particularly for pomegranate fruit, it has been implemented coupled with chemometric analysis for varying fruit quality indices [68,69], all showing different degrees of accuracies. (Table 2). Some of the parameters being measured include total soluble solids, pH, titratable acidity, Brim A, aril hue, total phenolic concentration, total anthocyanin concentration, vitamin C concentration, aril firmness and aril color components.
To evaluate pest infestation of pomegranate fruit by carob moth larvae, also known as Ectomyelois ceratoniae, Jamshidi et al. [72] utilized visible/near-infrared (Vis/NIR) spectroscopy as an optical non-destructive technique in combination with supervised and unsupervised pattern recognition methods to detect the presence of carob moth larvae in pomegranate fruit. PCA and PCA-DA models were developed by the authors with the best PCA-DA model achieving a prediction accuracy of 90.6%. This study shows the feasibility of Vis/NIR spectroscopy for the rapid screening of pomegranate fruit infested by carob moth. In a similar study, SIMCA and PLS-DA were used to discriminate carob moth infestation [73]. The authors achieved a prediction accuracy ranging from 86 to 90%. These results show the potential of IR spectroscopy as a fast and efficient technique for internal quality evaluation.
The maturity index was investigated using the attributes TSS, TA and pH for pomegranate fruit [22]. In this study, the authors applied different preprocessing methods for the development of PLS calibration and prediction models for the different quality parameters. The results showed that the prediction of TSS (R2 = 0.92, RMSEP = 0.23 °Brix, RPD = 6.38) gave the best model and was developed when standard normal variate (SNV), median filter and first derivative were used as preprocessing. A similar preprocessing combination also yielded the best model for TA (R2 = 0.93, RMSEP = 0.26, RPD = 5.31). The prediction of pH was best when SNV, median filter and second order derivative were used as preprocessing techniques with R2 = 0.85, RMSEP = 0.064 and RPD = 4.94. This study shows that the application of different preprocessing techniques affects the performance of the developed models and further studies should focus on the application of several spectral preprocessing techniques to non-destructively predict the maturity of pomegranate fruit. In a similar study, reflectance and transmission modes’ spectral data were acquired in the range of 400–1100 nm to determine the TSS, TA and pH of pomegranate fruit [74]. The authors found both spectral acquisition modes feasible for non-destructive application on pomegranate fruit with the reflectance mode providing better accuracy for the measurement of TSS, pH and firmness. Table 2 summarizes the application of NIRS for different quality evaluations.

3.1.3. Application on Processed Products

Increasing demand for pomegranate fruit has necessitated the processing of the intact fruit into different value-added products. Some of these products include fresh and dried aril [50,68], seed oil [51] and pomegranate juice [75]. The use of IR spectroscopy has also been extended for the non-invasive evaluation of these different processed products. It can been applied as a quality control measure for the authentication of pomegranate juice concentrate [76]. The authors investigated the adulteration of pomegranate juice concentrate (PJC) with grape juice concentrate (GJC). By applying partial least squares (PLS) regression of the spectra, the authors obtained high accuracy in the prediction of the GJC adulterant concentration in PJC with a correlation coefficient, R2, of 0.975. Further analysis of PJC to predict % titratable acidity and total solids yielded a model with high R2 values of 0.9114 and 0.9916, respectively.
Table 2. Summary of application of Vis/NIR spectroscopy for intact pomegranate quality analysis.
Quality AttributesPrediction StatisticsData AnalysisReferences
TSS
TA
pH
R2 = 0.960, RMSEP = 0.092 °Brix
R2 = 0.920, RMSEP = 0.19%
R2 = 0.920, RMSEP = 0.089
PLS, PCA[70]
 
 
TSS
TA
pH
R2 = 0.920, RMSEP = 0.23 °Brix
R2 = 0.930, RMSEP = 0.26%
R2 = 0.800, RMSEP = 0.064
PLS, PCA[22]
 
 
TSS
TA
pH
TAC
TPC
Brim A
TSS/TA
Hue angle
Vitamin C
Chroma
a*
Firmness (N)
Hue
Fruit Weight
R2 = 0.781, RMSEP = 0.28%
R2 = 0.768, RMSEP = 0.13%
R2 = 0.849, RMSEP = 0.06
R2 = 0.626, RMSEP = 0.09 g/L
R2 = 0.889, RMSEP = 0.11 g/L
R2 = 0.762, RMSEP = 0.39
R2 = 0.868, RMSEP = 0.74
R2 = 0.466, RMSEP = 1.67
R2 = 0.762, RMSEP = 0.09 g/L
R2 = 0.830, RMSEP = 2.15
R2 = 0.909, RMSEP = 1.61
R2 = 0.830, RMSEP = 7.45
R2 = 0.839, RMSEP = 1.67
R2 = 0.621, RMSEP = 0.013
PLS, PCA[75]
TSS
Firmness (N)
pH
R2 = 0.940, RMSEP = 0.21 °Brix
R2 = 0.940, RMSEP = 0.68
R2 = 0.860, RMSEP = 0.069
PLS, PCA[74]
 
 
Ectomyelois ceratoniae infestationCA = 97.9%PCA-DA[72]
Presence of husk scaldCA ≥ 92.6%OPLS-DA[71]
Carob moth infestation detectionCA ≥ 86%PLS-DA[73]
TA, titratable acidity, TAC, total anthocyanins content, TPC, total phenolic content, TSS, total soluble solid, PCA, principal component analysis, PLS, partial least squares, CA, classification accuracy, PLS-DA, partial least squares discriminant analysis. a* represents redness (+a*) or greenness (−a*).
In another study, Boggia et al. [77] developed a screening method based on ultraviolet and visible (UV–Vis) regions spectroscopy combined with multivariate analysis to assess the addition of water and other filler juice to pomegranate juice. In this study, 14 pomegranate juices (PG), 27 grape juices, 11 apple juices (AP) and seven mix fruit juices containing pomegranate juice were analysed and their absorption spectra in the range 190–1100 nm were obtained using an Agilent 8453 spectrophotometer with a 1 nm resolution. Spectral data from their study showed clear lines between the profiles of different juice samples (Figure 2). The authors found that the first two PCs yielded 96.8% of total variance, which explains a satisfactory separation among the different juice categories. The spectral region around 250–300 nm had the greatest importance (loading value) on PC1. All the juices containing pomegranate indicated high absorptions in this region, except for apple juices, which showed weak absorptions.
A comparative study to analyse the performance of mid- and near-infrared spectrometers for evaluating juice quality has been investigated [75]. Several quality attributes including phytochemical and antioxidant were evaluated with all showing varying degrees of success. The authors observed that the spectral acquisition modes (WineScan, MPA and the Alpha-P instruments) impacted on the performance of the prediction models for different attributes of the juice with the instruments in the mid-infrared region (WineScan and the Alpha-P instruments) outperforming the MPA instrument in the near-infrared region.
Pomegranate seed oil has also been investigated for its many quality attributes using IR spectroscopy technique [78]. Fourier transform near-infrared (FT-NIR) and mid-infrared (FT-MIR) spectroscopy were employed to predict the quality attributes of pomegranate seed oil. The authors used partial least squares regression to construct prediction models. Their study reported a good prediction model for total carotenoid content (TCC) R2 = 0.8045, peroxide value (PV) R2 = 0.620 and refractive index (RI) R2 = 0.8092. Similar success was recorded for application on dried pomegranate aril [10]. These results demonstrate the potential of infrared spectroscopy combined with chemometric analysis to be used as a useful technique for the rapid screening of pomegranate oil’s quality attributes.
In a study comparing three spectroscopic techniques, UV–visible spectroscopy (200–800 nm), mid-infrared spectroscopy (4000–650 cm−1) and fluorescence spectroscopy (300–800 nm), pomegranate seed oil was evaluated for free fatty acid values and fatty acid profiles [79]. The authors also discriminated the adulteration of cold-pressed pomegranate oil with sunflower oil and observed that the Mid-IR range provided the best results regarding the discrimination of the mixing of cold-pressed PSO with sunflower oil.
For the assessment of the microbial quality of minimally processed pomegranate aril, Adiani et al. [80] acquired FTIR data preprocessed in three different ways viz: the raw FTIR spectrum, first derivative for the FTIR spectrum and peak integrated data of the FTIR spectrum to develop a prediction model. The authors analyzed the total viable count (TVC) and yeast and mold count (Y&M) and obtained R2 values of 0.909 for raw FTIR spectral data, 0.619 for FTIR first derivative data and 0.830 for peak integrated data. The results showed that PLS-R models performed the best for predicting microbial quality when FTIR first derivative data were used, while ANN showed better model performance when applied on raw FTIR spectral data during model development. When spectral data preprocessed with peak integrated data were used, the developed models showed poor performance for prediction in both ANN and PLS-R.
Arendse et al. [69] applied FT-NIR to develop a calibration model for freshly-extracted pomegranate aril. In this study, the authors acquired NIR data using two pieces of spectral equipment: the Multi-Purpose Analyzer (MPA) FT-NIR spectrometer and MATRIX-F FT-NIR spectrometer (Bruker Optics, Ettlingen, Germany) with a wavelength range of 800–2500 nm. Quality attributes assessed included total soluble solids, titratable acidity, pH, Brim A, aril firmness, total phenolic concentration, total anthocyanin concentration and vitamin C concentration and several color attributes, with the model showing accurate predictions for eight quality parameters. Recently, a similar study has been carried out on fresh pomegranate aril [70] and dried pomegranate [10]. Table 3 gives a summary of the different applications for the evaluation of different products of pomegranate fruit. NIR spectroscopy is the most frequently used technique and is commercially available [26].

3.2. Raman Spectroscopy

Raman spectroscopy is another non-destructive technique used for the quality analysis of fruits and vegetables [81]. This technique, named after an Indian physicist, Sir Chandrasekhara Venkata Raman (1888–1970), was developed based on the phenomena of inelastic scattering of light. The technique is based on the fact that inelastic collision occurs between an incident photon and a molecule of the sample when samples are irradiated [82]. The concept and principle of Raman and its theoretical basis have been discussed in detail by many researchers. Raman spectroscopy has several advantages in food analysis compared with other techniques [29,81,83].
It has also frequently been applied in fresh fruit and vegetable quality analysis [31,84]. Khodabakhshian [74] applied the modified polynomial, self-modelling mixture analysis (SMA) and spectral information divergence (SID) preprocessing techniques, combined with PLS regression, to develop tannin content prediction models. The prediction accuracies of models predicting the tannin content in the three parts of pomegranate fruit: the rind, aril and white spongy tissue have R2 values of 0.960, 0.925 and 0.922, respectively.
More recently, a pattern recognition-based Raman spectroscopy technique was investigated for the non-destructive quality assessment of pomegranates [85]. The authors used both supervised and unsupervised pattern recognition methods and distinguished different maturity stages of the pomegranate variety “Ashraf”. The partial least squares discriminant analysis (PLS-DA) and soft independent modelling of class analogy (SIMCA) were compared, showing prediction accuracies of 95% and 82%, respectively. The authors further considered two stages of maturity (“immature” and “mature”). The SIMCA based on PCA modelling was able to completely categorize the samples in two classes: immature or mature, with a classification accuracy of 100%. Figure 3a provides images of the inner pomegranate fruit at different maturity stages. Spectral profiles of the Raman shift for the different development stages are also shown in Figure 3b.

4. Imaging-Based Non-Destructive Techniques for Evaluating Pomegranate Quality

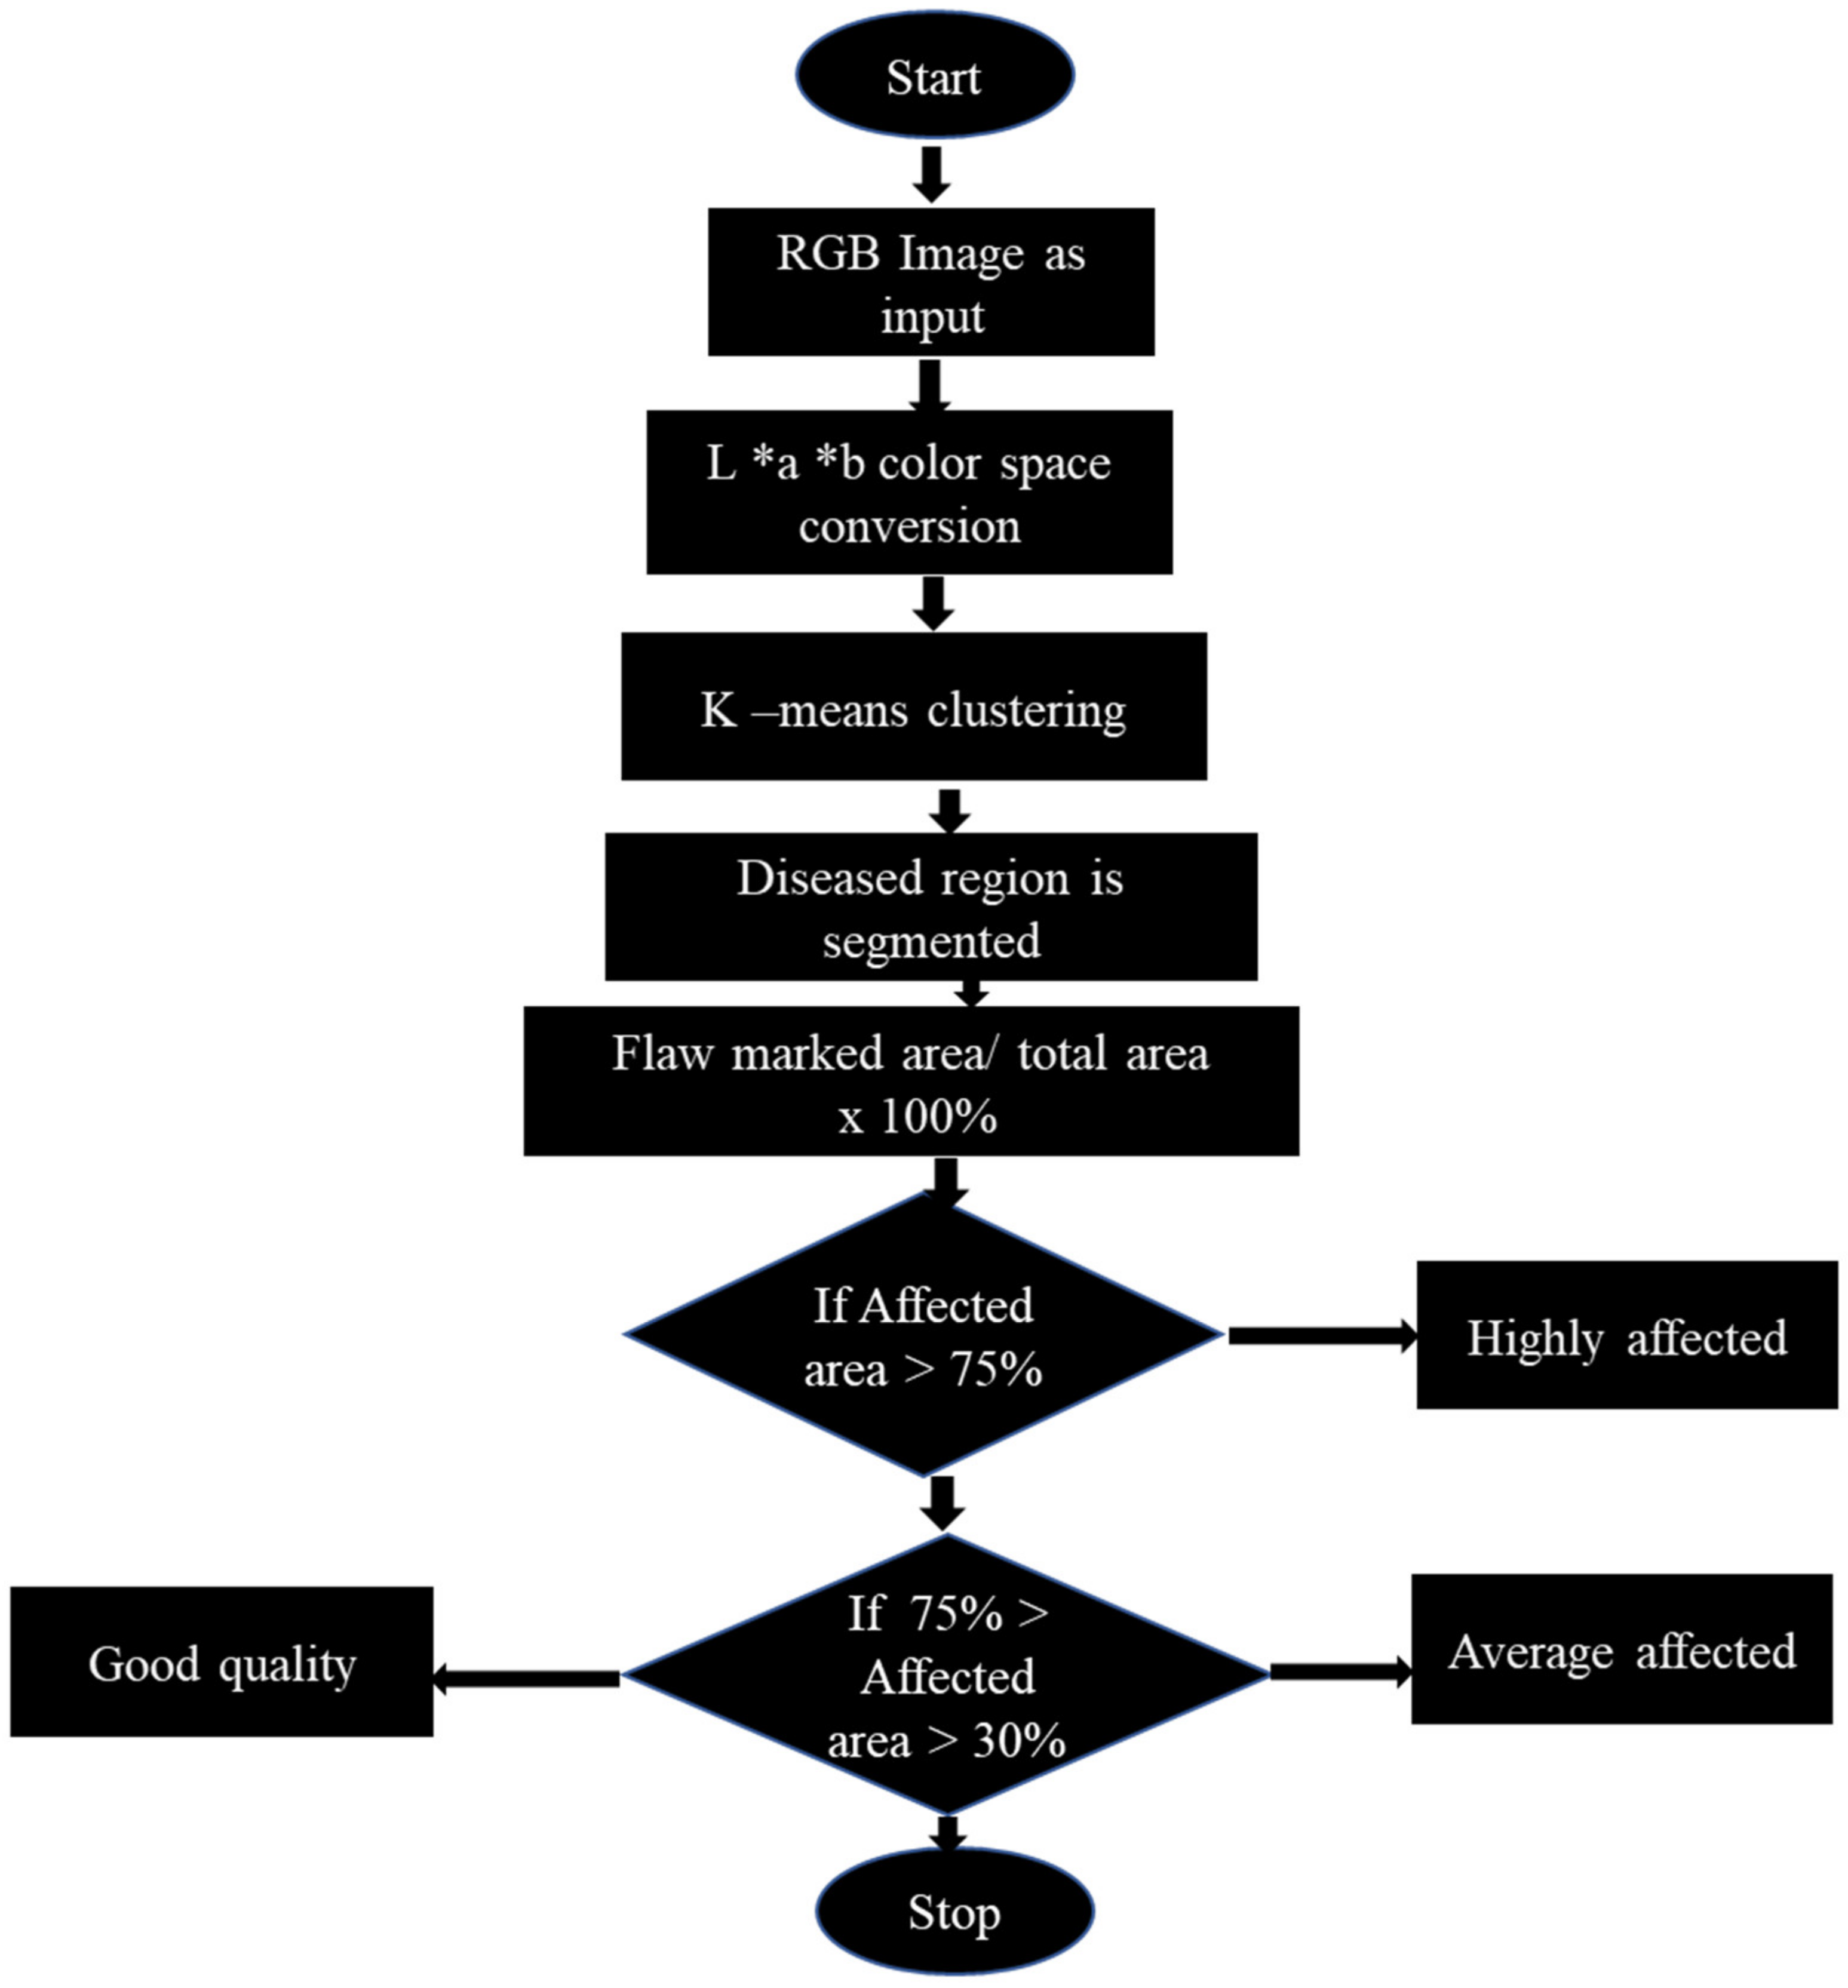
4.1. Machine Vision Systems (MVS)

Machine vision has been extensively used in agriculture over the last few decades [86]. Part of the reasons for this is the advances in the arena of digital imaging and data processing techniques that encourage intelligent control methods. In the agricultural industry, quality evaluations based on visual appearance such as color attributes are subjective. Hence, machine vision systems play an important role in the field of automated preharvest and postharvest applications. Machine vision is widely applied for the sorting and grading of agricultural, horticultural and food products [25,86]. Evolving technologies in machine learning, big data acquisition, big data processing, internet of things and analytics have ushered in the concept of Industry 4.0 [87]. Machine vision in combination with machine learning has been applied to address different quality control problems in the field of agriculture [88] and the pomegranate industry [25,89].

4.1.1. Application on Intact Fruit

Fashi et al. [90] applied the machine vision technique to measure the pH of pomegranate fruit of the Qom cultivar. In their study, images of 200 fruit were acquired and analysed using three different image processing algorithms. In total, the authors investigated 10 different color channels of which the image corresponding to six of these channels are shown in Figure 4. Fourteen selected inputs were fed into the model along with the values for pomegranate pH, as the model was developed for sensitivity analysis. The result showed the adaptive neuro-fuzzy inference system (ANFIS), and ANN-based models achieved a regression coefficient (R2) value greater than 0.980, while the response surface methodology (RSM)-based model achieved an R2 value of 0.754.
Different two-dimensional linear discriminant analysis approaches were explored for machine vision techniques in pomegranate fruit grading [91]. In this study, four different linear discriminant analysis methods were compared: a traditional two-dimensional linear discriminant analysis (2DLDA), a fractional two-dimensional linear discriminant analysis (FLDA), a fuzzy two-dimensional linear discriminant analysis (F2DLDA) and a fractional fuzzy two-dimensional linear discriminant analysis (FF2DLDA). The authors used a digital camera (EOS 550D, Canon Inc., Tokyo, Japan) to capture high-quality pomegranate images of size 3456 × 2304 pixels and a resolution of 0.03 mm/pixel. They found that of the four algorithms investigated, the FF2DLDA gave the best classification accuracy (97%) for grading pomegranate color. This study confirmed the importance of image data analysis techniques on model prediction efficiency and accuracy.
A similar result was reported by Kumar et al. [89] in the development of an ANN-based classification model for pomegranate fruit sorting application. The authors used spatial domain features and wavelet feature techniques for image features extraction. The results showed the superior classification performance of wavelet features (91.3%) compared to spatial domain features (77.46%). Their study revealed good accuracy, thereby showing the potential of machine vision systems in the grading and sorting of pomegranate fruit non-destructively. In another study, images of 1800 pomegranates were acquired using a closed metal compartment, and a total of 134 features were extracted and used to train an ANN-based classification model in pomegranate fruit grading application [25]. The authors implemented image segmentation and histogram equalization followed by wavelet denoising steps for the preprocessing of the image data. The study reported a classification accuracy of 97.83%.

4.1.2. Application on Processed Products

MVS have also been used in the evaluation of pomegranate arils’ quality analysis. For instance, Blasco. [92] established a prototype capable of correctly separating arils travelling at a speed of 1 m s−1 and which were separated by a distance of at least 20 mm. This system accurately discriminated aril membranes from the arils. However, the system required human intervention to differentiate between the different categories of the arils. Blasco et al. [93] further investigated the feasibility of two different image segmentation methods for the automatic sorting of pomegranate (Punica granatum) arils. One of the methods uses a threshold on the R/G ratio and the other takes a more complex approach based on Bayesian linear discriminant analysis (LDA) in the RGB space. Both methods offered an average classification accuracy of 90%. The authors were able to successfully implement a prototype system for the inspection and sorting of arils, which could handle a maximum throughput of 75 kg/h.
In a different study, Fashi et al. [94] classified pomegranate arils into three categories according to three different indexes of healthiness, redness and size) using MVS. Four features were extracted and used to train, test and validate adaptive neuro-fuzzy inference system (ANFIS), response surface methodology (RSM) and artificial neural network (ANN) models. The authors found the ANN model performed best (with 98% classification accuracy) for grading pomegranate aril based on color and aril size. Results for the other two models showed classification accuracies of 95.5% (ANFIS) and 75.5% (RSM). Table 4 provides a summary of the application of MVS for the quality assessment of pomegranate fruit and arils.
Machine intelligence, which helps to eliminate the bias of subjective manual sorting, has had a tremendous impact on pomegranate fruit quality analysis [1]. Grading is one quality category that is performed based on weight, size and external rind appearance. Studies have shown that disease, pests and infestation can also be detected using MVS [1], though this is quite a difficult task considering the variation in diseases or defect types and how they manifest on fruits [86]. Using appropriate image preprocessing and color space conversion, region of interest segmentation and analysis of flaws, diseases and defects can be accurately detected.
The machine vision system for quality inspection is made up of four basic components: acquisition, segmentation, feature extraction and classification [86]. Camera quality for image capturing and data storage has witnessed huge improvements in recent times. Recently, interest has grown in the direction of multiple sensing techniques [95]. A typical image processing flow chart for defect detection was proposed by Pandey et al. [1] (Figure 5). The technique identified three infection severity classes: worst (infection covered over 75% of the surface), average (30–75%) and good (less than 30%). MVS has also found application in the on-tree counting of pomegranate fruit [96,97,98].
The downside of the digital image system for food quality application is its limitation in capturing or detecting internal defects or internal quality [4]. To this end, in most packhouses, pomegranate product classification is not based on internal quality [4]. This has necessitated the need to find other effective techniques for the internal quality assessment of pomegranate fruits [23,69].
Table 4. Summary of application of different non-destructive assessment for pomegranate quality attributes.
TechniqueApplicationData AnalysisAccuracyReferences
X-rayVolume estimationSTA [99]
MVSGrading2DLDA, FLDA, F2DLDA, FF2DLDA97%[91]
MVSGradingANN97.83%[25]
MVSGradingANN77.46–91.3%[89]
NMRBlack heartPLS-DA92%[100]
E-nose systemFungal diseaseLDA, BPNN and SVM100%[101]
MVSDisease -79.73%[1]
Raman spectroscopyTannin changesPLSR2 = 0.9603[74]
MVSAril color and sizeANN, ANFIS, RSM75.5–98%[94]
E-noseFruit ripeningPCA, LDA95.20%[102]
MVSpHANFIS, RSM, ANNR2 = 0.984, MSE = 0.202[90]
Raman Maturity indexingPLS-DA, SIMCA and PCA95%[85]
X-RayDisease detection-t value = 0.469 with a 95% loss[103]
MVSIndustrial grading of fresh arilLDA, threshold on the R/G ratio83.3–100%[93]
MVSPreharvest yield estimationadaptive threshold algorithmER = 91%[96]
MVSOn-tree fruit recognitionRGB, HSV and YCC colour space analysis100%[97]
MVSYield estimationCHT, K-Means ClusteringR2 = 0.7652[98]
MSVPhysicochemical attributesPCA, PLS-R [23]
HSIMaturity indexingPLS-DA95.0%,[23]
MSITSS, TA and pHPLS, MLRR2 ≥ 0.88, RPD ≥ 5.01[22]
CHT, Circular Hough Transform, ER, error rate, LOS, level of significance, MSI, multispectral imaging, PLS, partial least squares, MLR, multiple linear regression, TSS, total soluble solids, TA, titratable acidity.

4.2. Nuclear Magnetic Resonance (NMR) and Magnetic Resonance Imaging (MRI)

The basic principles of NMR spectroscopy are developed on the scientific fact that most elements have at least one isotope and are therefore magnetic. It was first successfully applied for measurement by Bloch and Purcell, for which they were jointly awarded the Nobel prize in Physics in 1952 [104,105]. For example, 1H, 13C and 31P have a magnetic moment and can absorb resonance energy when placed in a strong magnetic field [106]. Several studies have shown that NMR and MRI can be used to measure and quantify several physical and chemical properties of pomegranate fruit [9,100].
In a study using MRI, Khoshroo et al. [9] successfully classified pomegranate cv. Malas-e-Torsh fruits into semi-ripe, ripe and overripe classes and detected internal defects. The authors applied the gray-level co-occurrence matrix (GLCM) and pixel run-length matrix (PRLM) features. Classification and internal defect identification accuracies were higher with GLCM features. Interestingly, combining seven GLCM and four PRLM features resulted in a classification accuracy of 98.33%, and the lowest type I and II errors confirmed the potential of MRI as a powerful tool in pomegranate fruit quality analysis.
In order to determine the presence of black heart disease on pomegranate fruit, Zhang and McCarthy [100] applied proton NMR relaxometry to investigate the water T2 relaxation distribution in infected and healthy pomegranate fruit and to obtain information that indicates tissue damage. Partial least squares discriminant analysis (PLS-DA) of the MR image provided a model with 92% accuracy in detecting the presence of black heart in pomegranate fruit. This study also highlighted the significant change in the T2 relaxation distribution in arils after infection, which indicate that the T2 relaxation time is a good indicator of black heart in pomegranate. In another study, Zhang et al. [100] measured the TSS, TA and pH of pomegranate fruit based on partial least squares (PLS) analysis of acquired MR images of the fruit. This approach correlates with the destructively-obtained reference data with corresponding MR imaging. The MR image-based PLS predictive model achieved R2 values of 0.54, 0.6 and 0.63 for TA, pH and TSS levels, respectively.

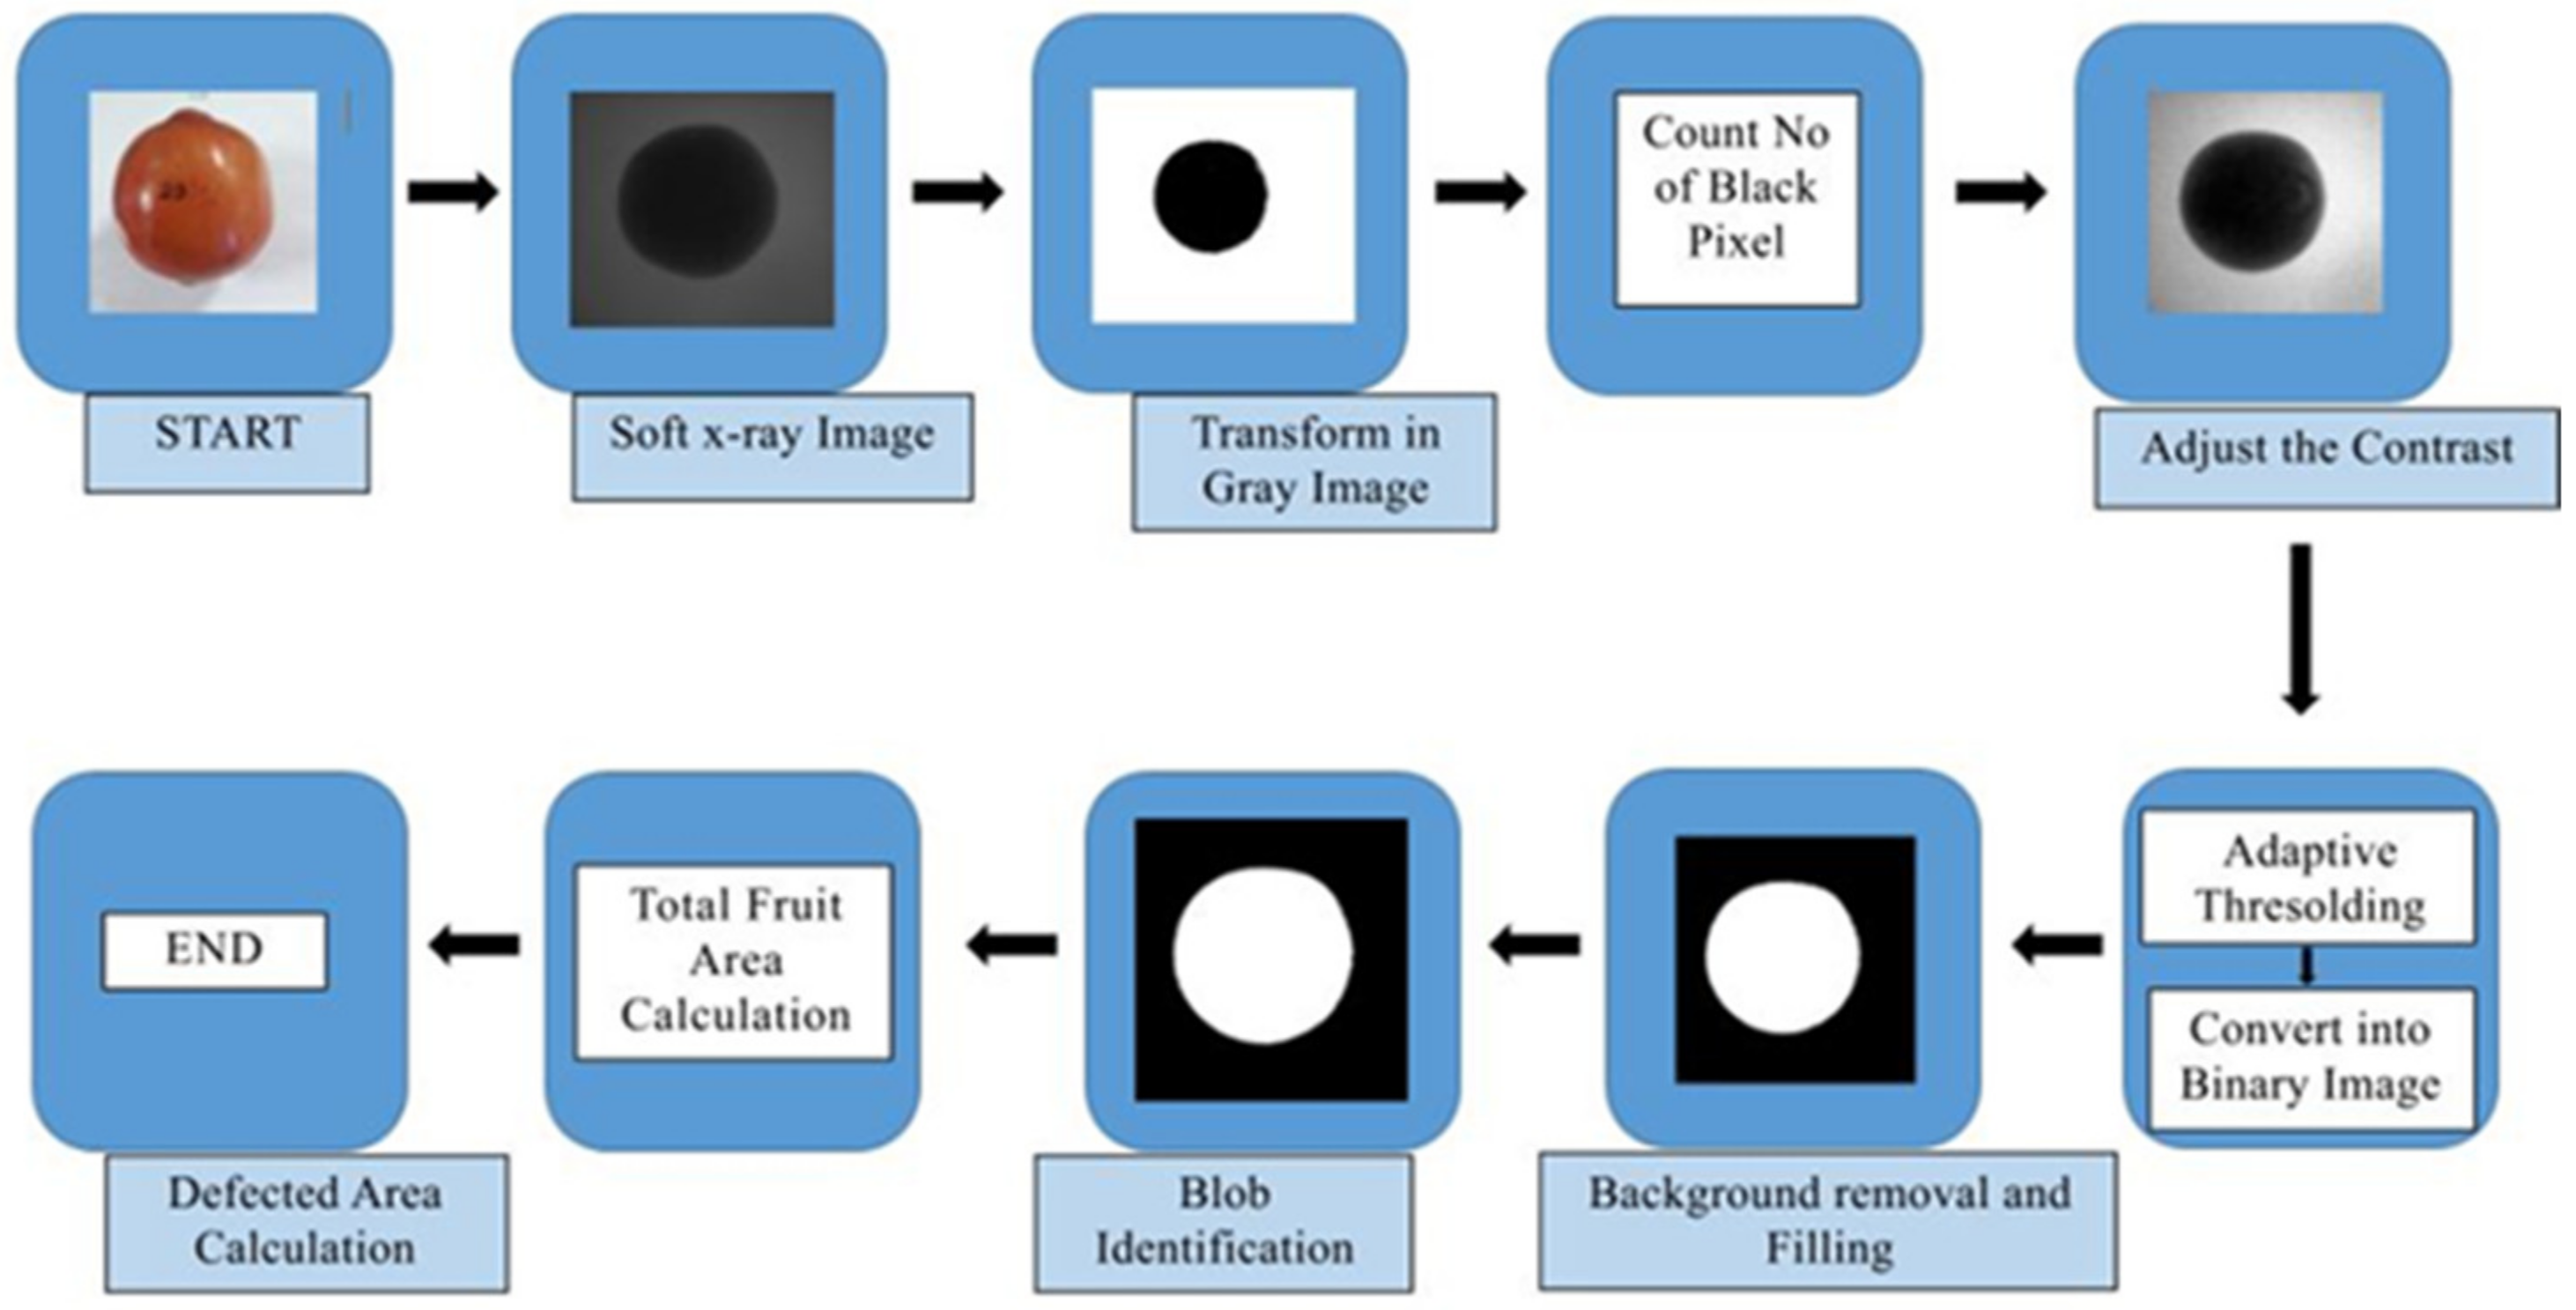
4.3. X-ray Computed Tomography

X-ray computed tomography (CT) is a non-destructive technique that reconstructs 2-dimensional images into 3-dimensional models for quantification and characterization of horticultural produce. CT offers considerable advantages over other imaging techniques since it provides a large field of view [32,107,108]. This ensures a whole sample surface can be scanned without preparation [109,110]. X-ray CT is mostly applied in two ways in the food industry: for the inspection of foreign bodies in food products for quality control and secondly to irradiate food (a process that destroys bacteria). One distinct feature of X-ray CT is that it measures variation in the material density of the sample. This is based on the attenuation of X-ray that depends on the density of the irradiated object [107,108].
The application of X-ray CT for the characterization and quantification of pomegranate is summarized in Table 5. In a study that quantified the various parts of the fruit, Magwaza and Opara [111] employed the X-ray CT imaging technique. This technique assesses and quantifies the distribution of edible (arils) and non-edible (albedo) parts of the fruit non-destructively. The authors developed linear regression models with high accuracy (R2 values of 0.83 and 0.89, respectively, to predict volumes of albedo (external skin plus internal soft tissue) and arils). Another study employed a soft X-ray technique for the non-destructive quality analysis of pomegranate fruit [103]. The authors analysed the acquired images using the image processing toolbox, MATLAB (Figure 6), and were able to measure the exact area the defects were based in.
In a similar study, Arendse et al. [112] investigated a sample of twenty-three pomegranate fruits by the X-ray CT technique. Sizes of physical attributes including length, diameter and peel thickness were estimated. Their result showed that the average fruit length, diameter, radius and peel thickness were 76.67 ± 2.93 mm, 86.82 ± 3.34 mm, 44.19 ± 2.93 mm and 4.67 ± 0.60 mm, respectively. A plot of reference measurements against X-ray CT values shows R2 values for the volume of peel, arils, kernels, juice content, air space and single arils of 0.97, 0.84, 0.90, 0.87, 0.82 and 0.80, respectively.
Moreover, the juice content, volume of the peel and density of the intact pomegranate fruit were estimated using X-ray CT technique [113,114]. In fact, the application of X-ray CT is diverse in the food industry (Schoeman et al., 2016) for the identification and quantification of the internal structures of fruit [99,111,114], and to detect bruise damage [115].

4.4. Hyperspectral and Multispectral Imaging

Multispectral imaging (MSI) and hyperspectral imaging (HIS) techniques are recently advancing techniques used to acquire the spatial distribution of the physical and chemical quantities for objective fruit quality analysis [7,116]. The MSI and HSI are similar techniques. The main difference is the number of bands and how narrow the bands are. Multispectral imagery generally refers to 3 to 10 bands [117,118] and hyperspectral imaging could have hundreds or thousands of bands. Having a higher level of spectral detail, HSI gives better capability to see the unseen. However, the acquisition, processing and analysis of hyperspectral data are considerably challenging [118]. The comparative differences of conventional machine vision (CMVS), near-infrared spectroscopy (NIRS), multispectral imaging (MSI) and hyperspectral imaging (HSI) are summarized in Table 5.
A typical HSI system usually consists of a detector, illumination source, spectrograph and a power supply unit [119]. A set up of the image acquisition and the subsequent image processing workflow is shown in Figure 7.
Several authors have reviewed the application of HSI/MSI for food quality evaluation [29,117,120,121]. The use of HSI and MSI for the non-destructive assessment of pomegranate fruit quality is quite limited in the literature as compared to Vis/NIRS. Khodabakhshian et al. [22] applied MSI within the wavelength range of 200–1100 nm for the online quality assessment of pomegranate fruit. The authors developed regression models using both partial least squares (PLS) and multiple linear regression (MLR) methods for the TSS, TA and pH of pomegranate fruit. The performances of the developed MLR-based prediction model was: for TSS (R2 = 0.97, RMSEP = 0.22 °Brix, RPD = 5.77), pH (R2 = 0.94, RMSEP = 0.038, RPD = 4.98) and TA (R2 = 0.92, RMSEP = 0.26, RPD = 5.22). Munera et al. [23] compared the capability of both the machine vision techniques and hyperspectral imaging to predict the physicochemical properties and maturity stages of “Mollar de Elche” pomegranate fruit (intact and fresh-cut aril). The authors applied PLS regression to develop models for discriminating different maturity stages. They reported classification accuracies of 95% for intact fruit and 100% for arils with the HSI system and 84.3% for intact fruit and 85.7% for arils with MVS. These findings demonstrate the superior performance of the HSI system compared to MVS.

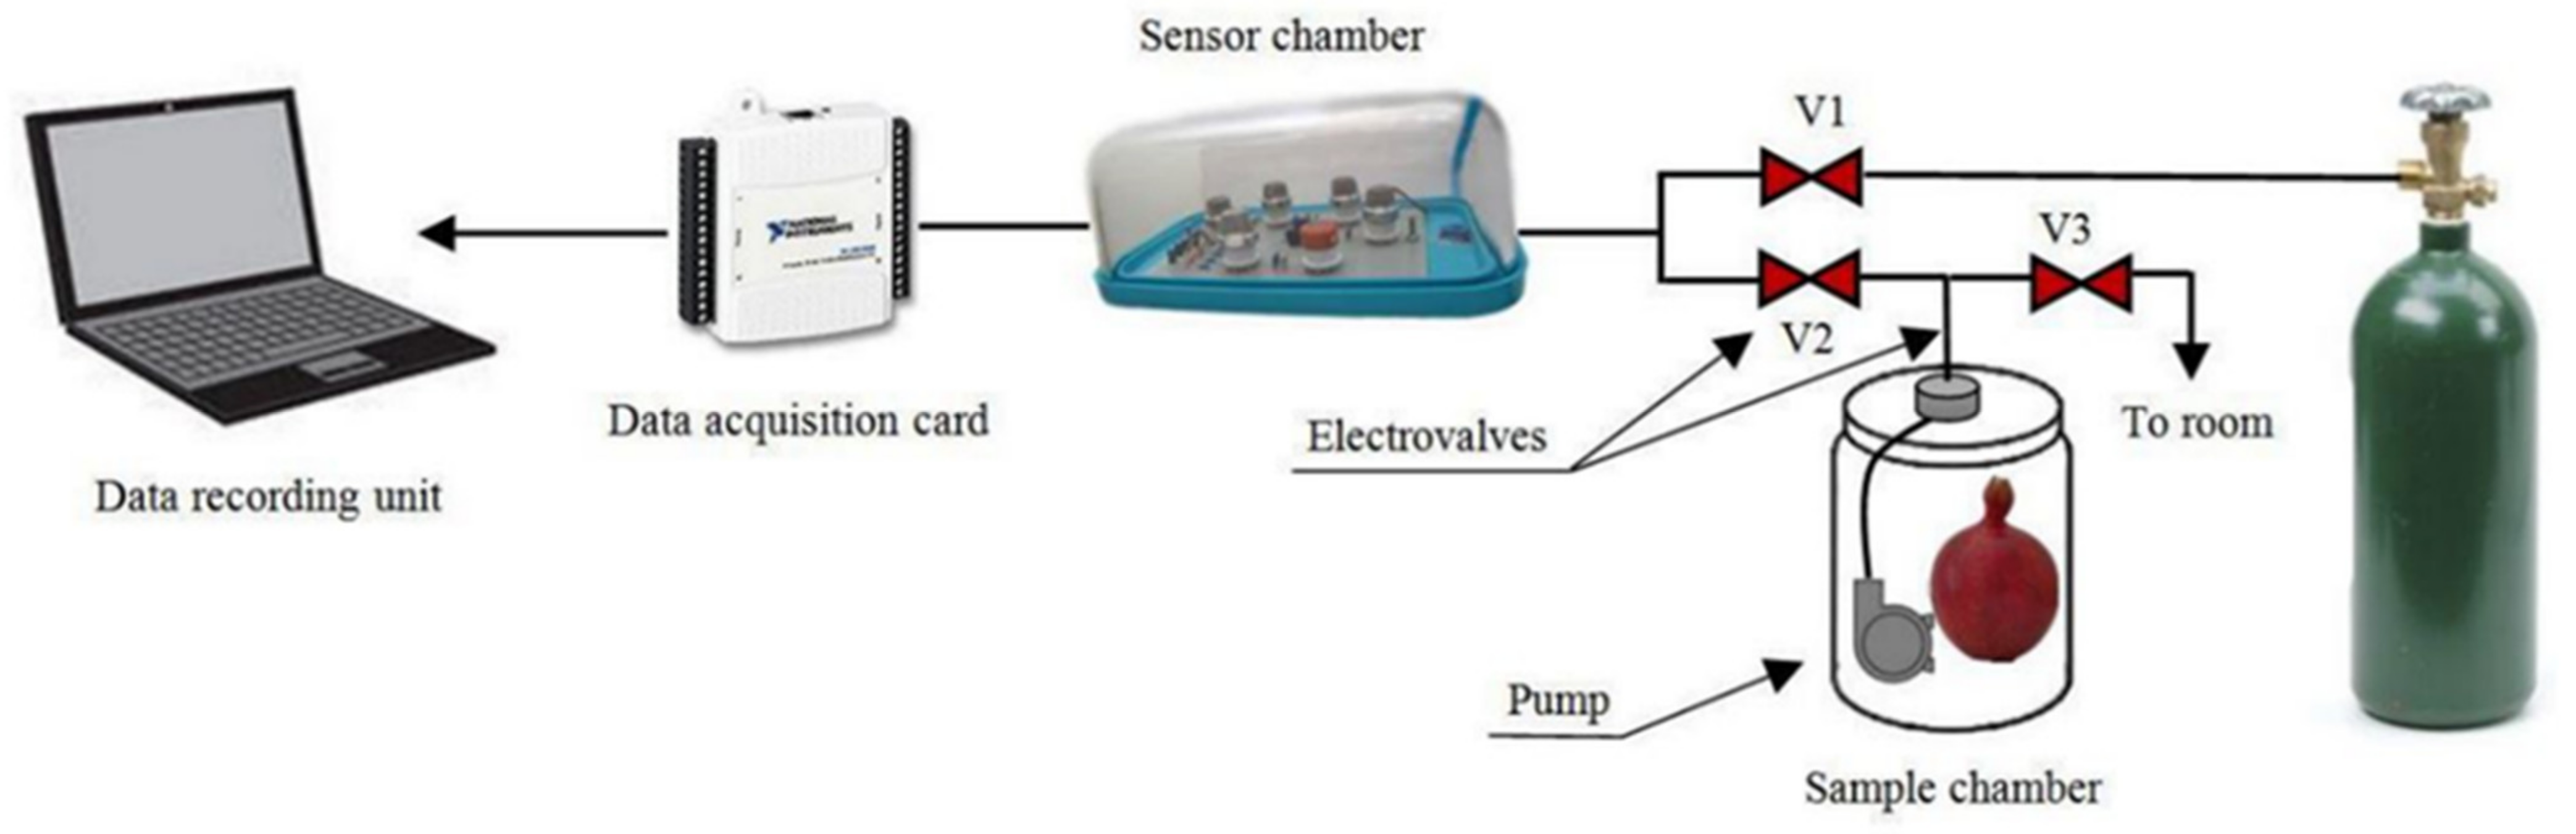
5. Electronic Nose (E-Nose)

The electronic nose (e-nose) is another non-destructive technique that has been applied for the quality analysis of fruit. The e-nose is designed to simulate the human sense (smell) in identifying and realizing the complex aromas of fruits by employing a chemical sensors array [102]. The typical e-nose set up comprises of data acquisition, an array of metal oxide semiconductor (MOS) sensors, gas sensors and a power supply unit. Figure 8 illustrates the setup of a typical e-nose system.
In a research study, Sanaeifar et al. [102] applied a low-cost e-nose system based on six MOS sensors for the non-destructive recognition of different pomegranate varieties viz: “Ferdows”, “Rabab” and “Saveh”. The authors applied principal component analysis (PCA) and linear discriminant analysis (LDA) techniques and achieved a classification accuracy of 95.2%. E-nose has also been applied for the detection of diseases [101]. The authors compared three different data analysis methods: LDA, the back propagation neural network (BPNN) and the support vector machine (SVM). Their result showed BPNN to have the highest accuracy of 100% in the detection of 0, 25, 50, 75 and 100% infected fruit.

6. Challenges of Non-Destructive Measurement for Pomegranate Fruit

The different non-destructive testing (NDT) approaches for the quality assessment of pomegranate fruits are characterized by different challenges. One area of challenge with the application of NIRS, which is the most widely used approach for quality evaluation, is its acquisition setup. Several studies have demonstrated the importance of the mode of acquisition of spectral data on the accuracy of predictive models [122].
The MVS technique carries great potential as a fruit quality inspection tool; however, it is limited in its inability to detect internal defects and internal qualities [4]. It is ineffective for inline packhouse operations as it tends to miss internal defects. MVS is effective for grading (which is mostly based on size, weight and color). Additionally, spectral data have been shown to perform better than image (spatial) data for the analysis of pomegranate fruit [23]. Moreover, illumination has a crucial role in determining the effectiveness of imaging techniques. An adaptive threshold value is proposed during image processing analysis to counter the influence of illumination. There is also the case of cross-polarization during the image acquisition of fruit samples. Researchers have been able to reduce this effect by placing polarizing filters as shields in front of the lamps as well as camera lenses [91]. This approach helps to minimize the problem of bright spots and specular reflection when imaging pomegranate fruit.
The X-ray CT system usually requires high voltages to generate two-dimensional (2D) radioscopic fruit images. The typical voltage requirement ranges from 100 kV to 45 kV voltage [103,115]. Such lengthy exposure time as well as the effect of radiation has sparked some health concerns regarding the use of X-ray CT [113]. Another major challenge with the X-ray CT technique is the acquisition time. Arendse et al. [114] reported a total scanning time of one hour for each sample showing the very slow image acquisition characteristics of this technique. This problem renders this technique undesirable for automated and online grading applications. Future improvements in computing time and image acquisition would greatly improve the X-ray system as a real-time/online quality evaluation technique. Very limited research investigations of the electronic nose exhibiting the possibility for accessing pomegranate fruit quality have been implemented, and further studies should be aimed at utilizing the capability of the e-nose technique for other quality attributes’ evaluation.
Hyperspectral images with their spatial and spectral dimensions are usually large sets of information. To this end, data storage and analysis capabilities are frequent limitations of using hyperspectral data. Hence, image data size and dimensionality reduction are very important in HS image applications. By implementing dimensionality reduction, redundant information can be eliminated. This process considerably simplifies the subsequent processes of classification model development. The PLS, PCA and ANN methods are frequently used to perform dimensionality reduction [7,123,124].

7. Conclusions and Prospects

This review has reported the application of different non-destructive techniques for the evaluation of intact pomegranate fruit and its products. The application of infrared spectroscopy has been shown to predict the internal quality attributes such as soluble solid content, acidity, its ratio and vitamin C content as well as firmness. Evaluation of external attributes such as the presence of husk scald, carob moth larvae infestation and adulteration have also been implemented and accomplished for pomegranate fruit. Most of the imaging techniques focus on the evaluation of external parameters ranging from fruit color, size and appearance.
It is recommended that future research in imaging techniques should focus on improving their data acquisition speed and reducing the large data size to successfully develop a non-destructive pomegranate fruit quality evaluation system rather than separate techniques to evaluate the various quality parameters. Findings from this review show that very little has been achieved in investigating the feasibility of HSI and MSI for pomegranate quality analysis. Hyperspectral images with their spatial and spectral dimensions are usually large sets of information. To this end, data storage and analysis capabilities are frequent limitations of using hyperspectral data. Hence, image data size and dimensionality reduction are very important in HS image applications. By implementing dimensionality reduction, redundant information can be eliminated. This process considerably simplifies the subsequent processes of classification model development. Future research must explore the potential of this technique for a holistic quality analysis assessment of pomegranate fruits. The non-destructive techniques reviewed in this paper show the capabilities, benefits, applications and the evaluation of pomegranate fruit’s quality attributes.

Author Contributions

Conceptualization, funding acquisition, project administration, supervision, review and editing, U.L.O.; project administration and supervision, W.J.P.; review and editing, E.A.; supervision, review and editing, A.A.T.; writing—original draft preparation, E.E.O. All authors have read and agreed to the published version of the manuscript.

Funding

This work is based on the research supported in part by the National Research Foundation of South Africa (Grant Numbers: 64813). Research reported in this publication was supported in part by the Foundation for Food and Agriculture Research under award number—Grant ID: DFs-18-0000000008. The APC was funded by SA NRF grant number 64813.

Institutional Review Board Statement

Not applicable.

Data Availability Statement

Not applicable.

Acknowledgments

E.E.O. acknowledges the award of PhD bursary by Stellenbosch University.

Conflicts of Interest

The authors declare no conflict of interest. The funders had no role in the design of the study; in the collection, analyses, or interpretation of data; in the writing of the manuscript, or in the decision to publish the result.

References

  1. Pandey, C.; Sethy, P.K.; Biswas, P.; Behera, S.K.; Khan, M.R. Quality evaluation of pomegranate fruit using image processing techniques. In Proceedings of the 2020 International Conference on Communication and Signal Processing (ICCSP), Chennai, India, 28–30 July 2020; p. 19914067. [Google Scholar] [CrossRef]
  2. Opara, U.L.; Pathare, P.B. Bruise damage measurement and analysis of fresh horticultural produce—A review. Postharvest Biol. Technol. 2014, 91, 9–24. [Google Scholar] [CrossRef]
  3. Spielmanns, R.; Spielmanns, J.; Damerow, L.; Blanke, M.M. Non-destructive determination of surface features of pomegranate fruit. Acta Hortic. 2016, 1137, 247–250. [Google Scholar] [CrossRef]
  4. Khoshroo, A.; Keyhani, A.; Rafiee, S.; Zoroofi, R.A.; Zamani, Z. Pomegranate quality evaluation using machine vision. Acta Hortic. 2009, 818, 347–352. [Google Scholar] [CrossRef]
  5. Wang, H.; Peng, J.; Xie, C.; Bao, Y.; He, Y. Fruit quality evaluation using spectroscopy technology: A review. Sensors 2015, 15, 11889–11927. [Google Scholar] [CrossRef] [PubMed] [Green Version]
  6. Czieczor, L.; Bentkamp, C.; Damerow, L.; Blanke, M. Non-invasive determination of the quality of pomegranate fruit. Postharvest Biol. Technol. 2018, 136, 74–79. [Google Scholar] [CrossRef]
  7. Elmasry, G.; Kamruzzaman, M.; Sun, D.-W.; Allen, P. Principles and applications of hyperspectral imaging in quality evaluation of agro-food products: A review. Crit. Rev. Food Sci. Nutr. 2012, 52, 8398. [Google Scholar] [CrossRef]
  8. Matityahu, I.; Marciano, P.; Holland, D.; Ben-Arie, R.; Amir, R. Differential effects of regular and controlled atmosphere storage on the quality of three cultivars of pomegranate (Punica granatum L.). Postharvest Biol. Technol. 2016, 115, 132–141. [Google Scholar] [CrossRef]
  9. Khoshroo, A.; Keyhani, A.; Zoroofi, R.A.; Rafiee, S.; Zamani, Z.; Alsharif, M.R. Classification of pomegranate fruit using texture analysis of MR images. Agric. Eng. Int. CIGR J. 2009, 11, 1182. [Google Scholar]
  10. Okere, E.E. Non-Invasive Measurement of Quality Attributes of Processed Pomegranate Products. Master’s Thesis, Stellenbosch University, Stellenbosch, South Africa, 2020. [Google Scholar]
  11. Pareek, S.; Valero, D.; Serrano, M. Postharvest biology and technology of pomegranate. J. Sci. Food Agric. 2015, 95, 2360–2379. [Google Scholar] [CrossRef] [PubMed]
  12. Karimi, M.; Sadeghi, R.; Kokini, J. Pomegranate as a promising opportunity in medicine and nanotechnology. Trends Food Sci. Technol. 2017, 69, 59–73. [Google Scholar] [CrossRef]
  13. Fawole, O.A.; Opara, U.L. Developmental changes in maturity indices of pomegranate fruit: A descriptive review. Sci. Hortic. 2013, 159, 152–161. [Google Scholar] [CrossRef]
  14. Lansky, E.P.; Newman, R.A. Punica granatum (pomegranate) and its potential for prevention and treatment of inflammation and cancer. J. Ethnopharmacol. 2007, 109, 177–206. [Google Scholar] [CrossRef] [PubMed]
  15. Opara, L.U.; Al-Ani, M.R.; Al-Shuaibi, Y.S. Physico-chemical properties, vitamin c content, and antimicrobial properties of pomegranate fruit (Punica granatum L.). Food Bioprocess Technol. 2009, 2, 315–321. [Google Scholar] [CrossRef]
  16. Holland, D.; Hatib, K.; Barya, I. Pomegranate: Botany, horticulture, breeding. In Horticultural Reviews; John Wiley Sons, Inc.: Hoboken, NJ, USA, 2009; Volume 35, pp. 127–192. [Google Scholar]
  17. Dhinesh, K.; Ramasamy, D. Pomegranate processing and value addition: Review. J. Food Process. Technol. 2016, 7, 565. [Google Scholar] [CrossRef] [Green Version]
  18. Akuru, E.A.; Oyeagu, C.E.; Mpendulo, T.C.; Rautenbach, F.; Oguntibeju, O.O. Effect of pomegranate (Punica granatum L.) peel powder meal dietary supplementation on antioxidant status and quality of breast meat in broilers. Heliyon 2020, 6, e05709. [Google Scholar] [CrossRef]
  19. Akuru, E.A.; Mpendulo, C.T.; Oyeagu, C.E.; Nantapo, C.W.T. Pomegranate (Punica granatum L.) peel powder meal supplementation in broilers: Effect on growth performance, digestibility, carcase and organ weights, serum and some meat antioxidant enzyme biomarkers. Ital. J. Anim. Sci. 2021, 20, 119–131. [Google Scholar] [CrossRef]
  20. Magangana, T.P.; Makunga, N.P.; la Grange, C.; Stander, M.A.; Fawole, O.A.; Opara, U.L. Blanching pre-treatment promotes high yields, bioactive compounds, antioxidants, enzyme inactivation and antibacterial activity of ‘wonderful’ pomegranate peel extracts at three different harvest maturities. Antioxidants 2021, 10, 1119. [Google Scholar] [CrossRef]
  21. Magangana, T.P.; Makunga, N.P.; Fawole, O.A.; Stander, M.A.; Opara, U.L. Antioxidant, antimicrobial, and metabolomic characterization of blanched pomegranate peel extracts: Effect of cultivar. Molecules 2022, 27, 2979. [Google Scholar] [CrossRef]
  22. Khodabakhshian, R.; Emadi, B.; Khojastehpour, M.; Golzarian, M.R.; Sazgarnia, A. Development of a multispectral imaging system for online quality assessment of pomegranate fruit. Int. J. Food Prop. 2017, 20, 107–118. [Google Scholar] [CrossRef] [Green Version]
  23. Munera, S.; Hernández, F.; Aleixos, N.; Cubero, S.; Blasco, J. Maturity monitoring of intact fruit and arils of pomegranate cv. ‘Mollar de Elche’ using machine vision and chemometrics. Postharvest Biol. Technol. 2019, 156, 110936. [Google Scholar] [CrossRef]
  24. Zhang, L.; McCarthy, M.J. Assessment of pomegranate postharvest quality using nuclear magnetic resonance. Postharvest Biol. Technol. 2013, 77, 59–66. [Google Scholar] [CrossRef]
  25. Kumar, A.; Rajpurohit, V.S.; Bidari, K.Y. Multi class grading and quality assessment of pomegranate fruits based on physical and visual parameters. Int. J. Fruit Sci. 2019, 19, 372–396. [Google Scholar] [CrossRef]
  26. Arendse, E.; Amos, O.; Samukelo, L.; Linus, U. Non-destructive prediction of internal and external quality attributes of fruit with thick rind: A review. J. Food Eng. 2018, 217, 11–23. [Google Scholar] [CrossRef]
  27. Nturambirwe, J.F.I.; Opara, U.L. Machine learning applications to non-destructive defect detection in horticultural products. Biosyst. Eng. 2020, 189, 60–83. [Google Scholar] [CrossRef]
  28. Okere, E.E.; Arendse, E.; Nieuwoudt, H.; Fawole, O.A.; Perold, W.J.; Opara, U.L. Non-invasive methods for predicting the quality of processed horticultural food products, with emphasis on dried powders, juices and oils: A review. Foods 2021, 10, 3061. [Google Scholar] [CrossRef]
  29. Su, W.-H.; Sun, D.-W. Fourier transform infrared and Raman and hyperspectral imaging techniques for quality determinations of powdery foods: A review. Compr. Rev. Food Sci. Food Saf. 2018, 17, 104–122. [Google Scholar] [CrossRef]
  30. Su, W.-H.; He, H.-J.; Sun, D.-W. Non-destructive and rapid evaluation of staple foods quality by using spectroscopic techniques: A review. Crit. Rev. Food Sci. Nutr. 2017, 57, 1039–1051. [Google Scholar] [CrossRef]
  31. Zhen, O.P.; Hashim, N.; Maringgal, B. Quality evaluation of mango using non-destructive approaches: A review. J. Agric. Food Eng. 2020, 1, 0003. [Google Scholar] [CrossRef]
  32. Arendse, E.; Nieuwoudt, H.; Magwaza, L.S.; Fredric, J.; Nturambirwe, I.; Fawole, O.A.; Opara, U.L. Recent advancements on vibrational spectroscopic techniques for the detection of authenticity and adulteration in horticultural products with a specific focus on oils, juices and powders. Food Bioprocess Technol. 2020, 14, 1–22. [Google Scholar] [CrossRef]
  33. Magwaza, L.S.; Opara, U.L.; Nieuwoudt, H.; Cronje, P.J.R.; Saeys, W. NIR spectroscopy applications for internal and external quality analysis of citrus fruit—A review. Food Bioprocess Technol. 2012, 5, 425–444. [Google Scholar] [CrossRef]
  34. Sun, T.; Huang, K.; Xu, H.; Ying, Y. Research advances in nondestructive determination of internal quality in watermelon/melon: A review. J. Food Eng. 2010, 100, 569–577. [Google Scholar] [CrossRef]
  35. Seeram, N.P.; Zhang, Y.; Reed, J.D.; Krueger, C.G.; Vaya, J. Pomegranates. In Ancient Roots to Modern Medicine; Medicinal and Aromatic Plants—Industrial Profiles; CRC Press: Boca Raton, FL, USA, 2006; pp. 1–263. [Google Scholar]
  36. Teixeira da Silva, J.A.; Rana, T.S.; Narzary, D.; Verma, N.; Meshram, D.T.; Ranade, S.A. Pomegranate biology and biotechnology: A review. Sci. Hortic. 2013, 160, 85–107. [Google Scholar] [CrossRef]
  37. Fukuda, S. Emotion and innovation. In Emotional Engineering; Springer: Cham, Switzerland, 2013; Volume 2, pp. 11–21. [Google Scholar]
  38. Barrett, D.M.; Beaulieu, J.C.; Shewfelt, R. Color, flavor, texture, and nutritional quality of fresh-cut fruits and vegetables: Desirable levels, instrumental and sensory measurement, and the effects of processing. Crit. Rev. Food Sci. Nutr. 2010, 50, 369–389. [Google Scholar] [CrossRef] [PubMed]
  39. Fawole, O.A.; Opara, U.L. Effects of maturity status on biochemical content, polyphenol composition and antioxidant capacity of pomegranate fruit arils (cv. ‘Bhagwa’). S. Afr. J. Bot. 2013, 85, 23–31. [Google Scholar] [CrossRef] [Green Version]
  40. Mphahlele, R.R.; Caleb, O.J.; Fawole, O.A.; Opara, U.L. Effects of different maturity stages and growing locations on changes in chemical, biochemical and aroma volatile composition of “Wonderful” pomegranate juice. J. Sci. Food Agric. 2016, 96, 1002–1009. [Google Scholar] [CrossRef] [PubMed]
  41. Opara, I.K.; Fawole, O.A.; Kelly, C.; Opara, U.L. Quantification of on-farm pomegranate fruit postharvest losses and waste, and implications on sustainability indicators: South African case study. Sustainability 2021, 13, 5168. [Google Scholar] [CrossRef]
  42. Opara, I.K.; Fawole, O.A.; Opara, U.L. Postharvest losses of pomegranate fruit at the packhouse and implications for sustainability indicators. Sustainability 2021, 13, 5187. [Google Scholar] [CrossRef]
  43. Pathare, P.B.; Opara, U.L.; Al-Said, F.A.J. Colour measurement and analysis in fresh and processed foods: A review. Food Bioprocess Technol. 2013, 6, 36–60. [Google Scholar] [CrossRef]
  44. Zele, A.J.; Feigl, B.; Adhikari, P.; Maynard, M.L.; Cao, D. Melanopsin photoreception contributes to human visual detection, temporal and colour processing. Sci. Rep. 2018, 8, 3842. [Google Scholar] [CrossRef] [Green Version]
  45. Al-Said, F.A.; Opara, L.U.; Al-Yahyai, R.A. Physico-chemical and textural quality attributes of pomegranate cultivars (Punica granatum L.) grown in the Sultanate of Oman. J. Food Eng. 2009, 90, 129–134. [Google Scholar] [CrossRef]
  46. Ekrami-Rad, N.; Khazaei, J.; Khoshtaghaza, M.H. Selected mechanical properties of pomegranate peel and fruit. Int. J. Food Prop. 2011, 14, 570–582. [Google Scholar] [CrossRef]
  47. Rao, M.A.; Steffe, J.F. Viscoelastic Properties of Foods; Elsevier Applied Science: New York, NY, USA, 1992. [Google Scholar]
  48. Cavalcante, I.H.L.; Cavalcante, L.F.; de Sousa Miranda, J.M.; Martins, A.B.G. Physical and chemical characteristics of tropical and non-conventional fruits. In Food Industrial Processes—Methods and Equipment; IntechOpen: London, UK, 2012. [Google Scholar] [CrossRef] [Green Version]
  49. Fawole, O.A.; Opara, U.L. Changes in physical properties, chemical and elemental composition and antioxidant capacity of pomegranate (cv. Ruby) fruit at five maturity stages. Sci. Hortic. 2013, 150, 37–46. [Google Scholar] [CrossRef]
  50. Adetoro, A.O.; Opara, U.L.; Fawole, O.A. Effect of hot-air and freeze-drying on the quality attributes of dried pomegranate (Punica granatum L.) arils during long-term cold storage of whole fruit. Agriculture 2020, 10, 493. [Google Scholar] [CrossRef]
  51. Kaseke, T.; Opara, U.L.; Fawole, O.A. Effect of microwave pretreatment of seeds on the quality and antioxidant capacity of pomegranate seed oil. Foods 2020, 9, 1287. [Google Scholar] [CrossRef] [PubMed]
  52. Kaseke, T.; Fawole, O.A.; Mokwena, L.; Opara, U.L. Effect of cultivar and blanching of pomegranate seeds on physicochemical properties, nutritional qualities and antioxidant capacity of extracted oil. J. Food Meas. Charact. 2021, 15, 93–106. [Google Scholar] [CrossRef]
  53. Viuda-Martos, M.; Fernández-Lóaez, J.; Pérez-álvarez, J.A. Pomegranate and its many functional components as related to human health: A review. Compr. Rev. Food Sci. Food Saf. 2010, 9, 635–654. [Google Scholar] [CrossRef]
  54. Parashar, A.; Gupta, S.K.; Kumar, A. Studies on separation techniques of pomegranate seeds and their effect on quality of Anardana. African J. Biochem. Res. 2009, 3, 340–343. [Google Scholar]
  55. More, V.; Kapse, B.; Kadam, A.; Pimpalpalle, L. Studies on drying of pomegranate arils for preparation of anardana. Int. J. Chem. Stud. 2017, 5, 724–728. [Google Scholar]
  56. Adetoro, A.O.; Opara, U.L.; Fawole, O.A. Effect of blanching on enzyme inactivation, physicochemical attributes and antioxidant capacity of hot-air dried pomegranate (Punica granatum L.) arils (cv. wonderful). Processes 2021, 9, 25. [Google Scholar] [CrossRef]
  57. Bakshi, P.; Bhushan, B.; Wali, V.K.; Bakshi, M.; Sharma, A.; Bhat, D.J. Standardization of drying method and organoleptic evaluation of wild pomegranate (Anardana) seeds. World J. Agric. Sci. 2013, 9, 397–400. [Google Scholar]
  58. Singh, D.; Dayal, H. Drying of pomegranate seeds (Anardana) under different conditions. Acta Hortic. 2015, 890, 433–439. [Google Scholar] [CrossRef]
  59. Khoddami, A.; Man, Y.B.C.; Roberts, T.H. Physico-chemical properties and fatty acid profile of seed oils from pomegranate (Punica granatum L.) extracted by cold pressing. Eur. J. Lipid Sci. Technol. 2014, 116, 553–562. [Google Scholar] [CrossRef]
  60. Venkata, C.; Prakash, S.; Prakash, I. Bioactive chemical constituents from pomegranate (Punica granatum) juice, seed and peel-A review. Int. J. Res. Chem. Environ. Int. J. Res. Chem. Environ. 2011, 1, 1–181. [Google Scholar]
  61. Kaseke, T.; Opara, U.L.; Fawole, O.A. Novel seeds pretreatment techniques: Effect on oil quality and antioxidant properties: A review. J. Food Sci. Technol. 2021, 58, 4451–4464. [Google Scholar] [CrossRef]
  62. Paul, A.; Radhakrishnan, M. Pomegranate seed oil in food industry: Extraction, characterization, and applications. Trends Food Sci. Technol. 2020, 105, 273–283. [Google Scholar] [CrossRef]
  63. Mphahlele, R.R.; Fawole, O.A.; Mokwena, L.M.; Opara, U.L. Effect of extraction method on chemical, volatile composition and antioxidant properties of pomegranate juice. S. Afr. J. Bot. 2016, 103, 135–144. [Google Scholar] [CrossRef]
  64. Mphahlele, R.R. Impacts of Preharvest and Postharvest Handling and Processing on Bioactive Compounds and Functional Properties of Pomegranate Fruit Fractions and by-Products. Ph.D. Thesis, Stellenbosch University, Stellenbosch, South Africa, 2016. [Google Scholar]
  65. Nicolaï, B.M.; Beullens, K.; Bobelyn, E.; Peirs, A.; Saeys, W.; Theron, K.I.; Lammertyn, J. Nondestructive measurement of fruit and vegetable quality by means of NIR spectroscopy: A Review. Postharvest Biol. Technol. 2007, 46, 99–118. [Google Scholar] [CrossRef]
  66. Mouazen, A.M.; Nicolaï, B.; Terry, L.A. The use of Vis/NIRS and chemometric analysis to predict fruit defects and postharvest behaviour of ‘Nules Clementine’ mandarin fruit. Food Chem. 2014, 163, 267–274. [Google Scholar] [CrossRef]
  67. Nicolaï, B.M.; Bulens, I.; De Baerdemaker, J.; De Ketelaere, B.; Hertog, M.L.A.T.M.; Verboven, P.; Lammertyn, J. Non-destructive evaluation: Detection of external and internal attributes frequently associated with quality and damage. In Postharvest Handling, 3rd ed.; A Systems Approach; Academic Press: Cambridge, MA, USA, 2014; pp. 363–385. [Google Scholar]
  68. Arendse, E.; Fawole, O.A.; Magwaza, L.S.; Nieuwoudt, H.H.; Opara, U.L. Development of calibration models for the evaluation of pomegranate aril quality by Fourier-transform near infrared spectroscopy combined with chemometrics. Biosyst. Eng. 2017, 159, 22–32. [Google Scholar] [CrossRef]
  69. Arendse, E.; Fawole, O.A.; Magwaza, L.S.; Nieuwoudt, H.H.; Opara, U.L. Fourier transform near infrared diff use reflectance spectroscopy and two spectral acquisition modes for evaluation of external and internal quality of intact pomegranate fruit. Postharvest Biol. Technol. 2018, 138, 91–98. [Google Scholar] [CrossRef]
  70. Khodabakhshian, R.; Emadi, B.; Khojastehpour, M.; Golzarian, M.R.; Sazgarnia, A. Quick quality evaluation of pomegranate arils using NIR spectroscopy. Iran. Res. Organ. Food Sci. Technol. 2015, 2, 103–114. [Google Scholar]
  71. Arendse, E.; Fawole, O.A.; Magwaza, L.S.; Nieuwoudt, H.; Opara, U.L. Evaluation of biochemical markers associated with the development of husk scald and the use of diffuse reflectance NIR spectroscopy to predict husk scald in pomegranate fruit. Sci. Hortic. 2018, 232, 240–249. [Google Scholar] [CrossRef]
  72. Jamshidi, B.; Mohajerani, E.; Farazmand, H.; Mahmoudi, A.; Hemmati, A. Pattern recognition-based optical technique for non-destructive detection of Ectomyelois ceratoniae infestation in pomegranates during hidden activity of the larvae. Spectrochim. Acta-Part A Mol. Biomol. Spectrosc. 2019, 206, 552–557. [Google Scholar] [CrossRef] [PubMed]
  73. Khodabakhshian, R.; Emadi, B.; Khojastehpour, M.; Golzarian, R.; Sazgarnia, A. Non-destructive evaluation of maturity and quality parameters of pomegranate fruit by visible/near infrared spectroscopy. Int. J. Food Prop. 2016, 20, 41–52. [Google Scholar] [CrossRef]
  74. Khodabakhshian, R. Feasibility of using Raman spectroscopy for detection of tannin changes in pomegranate fruits during maturity. Sci. Hortic. 2019, 257, 108670. [Google Scholar] [CrossRef]
  75. Arendse, E.; Fawole, O.A.; Magwaza, L.S.; Nieuwoudt, H.; Opara, U.L. Comparing the analytical performance of near and mid infrared spectrometers for evaluating pomegranate juice quality. Food Sci. Technol. 2018, 91, 180–190. [Google Scholar] [CrossRef]
  76. Vardin, H.; Tay, A.; Ozen, B.; Mauer, L. Authentication of pomegranate juice concentrate using FTIR spectroscopy and chemometrics. Food Chem. 2008, 108, 742–748. [Google Scholar] [CrossRef] [Green Version]
  77. Boggia, R.; Casolino, M.C.; Hysenaj, V.; Oliveri, P.; Zunin, P. A screening method based on UV-Visible spectroscopy and multivariate analysis to assess addition of filler juices and water to pomegranate juices. Food Chem. 2013, 140, 735–741. [Google Scholar] [CrossRef]
  78. Okere, E.E.; Nieuwoudt, H.; Perold, W.J.; Opara, U.L. Non-destructive evaluation of the quality characteristics of pomegranate kernel oil by fourier transform near-infrared and mid-infrared spectroscopy. Front. Plant Sci. 2022, 13, 867555. [Google Scholar] [CrossRef]
  79. Uncu, O.; Napiórkowska, A.; Szajna, T.K.; Ozen, B. Evaluation of three spectroscopic techniques in determination of adulteration of cold pressed pomegranate seed oils. Microchem. J. 2020, 158, 105128. [Google Scholar] [CrossRef]
  80. Adiani, V.; Gupta, S.; Ambolikar, R.; Variyar, P.S. Development of rapid method to assess microbial quality of minimally processed pomegranate arils using FTIR. Sensors Actuators B. 2018, 260, 800–807. [Google Scholar] [CrossRef]
  81. Yang, D.; Ying, Y. Applications of Raman spectroscopy in agricultural products and food analysis: A review. Appl. Spectrosc. Rev. 2011, 46, 539–560. [Google Scholar] [CrossRef]
  82. Raman, C.V.; Krishnan, K.S. A new type of secondary radiation. Nature 1928, 121, 501–502. [Google Scholar] [CrossRef]
  83. Xu, Y.; Zhong, P.; Jiang, A.; Shen, X.; Li, X.; Xu, Z.; Shen, Y.; Sun, Y.; Lei, H. Raman spectroscopy coupled with chemometrics for food authentication: A review. Trends Anal. Chem. 2020, 131, 116017. [Google Scholar] [CrossRef]
  84. Nikbakht, A.M.; Hashjin, T.T.; Malekfar, R.; Gobadian, B. Nondestructive determination of tomato fruit quality parameters using raman spectroscopy. J. Agr. Sci. Tech. 2011, 13, 517–526. [Google Scholar]
  85. Khodabakhshian, R.; Abbaspour-Fard, M.H. Pattern recognition-based Raman spectroscopy for non-destructive detection of pomegranates during maturity. Spectrochim. Acta-Part A Mol. Biomol. Spectrosc. 2020, 231, 118127. [Google Scholar] [CrossRef]
  86. Bhargava, A.; Bansal, A. Fruits and vegetables quality evaluation using computer vision: A review. J. King Saud Univ.-Comput. Inf. Sci. 2021, 33, 243–257. [Google Scholar] [CrossRef]
  87. Penumuru, D.P.; Muthuswamy, S.; Karumbu, P. Identification and classification of materials using machine vision and machine learning in the context of industry 4.0. J. Intell. Manuf. 2020, 31, 1229–1241. [Google Scholar] [CrossRef]
  88. Tripathi, M.K.; Maktedar, D.D. A role of computer vision in fruits and vegetables among various horticulture products of agriculture fields: A survey. Inf. Process. Agric. 2020, 7, 183–203. [Google Scholar] [CrossRef]
  89. Kumar, R.A.; Rajpurohit, V.S.; Nargund, V.B. A neural network assisted machine vision system for sorting pomegranate fruits. In Proceedings of the 2017 Second International Conference on Electrical, Computer and Communication Technologies (ICECCT), Coimbatore, India, 22–24 February 2017. [Google Scholar] [CrossRef]
  90. Fashi, M.; Naderloo, L.; Javadikia, H. Pomegranate grading based on pH using image processing and artificial intelligence. J. Food Meas. Charact. 2020, 14, 3112–3121. [Google Scholar] [CrossRef]
  91. Gurubelli, Y.; Ramanathan, M.; Ponnusamy, P. Fractional fuzzy 2DLDA approach for pomegranate fruit grade classification. Comput. Electron. Agric. 2019, 162, 95–105. [Google Scholar] [CrossRef]
  92. Blasco, J. Short communication. Automatic inspection of the pomegranate (Punica granatum L.) arils quality by means of computer vision. SJAR 2008, 6, 12–16. [Google Scholar]
  93. Blasco, J.; Cubero, S.; Gómez-Sanchís, J.; Mira, P.; Moltó, E. Development of a machine for the automatic sorting of pomegranate (Punica granatum) arils based on computer vision. J. Food Eng. 2009, 90, 27–34. [Google Scholar] [CrossRef]
  94. Fashi, M.; Naderloo, L.; Javadikia, H. The relationship between the appearance of pomegranate fruit and color and size of arils based on image processing. Postharvest Biol. Technol. 2019, 154, 52–57. [Google Scholar] [CrossRef]
  95. Srivastava, S.; Sadistap, S. Data processing approaches and strategies for non-destructive fruits quality inspection and authentication: A review. J. Food Meas. Charact. 2018, 12, 2758–2794. [Google Scholar] [CrossRef]
  96. Akin, C.; Kirci, M.; Gunes, E.O.; Cakir, Y. Detection of the pomegranate fruits on tree using image processing. In Proceedings of the 2012 First International Conference on Agro- Geoinformatics (Agro-Geoinformatics), Shanghai, China, 2–4 August 2012; Volume 2, pp. 632–636. [Google Scholar]
  97. Bakhshipour, A.; Jafari, A.; Hosseini, S.M. Recognition of pomegranate on tree and stereoscopic locating of the fruit. J. Agric. Environ. Sci 2012, 12, 1288–1294. [Google Scholar]
  98. Behera, S.K.; Pattnaik, A.; Rath, A.K.; Barpanda, N.K.; Sethy, P.K. Yield estimation of pomegranate using image processing techniques. Int. J. Innov. Technol. Explor. Eng. 2019, 8, 798–803. [Google Scholar]
  99. Salmanizadeh, F.; Nassiri, S.M.; Jafari, A.; Bagheri, M.H. Volume estimation of two local pomegranate fruit (Punica granatum L.) cultivars and their components using non-destructive X-ray computed tomography technique. Int. J. Food Prop. 2015, 18, 439–455. [Google Scholar] [CrossRef] [Green Version]
  100. Zhang, L.; McCarthy, M.J. Black heart characterization and detection in pomegranate using NMR relaxometry and MR imaging. Postharvest Biol. Technol. 2012, 67, 96–101. [Google Scholar] [CrossRef]
  101. Nouri, B.; Mohtasebi, S.S.; Rafiee, S. Quality detection of pomegranate fruit infected with fungal disease. Int. J. Food Prop. 2020, 23, 9–21. [Google Scholar] [CrossRef] [Green Version]
  102. Sanaeifar, A.; Mohtasebi, S.S.; Ghasemi-varnamkhasti, M.; Shafie, M.M. Evaluation of an electronic nose system for characterization of pomegranate varieties. AgricEngInt CIGR J. 2016, 18, 317–323. [Google Scholar]
  103. Payel, G.; Sunil, E.C.K. Quality analysis of pomegranate by non-destructive soft X-ray method. J. Food Process. Technol. 2014, 5, 6. [Google Scholar] [CrossRef] [Green Version]
  104. Nturambirwe, J.F.I. Advances in Spectral Techniques for Fruit Quality Evaluation: Case of ULF-NMR and NIRS. Ph.D. Thesis, Stellenbosch University, Stellenbosch, South Africa, 2017. [Google Scholar]
  105. Stepisnik, J. Spectroscopy: NMR down to Earth. Nature 2006, 439, 799–801. [Google Scholar] [CrossRef] [PubMed]
  106. Eberle, K. Evaluation of near Infrared and Nuclear Magnetic Resonance Spectroscopy for Rapid Quality Control of South African Extra Virgin Olive Oils. Master’s Thesis, Stellenbosch University, Stellenbosch, South Africa, 2005. [Google Scholar]
  107. Schoeman, L.; Williams, P.; du Plessis, A.; Manley, M. X-ray micro-computed tomography (μCT) for non-destructive characterisation of food microstructure. Trends Food Sci. Technol. 2016, 47, 10–24. [Google Scholar] [CrossRef]
  108. Du Plessis, A.; Broeckhoven, C.; Guelpa, A.; le Roux, S.G. Laboratory x-ray micro-computed tomography: A user guideline for biological samples. Gigascience 2017, 6, 1–11. [Google Scholar] [CrossRef] [Green Version]
  109. Arendse, E.; Fawole, O.A.; Opara, U.L. Discrimination of pomegranate fruit quality by instrumental and sensory measurements during storage at three temperature regimes. J. Food Process. Preserv. 2014, 39, 1745–4549. [Google Scholar] [CrossRef]
  110. Léonard, A.; Blacher, S.; Nimmol, C.; Devahastin, S. Effect of far-infrared radiation assisted drying on microstructure of banana slices: An illustrative use of X-ray microtomography in microstructural evaluation of a food product. J. Food Eng. 2008, 85, 154–162. [Google Scholar] [CrossRef]
  111. Magwaza, L.S.; Opara, U.L. Investigating non-destructive quantification and characterization of pomegranate fruit internal structure using X-ray computed tomography. Postharvest Biol. Technol. 2014, 95, 1–6. [Google Scholar] [CrossRef]
  112. Arendse, E.; Fawole, O.A.; Magwaza, L.S.; Opara, U.L. Estimation of the density of pomegranate fruit and their fractions using X-ray computed tomography calibrated with polymeric materials. Biosyst. Eng. 2016, 148, 148–156. [Google Scholar] [CrossRef]
  113. Arendse, E.; Fawole, O.A.; Magwaza, L.; Opara, U.L. Non-destructive estimation of pomegranate juice content of intact fruit using X-ray computed tomography. Acta Hortic. 2018, 1201, 297–302. [Google Scholar] [CrossRef]
  114. Arendse, E.; Fawole, O.A.; Magwaza, L.S.; Opara, U.L. Non-destructive characterization and volume estimation of pomegranate fruit external and internal morphological fractions using X-ray computed tomography. J. Food Eng. 2016, 186, 42–49. [Google Scholar] [CrossRef]
  115. Hussein, Z. Bruise Damage Susceptibility of Pomegranates. Ph.D. Thesis, Stellenbosch University, Stellenbosch, South Africa, 2019. [Google Scholar]
  116. Kamruzzaman, M.; Barbin, D.; Elmasry, G.; Sun, D.W.; Allen, P. Potential of hyperspectral imaging and pattern recognition for categorization and authentication of red meat. Innov. Food Sci. Emerg. Technol. 2012, 16, 316–325. [Google Scholar] [CrossRef]
  117. Baiano, A.; Terracone, C.; Peri, G.; Romaniello, R. Application of hyperspectral imaging for prediction of physico-chemical and sensory characteristics of table grapes. Comput. Electron. Agric. 2012, 87, 142–151. [Google Scholar] [CrossRef]
  118. Feng, Y.Z.; Sun, D.-W. Application of hyperspectral imaging in food safety inspection and control: A review. Crit. Rev. Food Sci. Nutr. 2012, 52, 1039–1058. [Google Scholar] [CrossRef] [PubMed]
  119. Gowen, A.A.; Feng, Y.; Gaston, E.; Valdramidis, V. Recent applications of hyperspectral imaging in microbiology. Talanta 2015, 137, 43–54. [Google Scholar] [CrossRef]
  120. Su, W.-H.; Sun, D.-W. Potential of hyperspectral imaging for visual authentication of sliced organic potatoes from potato and sweet potato tubers and rapid grading of the tubers according to moisture proportion. Comput. Electron. Agric. 2016, 125, 113–124. [Google Scholar] [CrossRef]
  121. Su, W.-H.; Sun, D.-W. Multispectral imaging for plant food quality analysis and visualization. CRFSFS 2018, 17, 220–239. [Google Scholar] [CrossRef] [Green Version]
  122. Hong, F.W.; Chia, K.S. A review on recent near infrared spectroscopic measurement setups and their challenges. Meas. J. Int. Meas. Confed. 2021, 171, 108732. [Google Scholar] [CrossRef]
  123. Che, W.; Sun, L.; Zhang, Q.; Tan, W.; Ye, D.; Zhang, D.; Liu, Y. Pixel based bruise region extraction of apple using Vis-NIR hyperspectral imaging. Comput. Electron. Agric. 2018, 146, 12–21. [Google Scholar] [CrossRef]
  124. Fu, X.; Wang, M. Detection of early bruises on pears using fluorescence hyperspectral imaging technique. Food Anal. Methods 2022, 15, 115–123. [Google Scholar] [CrossRef]
Figure 1. Pomegranate whole fruit and its different products—(a) whole fruit, (b) fresh-cut fruit, (c) fresh aril, (d) dried aril, (e) seed oil, (f) juice.
Agriculture 12 02034 g001
Figure 2. Spectral profile of different fruit juice samples analysed using a UV–VIS spectroscopy-based method. Red lines for authentic lab-prepared pomegranate juices (PA), ginger lines for commercial pomegranate juices, blue line for commercial grape juices and green lines for commercial apple juices. Adopted from Boggia et al. [77]. A is for absorbance.
Agriculture 12 02034 g002
Figure 3. (a). Fruit samples and arils of pomegranate (Ashraf cultivar) at different maturity stages. Immature stage (88 days after full bloom (DAFB), half-ripe stage (109 DAFB), fairly half-ripe stage (124 DAFB) and fully ripe stage (143 DAFB). Adapted from [85]. (b). A Raman spectra profile of four different maturity stages of intact pomegranate fruit at different maturity stages. Stage 1 (88), stage 2 (109), stage 3 (124) and stage 4 (143) (DAFB). Adopted from [85].
Agriculture 12 02034 g003aAgriculture 12 02034 g003b
Figure 4. Different color images of pomegranate fruit using machine vision systems for quality grading. The color channels are described as (a): RGB, (b): gray scale, (c): CMY, (d): HSV, (e): YCbCr and (f): YUV. Adapted from [90].
Agriculture 12 02034 g004
Figure 5. Flow chart of disease detection algorithm using color space conversion method.
Agriculture 12 02034 g005
Figure 6. The image processing and the defect identification algorithm flowchart for soft X-ray application in detection of defect in pomegranate fruit. Adapted from [103].
Agriculture 12 02034 g006
Figure 7. Schematics illustrating the configuration of a hyperspectral system.
Agriculture 12 02034 g007
Figure 8. Illustration of a typical data acquisition setup for an e-nose system application. Adapted from [102]. V1-V3 represent electrovalves as clearly shown by arrow to V2.
Agriculture 12 02034 g008
Table 3. Summary of application of Vis/NIR spectroscopy for processed pomegranate product quality analysis.
ProductsQuality AttributesPrediction StatisticsData AnalysisReferences
Fresh arilTSS
TA
pH
TAC
TPC
Brim A
Firmness
TSS/TA
Hue angle
Vitamin C
Chroma
a*
R2 = 0.875, RMSEP = 0.30%
R2 = 0.855, RMSEP = 0.10%
R2 = 0.851, RMSEP = 0.10
R2 = 0.705, RMSEP = 0.13 g/L
R2 = 0.864, RMSEP = 0.11 g/L
R2 = 0.834, RMSEP = 0.43
R2 = 0.684, RMSEP = 6.71 N
R2 = 0.822, RMSEP = 1.03
R2 = 0.885, RMSEP = 4.19
R2 = 0.848, RMSEP = 0.09 g/L
R2 = 0.783, RMSEP = 2.31
R2 = 0.735, RMSEP = 1.67
PLS, PCA[68]
Minimally processed arilTVC
Y&M
R2 = 0.909, SEP = 0.914
R2 = 0.929, SEP = 0.777
ANN
PLS-R
[80]
Dried arilTA
TSS/TA
pH
a*
Chroma
R2 = 0.850, RMSEP = 0.041
R2 = 0.756, RMSEP = 1.951
R2 = 0.863, RMSEP = 0.131
R2 = 0.720, RMSEP = 1.815
R2 = 0.703, RMSEP = 1.986
PLS, SVM[10]
PJTSS
TA
pH
TAC
TPC
Brim A
TSS/TA
Hue angle
Vitamin C
Chroma
a*
R2 = 0.923, RMSEP = 0.31%
R2 = 0.862, RMSEP = 0.11%
R2 = 0.670, RMSEP = 0.17
R2 = 0.663, RMSEP = 0.19 g/L
R2 = 0.591, RMSEP = 0.18 g/L
R2 = 0.906, RMSEP = 0.40
R2 = 0.768, RMSEP = 1.00
R2 = 0.466, RMSEP = 1.67
R2 = 0.709, RMSEP = 0.11 g/L
R2 = 0.832, RMSEP = 3.81
R2 = 0.816, RMSEP = 3.78
PLS, PCA[75]
ArilTSS
TA
pH
R2= 0.92, RMSEP= 0.23 °Brix
R2 = 0.93, RMSEP = 0.26%
R2 = 0.85, RMSEP = 0.064
PLS[22]
PJAdulteration
TA
TSS
R2 = 0.975
R2 = 0.911
R2 = 0.991
PCA, PLS[76]
PSOTCC
PV
RI
R2 = 0.8045
R2 = 0.620
R2 = 0.8092
PLS-R[10]
PSOAdulteration detectionCA ≥ 88%OPLS-DA[79]
a*, represents redness (+a*) or greenness (−a*), PV, Peroxide value, PSO, pomegranate seed oil, PJ, pomegranate juice, OPLS-DA, orthogonal partial least squares discriminant analysis, PLS-R, partial least squares regression, ANN, artificial neural networks, RI, refractive index, TA, titratable acidity, TCC, total carotenoid content, TVC, total viable count, Y&M, yeast and mold count.
Table 5. Comparison of conventional machine vision (CMVS), near-infrared spectroscopy (NIRS), multispectral imaging (MSI) and hyperspectral imaging (HSI).
FeatureCMVSSpectroscopyHSIMSI
Detect small sized sampleYESNOYESYES
Flexibility of spectral extractionNONOYESYES
Generation of quality attributes distributionNONOYESLimited
Multi-constituent informationNOYESYESLimited
Spectral informationNOYESYESYES
Spatial informationYESNOYESYES
Publisher’s Note: MDPI stays neutral with regard to jurisdictional claims in published maps and institutional affiliations.

