Article

Development of a General Prediction Model of Moisture Content in Maize Seeds Based on LW-NIR Hyperspectral Imaging

1
College of Information and Electrical Engineering, China Agricultural University, NO. 17 Qinghua East Rood, Beijing 100083, China
2
Intelligent Equipment Research Center, Beijing Academy of Agriculture and Forestry Sciences, Beijing 100097, China
*
Author to whom correspondence should be addressed.
Agriculture 2023, 13(2), 359; https://doi.org/10.3390/agriculture13020359
Submission received: 1 December 2022 / Revised: 31 December 2022 / Accepted: 30 January 2023 / Published: 1 February 2023

Abstract

:
Moisture content (MC) is one of the important indexes to evaluate maize seed quality. Its accurate prediction is very challenging. In this study, the long-wave near-infrared hyperspectral imaging (LW-NIR-HSI) system was used, and the embryo side (S1) and endosperm side (S2) spectra of each maize seed were extracted, as well as the average spectrum (S3) of both being calculated. The partial least square regression (PLSR) and least-squares support vector machine (LS-SVM) models were established. The uninformative variable elimination (UVE) and successive projections algorithm (SPA) were employed to reduce the complexity of the models. The results indicated that the S3-UVE-SPA-PLSR and S3-UVE-SPA-LS-SVM models achieved the best prediction accuracy with an RMSEP of 1.22% and 1.20%, respectively. Furthermore, the combination (S1+S2) of S1 and S2 was also used to establish the prediction models to obtain a general model. The results indicated that the S1+S2-UVE-SPA-LS-SVM model was more valuable with Rpre of 0.91 and RMSEP of 1.32% for MC prediction. This model can decrease the influence of different input spectra (i.e., S1 or S2) on prediction performance. The overall study indicated that LW-HSI technology combined with the general model could realize the non-destructive and stable prediction of MC in maize seeds.

1. Introduction

Maize is one of the most important crops with a wide range of planting areas. Moreover, maize is not only a critical food but is also used for feed, industrial alcohol, cooking oil processing, and other fields [1,2,3]. Therefore, the demand for sustainable production of high-quality maize seeds is rising in response to the rapidly growing population and various uses of maize. The moisture content (MC) directly affects seed storage, transportation, and sowing. According to the National Standards of China (GB 4404.1-2008), the MC of maize seeds should be controlled below 13% in storage. The high MC will accelerate seed respiration, generating a lot of water and heat, leading to mold and rotting [4]. In addition, MC also affects seed vigor and yield [5].
Using Karl Fischer titration, an electronic moisture analyzer, or oven-drying are traditional ways to detect the MC of grain. However, these ways are destructive and cannot meet the need for fast detection. Moreover, the traditional ways can only be used for sampling and cannot detect the MC of each maize seed. In addition, these ways are also complicated, time-consuming, and may be unfriendly to the environment. Near-infrared (NIR) is a non-destructive, fast, and pollution-free technique. It has been widely used to assess the quality of seeds such as peanuts, soybeans, wheat, and maize [6,7,8]. However, the NIR spectroscopic technique can only provide point information from the tested samples. Unlike other ball-like seeds, the structure of the two sides of maize seeds is very different, that is, one side is composed of the endosperm, and the other is composed of the embryo and endosperm. Therefore, the point information from NIR spectra does not represent the information of the whole seed. Even if the prediction model is constructed via point information, it is also difficult to ensure the consistency of the information collection area in practice. This negatively affects the performance of the prediction model. In addition, the NIR spectra acquisition device needs to be specially designed for different kinds of samples, which is also a barrier to the development of this technology. In conclusion, NIR technology is not the best solution to the problem of rapid quality detection of corn.
Hyperspectral imaging (HSI) has the advantages of both spectrum and image. Because of this unique advantage, HSI has been extensively applied to the quality detection of agricultural products [9,10,11,12,13], such as meat [14], vegetables [15], and fruit [16]. With increasing attention on food security, more scholars have also applied this technology to seed quality detection. For example, the HSI system was used to detect the hardness of maize seeds with an R2 of 0.912 [17]. HIS, combined with the deep convolutional generative adversarial network, was used to predict the oil content of a single maize kernel, and the results indicated the potential of HSI in the oil detection of maize seeds [18]. The short-wave HSI was employed to achieve the identification of aflatoxin B1 in maize seeds. The results showed that the HSI could detect toxins in maize seeds [19]. HSI has been proved to be able to non-destructively analyze the germination percentage, germination energy, and simple vigor index of wheat seeds [20]. In addition, HSI was also used to identify maize varieties [21,22], hybrid seeds [23], damage [24], and starch [25]. As for MC detection in maize seeds, many scholars have carried out some research using HSI [26,27]. Their studies have indicated the feasibility of MC detection via HSI, and 1000–2500 nm was the ideal wavelength for MC detection. However, these studies ignored the influence of the structural differences in maize seeds on the predictive performance of models. In the actual detection, the position of maize seed in the field of view is uncertain, that is, any side may face the camera. Thus, only the hyperspectral image information from one side is acquired. Therefore, it is very necessary to develop a general model to reduce the influence of image acquisition location on model prediction accuracy.
Our hypothesis was (1) to establish linear and non-linear models for MC prediction; (2) to select the feature wavelengths using variable selection algorithms; and (3) to develop a general model that is not affected by the image acquisition location in the fast analysis of single maize seed.

2. Materials and Methods

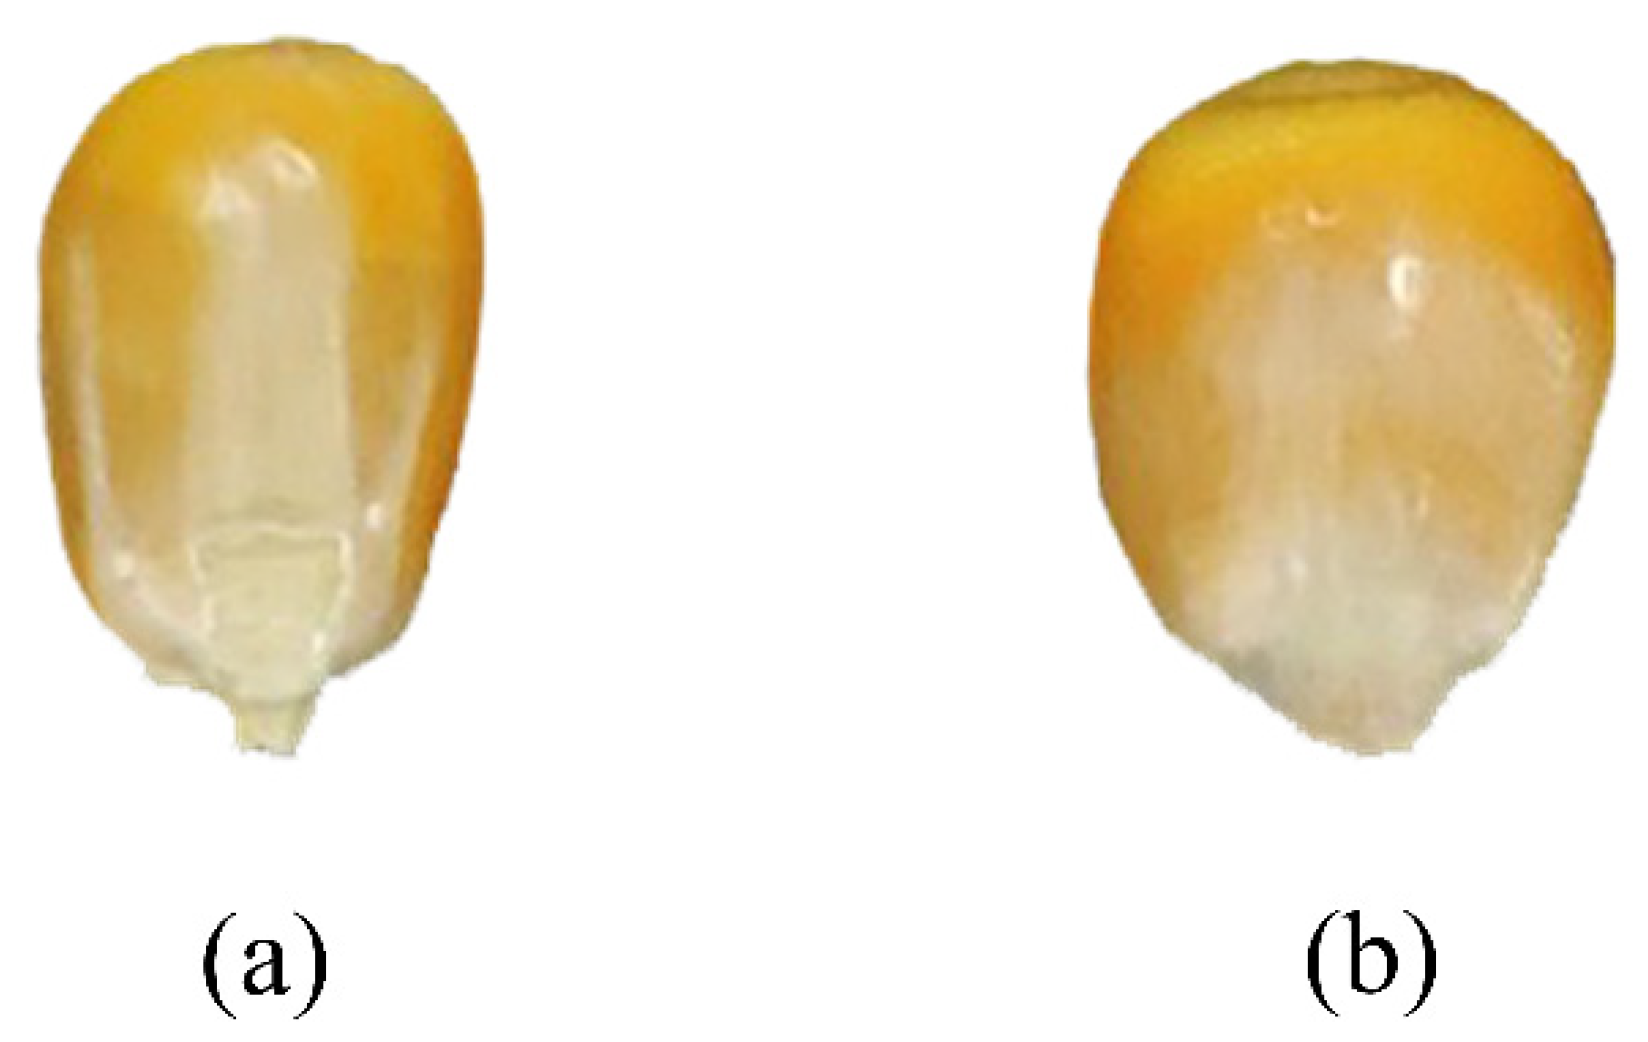
2.1. Samples Preparation

Three hundred maize seeds (Zhengdan 958 variety) with a MC range of 10~13% were used. In order to improve the prediction ability of the model, the MC range of samples should be expanded. We divided all of the samples into 5 groups, each containing 60 maize seeds. Each group was wrapped with gauze and sprayed with water, and stored in a stable environment (2 °C and 50% relative humidity). Each group was picked out every 12 h, then left at ambient temperature for 8 h to reduce the effect of temperature on the prediction results. Subsequently, all samples were used for hyperspectral image collection.

2.2. Hyperspectral Image Acquisition and Spectra Pretreatment

The LW-NIR hyperspectral imaging system was employed to collect the hyper-data in reflectance mode. The structure of the collection system and the parameters are detailed in the published article [27].
All samples in each group were placed on a rectangular piece of black cardboard. Due to the differences in the composition and structure between the two sides, it was necessary to investigate the effect of different types of spectra on the prediction model (Figure 1). Thus, the images of the two sides of maize were both collected. Then, the original images needed to be corrected using black and white reference images to improve data quality. The white hyperspectral image could be obtained using a white Teflon board (Spectralon SRT-99-100, Labsphere Inc., North Sutton, NH, USA). The dark one could be acquired by closing the light and covering the lens with a black cap. The corrected image (Rc) could be obtained from the following Equation:
R c = R r a w R d a r k R w h i t e R d a r k
where the Rc is the corrected hyperspectral image; Rraw is original hyperspectral image; and Rwhite and Rdark are the white and dark reference images, respectively.
After the data collection, each maize seed’s spectrum could be obtained from the corrected images. The raw spectra generally contained high-frequency random irrelevant information, which could reduce the signal-to-noise ratio (SNR). Hence, the raw spectra should be preprocessed before modeling. In this study, some common preprocessing methods, including Savitsky–Golay (SG) smoothing (window size: 17-point), standard normal variable (SNV), multiple scatter correction (MSC), and first derivative (1Der) (window size: 7-point) were used to improve spectral quality.

2.3. Moisture Content Measurement

The moisture content value was collected using the gravimetric method after the hyperspectral image collection. All samples were dried in an oven at 135 °C for 48 h. The weights were measured via an analytical balance one by one before and after drying. In order to ensure measurement accuracy, each seed was measured three times, and the mean value was employed in this research. The formula for calculating MC is as follows:
M C = w b e f o r e w a f t e r w b e f o r e × 100 %
where MC is the moisture content in each sample, and wbefore is the weight of each sample before drying. wafter is the weight of each seed after drying. The MC values of 6 samples were miscalculated and excluded. Therefore, the MC data from 294 maize seeds were used for analysis.

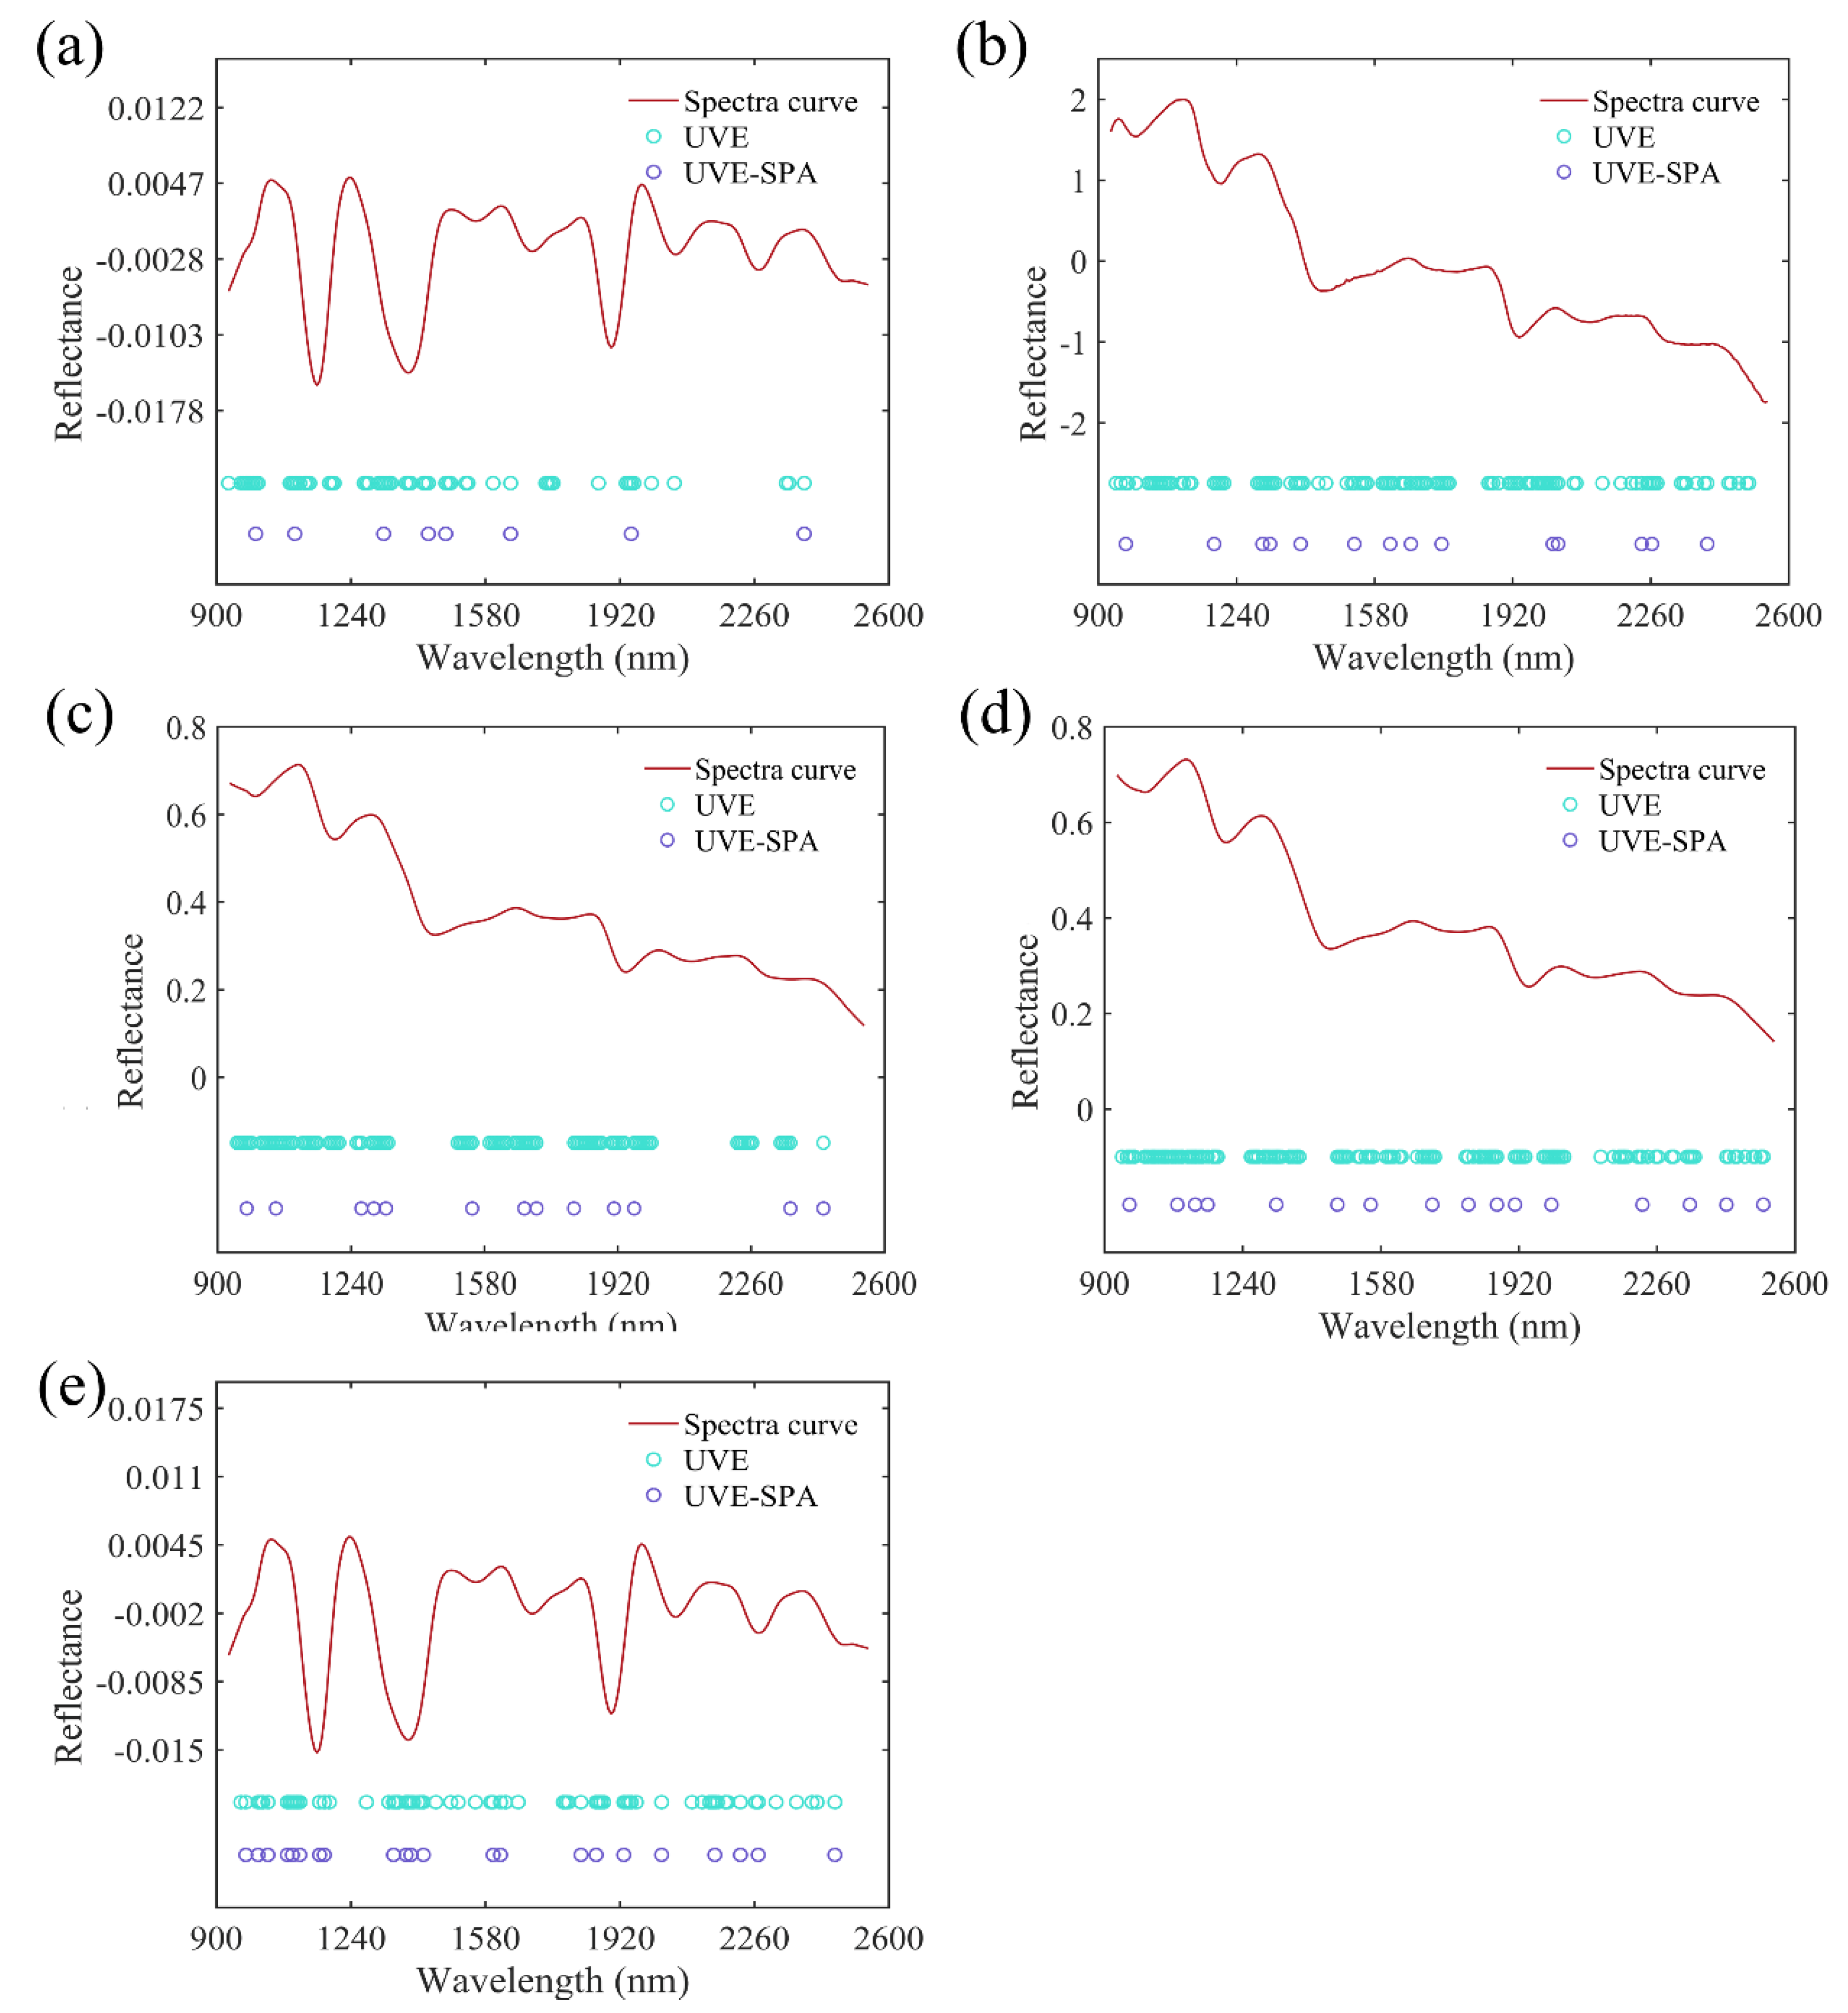
2.4. Variable Selection Methods

Variable selection is helpful for building a simpler and more efficient model. In the original data, there may have been many uninformative variables which would have reduced the performance of models [28]. Uninformative variable elimination (UVE) was used to eliminate the useless variables, and then the successive projections algorithm (SPA) was employed to reduce the impact of redundant information on the prediction model.
UVE is a common approach to pick out the significant variable based on the regression coefficient b of the partial least squares (PLS) model. Firstly, the spectral matrix Xn×m and label Yn×1 of the calibration set were used to establish the PLS model, and the optimal latent variable was judged via cross-validation. Then, the random noise matrix Rn×m was generated, and X and R were combined into a new matrix XRn×2m. The matrix XR was used to establish the PLS model, and then the regression coefficient matrix Bn×2m was obtained using the leave-one-out cross-validation method. Subsequently, the mean M and standard deviation S of the column vectors of Bn×2m were calculated, and the stability coefficient C1×2m could be obtained by the following Equation (3). The maximum absolute value of Cmax was obtained in [m + 1, 2m], and the important variables were selected in [1, m] when Cj > Cmax.
C j = | M j S j | , j = 1 , 2 , 3 , , 2 m
UVE can effectively delete the uninformative variables in the spectra. However, this algorithm cannot completely eliminate the influence of redundant information on the model. In addition, the variable number selected by UVE is large, which is not suitable to develop the fast multi spectral detection equipment. Therefore, UVE is often combined with an SPA algorithm to further screen the critical variables.
SPA is often used in the spectral analysis field. It starts with one wavelength and incorporates a new one at each iteration until a specified number N of variables is reached [20]. Then, RMSECV of N subsets of variables is calculated using multiple linear regression (MLR). The best variable number is determined based on the lowest RMSECV. The SPA method can solve the collinearity problem in massive variables, and the selected variables are minimally redundant. Therefore, SPA and UVE algorithms can achieve perfect complementarity in variable selection [29].

2.5. Model Establishment for Quantitative Analysis

Partial least square regression (PLS) is a common and classical machine learning method in the field of spectral analysis [17,30]. Compared with principal component regression, X (spectra matrix) and Y (the properties of samples) are simultaneously considered in the modeling process of PLS. X is transformed into linear latent variables (LVs). It can replace the original information, achieving a reduction in the original data dimension. Generally, fewer LVs could improve model performance and avoid overfitting. Ten-fold cross-validation was carried out to select the best LVs, and the LVs with the smallest RMSECV were selected to establish the PLS regression models.
The least-squares support vector machine (LS-SVM) can quickly resolve linear and non-linear problems [31]. This method can add the error sum of squares to the objective function of the standard support vector machine, and the risk minimization principle can be used to solve the convex quadratic programming problem [32]. The non-linear model was built by using LS-SVM and the radial basis function (RBF) was selected as the kernel function. The regularization parameter (γ) and sig2 (σ2) were important for prediction performance. Therefore, 10-fold cross-validation was employed to search for the optimal parameter. The best parameters were selected when the root mean square error of cross-validation reached the minimum.

2.6. The Performance Evaluation of Models

As for the quantitative analysis, the following parameters were adopted to evaluate the performance of calibration models, including the correlation coefficient of calibration (Rcal) and prediction (Rpre), the root mean square error of calibration (RMSEC), and prediction (RMSEP) [33]. These parameters can be calculated as follows:
R c a l = i = 1 n c ( y p i y m i ) 2 / i = 1 n c ( y p i y m e a n ) 2
R p r e = i = 1 n p ( y p i y m i ) 2 / i = 1 n p ( y p i y m e a n ) 2
R M S E C = 1 n c i = 1 n c ( y p i y m i ) 2
R M S E P = 1 n p i = 1 n p ( y p i y m i ) 2
where ypi and ymi represent the predicted and the measured values of the MC in sample i, respectively. ymean is the mean value of MC of samples in the calibration or prediction set. The nc and np are the numbers of samples in the calibration and prediction set, respectively. In general, a good model has higher Rcal and Rpre values and lower RMSEC and RMSEP values.

3. Results and Discussion

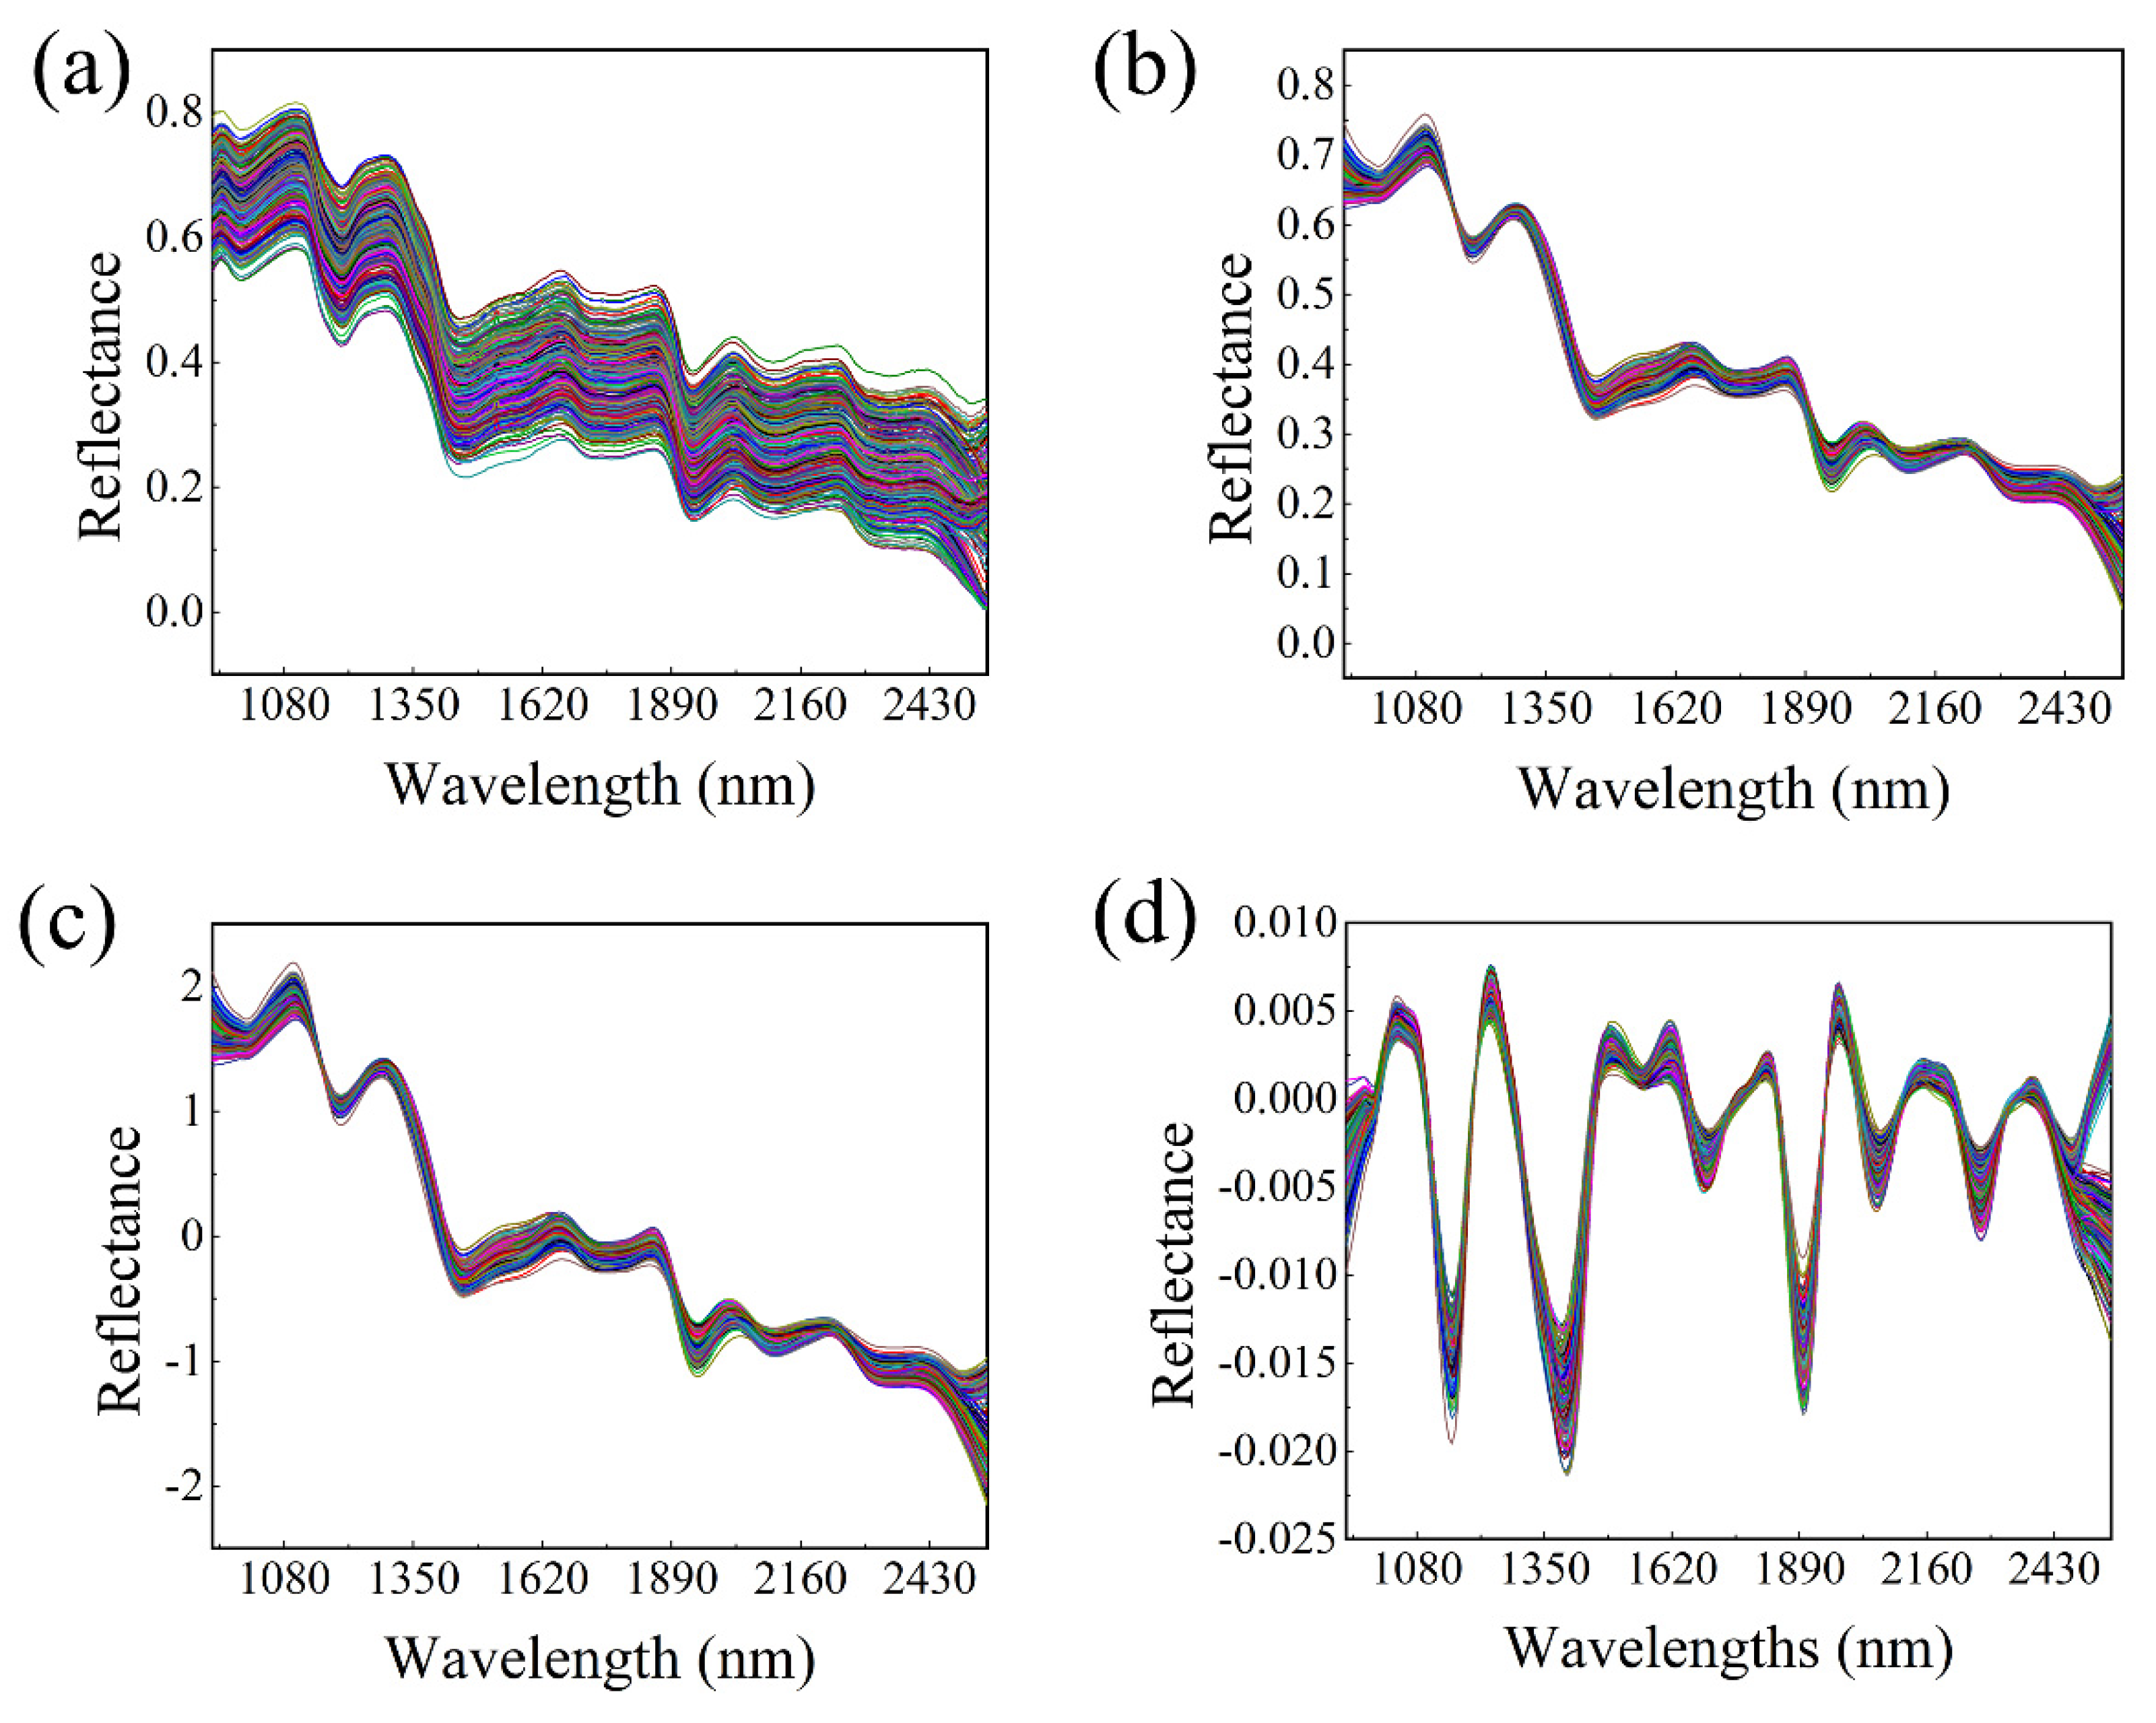
3.1. Spectra Analysis

The raw data were extracted from embryo (S1) and endosperm (S2) sides, and the mean spectra (S3) were calculated based on S1 and S2. The raw and pretreatment spectra are shown in Figure 2. Considering spectra from S1, S2, and S3 have similar curve change characteristics, only S1 spectra were shown in Figure 1. As can be seen from Figure 2a, the peaks exist at about 960, 1200, 1450, and 1950 nm. Specifically, this may be related to O-H in water and carbohydrates in 960 nm [34]. The O-H stretching of the first overtone could cause the fluctuation at 1450 nm [35]. According to previous research, the wavelengths at 1200 nm and 1950 nm were water-dependent in maize seeds [36]. In order to eliminate the negative effects of random noise, dark current, and light scattering, the raw spectra were pretreated by SG-MSC, SG-SNV, and SG-1Der, respectively. The raw and pretreated spectra are shown in Figure 2a–d, respectively. It is evident that these preprocessing methods can improve spectral quality with enhanced curve features. For comparison, both the raw and pretreated spectra were used for modeling.

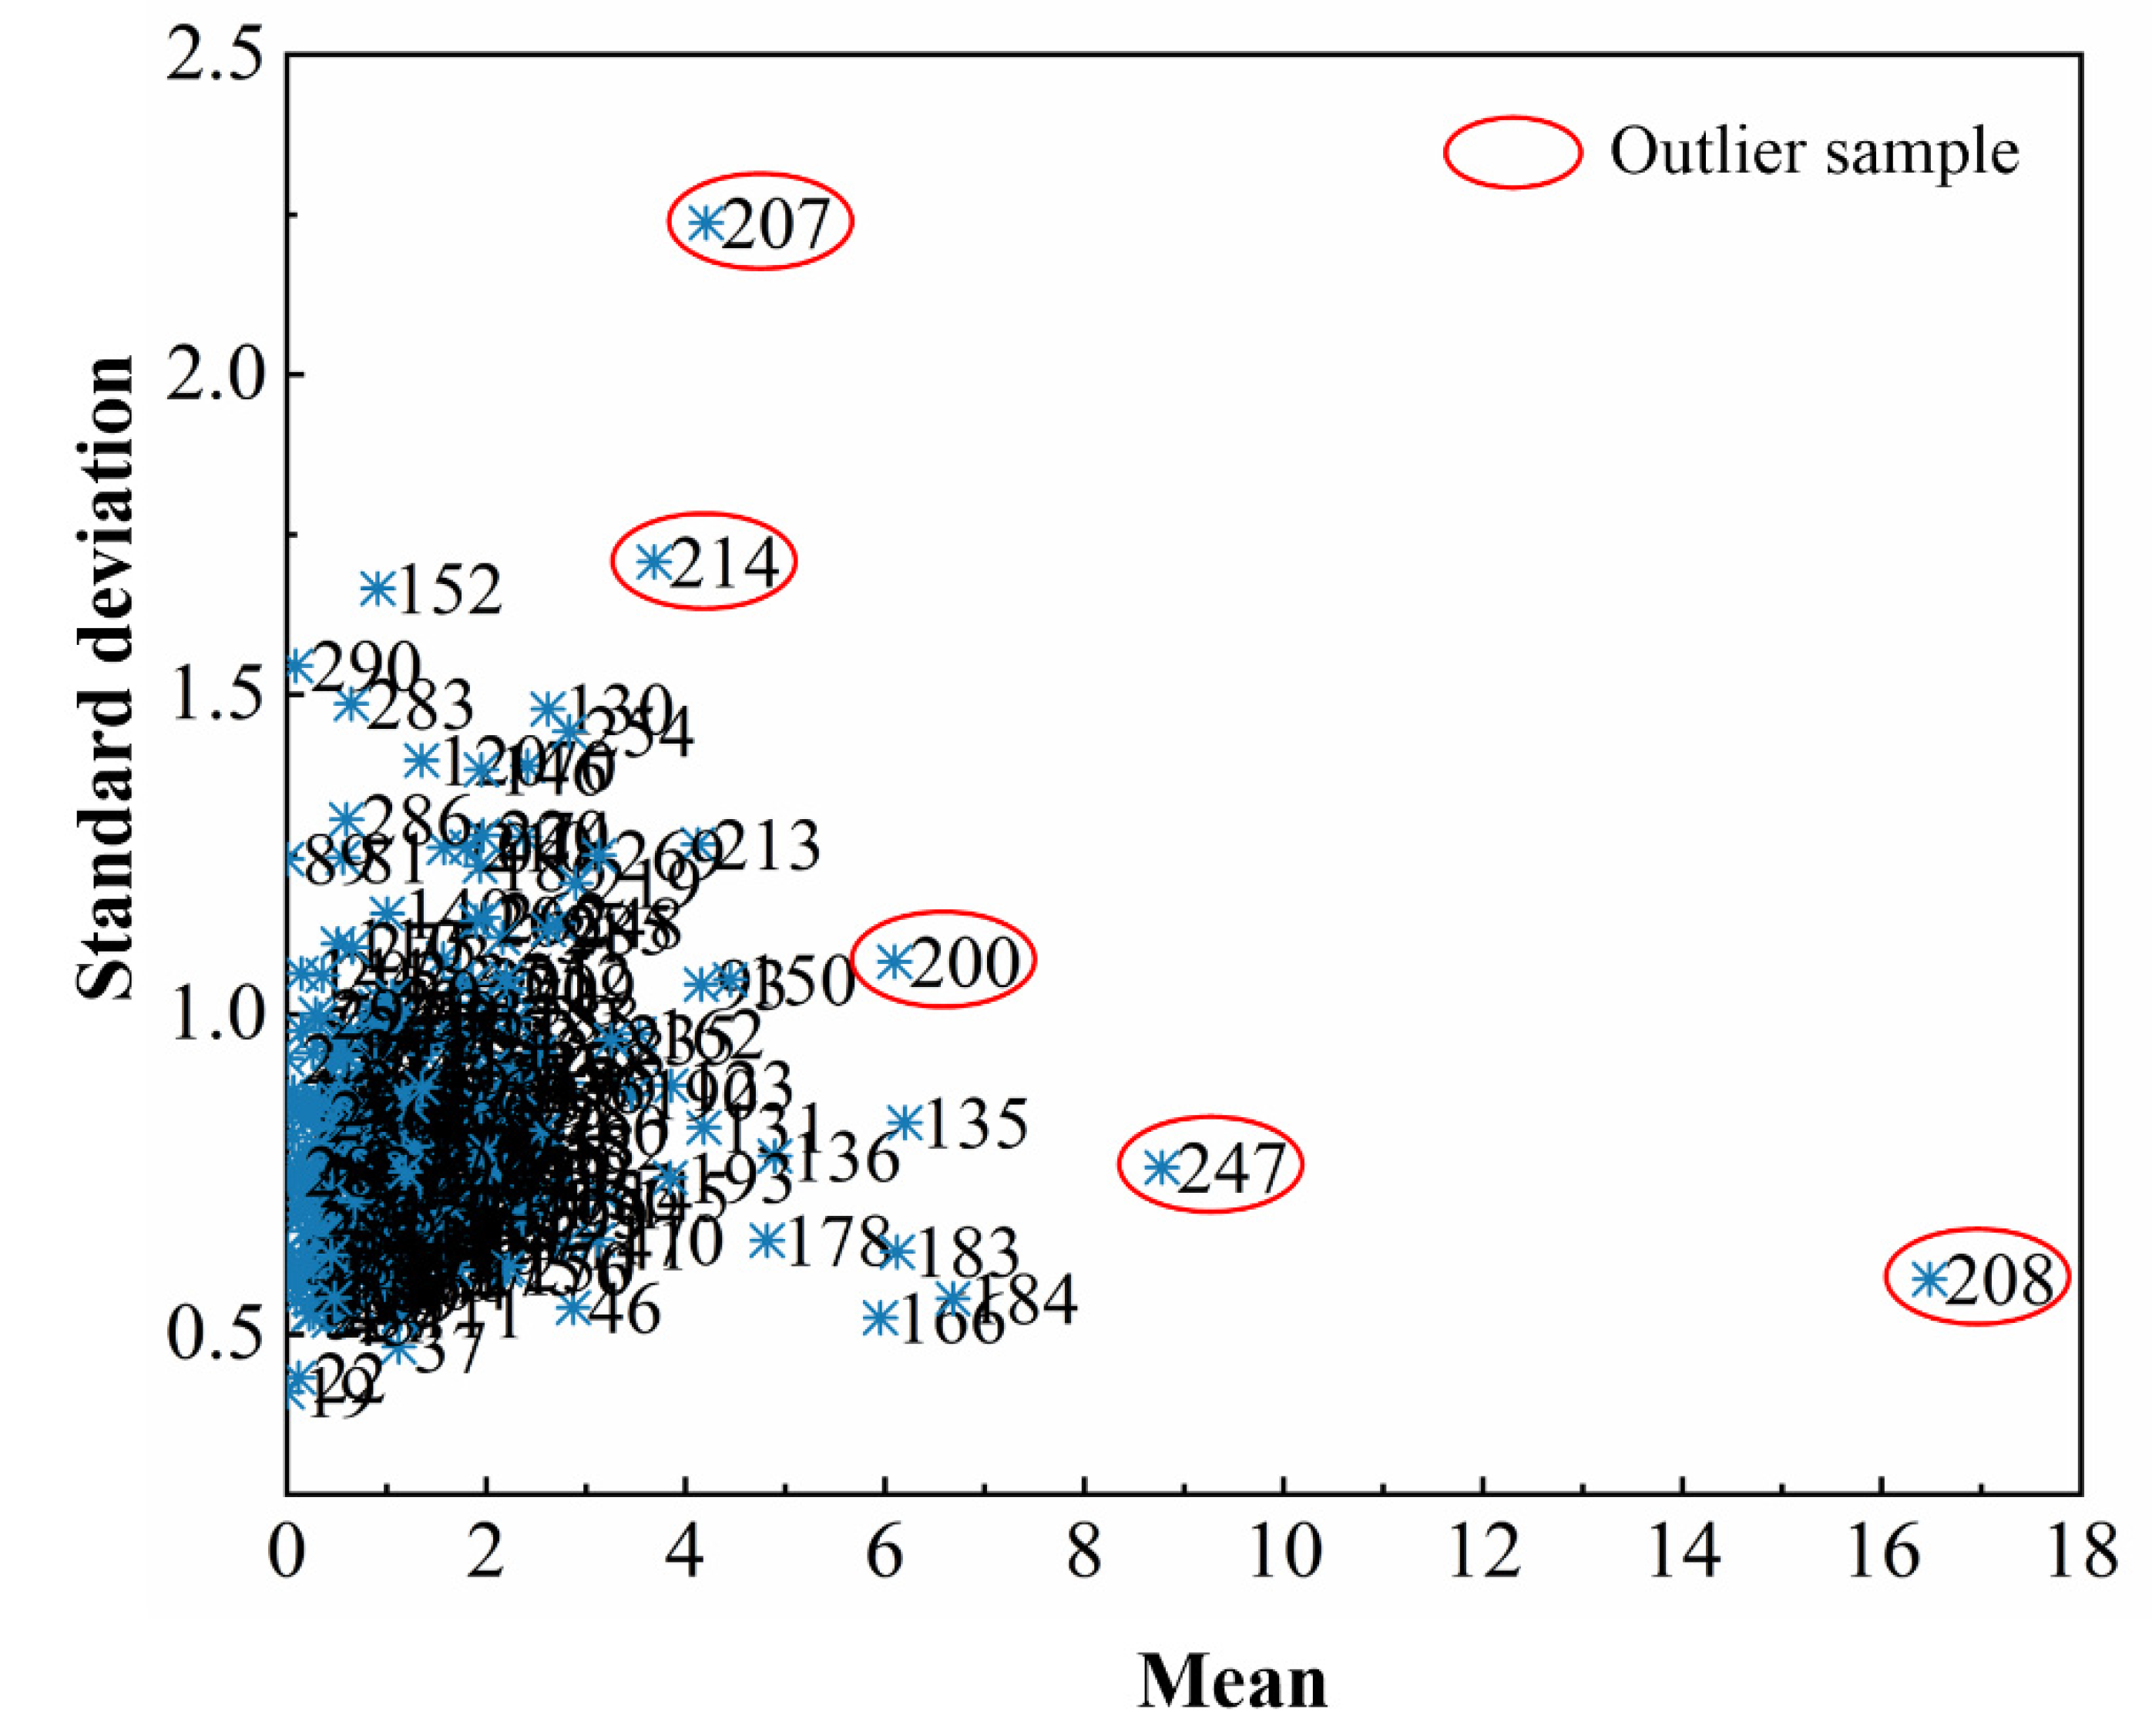
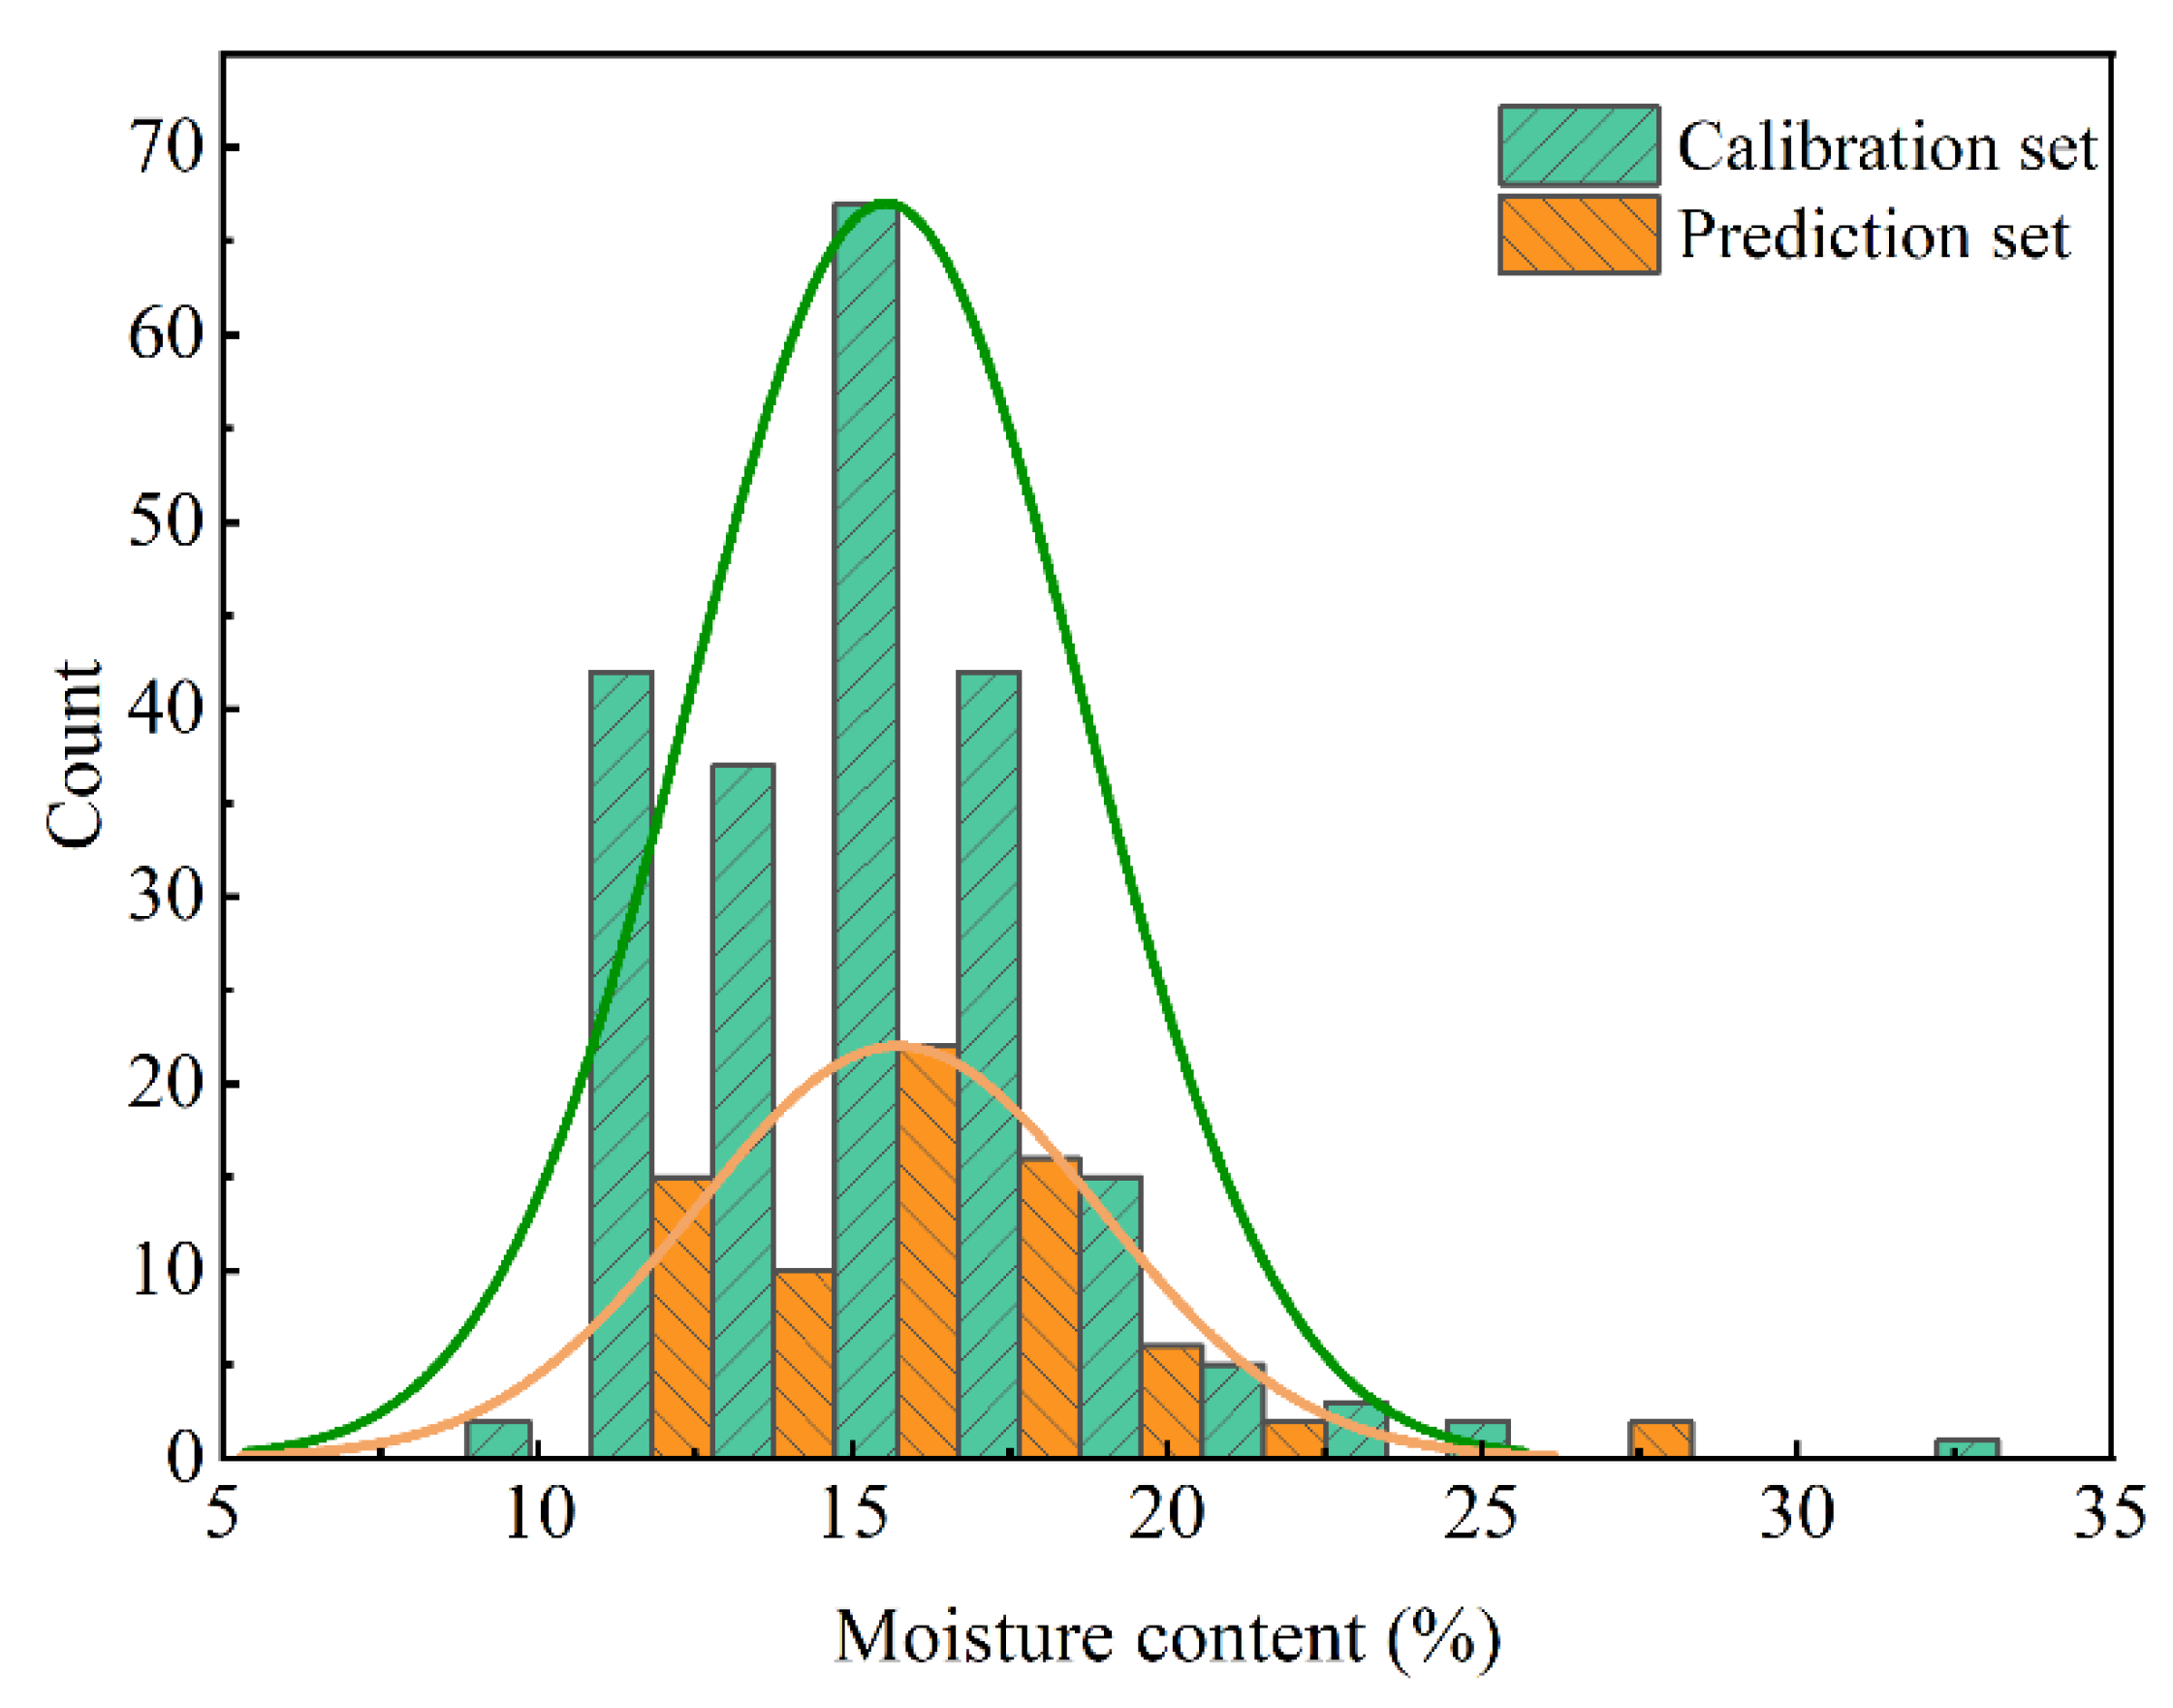
3.2. Abnormal Sample Elimination and Sample Division

The abnormal samples (i.e., outliers) can reduce the performance of models, so it is necessary to eliminate the outliers before establishing the models. In this study, Monte Carlo cross validation (MCCV) was applied to screen the abnormal samples and eliminate them according to the screening results. Firstly, this method used the PLS algorithm to determine the best principal component value. Then, 75% samples were selected based on the Monte Carlo sampling principle to establish the PLS model, and the surplus data were selected to be evaluated. In order to ensure all samples were used, the number of Monte Carlo sampling was 2500. The prediction error of each sample was calculated, and then the mean and standard deviation of prediction error of each sample were calculated. The distribution of mean values and standard deviations of all samples based on S1 spectral data are shown in Figure 3. The samples numbered 200, 207, 208, 214, and 247 generated a large mean or standard deviation, so they were removed as outliers. Note that the same outliers were also removed for S2 and S3 data analysis.
The cross-validation results of PLSR models based on S1 spectra are shown in Table 1. This model was constructed by all samples (normal and outlier samples) and normal samples, respectively. It is clear that the performance of the PLSR model for MC detection was significantly improved after removing outliers. The Rcv of the model was increased from 0.84 to 0.91, and RMSECV was reduced from 1.77% to 1.32%, indicating the rationality of sample removal. Therefore, the remaining 289 samples were used for further analysis, in which 216 maize seeds were the calibration set, and the rest of samples were the prediction set to measure the performance of models. The histogram of MC values of the calibration and prediction sets is shown in Figure 4. It is clear that the MC values of samples in the calibration set cover those of samples in the prediction set, and the MC values of two sets of samples were normally distributed. These characteristics indicate that the MC value of this experiment is suitable for building a stable model.

3.3. Pretreatment Method Selection

In order to explore the different pretreatment spectra in modeling, the raw and SG-MSC, SG-SNV, and SG-1Der spectra were separately employed as inputs to build linear and non-linear models. The best pretreatment method was determined based on the cross-validation results. Table 2 shows the result based on PLSR and LS-SVM models combined with different preprocessing spectral data. As for the S1 spectra, the best pretreatment method was SG-1Der. The RMSECV values of the corresponding PLSR and LS-SVM were 1.31% and 1.30%, respectively. In terms of the S2 spectra, the model established using the SG-SNV spectra obtained better results with the RMSECV values of 1.11% and 1.01% for the PLSR and LS-SVM models, respectively. When S3 spectra were used for modeling, SG-MSC spectra obtained better results with the RMSECV values of 1.05% and 0.98% for PLSR and LS-SVM, respectively. These results showed that different spectral data sets need to match appropriate preprocessing methods to build more effective prediction models. The prediction performance of the model established based on S3 spectral data was slightly better than that of the corresponding PLSR or LS-SVM model established based on S1 and S2 data sets. However, the full-spectrum model was not the best choice for the online MC analysis of maize seeds.

3.4. The Prediction Results of Models Established Based on Feature Wavelengths

The feature wavelength (or variable) selection can reduce the interference and correlation between variables, simplify the models, and improve the efficiency and performance of models. UVE, SPA, and their combination (UVE-SPA) were used for wavelength selection, respectively.
Figure 5 shows the selection results of feature wavelengths based on UVE and UVE-SPA. Figure 5a–e shows the results for different types of spectra. The spectra curve in Figure 5a–e represents that the S1 spectra were pretreated by SG-1Der, the S2 spectra were pretreated by SG-SNV, the S3 spectra were pretreated by SG-MSC, SG-MSC pretreated S1+S2 spectra, and S1+S2 spectra were pretreated by SG-1Der, respectively. It can be observed that, compared with full spectra, the number of wavelengths selected by UVE has been significantly reduced by removing the uninformative variables. However, there is still some collinearity information in the selected wavelengths, which was not conducive to the development of a fast and effective analysis model and system. Therefore, the SPA algorithm was used to reduce the collinearity between wavelengths selected by UVE. It can be seen from Figure 5 that the number of wavelengths was further reduced and concentrated in the bands related to O-H, such as some wavelengths being at about 960, 1200, 1450, and 1950 nm. It is clear that the SPA algorithm plays a significant role in eliminating those collinear variables.
Table 3 shows the results of MC prediction based on PLSR and LS-SVM models with different inputs. It can be seen that the performance of models has no significant impact after variable selection. As for S1 spectra, the wavelength number was reduced from 256 to 56 by using the UVE algorithm, which improved the modeling efficiency. By using the combination method of UVE and SPA, the number of variables is reduced to eight, accounting for only 3.1% of the total spectral variables. Comparing the constructed PLSR and LS-SVM models, the LS-SVM models were better for prediction of the MC in maize seeds, especially the LS-SVM model with only eight feature wavelengths. The Rpre and RMSEP of the UVE-SPA-LS-SVM model were 0.91 and 1.31%, respectively. For S2 spectra, the prediction performance of UVE-PLSR and UVE-LS-SVM models was similar, and the number of wavelengths was reduced from 256 to 110 via the UVE algorithm. The Rpre and RMSEP were 0.91 and 1.28% for the PLSR model, and 0.92 and 1.27% for the LS-SVM model, respectively. Furthermore, only 14 feature wavelengths were selected via UVE-SPA. Based on these 14 variables, the PLSR model has a decrease in accuracy of about 0.2% with an RMSEP value of 1.48%, and the LS-SVM model has a decrease in accuracy of about 0.1% with an RMSEP value of 1.38%. Considering the complexity and prediction accuracy of the models, the UVE-SPA-LS-SVM model was finally identified as the best one in terms of the S2 spectra. The corresponding Rpre and RMSEP were 0.91 and 1.38%, respectively. For the S3 spectra, the feature wavelengths extracted by the combination of UVE and SPA eliminated useless information and collinearity between bands. This combination method realized the maximum data compression and reduced the number of wavelengths from 256 to 13. Compared with S1 and S2 spectral data, the prediction performance of the UVE-SPA-PLSR and UVE-SPA-LS-SVM models established based on S3 spectra achieved optimal prediction accuracy. For the former, the Rpre and RMSEP were 0.92 and 1.22%; for the latter, the Rpre and RMSEP were 0.93 and 1.20%, respectively.
Compared with the optimal UVE-SPA-LS-SVM models constructed by different types of spectra, the optimal model established by the S1 spectra was superior to the S2 spectra. The reason for this may be that S2 spectral data contain more information about endosperm tissue, while S1 spectral data contain both endosperm and embryo information. The water of maize seeds is stored more in the embryo region, so the S1 spectra are more directly related to water. As a result, the corresponding PLSR and LS-SVM models obtained higher accuracy in the prediction of MC in maize seeds. In addition, it should be noticed that the prediction performance of the models built on the S3 spectrum was better than that of the S1 and S2 spectrum models. The reason for this may be that S3 spectral data fuse S1 and S2, which characterizes more water-related information. In conclusion, the UVE-SPA-PLSR and UVE-SPA-LS-SVM models built by S3 spectra achieved a better result for MC prediction.

3.5. Discussion on Model Practicability

Although the models constructed by S1 and S2 spectra could achieve the MC prediction, the models are not suitable for actual production. The reason for this may be that the imaging location of a single maize seed is uncertain, and thus the required spectra cannot be collected, reducing the prediction effect accuracy. In terms of S3, if the S3 spectra were used to establish the model, the spectra of both sides of seeds would need to be collected at the same time for fusion calculation, which would increase the difficulty, cost, and time of detection. Moreover, it is not conducive to developing and promoting rapid non-destructive testing equipment. Some research has investigated the stability of the moisture content prediction model [27]. However, the optimal model selected according to stability may not be the best for practical production. As for the application, the imaging location of maize seed is random, which will lead to the randomness of the spectrum type. Moreover, some research only explored the performance of linear models in MC detection [26]. However, due to the influence of the collection environment, sample shape, and other factors, the non-linear method is more suitable for the establishment of a prediction model. Therefore, the development of a general and more accurate model is very necessary, which can reduce the impact of imaging location on model performance.
In this section, the spectrum types of the new prediction set were not simple S1 and S2, but the combination of S1 and S2 (S1+S2) for simulating the actual production. The number of samples in the original prediction set was 73, so the number of samples in the new prediction set was 146. The prediction results of the optimal models (i.e., S1-UVE-SPA-LS-SVM and S2-UVE-SPA-LS-SVM models) for the new prediction set are shown in Table 4. Note: the optimal model built on S3 optima will not be discussed, considering that the results were meaningless because the spectra of both sides of seeds cannot be obtained at the same time in practical application. Compared with the results in Table 3, the prediction performance decreased significantly when S1-UVE-SPA-LS-SVM was applied for the new prediction set. The Rpre and RMSEP were only 0.58 and 3.40%, respectively. The S2-UVE-SPA-LS-SVM model was also ineffective for predicting the new prediction set with an Rpre of 0.79 and an RMSEP of 2.33%, respectively. However, it can be seen that the performance of the S2-UVE-SPA-LS-SVM model was better than that of the S1-UVE-SPA-LS-SVM model due to the use of more information, including embryo and endosperm. Through analysis, it can be known that S1-UVE-SPA-LS-SVM and S2-UVE-SPA-LS-SVM models were not suitable for practical application.
Thinking in another way, the combination of S1 and S2 (S1+S2) was used as a new calibration set. The number of samples in the calibration set increased from 216 to 432. All spectra of S1 and S2 were used to establish models. Thus, the prediction models constructed in this way can cope with different imaging locations of maize seeds. The MC prediction results obtained by PLSR and LS-SVM models built on spectral data included in the new calibration set are also shown in Table 4. It can be seen that the model established by the new calibration set could obtain good predictive ability and good adaptability. The Rpre of S1+S2-PLSR and S1+S2-LS-SVM were 0.91 and 0.92, respectively. The RMSEP values of the two models were 1.34% and 1.30%, respectively. At the same time, the UVE and SPA algorithms still played a significant role in dimension reduction for the new calibration set (S1+S2). It can be seen that UVE compressed the number of wavelengths to 125 and 66 for the two kinds of models. However, compared with the full-spectrum model, the performance of S1+S2-UVE-PLSR and S1+S2-UVE-LS-SVM was not decreased. The RMSEP values of the two kinds of models were 1.35% and 1.30%, respectively. After UVE, SPA further compressed variables, and the number of wavelengths involved in modeling was reduced to 16 and 22. Although the variable number was greatly compressed, the performance of the two kinds of models was still good. Considering the model’s universality, simplicity, and prediction accuracy, the S1+S2-UVE-SPA-LS-SVM was regarded as the best model with an Rpre and RMSEP of 0.91 and 1.32%, respectively. This model can effectively avoid the effect of imaging position on prediction accuracy and stability, so that it can be applied in actual production.
This study proved the feasibility of hyperspectral equipment in MC detection. However, the development of rapid detection equipment based on hyperspectral imaging still faces many problems. The first is the high cost of equipment development, leading to a decline in profits. Secondly, the current research only focuses on a few quality indicators, which cannot meet the market demand for the simultaneous detection of multiple indicators. Therefore, in subsequent research, the application cost of this technology should be reduced first, and then the research focus should be placed on the simultaneous detection of multiple qualities, such as protein and vitality, etc.

4. Conclusions

This study successfully demonstrated the feasibility of using an LW-NIR-HSI technique to detect MC in single maize seeds. The study demonstrated that the models established based on different input spectra (i.e., S1, S2, and S3) can effectively predict the seeds’ MC represented by the corresponding spectral data. The fused spectral data of S3 were superior to that of S1 and S2. By comparing the models based on three types of spectral data, it was found that the non-linear LS-SVM model was slightly better than the linear PLS-DA model with the same input, but both types of models could effectively evaluate the MC of single corn seeds. The study also indicated that variable selection could simplify the models by removing uninformative and redundant variables. The combination of UVE and SPA proved to be a powerful variable selection tool that could extract a few feature variables for MC prediction. Moreover, the models built on these feature variables did not reduce the prediction performance of MC. Considering the model practicability, the combination of S1 and S2 (S1+S2) was used to establish the prediction models. The results exhibited that the S1+S2-UVE-SPA-LS-SVM was the best model with an Rpre and RMSEP of 0.91 and 1.32%. This model only used 22 feature wavelengths to achieve MC prediction. This method decreases the influence of input spectra types and can randomly collect images from any side of maize seeds. Thus, the development cost of detection equipment could be significantly reduced. In addition, the rapid detection of the MC of maize seeds can reduce losses caused by excessive moisture content, such as fungal infection.

Author Contributions

Conceptualization, Z.W. and J.L.; methodology, S.F.; software, Z.W. and C.Z.; validation, Z.W. and J.L.; writing—original draft preparation, Z.W. and J.L.; writing—review and editing, Z.W. and J.L. All authors have read and agreed to the published version of the manuscript.

Funding

The authors would be like to thank the National Natural Science Foundation of China (31871523, 318012620).

Institutional Review Board Statement

Not applicable.

Data Availability Statement

The data presented in this study are available on request from the corresponding author.

Acknowledgments

The authors are grateful to the National Natural Science Foundation of China (31871523, 318012620). The authors also want to thank the China Agricultural University and Beijing Academy of Agriculture and Forestry Sciences.

Conflicts of Interest

The authors declare no conflict of interest.

References

  1. Green, D.I.G.; Agu, R.C.; Bringhurst, T.A.; Brosnan, J.M.; Jack, F.R.; Walker, G.M. Maximizing alcohol yields from wheat and maize and their co-products for distilling or bioethanol production. J. Inst. Brew. 2015, 121, 332–337. [Google Scholar] [CrossRef]
  2. Li, Z.F.; Wang, D.H.; Shi, Y.C. High-Solids Bio-Conversion of Maize Starch to Sugars and Ethanol. Starch-Starke 2019, 71, 7. [Google Scholar] [CrossRef]
  3. Kljak, K.; Duvnjak, M.; Grbesa, D. Contribution of zein content and starch characteristics to vitreousness of commercial maize hybrids. J. Cereal Sci. 2018, 80, 57–62. [Google Scholar] [CrossRef]
  4. Niaz, I.; Dawar, S.; Sitara, U. Effect of different moisture and storage temperature on seed borne mycoflora of maize. Pak. J. Bot. 2011, 43, 2639–2643. [Google Scholar]
  5. Xu, Y.F.; Zhang, H.J.; Zhang, C.; Wu, P.; Li, J.B.; Xia, Y.; Fan, S.X. Rapid prediction and visualization of moisture content in single cucumber (Cucumis sativus L.) seed using hyperspectral imaging technology. Infrared Phys. Technol. 2019, 102, 9. [Google Scholar] [CrossRef]
  6. An, D.; Zhang, L.; Liu, Z.; Liu, J.; Wei, Y. Advances in infrared spectroscopy and hyperspectral imaging combined with artificial intelligence for the detection of cereals quality. Crit. Rev. Food Sci. Nutr. 2022, 20, 1–31. [Google Scholar] [CrossRef]
  7. Wang, Y.L.; Peng, Y.K.; Zhuang, Q.B.; Zhao, X.L. Feasibility analysis of NIR for detecting sweet corn seeds vigor. J. Cereal Sci. 2020, 93, 7. [Google Scholar] [CrossRef]
  8. Fan, Y.M.; Ma, S.C.; Wu, T.T. Individual wheat kernels vigor assessment based on NIR spectroscopy coupled with machine learning methodologies. Infrared Phys. Technol. 2020, 105, 7. [Google Scholar] [CrossRef]
  9. Ma, T.; Tsuchikawa, S.; Inagaki, T. Rapid and non-destructive seed viability prediction using near-infrared hyperspectral imaging coupled with a deep learning approach. Comput. Electron. Agric. 2020, 177, 105683. [Google Scholar] [CrossRef]
  10. Appeltans, S.; Pieters, J.G.; Mouazen, A.M. Potential of laboratory hyperspectral data for in-field detection of Phytophthora infestans on potato. Precis. Agric. 2021, 23, 876–893. [Google Scholar] [CrossRef]
  11. Ruett, M.; Junker-Frohn, L.V.; Siegmann, B.; Ellenberger, J.; Jaenicke, H.; Whitney, C.; Luedeling, E.; Tiede-Arlt, P.; Rascher, U. Hyperspectral imaging for high-throughput vitality monitoring in ornamental plant production. Sci. Hortic. 2022, 291, 10. [Google Scholar] [CrossRef]
  12. Li, H.; Zhang, L.; Sun, H.; Rao, Z.; Ji, H. Discrimination of unsound wheat kernels based on deep convolutional generative adversarial network and near-infrared hyperspectral imaging technology. Spectrochim. Acta Part A Mol. Biomol. Spectrosc. 2022, 268, 120722. [Google Scholar] [CrossRef] [PubMed]
  13. Wakholi, C.; Kandpal, L.M.; Lee, H.; Bae, H.; Park, E.; Kim, M.S.; Mo, C.; Lee, W.H.; Cho, B.K. Rapid assessment of corn seed viability using short wave infrared line-scan hyperspectral imaging and chemometrics. Sens. Actuators B-Chem. 2018, 255, 498–507. [Google Scholar] [CrossRef]
  14. Jiang, H.Z.; Cheng, F.N.; Shi, M.H. Rapid Identification and Visualization of Jowl Meat Adulteration in Pork Using Hyperspectral Imaging. Foods 2020, 9, 154. [Google Scholar] [CrossRef] [PubMed]
  15. Shao, Y.; Shi, Y.; Qin, Y.; Xuan, G.; Li, J.; Li, Q.; Yang, F.; Hu, Z. A new quantitative index for the assessment of tomato quality using Vis-NIR hyperspectral imaging. Food Chem. 2022, 386, 132864. [Google Scholar] [CrossRef]
  16. Fan, S.X.; Huang, W.Q.; Guo, Z.M.; Zhang, B.H.; Zhao, C.J. Prediction of Soluble Solids Content and Firmness of Pears Using Hyperspectral Reflectance Imaging. Food Anal. Methods 2015, 8, 1936–1946. [Google Scholar] [CrossRef]
  17. Qiao, M.M.; Xu, Y.; Xia, G.Y.; Su, Y.; Lu, B.; Gao, X.J.; Fan, H.F. Determination of hardness for maize kernels based on hyperspectral imaging. Food Chem. 2022, 366, 8. [Google Scholar] [CrossRef]
  18. Zhang, L.; Wang, Y.; Wei, Y.; An, D. Near-infrared hyperspectral imaging technology combined with deep convolutional generative adversarial network to predict oil content of single maize kernel. Food Chem. 2022, 370, 131047. [Google Scholar] [CrossRef]
  19. Kimuli, D.; Wang, W.; Wang, W.; Jiang, H.; Zhao, X.; Chu, X. Application of SWIR hyperspectral imaging and chemometrics for identification of aflatoxin B1 contaminated maize kernels. Infrared Phys. Technol. 2018, 89, 351–362. [Google Scholar] [CrossRef]
  20. Zhang, T.; Fan, S.; Xiang, Y.; Zhang, S.; Wang, J.; Sun, Q. Non-destructive analysis of germination percentage, germination energy and simple vigour index on wheat seeds during storage by Vis/NIR and SWIR hyperspectral imaging. Spectrochim. Acta Part A Mol. Biomol. Spectrosc. 2020, 239, 118488. [Google Scholar] [CrossRef]
  21. Zhang, L.; Wang, D.; Liu, J.; An, D. Vis-NIR hyperspectral imaging combined with incremental learning for open world maize seed varieties identification. Comput. Electron. Agric. 2022, 199, 107153. [Google Scholar] [CrossRef]
  22. Zhou, Q.; Huang, W.; Fan, S.; Zhao, F.; Liang, D.; Tian, X. Non-destructive discrimination of the variety of sweet maize seeds based on hyperspectral image coupled with wavelength selection algorithm. Infrared Phys. Technol. 2020, 109, 103418. [Google Scholar] [CrossRef]
  23. Nie, P.; Zhang, J.; Feng, X.; Yu, C.; He, Y. Classification of hybrid seeds using near-infrared hyperspectral imaging technology combined with deep learning. Sens. Actuators B Chem. 2019, 296, 126630. [Google Scholar] [CrossRef]
  24. Zhang, L.; Sun, H.; Rao, Z.; Ji, H. Hyperspectral imaging technology combined with deep forest model to identify frost-damaged rice seeds. Spectrochim. Acta Part A-Mol. Biomol. Spectrosc. 2020, 229, 117973. [Google Scholar] [CrossRef] [PubMed]
  25. Liu, C.; Huang, W.; Yang, G.; Wang, Q.; Li, J.; Chen, L. Determination of Starch Content in Single Kernel Using Near-infrared Hyperspectral Images from Two Sides of Corn Seeds. Infrared Phys. Technol. 2020, 110, 103462. [Google Scholar] [CrossRef]
  26. Zhang, Y.M.; Guo, W.C. Moisture content detection of maize seed based on visible/near-infrared and near-infrared hyperspectral imaging technology. Int. J. Food Sci. Technol. 2019, 55, 631–664. [Google Scholar] [CrossRef]
  27. Wang, Z.; Fan, S.; Wu, J.; Zhang, C.; Xu, F.; Yang, X.; Li, J. Application of long-wave near infrared hyperspectral imaging for determination of moisture content of single maize seed. Spectrochim. Acta Part A Mol. Biomol. Spectrosc. 2021, 254, 119666. [Google Scholar] [CrossRef]
  28. Liu, C.; Wang, Q.; Lin, W.; Yu, C. Origins classification of egg with different storage durations using FT-NIR: A characteristic wavelength selection approach based on information entropy. Biosyst. Eng. 2022, 222, 82–92. [Google Scholar] [CrossRef]
  29. Mansuri, S.M.; Chakraborty, S.K.; Mahanti, N.K.; Pandiselvam, R. Effect of germ orientation during Vis-NIR hyperspectral imaging for the detection of fungal contamination in maize kernel using PLS-DA, ANN and 1D-CNN modelling. Food Control 2022, 139, 109077. [Google Scholar] [CrossRef]
  30. Pereira, E.V.d.S.; Fernandes, D.D.d.S.; de Araújo, M.C.U.; Diniz, P.H.G.D.; Maciel, M.I.S. Simultaneous determination of goat milk adulteration with cow milk and their fat and protein contents using NIR spectroscopy and PLS algorithms. LWT 2020, 127, 109427. [Google Scholar] [CrossRef]
  31. Wang, Y.J.; Ren, Z.Y.; Li, M.Y.; Yuan, W.X.; Zhang, Z.Z.; Ning, J.M. pH indicator-based sensor array in combination with hyperspectral imaging for intelligent evaluation of withering degree during processing of black tea. Spectrochim. Acta Part A-Mol. Biomol. Spectrosc. 2022, 271, 120959. [Google Scholar] [CrossRef] [PubMed]
  32. Noroozi, R.; Sohrabi, M.R.; Davallo, M. A simple and rapid spectrophotometric method coupled with intelligent approaches for the simultaneous determination of antiepileptic drugs in pharmaceutical formulations, biological, serological, and breast milk samples. Chemom. Intell. Lab. Syst. 2022, 228, 104633. [Google Scholar] [CrossRef]
  33. Qin, C.; Shi, G.; Tao, J.; Yu, H.; Jin, Y.; Xiao, D.; Zhang, Z.; Liu, C. An adaptive hierarchical decomposition-based method for multi-step cutterhead torque forecast of shield machine. Mech. Syst. Signal Process. 2022, 175, 109148. [Google Scholar] [CrossRef]
  34. Guo, W.C.; Zhao, F.; Dong, J.L. Nondestructive Measurement of Soluble Solids Content of Kiwifruits Using Near-Infrared Hyperspectral Imaging. Food Anal. Methods 2016, 9, 38–47. [Google Scholar] [CrossRef]
  35. Dong, G.; Guo, J.; Wang, C.; Liang, K.; Lu, L.; Wang, J.; Zhu, D. Differentiation of storage time of wheat seed based on near infrared hyperspectral imaging. Int. J. Agric. Biol. Eng. 2017, 10, 251–258. [Google Scholar] [CrossRef]
  36. Dong, J.L.; Guo, W.C. Nondestructive Determination of Apple Internal Qualities Using Near-Infrared Hyperspectral Reflectance Imaging. Food Anal. Methods 2015, 8, 2635–2646. [Google Scholar] [CrossRef]
Figure 1. (a) Embryo side; (b) endosperm side.
Agriculture 13 00359 g001
Figure 2. The average spectra of the embryo side of maize seeds. (a) The raw spectra curves; (b) the spectra curves pretreated by SG-MSC; (c) the spectra curves pretreated by SG-SN; (d) the spectra curve pretreated by SG-1Der.
Agriculture 13 00359 g002
Figure 3. The distribution of mean values and standard deviations of all samples based on S1 spectral data.
Agriculture 13 00359 g003
Figure 4. The histogram of moisture content values of all maize seeds.
Agriculture 13 00359 g004
Figure 5. The selection results of feature wavelengths based on UVE and UVE-SPA. (a) S1 spectra were pretreated by SG-1Der, (b) S2 spectra were pretreated by SG-SNV, (c) S3 spectra were pretreated by SG-MSC, (d) S1+S2 spectra were pretreated by SG-MSC, and (e) S1+S2 spectra were pretreated by SG-1Der.
Agriculture 13 00359 g005
Table 1. The results of cross-validation of PLSR model based on S1 spectra.
No. of SamplesR cvRMSECV/%
2940.841.77
2890.911.32
Table 2. Prediction results of different models with 10-fold cross-validation based on different preprocessing spectral data.
Spectra TypesModeling MethodsPretreatment MethodsRcvRMSECV/%
S1PLSRNone0.901.33
SG-MSC0.901.36
SG-D10.911.31
SG-SNV0.901.35
LS-SVMNone0.891.30
SG-MSC0.881.33
SG-D10.911.21
SG-SNV0.911.31
S2PLSRNone0.921.16
SG-MSC0.931.12
SG-D10.931.16
SG-SNV0.931.11
LS-SVMNone0.921.10
SG-MSC0.921.05
SG-D10.921.12
SG-SNV0.931.01
S3PLSRNone0.951.06
SG-MSC0.941.05
SG-D10.931.07
SG-SNV0.941.07
LS-SVMNone0.931.07
SG-MSC0.940.98
SG-D10.931.03
SG-SNV0.931.05
Table 3. The results of MC prediction based on PLSR and LS-SVM models with different inputs.
Spectra TypesModeling MethodsVariable Selection MethodsNo. of VariablesCalibration SetPrediction Set
RcalRMSEC/% RpreRMSEP/%
S1PLSRNone2560.921.180.891.38
UVE560.921.260.901.38
UVE-SPA80.921.210.891.39
LS-SVMNone2560.941.040.911.30
UVE560.941.030.911.29
UVE-SPA80.931.080.911.31
S2PLSRNone2560.950.930.911.30
UVE1100.950.940.911.28
UVE-SPA140.941.030.881.48
LS-SVMNone2560.980.670.921.32
UVE1100.970.720.921.27
UVE-SPA140.970.730.911.38
S3PLSRNone2560.950.940.931.18
UVE1080.950.950.931.20
UVE-SPA130.950.970.921.22
LS-SVMNone2560.960.910.931.21
UVE1080.960.910.931.19
UVE-SPA130.950.920.941.20
Table 4. Comparison of different models for building a general model.
ModelsSpectra TypesNo. of VariablesRpreRMSEP/%
S1-UVE-SPA-LS-SVM S1+S280.583.40
S2-UVE-SPA-LS-SVM140.792.33
S1+S2-PLSR2560.911.34
S1+S2-LS-SVM2560.921.30
S1+S2-UVE-PLSR1250.911.35
S1+S2-UVE-LS-SVM660.921.30
S1+S2-UVE-SPA-PLSR160.901.37
S1+S2-UVE-SPA-LS-SVM220.911.32
Disclaimer/Publisher’s Note: The statements, opinions and data contained in all publications are solely those of the individual author(s) and contributor(s) and not of MDPI and/or the editor(s). MDPI and/or the editor(s) disclaim responsibility for any injury to people or property resulting from any ideas, methods, instructions or products referred to in the content.

