Article

Manure Application Timing and Incorporation Effects on Ammonia and Greenhouse Gas Emissions in Corn

1
Institute for Environmentally Integrated Dairy Management Research, USDA-ARS, Marshfield, WI 54449, USA
2
Center for Clinical Epidemiology and Population Health, Marshfield Clinic Research Institute, Marshfield, WI 54449, USA
*
Author to whom correspondence should be addressed.
Agriculture 2022, 12(11), 1952; https://doi.org/10.3390/agriculture12111952
Submission received: 5 October 2022 / Revised: 12 November 2022 / Accepted: 17 November 2022 / Published: 19 November 2022
(This article belongs to the Special Issue Optimizing Nutrient Management in Cold Climate Agroecosystems)

Abstract

:
Manure application influences ammonia (NH3) and greenhouse gas emissions; however, few studies have quantified the effects of manure application methods and timing on NH3, nitrous oxide (N2O), carbon dioxide (CO2), and methane (CH4) fluxes simultaneously. We evaluated surface-applied liquid manure application with disk incorporation versus injection on NH3, N2O, CO2, and CH4 fluxes in central Wisconsin corn silage (Zea mays L.) plots during pre-plant (PP) and sidedress (SD) application windows from 2009 to 2011. Manure treatments were PP injection (PP-Inject) and injection at sidedress time (SD-Inject) to growing corn, along with two incorporation times for PP surface application (within 24 h—PP-1-hr; within 3 days—PP-3-day). Mean NH3 emissions were 95% lower for injected treatments compared to surface application in both years, with larger losses for PP-3-day and SD-Surf. While N2O fluxes were generally low, larger increases after manure application were associated with injection and triggered by soil moisture/temperature changes. Mean CO2 and CH4 were unaffected by manure treatments and influenced more by weather. Overall, injection conserved more available soil N while contributing to modest N2O emission, suggesting manure injection may offer greater agri-environmental benefits on the whole over surface application.

1. Introduction

Ammonia (NH3) losses from surface-applied manure can be large, reducing plant-available N and the economic value of manure as a N source. Ammonia emission into the atmosphere is an environmental concern because NH3 can combine with sulfur and nitrogen oxides to form fine particulates that can contribute to human health problems [1]. It may also contribute to the eutrophication of surface waters (especially marine and estuarine) via atmospheric deposition [2]. Volatilization of N as NH3 and deposition downwind additionally can serve as a source of indirect N2O emissions [3]. The decreased amount of available N in manure reduces the N:P ratio, potentially leading to a more rapid build-up of soil P per unit of applied manure N, increasing the potential for P loss in runoff.
A common approach for controlling NH3 volatilization from manure is incorporation into the soil with tillage or injection equipment, typically reducing NH3 losses by 50 to >90% compared to broadcast [4,5,6,7,8,9]. Manure application timing also affects N loss potential and availability to crops. Injecting liquid dairy manure into a growing corn crop at or near the early season N application window (i.e., sidedress application) might be used as a viable substitute for commercial fertilizer to meet corn N demands [10,11]; however, studies indicate that manure incorporation increases N2O fluxes compared to broadcast/surface application due to greater NH3/NH4+ conservation [8,9,12,13,14,15,16,17]. Ammonia is considered a secondary contributor of N2O. The IPCC [3] assumes that 1% of the N volatilized as NH3 could be released as N2O after redeposition on the land. In a systems agri-environmental context, the larger N2O fluxes for manure injection/incorporation might be offset by more efficient NH3-N capture and lower secondary N2O emission relative to surface application [18].
Compared to N2O, manure application effects on CH4 and CO2 fluxes are less consistent and appear to be more tied to weather, especially soil moisture and temperature [13,16,19,20,21,22,23,24]. Rhizosphere dynamics in maize systems have important effects on carbon cycling via microbe–root–soil interactions, with root respiration and rhizodeposition both being important processes affecting net CO2 fluxes [19]. In general, CH4 pulses from manure application typically occur within the first few days after injection; however, annual CH4 fluxes vary among soils, with some acting as net CH4 sinks or sources depending on landscape attributes, drainage, and weather conditions [14,16,25,26,27]. Recent studies suggest that manure could be a larger source of greenhouse gases (GHGs; CO2, N2O, and CH4) compared to organic amendments and that biochar addition can substantially reduce GHGs compared to manure application [20,21]. Overall, relatively few studies have quantified the effects of dairy manure incorporation method and timing on both NH3 and GHG fluxes in humid, temperate corn silage systems. The objective of our study was to evaluate the effect of liquid dairy manure application method and timing (shallow injection or disk incorporation at two times) on emissions of NH3 and GHGs in a central Wisconsin corn silage production system.

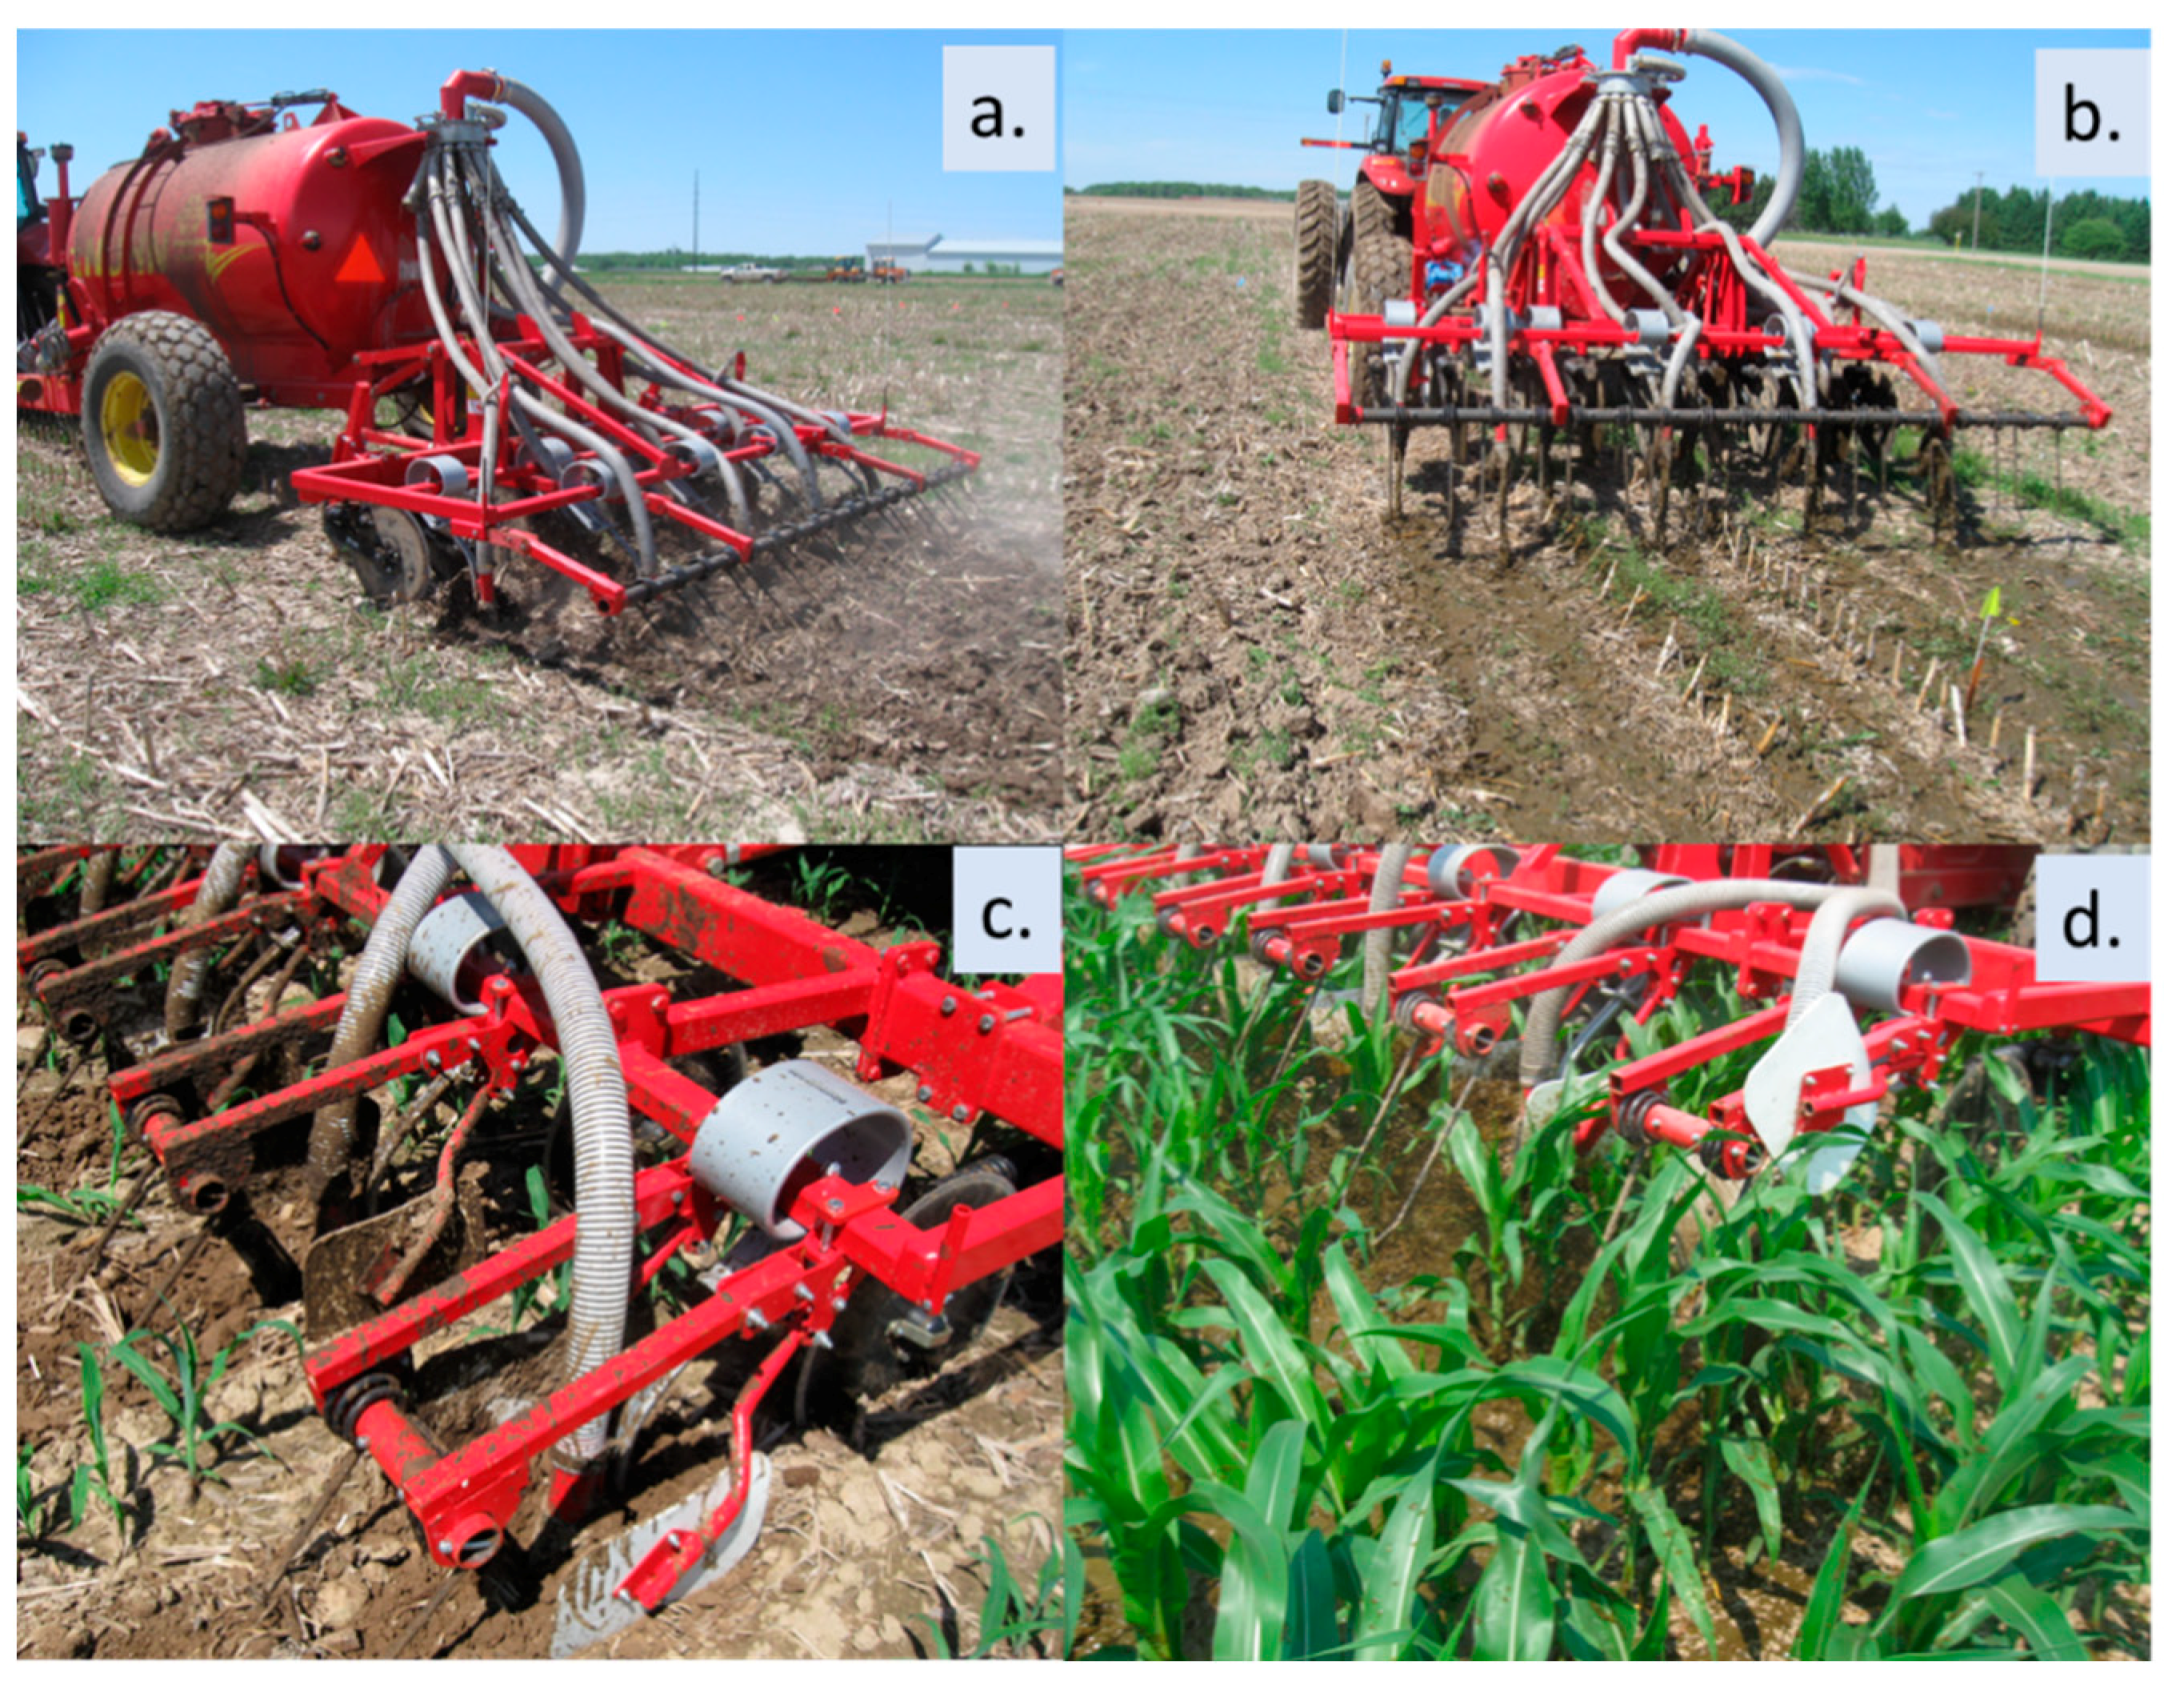
2. Materials and Methods

This field research was conducted at the University of Wisconsin/USDA Agricultural Research Station in Marshfield, Wisconsin (WI), from 2009 to 2011. To reduce the potential for residual manure N effects, a new site was selected each year that had a previous corn crop. Soil on all sites was predominantly Withee silt loam (fine-loamy, mixed, superactive, frigid Aquic Glossudalfs), a somewhat poorly drained soil with 0 to 2% slope. Soil pH and organic matter content averaged 6.7 and 30 g kg−1, respectively. A 92-day relative maturity corn silage hybrid was planted on 19 May 2009, 18 May 2010, and 3 June 2011 in 0.76-meter rows at 86,500 seeds ha−1 with 112 kg ha−1 of 9-11-30-6S-1Zn starter fertilizer in a 2 × 2 configuration (50 mm to the side of seed row, 50 mm deep).
Liquid dairy manure was applied either during the pre-plant (PP) window (mid- to late May) or in-season (SD) (5–6-leaf stage; late June to early July) (Table 1). Pre-plant treatments were either injected (PP-Inject) or incorporated with a tandem disk immediately after manure application (<1 h) (PP-1-hr) or 3 days later (PP-3-day). Injection was performed with an S-tine (Kongsgilde Vibro-flex) injector (68-mm width) with 0.38 m spacing at a 0.10- to 0.15-meter depth (Figure 1). All plots were chisel plowed 3 to 5 days after manure application. Sidedress (SD) manure applications were either injected with an S-tine injector (0.76-meter spacing) equipped with shields (SD-Inject) or surface-applied (SD-Surf) with the same means with the injectors raised above the soil surface (2010 and 2011) (Figure 1). Manure (average solids content = 14%) was applied at a target rate of 62,000 L ha−1. The manure supplied an average of 177 kg total N and 69 kg NH4-N ha−1, but rates varied somewhat across years and application times (Table 1). Plots (4.5 by 15 m) were replicated four times per treatment in a randomized complete block design. Ammonia emission was measured from 2009 to 2011 and GHG emission was measured in 2010 and 2011 (only three replicates were sampled in 2011).
Ammonia emission was measured using the dynamic chamber/equilibrium concentration technique [28,29] that is well suited to small, replicated plots and has been used successfully by others [8,9,29,30,31,32]. We placed two 31 by 38 by 20 cm ventilated chambers and an open collector, or ambient meter, in each plot. Duplicate passive diffusion samplers of two types were placed in each chamber and in each ambient meter: one with an acidified filter paper disk directly exposed to the air and the other with the filter paper disk 10 mm below a semipermeable Teflon membrane, requiring NH3 to diffuse along a 10-millimeter path to the acidified trap. Ammonia flux was calculated based on the micrometeorological law of resistance, using NH3 concentrations from diffusion samplers to estimate the required parameters. Details on chamber design and further calculations are found elsewhere [28,30,32]. Measurements started immediately after manure application and continued for six separate periods through day 3. Day 1 measurements started immediately (Time 0), with successive periods starting approximately 1, 3, and 8 h (overnight) after application, followed by 10-hour measurements during days 2 and 3 (not overnight). Overnight emission between day 2 and day 3 was estimated from linear interpolation adjusted for measured temperature and wind conditions [29,33]. Ammonia measurement ended just before disking of the 3-day incorporation treatment, so the 3-day treatment represents surface-applied manure for NH3 measurement.
Nitrous oxide, CO2, and CH4 were measured using the static vented chamber technique following the GRACEnet protocol [33]. Chambers consisted of galvanized steel utility pans 38 cm in diameter and 10 cm deep. A sample port was placed in the center of the utility pan bottom and a vent tube (3 mm ID and 40 cm long) was installed horizontally on the side and coiled inside the pan. Weather stripping was attached along the pan lip to serve as a gasket, and the entire chamber was covered with reflective insulation to minimize temperature changes. Bases were made by cutting out the bottom section of the utility pan. The base was then pressed into the soil, leaving 1–2 cm exposed above the soil surface. During sampling, the chamber top was placed on the base and secured with four binder clips. Chamber construction was based on a design from R. Venterea (http://www.ars.usda.gov/pandp/docs.htm?docid=19008 accessed on 15 April 2010). Bases were left in the field for the full season and removed and replaced only for field operations. Gas samples were collected by inserting a 10-milliliter syringe into the port, removing a sample, and immediately transferring the sample to a 5.9-milliliter capped, non-evacuated vial containing ambient air. Sample concentrations were later adjusted for the dilution by ambient air. Gas samples were collected four times for each measurement (0, 20, 40, and 60 min) from 13 May to 8 Jul 2010 and three times (0, 30, and 60 min) from 16 Jul to 14 Oct 2010 and 28 May to 25 Oct 2011. Gas samples were collected over a 2- to 3-hour period, typically between 0900 h and 1200 h, to approximate the mean daily temperature.
Gas fluxes were calculated from the rate of change in concentration over the sampling period using linear regression and were adjusted for theoretical flux underestimation from deployment of the chamber as described by [34]. Measurements for PP treatments began two days after manure application and continued approximately weekly (more frequently after manure or rain and less frequently late in the season) into October. Measurement on SD treatments began 20 days before manure application in 2010 and 5 days before application in 2011. Analysis of gas samples was performed by gas chromatography using an infrared gas analyzer (IRGA, LiCor 820, Lincoln, NE, USA) for CO2, an electron capture detector (micro-ECD) for N2O, and a flame ionization detector (FID) for CH4 (Agilent 7890A GC System, Santa Clara, CA, USA). Annual cumulative gas emission was estimated by linear interpolation between sampling times.
Volumetric soil moisture (5 cm depth; Delta-T Devices Theta Probe) and soil temperature (5 cm depth; digital soil thermometer) were measured in all plots during each gas sampling period. Soil bulk density was measured (two 48 mm diam. × 0.1 m deep cores per plot) 3 to 6 times per year at the beginning of each sampling year and after tillage or other activities that would be expected to affect bulk density. Bulk density was used in calculating theoretical flux underestimation [31] for adjusting N2O and CO2 flux values. Monthly precipitation and air temperature were obtained from a standard weather station at the University of Wisconsin Agricultural Research Station about 1 km from the field sites. Weather data during the NH3 emission measurement period were collected from a portable weather station at each site set up at a lower height than usual (0.3 m from the soil surface for temperature and 0.6 m for wind) to better capture near-soil surface conditions, where NH3 is volatilized.

Computation and Statistics

Annual cumulative GHG fluxes were calculated using trapezoidal integration of flux versus time, assuming linear changes in daily fluxes. Main effects of manure application by treatment and timing on cumulative NH3 and GHG emissions were assessed using the general linear modeling procedure (proc glm) in SAS [35]. When necessary, data were logarithmically (log10) transformed to achieve normality/equality of variance. Treatment means were compared using Fisher’s protected LSD. We used p ≤ 0.10 to declare statistical significance due to high background uncertainty for GHG measures. Since there was a significant treatment*year interaction for NH3 cumulative emission over the study period, data are presented by year.
To more fully evaluate the simultaneous effects of manure application method, weather and soil temperature/moisture on N2O fluxes, a generalized linear mixed model (proc glimmix) was developed to estimate treatment effects and differences between treatments across a defined range of days since manure application [35]. Average N2O flux was the dependent variable (expressed as the natural logarithm). Non-detects (n = 43) were randomly assigned values between zero and the minimum observed N2O-N flux value (0.000048) according to the uniform distribution. The model included random intercepts for year, block, plot, and chamber. The error term in the model was modified to explicitly accommodate correlation of samples within chambers. A spatial power correlation structure was employed with the correlation relating to the time between sample collection dates. Fixed model effects included treatment, days since manure application, treatment * [days since manure application], soil temperature, water content, and [soil temperature] * [water content]. Days since manure application, soil temperature, and water content were represented as natural cubic splines. Least square means and differences between treatments were plotted across the range of days since manure application with corresponding 95% pointwise confidence bands for the latter. Statistical significance was inferred when either the lower confidence limit was >0 or the upper confidence limit was <0. A Bonferroni correction was applied to account multiple statistical tests performed at each value of days since manure application. Days since manure application ranged from 2 to 157; days 112 to 157 were used for PP treatments. Graphics depicting the estimated treatment effects and treatment differences were restricted to days 2 to 111 since there were minimal differences noted after day 111.

3. Results and Discussion

3.1. Weather

Precipitation for the May to October growing season was close to the 30-year mean of 607 mm in 2009 and 2011, although a few individual months departed substantially from the long-term mean (Table 2). Precipitation in 2010 was 50% greater than the 30-year mean and more than twice the 30-year means for July and September. Mean temperatures for the May to October period were similar to 30-year means for 2010 and 2011, while 2009 was slightly cooler.

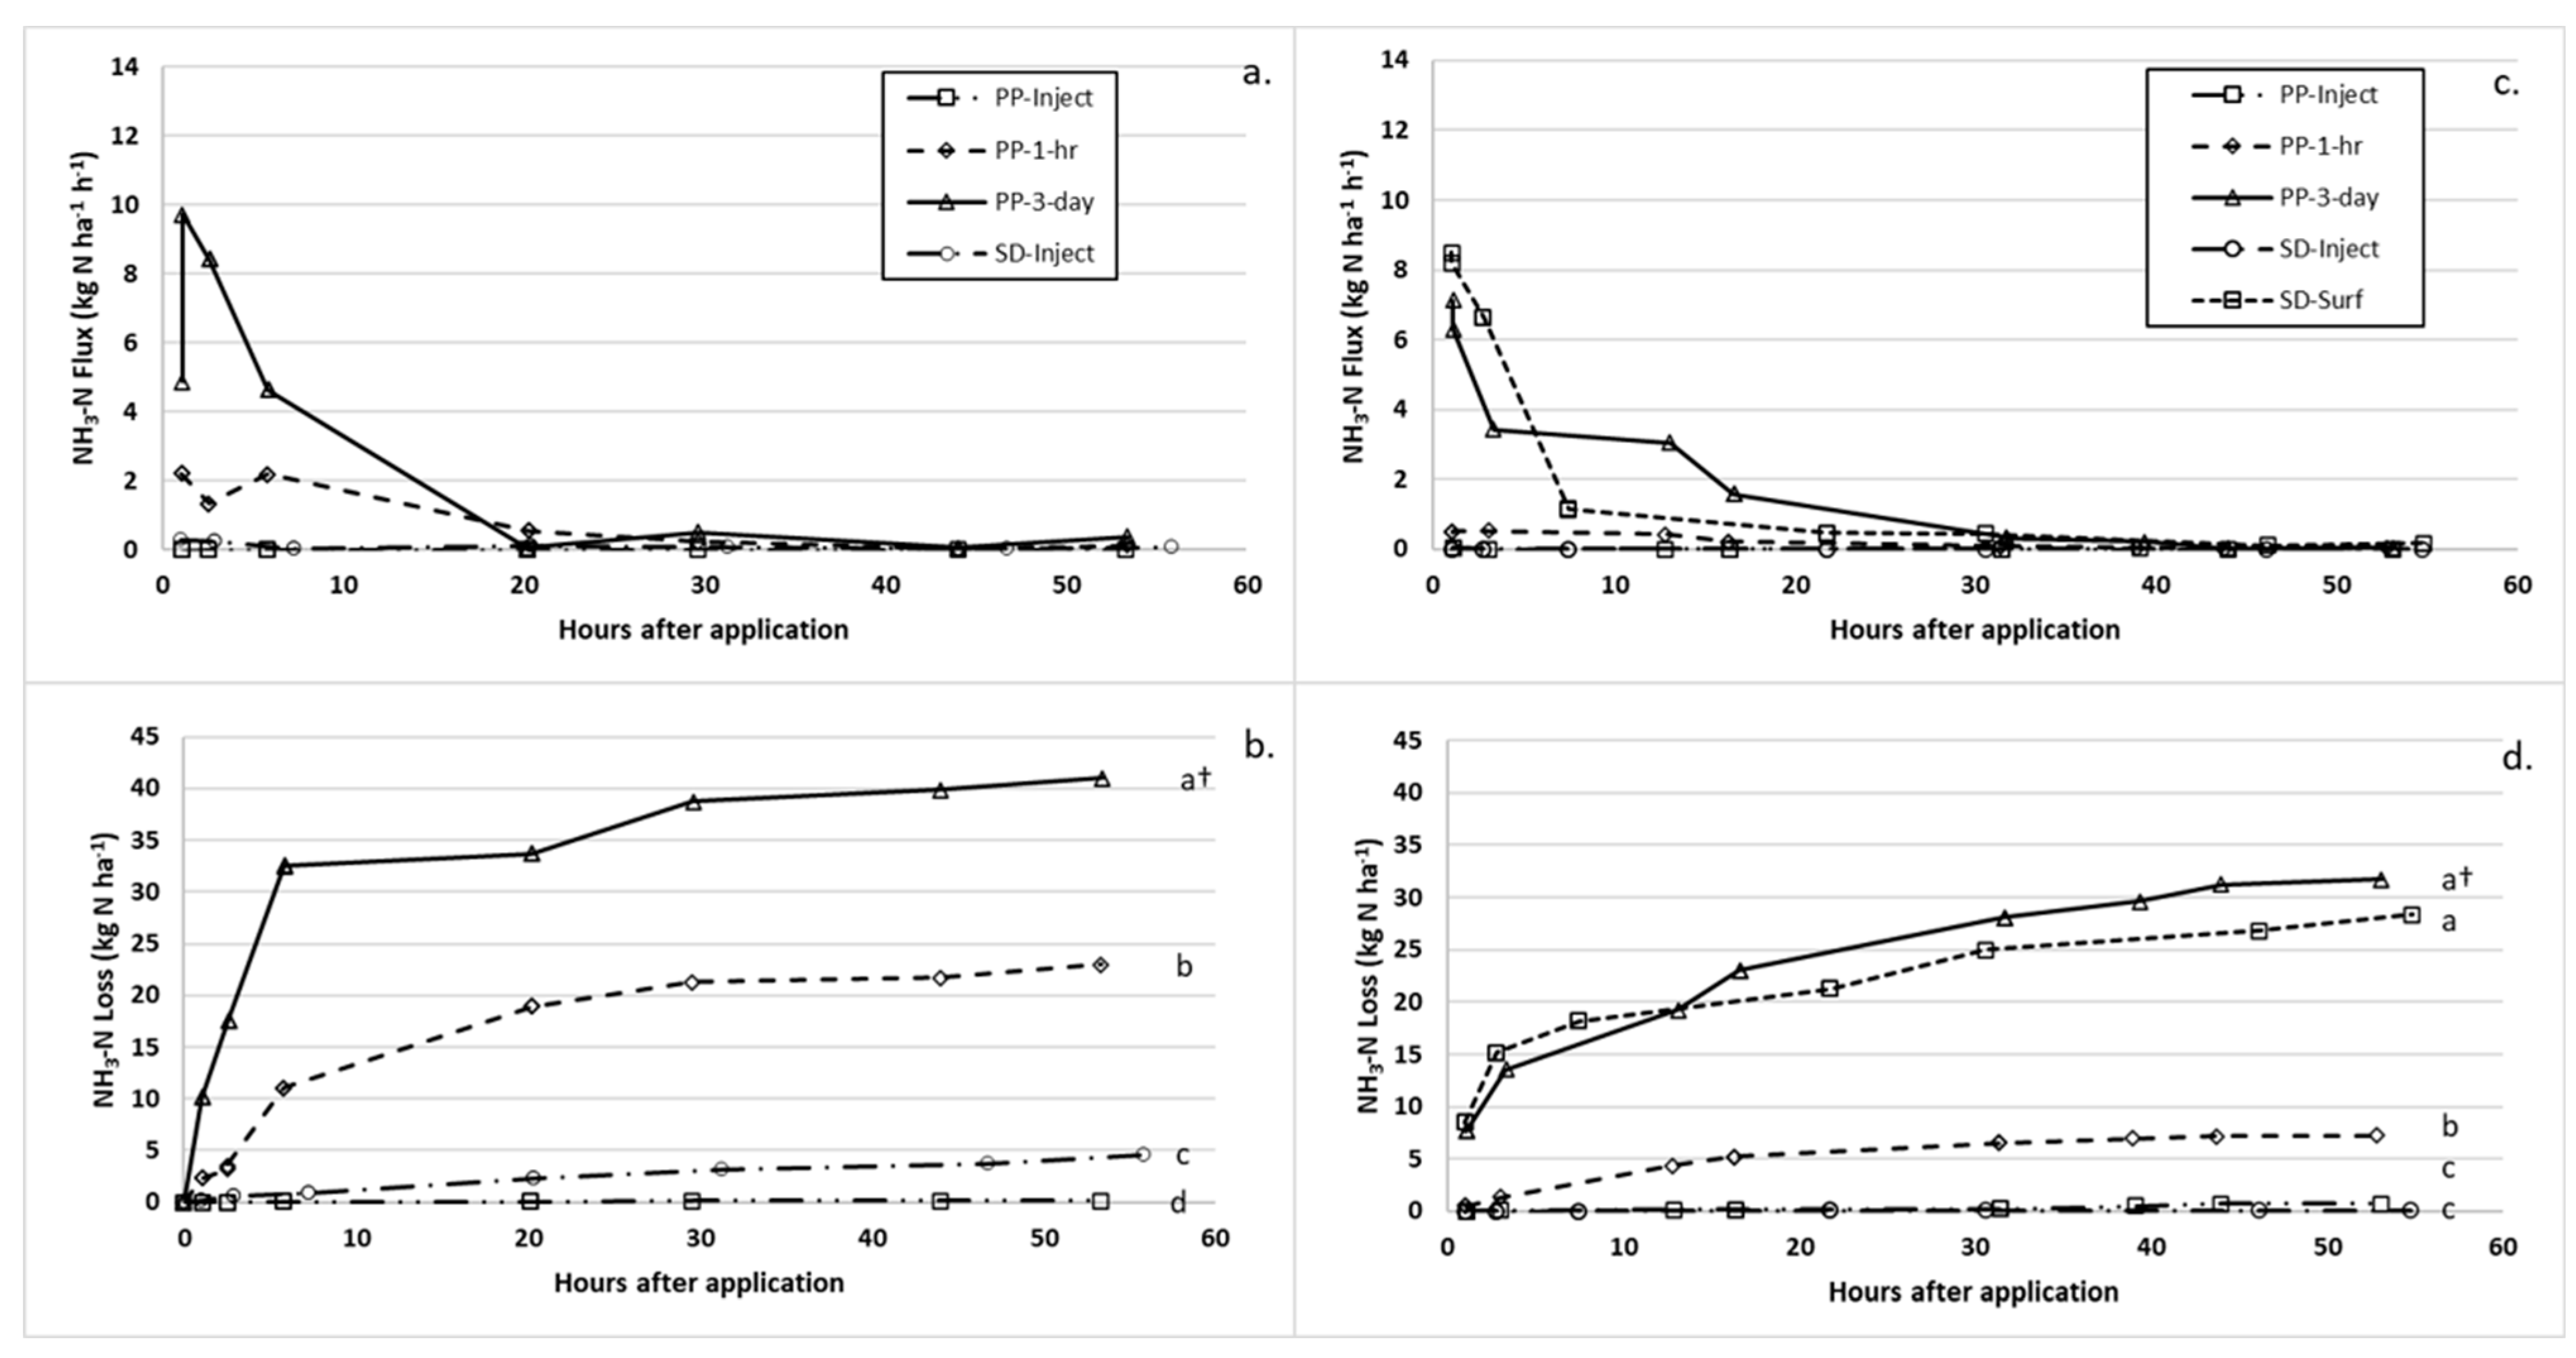
3.2. Ammonia Emission

Ammonia emissions from surface broadcast manure applied either PP or SD followed a similar pattern in all three years, with the greatest emission occurring immediately after application, ranging from 5 to 12 kg ha−1 h−1, and decreasing dramatically after the first few hours (Figure 2). This resulted in over 75% of the total loss occurring in the first 8 h in 2009 and 2011, and somewhat less occurred in 2010. This pattern of NH3 loss emphasizes the importance of prompt incorporation to reduce losses and conserve N for crop use. While there were significant treatment differences at each sampling time, NH3 fluxes at days 2 and 3 were very low (<1 kg NH3-N ha−1), similar to other studies for both annual crops and grassland [4,5,6,8,9,26,27,32,36].
Cumulative NH3 emission was greatly reduced by injection at either PP or SD, with typically >90% less NH3 lost than with broadcast application (Figure 2). Most of the reduction occurred in the first several hours after manure application, but emissions from the two injection treatments were consistently the lowest throughout the measurement period, resulting in values close to zero in most cases (Figure 2). Other researchers have reported reductions in NH3 emission by injection compared to surface application of about two-thirds [5,8,24,36,37,38], >90% [4,9,32], or close to 99% [26,29]. In our study, the cumulative emission from immediate disk incorporation was intermediate between surface broadcast and injection, with reductions of between 40 and 60% compared to the 87% decrease for PP-3-day in the first two years (not statistically different from PP-Inject in 2011). Ammonia loss reductions of 50 to 80% by chisel plow incorporation were measured in a Pennsylvania study [5]. Disk harrowing reduced NH3 loss by an average of 75% in the Netherlands [39], while disking or chisel plowing decreased NH3 loss by 84% in a Maryland study [4].
Total NH3 emission from surface applications ranged from 16 to 24% of the total N and 44 to 63% of the NH4-N in applied manure. These conversion values for NH4-N are similar to the 40 to 60% reported by several other studies [5,31,40] and slightly lower than the 55 to 70% reported by Dell et al. [5] for dairy and swine slurry. Huijsmans et al. [36] reported that 68% of NH4-N was converted to NH3-N when averaged over many experiments for swine slurry. For liquid dairy manure, Powell et al. [7] found a wide range of NH4-N to NH3-N conversion values for liquid dairy manure over four seasons, with two years nearing 50% while the other two years averaged just 26% and 13%, attributed to a combination of lower slurry dry matter content and lack of rainfall during the two seasons.
We found no consistent differences in cumulative NH3 emissions between PP and SD treatments for 2010 or 2011 despite the quite different weather conditions (Table 3). Temperatures were much higher at the SD time in late June/July than at the PP time in May, as would be expected; however, wind speeds were much lower at the SD time, probably a function of the crop. The surface application treatments were not significantly different for the two application times. Perhaps the greater wind speed at the PP time and the higher temperatures at the SD time (both of which would tend to increase NH3 volatilization) compensated for the lower wind velocity. Ammonia emissions from the injected manure treatments were low in all cases, with no significant differences in 2010 or 2011. The substantial differences in 2009 were perhaps related to the higher NH4-N content of the sidedressed manure that year (Table 1). The total N and NH4-N contents of PP and SD manure were similar in 2010 and 2011.

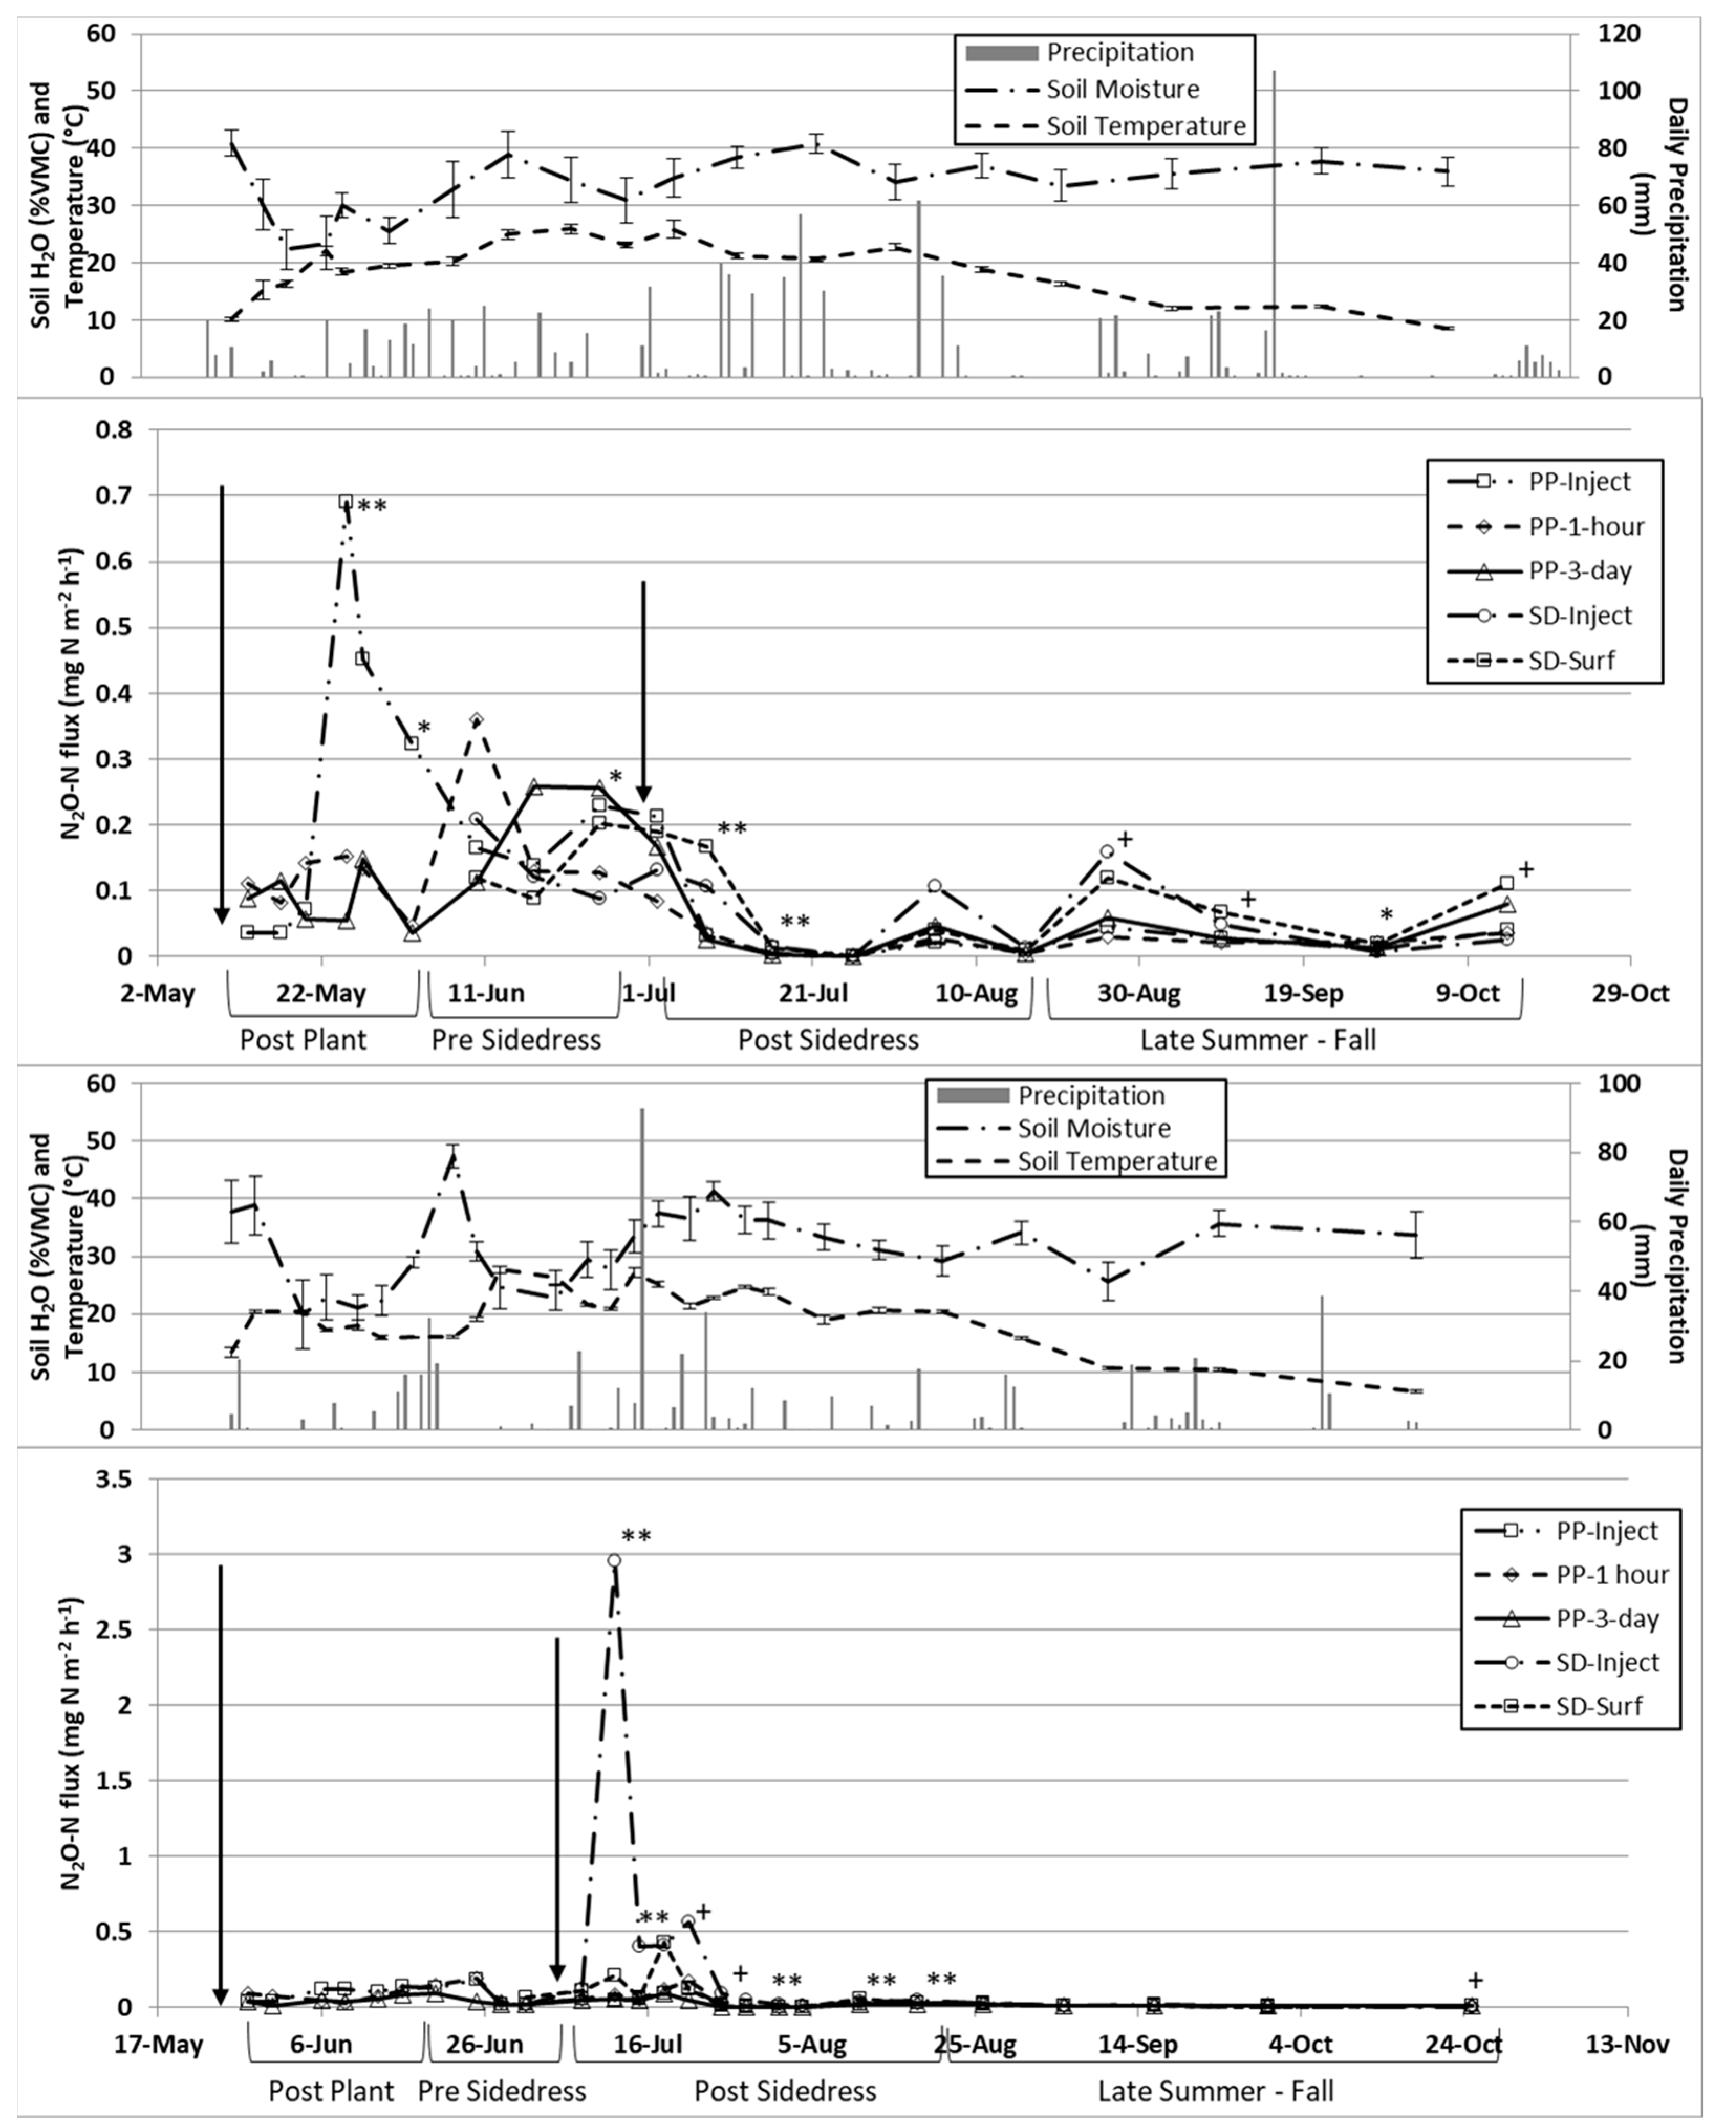
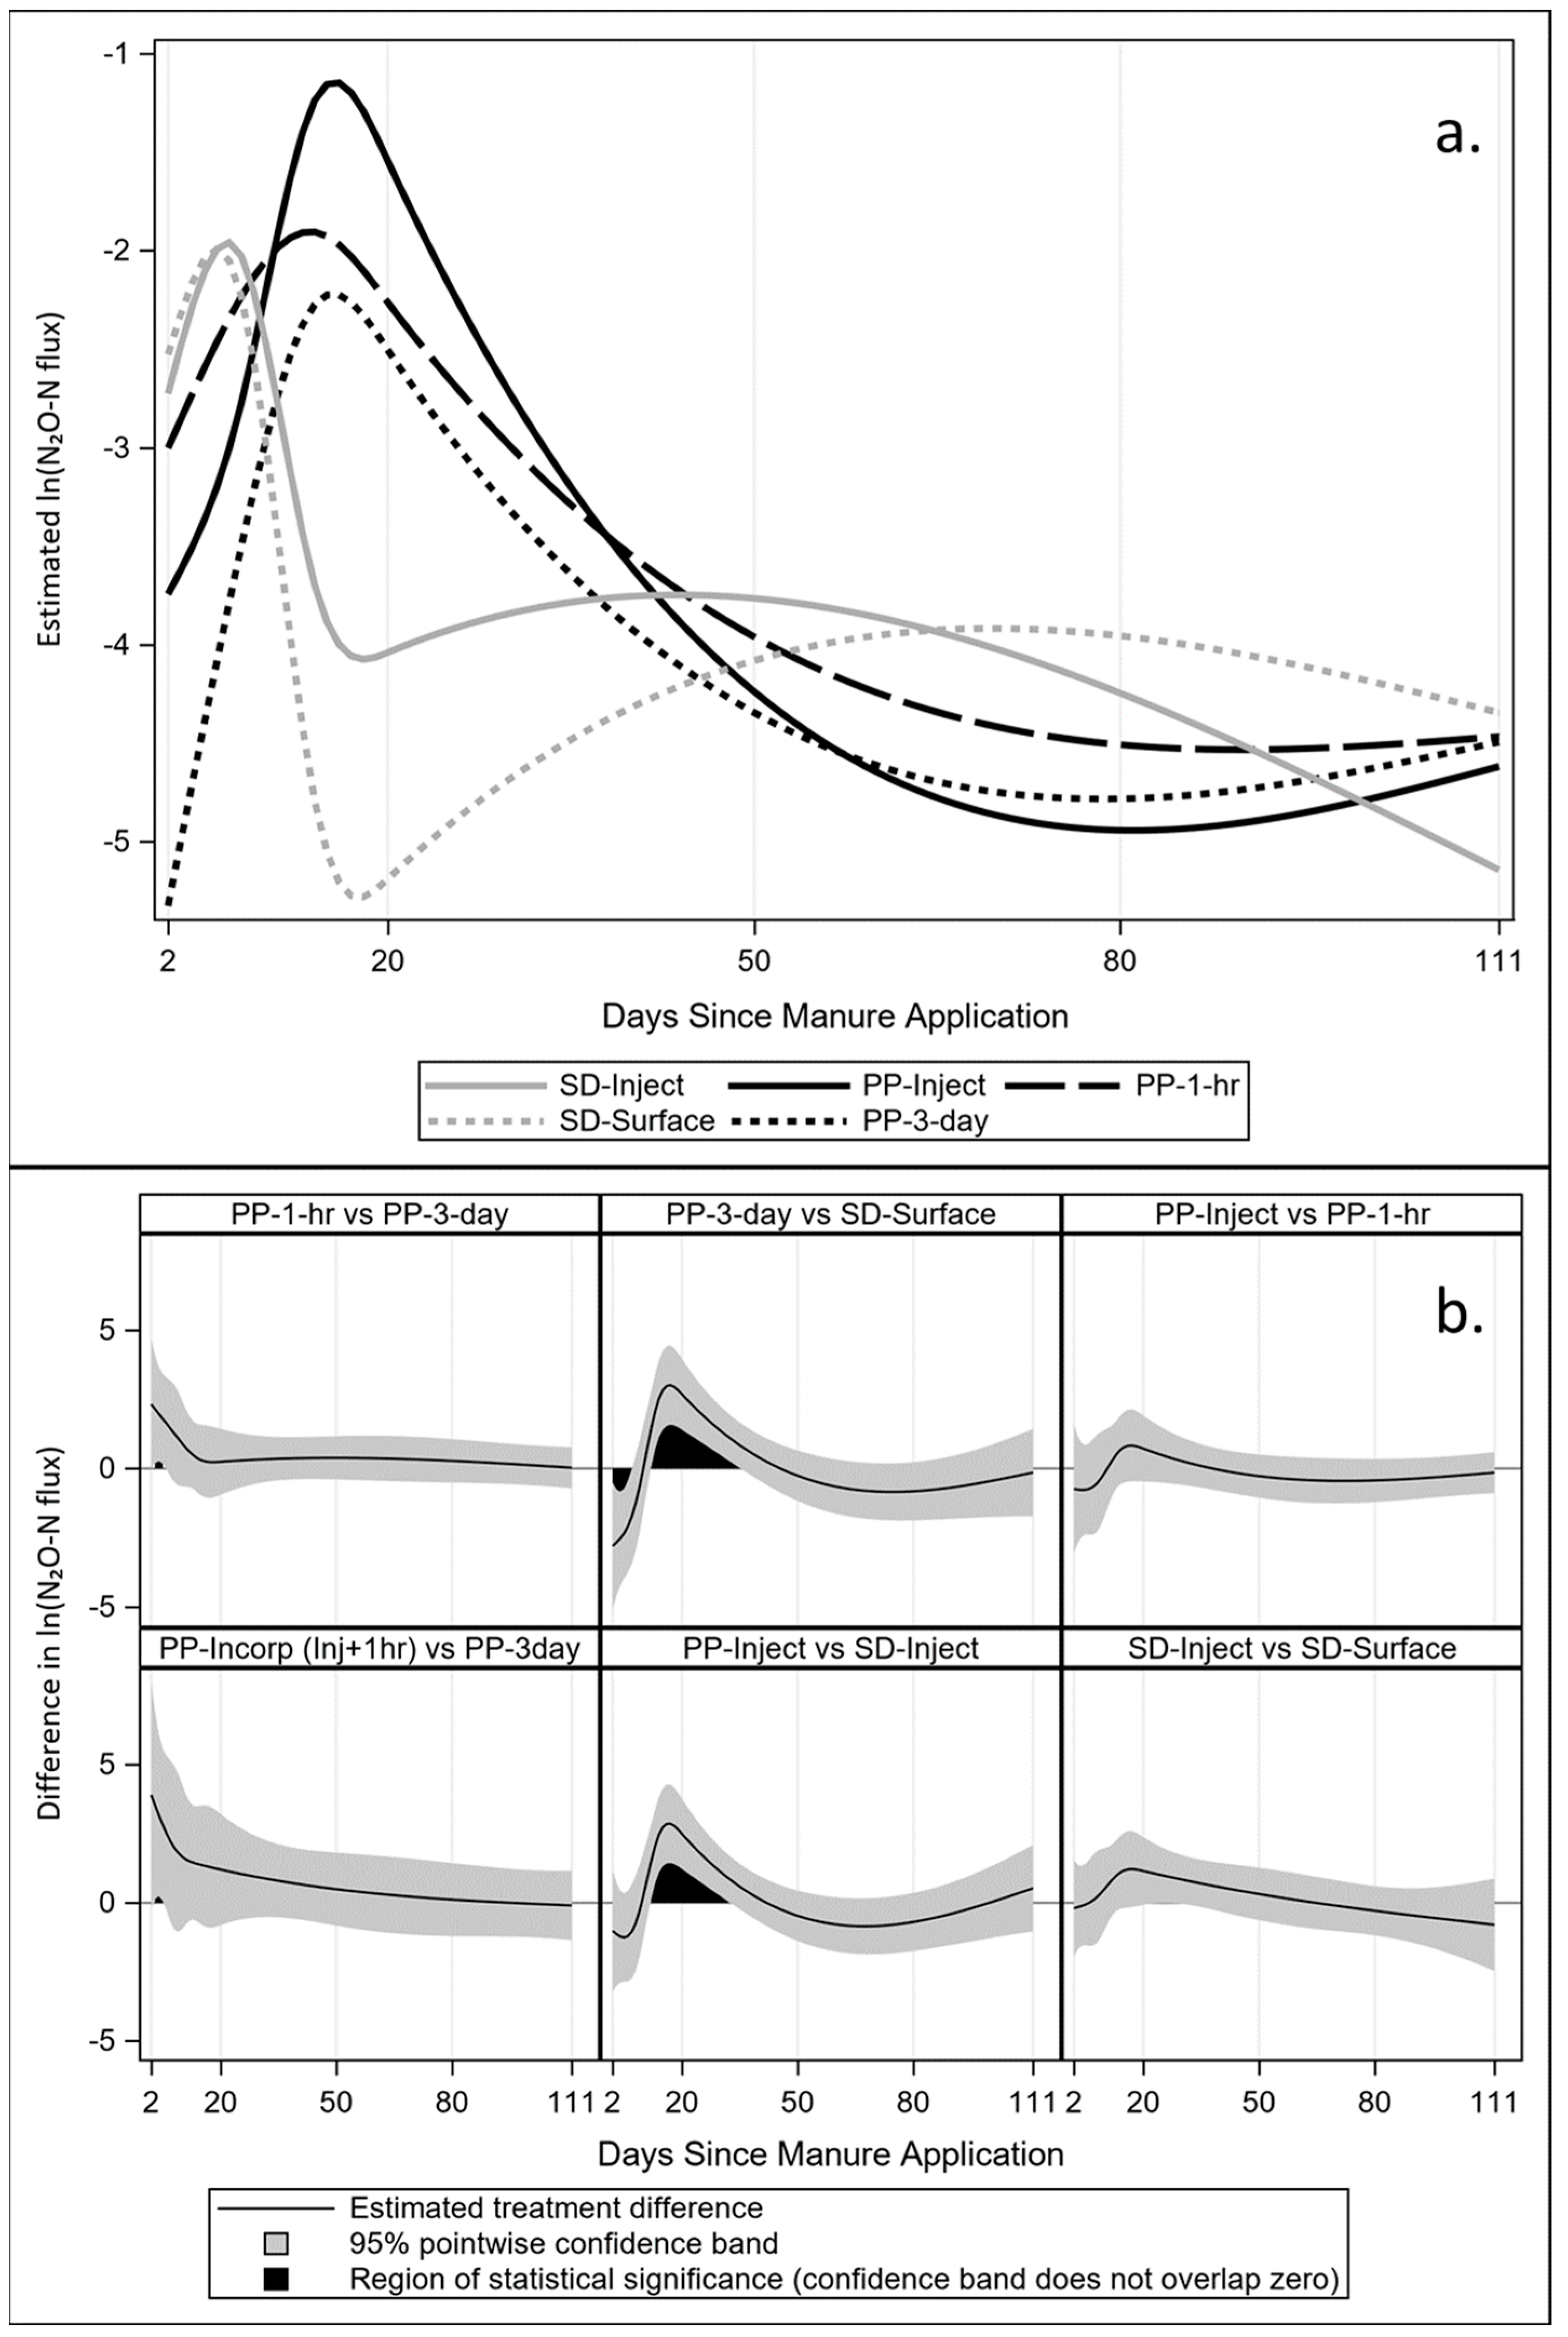
3.3. Nitrous Oxide Emission

Nitrous oxide flux was relatively low for most manure treatments during much of the May to October period in both years (Figure 3). However, there were pronounced N2O peaks after injection for PP (2010) and SD (2011). The time from manure application to peak fluxes was approximately 15 days for PP-Inject (2010) and 6 days for SD-Inject (2011), which is likely related to the lower soil temperatures around the PP time (10 °C) compared to the SD time (26 °C) and associated rates of microbial activity. Times between manure application and peak N2O fluxes for PP surface applications were shorter (typically 7 to 10 days). Despite considerable differences between site-specific conditions, our results are not that dissimilar to those of Flessa and Beese [14] and Sistani et al. [16], who reported peak N2O fluxes at 13 to 18 days after application for injection and 3 to 6 days after application for surface application versus the somewhat broader N2O emission peaks reported by Rodhe et al. [15] at 4 to 12 days after manure injection.
Changes in precipitation and soil temperature/moisture provide some explanation for N2O patterns. Manure was applied on 10 May 2010 with low soil temperature (10 °C); however, the temperature increased markedly over the next 2 weeks to 22 °C on 25 May, the same date as the peak N2O emission for PP-Inject (Figure 3). The decreasing soil moisture in the period following application may have limited the N2O fluxes along with lower soil temperatures, contributing to some of the smaller fluxes after PP (Figure 3). Previous research has demonstrated the important roles of weather, soil temperature, and soil moisture changes in N2O fluxes associated with manure application [15,25,27,40]. SD manure application on 6 July 2011 was followed by 30 mm of rain over 10–11 July and another 113 mm from 16 to 19 July, increasing the soil water content from 22 to 37%. The soil temperature fluctuated between 21 and 27 °C during the same time and, together with elevated soil water, may have facilitated the increased denitrification potential and pronounced N2O peak on 12 July. Mean N2O increases after application were much lower in 2010, with only a slight N2O flux increase for SD-Inject. In fact, N2O fluxes increased for some treatments before manure application, presumably because of favorable denitrification conditions (25 °C temperature and 34 to 39% water content).
There were no significant differences in annual cumulative N2O emission in 2010; however, PP-Inject (3.5 kg ha−1) had a mean value 45% greater than the mean of the four other treatments (2.4 kg ha−1) (data not shown). The mean N2O emission from SD-Inject (4.2 kg ha−1) was significantly (two to four times) greater than that of all other treatments (0.9 to 1.6 kg ha−1) in 2011. Additionally, injected treatments had 60% greater N2O fluxes than the other treatments when averaged over the two years of the study (Table 4) and in a range of other trials with full growing season measurements using liquid swine manure that found cumulative N2O fluxes of 0.3 to 0.8 [15], 1.1 [25], and 4.6 to 7.1 kg ha−1 [11].
Cumulative growing season N2O fluxes for most treatments ranged from 0.8 to 1.9% of the total N applied in manure, nearly five times greater than the IPCC’s default factor of 0.4% for the high end of the flux range. Mean fluxes for SD-Inject were much greater in 2011, representing 4% of the applied N. Other research with a range of application methods for liquid swine manure or cattle slurry reported a range of 0.2 to 5% of total N applied lost as N2O [12,14,16,25,26]. Chantigny et al. [12] reported that 3.1 to 5% of total N applied with liquid swine manure on a clay soil was lost as N2O, noting that the IPCC default values may also considerably underestimate N2O emissions on fine textured soils. On the other hand, Velthof and Mosquera [41] reported an average emission factor of 0.9% over a range of N sources (pig slurry, cattle slurry, and fertilizer N), application methods (injection and surface), crop types (grassland and corn), and soils (sandy and clay), with greater rates for injection vs. surface application; injected pig slurry for corn averaged 3.6% vs. 0.9% for surface-applied pig slurry and 0.4% for surface-applied cattle slurry. These emission factors are broadly similar to the ranges found in our study.
We further examined cumulative N2O emissions in four segments of the season (Table 4). Despite the lack of significant treatment effects for the full sampling seasons, there were some significant differences in the post-plant period. For PP application, PP-Inject was greater than PP-3-day, with PP-1-hr being intermediate. Due to a significant treatment by year interaction for the post-SD time period, comparisons were made individually by year. The mean N2O emission after 2010 SD application was relatively low, with numerically larger emissions from SD-Surf. There were significant treatment differences in 2011 for the post-SD period, with much larger fluxes for SD-Inject. While there were no significant differences in the late summer–fall period, there was a trend of greater emission from SD, especially SD-Inject.
The greater N2O emission from manure injection compared to surface application has been attributed to conducive denitrification conditions in the injection zone (abundant inorganic N and labile C) coupled with anoxic conditions [14,42]. The lack of consistent effects with injection may be related to the codependence of N2O emission on soil moisture content and/or injection depth [14]. The lower N2O flux from slurry injected deeper into the soil has been attributed to a longer diffusion path to the soil surface, increasing the probability that denitrification will proceed to N2 [43] or that rainfall would not reach the injection zone to increase soil moisture [21]. In our study, all PP plots were chisel plowed 3 to 5 days after manure application to prepare a consistent seedbed for corn, which may have limited some injection zone effects on N2O. A recent study in Quebec, Canada, showed that splitting N fertilizer application reduced N2O fluxes in corn by >50% compared to applying N all at once earlier in the season when corn plants had less demand for N [23].
The linear mixed model developed for continuous N2O flux estimate curves (ex-pressed as ln (N2O-N flux)) as a function of the number of days since manure application showed clear patterns by treatment (Figure 4a) and for select differences between treatments (Figure 4b). Contrasts based on the linear mixed model showed similar results, with no significant differences over the year, beginning with manure application between PP-Inject and versus PP-Disk, and SD-Inject versus SD-Surf, or PP-3-day and SD-Surf.
The model predicted greater N2O fluxes for PP-Inject+PP-1-hr compared to PP-3-day, in addition to greater fluxes for PP-1-hr over PP-3-day in the first 30 days after incorporation. Additionally, greater N2O fluxes were predicted for SD-Inject compared to PP-Inject within 20 days of application. Interaction terms for time (treatment * [days since manure application] and soil water/temperature [soil temperature] * [soil water content]) were both significant (p < 0.0001). Ranges of statistical significance for days since manure application (i.e., days where the 95% confidence band does not overlap zero) were identified for four of the six treatment comparisons examined: PP-1-hr vs. PP-3-day, days 3–5 (positive); PP-3-day vs. SD-Surf, days 2–7 (negative) and days 12–35 (positive); PP-Incorp (Inject+1-hr) vs. PP-3-day, days 3–5 (positive); PP-Inject vs. SD-Inject, days 12–32 (positive). Positive values indicate that estimates for the first treatment listed in the above comparison were greater than the corresponding second treatment value.

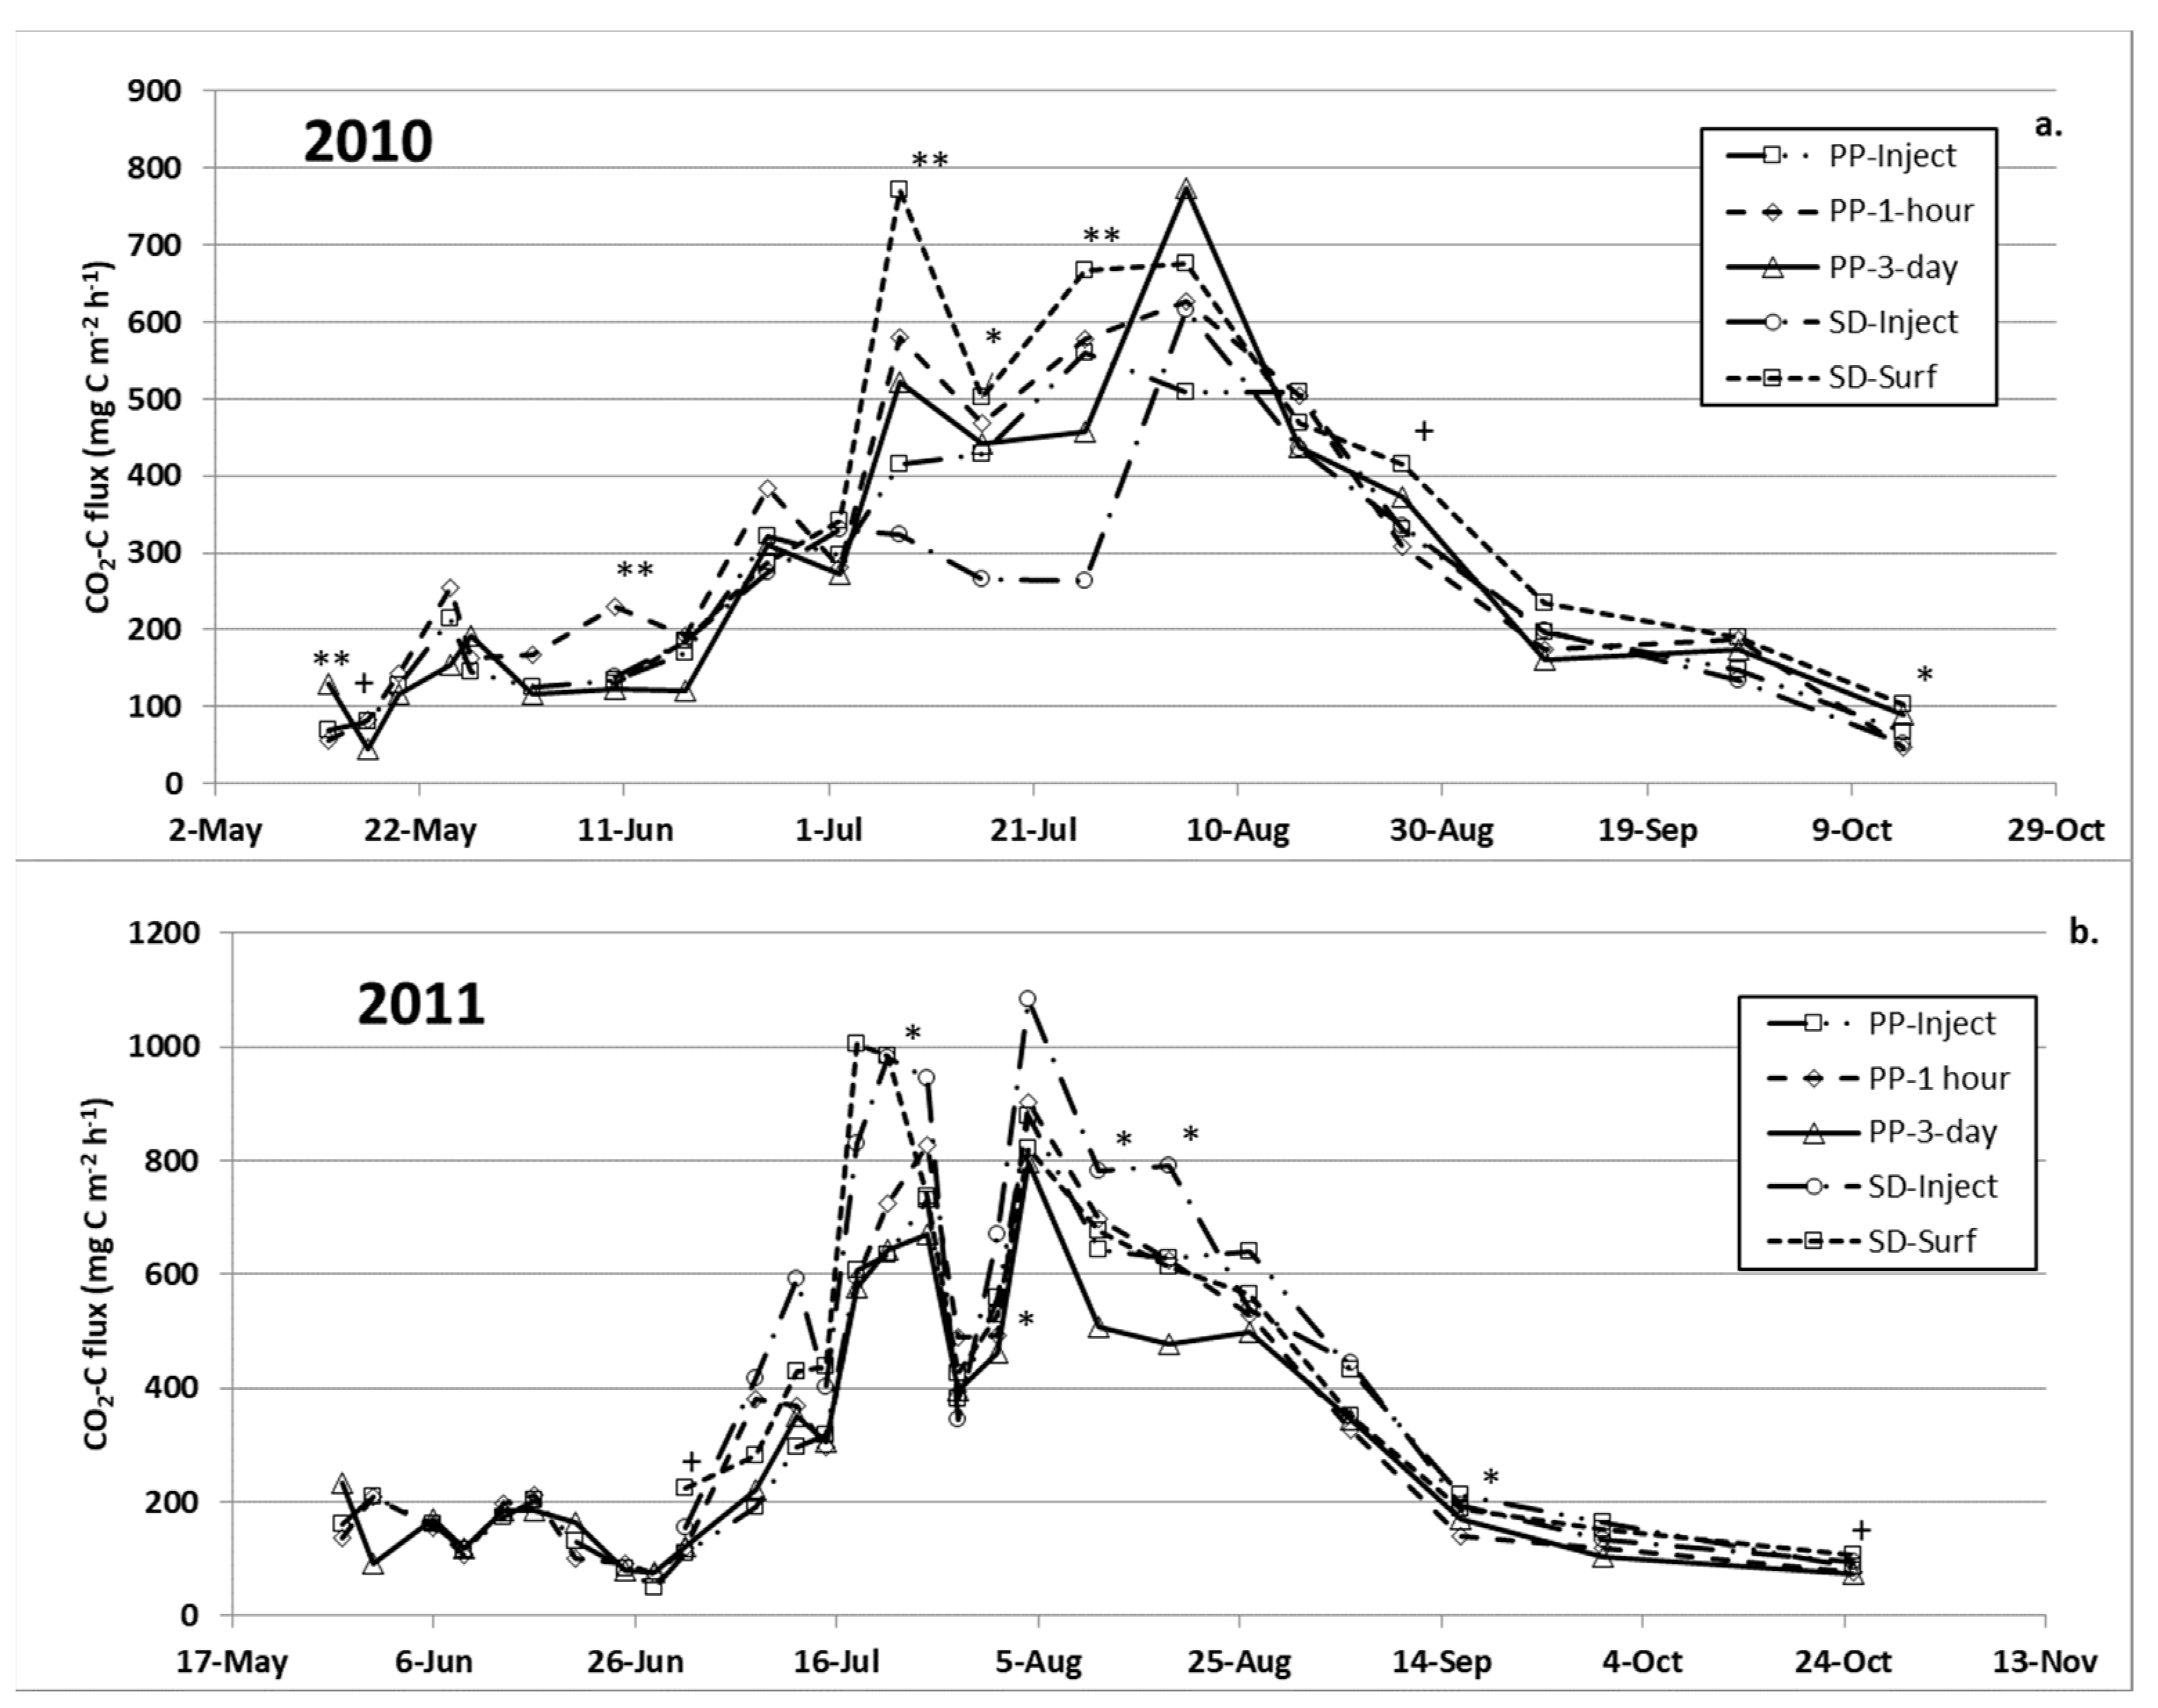
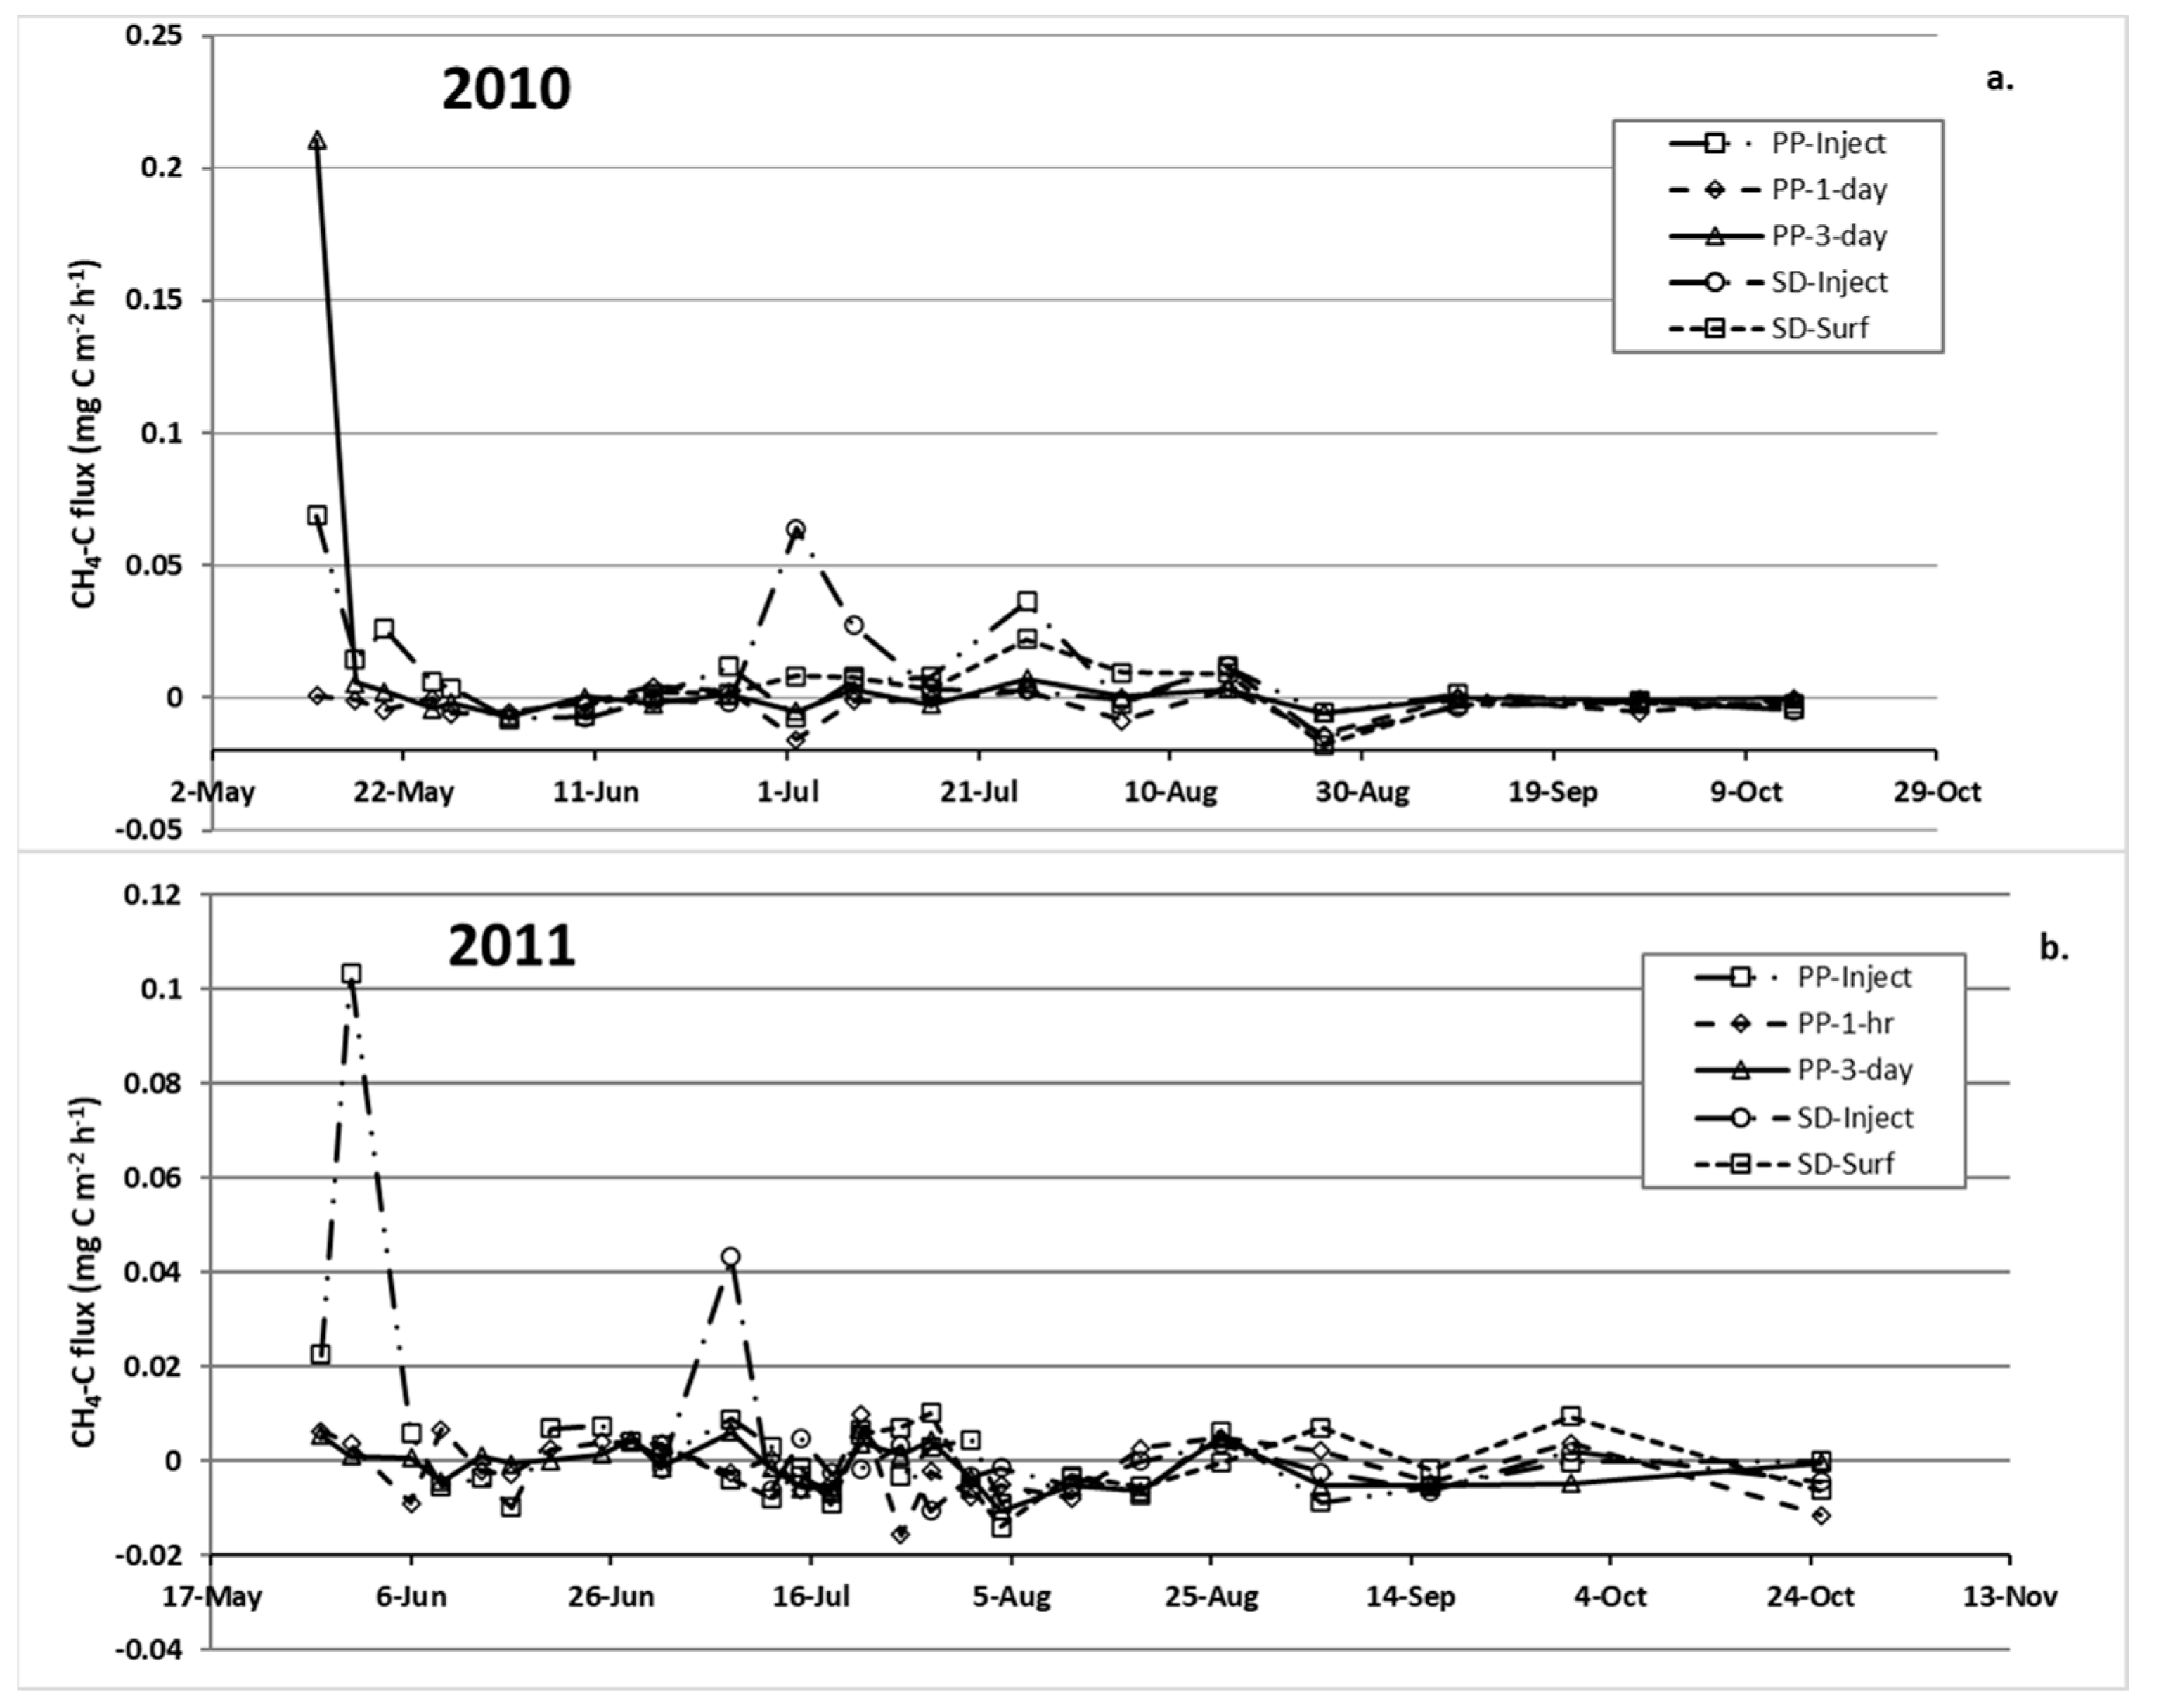
3.4. Carbon Dioxide and Methane Emissions

Changes in CO2 fluxes showed strong seasonal trends such as temperature changes, with maximum fluxes occurring near mid-July to mid-August (Figure 5) and lower fluxes during early spring and fall (Figure 5). The consistent decrease in CO2 emissions during mid- to late July (2010 and 2011) paralleled the soil temperature declines (Figure 3), and soil temperature and CO2 fluxes were significantly correlated (Pearson r = 0.43; p < 0.0001) over the two cropping seasons. Overall, the manure treatments had minor effects on CO2 fluxes, with some limited seasonal differences. SD-Surf had the greatest emission in the 2010 post-SD period (p = 0.04), and SD-Inject had the highest flux in the late summer/fall of 2011 (p = 0.10; data not shown). These CO2 increases from SD treatments may be related to the recent addition of labile C from SD manure at a time when soil temperatures were relatively high. It is unclear what factors led to the greater CO2 fluxes for SD-Surf (2010) and SD-Inject (2011).
Flessa and Beese [14] measured their highest CO2 flux immediately after dairy slurry application, an effect attributed to high labile C availability in the slurry, and reported no difference between injected vs. surface application. Sistani et al. [16] also reported no application effect for swine effluent on cumulative CO2 emission. In contrast to our results, they observed elevated CO2 flux initially and then a decline as soil moisture decreased during a period when soil temperature was increasing (emissions increased again later in the season following a period of rain). Their study was conducted on a moderately well-drained Kentucky soil with temperatures of 15 to >20 °C in the first week and mostly ≥25 °C for the rest of the season, with low soil moisture status (12 to 15% by mid- to late June). Our study was conducted on a somewhat poorly drained loess soil where soil moisture was not limiting (volumetric soil moisture ranged between 30 and 40% for most of the season, with occasional periods of 20 to 25%), likely contributing to the different results for the two trials. Using 11 soil- and climate-related measures over 542 days of study (2012 to 2015), Abasi et al. [22] used six machine learning algorithms to predict CO2 fluxes in a maize–soy system in southern Quebec, Canada. They reported that the Random Forest algorithm was the most efficient and accurate for predicting CO2 fluxes and that soil temperature and moisture were the most sensitive input parameters.
In a review of isotope methods for tracking ecosystem carbon and CO2 fluxes, Pang et al. [19] suggested six fates for carbon additions based on results from 13 CO2 labeling method studies: (i) lost as CO2 to the atmosphere, (ii) transient storage in roots, (iii) carbon release via rhizodeposition, (iv) stored in microbial biomass/necromass, (v) lost via microbial/faunal respiration, or (vi) stored as soil organic matter. Changes in labile organic carbon influenced by injection/disk incorporation likely influenced below-ground biomass and root respiration, contributing to some of the CO2 variability in our study. While labile soil carbon or dissolved organic carbon forms were not measured in our study, we suspect labile carbon measures and other suitable soil biomarkers (i.e., amino sugars, sugars, phospholipid fatty acids, and DNA/RNA) at different soil depths could help better track potential CO2 differences for manure–tillage combination studies.
Average CH4 fluxes were low and sometimes negative, indicating net CH4 consumption (Figure 6). However, there was a sharp increase in CH4 flux from both PP and SD injection in the first sampling 2 to 3 days after manure application in both years (second sampling 5 days after sampling in PP period in 2011).
The exception to this pattern was the sharp spike in CH4 from the PP-3-day treatment in the first sampling of 2010. Net annual CH4 emissions ranged from 180 to −109 g ha−1 over the two years. However, there were no significant differences among treatments on an annual or seasonally segmented basis (data not shown). Other researchers have reported similar results, with transient CH4 flux increases immediately after manure application and larger emissions from injection [14,16,26,27]. Net emissions were low for the remainder of the measuring period, resulting in no overall treatment effects.

4. Conclusions

The results from our study indicate that injection was the most effective means for NH3 conservation of the methods investigated, with more modest reductions from tillage incorporation. Manure application method effects on CO2 and CH4 emissions were minimal. While effects on N2O flux varied across the years and application times, larger N2O fluxes were associated with injection. While this suggests a trade-off between the beneficial effects of injection for the control of NH3 emission and the negative effects on greenhouse gas due to increased N2O flux, it is important to include the secondary effects of volatilized NH3 on N2O emission. The IPCC [3] estimates that 0.4% of N applied to land will be emitted as N2O; thus, injection may result in a net greenhouse gas benefit compared to surface application. Moreover, some researchers have measured substantially larger N2O emissions than those in our experiment [12], concluding that the IPCC default values may underestimate N2O emission potential. Another point to consider is that higher manure application rates are needed for broadcast application in order to meet crop N demands compared to injected manure because of large NH3 losses from broadcast, potentially exacerbating secondary N2O emissions.

Author Contributions

Conceptualization, W.J.; methodology, J.S., E.Y., B.K. and W.J.; software, J.S. and B.K.; validation, E.Y. and B.K.; formal analysis, J.S. and B.K.; investigation, W.J. and J.S.; data curation, J.S.; writing—original draft preparation, J.S. and E.Y.; writing—review and editing, E.Y. and J.S.; visualization, J.S. and B.K.; supervision, W.J. and E.Y.; project administration, W.J. and E.Y. All authors have read and agreed to the published version of the manuscript.

Funding

This research received no external funding.

Institutional Review Board Statement

Not applicable.

Data Availability Statement

Not applicable.

Acknowledgments

The authors would like are grateful to the Marshfield Agricultural Research Station and farm staff for their support on this project.

Conflicts of Interest

The authors declare no conflict of interest.

References

  1. Pinder, R.W.; Adams, P.J.; Pandis, S.N. Ammonia emission controls as a cost-effective strategy for reducing atmospheric particulate matter in the eastern United States. Environ. Sci. Technol. 2007, 41, 380–386. [Google Scholar] [CrossRef] [PubMed] [Green Version]
  2. Apsimon, H.M.; Kruse, M.; Bell, J.N.B. Ammonia emissions and their role in acid deposition. Atmos. Environ. 1987, 21, 1939–1946. [Google Scholar] [CrossRef]
  3. IPCC. Climate Change and Land: An IPCC Special Report on Climate Change, Desertification, Land Degradation, Sustainable Land Management, Food Security, and Greenhouse Gas Fluxes in Terrestrial Ecosystems. Shukla, P.R., Skea, J., Buendia, E.C., Masson-Delmotte, V., Pörtner, H.-O., Roberts, D.C., Zhai, P., Slade, R., Connors, S., van Diemen, R., Eds.; 2019. Available online: https://www.ipcc.ch/srccl/ (accessed on 20 May 2022).
  4. Thompson, R.B.; Meisinger, J.J. Management factors affecting ammonia volatilization from land-applied cattle slurry in the mid-Atlantic USA. J. Environ. Qual. 2002, 31, 1329–1338. [Google Scholar] [CrossRef] [PubMed]
  5. Dell, C.J.; Kleinman, P.J.A.; Schmidt, J.P.; DBBeegle, D.B. Low-disturbance manure incorporation effects on ammonia and nitrate loss. J. Environ. Qual. 2012, 41, 928–937. [Google Scholar] [CrossRef] [PubMed]
  6. Meisinger, J.J.; Jokela, W.E. Ammonia volatilization from dairy and poultry manure. In Managing Nutrients and Pathogens from Animal Agriculture, Proceedings of the Conference for Nutrient Management Consultants, Extension Educators, and Producer Advisors, Camp Hill, PA, USA, 28–30 March 2000; NRAES: Ithaca, NY, USA, 2000. [Google Scholar]
  7. Powell, J.M.; WEJokela, W.E.; Misselbrook, T.H. Dairy slurry application method impacts ammonia emission and nitrate leaching in no-till corn silage. J. Environ. Qual. 2011, 40, 383–392. [Google Scholar] [CrossRef]
  8. Sherman, J.; Young, E.O.; Jokela, W.E.; Cavadini, J. Impacts of low disturbance dairy manure incorporation on alfalfa yield and fluxes of ammonia, nitrous oxide, and methane. Agriculture 2021, 11, 750. [Google Scholar] [CrossRef]
  9. Sherman, J.F.; Young, E.O.; Jokela, W.E.; Cavadini, J. Impacts of low-disturbance dairy manure incorporation on ammonia and greenhouse gas fluxes in a corn-winter rye cover crop system. J. Environ. Qual. 2021, 50, 836–846. [Google Scholar] [CrossRef]
  10. Ball-Coelho, B.R.; Roy, R.C.; Bruin, A.J. Nitrogen recovery and partitioning with different rates and methods of sidedressed manure. Soil Sci. Soc. Am. J. 2006, 70, 464–473. [Google Scholar] [CrossRef]
  11. Jokela, W.E.; Bosworth, S.C.; Rankin, J.J. Sidedressed dairy manure effects on corn yield and residual soil nitrate. Soil Sci. 2014, 179, 37–41. [Google Scholar] [CrossRef]
  12. Chantigny, M.H.; Rochette, P.; Angers, D.A.; Bittman, S.; Buckley, K.; Masse, D.; Belanger, G.; Eriksen-Hamel, N.; Gasser, M.O. Soil nitrous oxide emissions following band-incorporation of fertilizer nitrogen and swine manure. J. Environ. Qual. 2010, 39, 1545–1553. [Google Scholar] [CrossRef]
  13. Duncan, E.W.; Dell, C.J.; Kleinman, P.J.; Beegle, D.B. Nitrous oxide and ammonia emissions from injected and broadcast-applied dairy slurry. J. Environ. Qual. 2017, 46, 36–44. [Google Scholar] [CrossRef]
  14. Flessa, H.; Beese, F. Laboratory estimates of trace gas emissions following surface application and injection of cattle slurry. J. Environ. Qual. 2000, 29, 262–268. [Google Scholar] [CrossRef]
  15. Rodhe, L.; Pell, M.; Yamulki, S. Nitrous oxide, methane and ammonia emissions following slurry spreading on grassland. Soil Use Manag. 2006, 22, 229–237. [Google Scholar] [CrossRef]
  16. Sistani, K.R.; Warren, J.G.; Lovanh, N.; Higgins, S.; Shearer, S. Greenhouse gas emissions from swine effluent applied to soil by different methods. Soil Sci. Soc. Am. J. 2010, 74, 429–435. [Google Scholar] [CrossRef]
  17. Rubaek, G.H.; Henriksen, K.; Petersen, J.; Rasmussen, B.; Sommer, S.G. Effects of application technique and anaerobic digestion on gaseous nitrogen loss from animal slurry applied to ryegrass (Lolium perenne). J. Agric. Sci. 1996, 126, 481–492. [Google Scholar] [CrossRef]
  18. Vallejo, A.; Garcia-Torres, L.; Diez, J.A.; Arce, A.; Lopez-Fernandez, S. Comparison of nitrogen losses (NO3-, N2O, NO) from surface applied, injected or amended pig slurry of an irrigated soil in a Mediterranean climate. Plant Soil 2005, 272, 313–325. [Google Scholar] [CrossRef]
  19. Pang, R.; Xu, X.; Tian, Y.; Cui, X.; Ouyang, X.; Kuzyakov, Y. In-situ 13CO2 labeling to trace carbon fluxes in plant-soil-microorganism systems: Review and methodological guideline. Rhizosphere 2021, 2, 100441. [Google Scholar] [CrossRef]
  20. Ashiq, W.; Nadeem, M.; Ali, W.; Zaeem, M.; Wu, J.; Galagedara, L.; Thomas, R.; Kavanagh, V.; Cheema, M. Biochar amendment mitigates greenhouse gases emission and global warming potential in dairy manure based silage corn in boreal climate. Environ. Pollut. 2020, 265, 114869. [Google Scholar] [CrossRef]
  21. Gong, H.; Li, J.; Liu, Z.; Zhang, Y.; Hou, R.; Ouyang, Z. Mitigated Greenhouse Gas Emissions in Cropping Systems by Organic Fertilizer and Tillage Management. Land 2022, 11, 1026. [Google Scholar] [CrossRef]
  22. Abbasi, N.A.; Hamrani, A.; Madramootoo, C.A.; Zhang, T.; Tan, C.S.; Goyal, M.K. Modelling carbon dioxide emissions under a maize-soy rotation using machine learning. Biosyst. Eng. 2021, 212, 1–18. [Google Scholar] [CrossRef]
  23. Crézé, C.M.; Madramootoo, C.A. Water table management and fertilizer application impacts on CO2, N2O and CH4 fluxes in a corn agro-ecosystem. Sci. Rep. 2019, 9, 1–13. [Google Scholar] [CrossRef] [PubMed] [Green Version]
  24. Halvorson, A.D.; Del Grosso, S.J.; Jantalia, C.P. Nitrogen source effects on soil nitrous oxide emissions from strip-till corn. J. Environ. Qual. 2011, 40, 1775–1786. [Google Scholar] [CrossRef]
  25. Webb, J.; Pain, B.; Bittman, S.; Morgan, J. The impacts of manure application methods on emissions of ammonia, nitrous oxide and on crop response-A review. Agric. Ecosyst. Environ. 2010, 137, 39–46. [Google Scholar] [CrossRef]
  26. Perala, P.; Kapuinen, P.; Esala, M.; Tyynela, S.; Regina, K. Influence of slurry and mineral fertiliser application techniques on N2O and CH4 fluxes from a barley field in southern Finland. Agric. Ecosyst. Environ. 2006, 117, 71–78. [Google Scholar] [CrossRef]
  27. Wulf, S.; Maeting, M.; Clemens, J. Application technique and slurry co-fermentation effects on ammonia, nitrous oxide, and methane emissions after spreading: I. Ammonia volatilization. J. Environ. Qual. 2002, 31, 1789–1794. [Google Scholar] [CrossRef]
  28. Svensson, L. A New Dynamic Chamber Technique for Measuring Ammonia Emissions from Land-Spread Manure and Fertilizers. Acta Agric. Scand. Sect. B-Soil Plant Sci. 1994, 44, 35–46. [Google Scholar] [CrossRef]
  29. Mattila, P.K.; Joki-Tokola, E. Effect of treatment and application technique of cattle slurry on its utilization by ley: I. Slurry properties and ammonia volatilization. Nutr. Cycl. Agroecosyst. 2003, 65, 221–230. [Google Scholar] [CrossRef]
  30. Misselbrook, T.H.; Hansen, M.N. Field evaluation of the equilibrium concentration technique (JTI method) for measuring ammonia emission from land spread manure or fertiliser. Atmos. Environ. 2001, 35, 3761–3768. [Google Scholar] [CrossRef]
  31. Myers, T.L.; Dell, C.J.; Beegle, D.B. Evaluation of ammonia emissions from manure incorporated with different soil aerator configurations. J. Soil Water Conserv. 2013, 68, 306–314. [Google Scholar] [CrossRef]
  32. Pfluke, P.D.; Jokela, W.E.; Bosworth, S.C. Ammonia volatilization from surface-banded and broadcast application of liquid dairy manure on grass forage. J. Environ. Qual. 2011, 40, 374–382. [Google Scholar] [CrossRef]
  33. Parkin, T.B.; Venterea, R.T. Chamber-based trace gas flux measurements. In Sampling Protocols; Follett, R.F., Ed.; USDA-ARS: Washington, DC, USA, 2010. Available online: www.ars.usda.gov/research/GRACEnet (accessed on 15 December 2010).
  34. Venterea, R.T. Simplified method for quantifying theoretical underestimation of chamber-based trace gas fluxes. J. Environ. Qual. 2010, 39, 126–135. [Google Scholar] [CrossRef] [PubMed] [Green Version]
  35. SAS Institute Inc. SAS 9.4 Guide to Software Updates; SAS Institute Inc.: Cary, NC, USA, 2013. [Google Scholar]
  36. Huijsmans, J.F.M.; Hol, J.M.G.; Vermeulen, G.D. Effect of application method, manure characteristics, weather and field conditions on ammonia volatilization from manure applied to arable land. Atmos. Environ. 2003, 37, 3669–3680. [Google Scholar] [CrossRef]
  37. Thompson, R.B.; Ryden, J.C.; Lockyer, D.R. Fate of nitrogen in cattle slurry following surface application or injection to grassland. J. Soil Sci. 1987, 38, 689–700. [Google Scholar] [CrossRef]
  38. Bittman, S.; van Vliet, L.J.P.; Kowalenko, C.G.; McGinn, S.; Hunt, D.E.; Bounaix, F. Surface-banding liquid manure over aeration slots: A new low-disturbance method for reducing ammonia emissions and improving yield of perennial grasses. J. Agron. 2005, 97, 1304–1313. [Google Scholar] [CrossRef] [Green Version]
  39. Malgeryd, J. Technical measures to reduce ammonia losses after spreading of animal manure. Nutr. Cycl. Agroecosyst. 1998, 51, 51–57. [Google Scholar] [CrossRef]
  40. Goodroad, L.L.; Keeney, D.R. Nitrous-oxide production in aerobic soils under varying pH, temperature and water-content. Soil Biol. Biochem. 1984, 16, 39–43. [Google Scholar] [CrossRef]
  41. Velthof, G.L.; Mosquera, J. The impact of slurry application technique on nitrous oxide emission from agricultural soils. Agric. Ecosyst. Environ. 2011, 140, 298–308. [Google Scholar] [CrossRef]
  42. Comfort, S.D.; Kelling, K.A.; Keeney, D.R.; Converse, J.C. The fate of nitrogen from injected liquid manure in a silt loam soil. J. Environ. Qual. 1988, 17, 317–322. [Google Scholar] [CrossRef]
  43. Velthof, G.L.; Kuikman, P.J.; Oenema, O. Nitrous oxide emission from animal manures applied to soil under controlled conditions. Biol. Fertil. Soils 2003, 37, 221–230. [Google Scholar] [CrossRef]
Figure 1. Digital photographs of manure injection implements: (a) PP-Inject; (b) PP-1-hr and PP-3-day application; (c) SD-Inject; (d) SD-Surf.
Agriculture 12 01952 g001
Figure 2. Average ammonia (NH4-N) flux values (kg ha−1 h−1) for (a) 2009 and (c) 2010 and 2011, and cumulative NH3-N (kg ha−1) loss for (b) 2009 and (d) the average for 2010 and 2011. † Cumulative losses with the same letter are not significantly different at p = 0.01.
Agriculture 12 01952 g002
Figure 3. Nitrous oxide (N2O-N) fluxes (mg N m−2 h−1) and associated soil temperature and moisture content for 2010 (top two panels) and 2011 (bottom two panels). Means differing among treatments within a sampling date are denoted as follows: ** p = 0.01; * p = 0.05; + p = 0.10.
Agriculture 12 01952 g003
Figure 4. Nitrous oxide (N2O) emissions predicted by the linear mixed model developed as a function of the number of days after manure application (a). Differences in N2O emissions between application methods in the days following manure application. The region of statistical significance for days since manure application (positive (negative) indicates that the estimate for the first treatment listed in the comparison was higher (lower) than the second treatment listed): PP-1-hr vs. PP-3-day, days 3–5 (positive); PP-3-day vs. SD-Surface, days 2–7 (negative) and days 12–35 (positive); PP-Incorp (Inject + 1-hr) vs. PP-3-day, days 3–5 (positive); PP-Inject vs. SD-Inject, days 12–32 (positive) (b).
Agriculture 12 01952 g004
Figure 5. Carbon dioxide (CO2-C) fluxes (mg m−2 h−1) for 2010 (a) and 2011 (b). Means differing among treatments within a sampling date are denoted as follows: ** p = 0.01; * p = 0.05; + p = 0.10.
Agriculture 12 01952 g005
Figure 6. Methane (CH4-C) fluxes (mg m−2 h−1) for 2010 (a) and 2011 (b).
Agriculture 12 01952 g006
Table 1. Manure application dates, nutrient measures, and application rates.
Manure Nutrient MeasuresApplication Rate
DateTimeSolidsTNNH4-NTNNH4-N
%g L−1kg ha−1
15-May-09Pre-Plant16.63.11.218574
23-June-09Sidedress11.95.42.4330143
10-May-10Pre-Plant23.931.118465
30-June-10Sidedress22.52.91.117670
26-May-11Pre-Plant13.01.80.711142
06-July-11Sidedress15.91.70.610439
Table 2. Monthly mean precipitation and temperatures. April 2009 precipitation and temperature were both unavailable due to a logger malfunction.
PrecipitationTemperature
Month20092010201130-Year Mean20092010201130-Year Mean
mm °C
April-267576-10.15.27.2
May99908110213.714.612.813.7
June9317210511818.218.618.318.9
July6328120710418.222.223.121.2
August1851126110918.921.820.920.1
September9228929916.813.814.115.4
October1576159755.410.410.18.7
May–October60594460560715.216.916.516.3
Table 3. Average air temperature, wind speed, and total precipitation during ammonia (NH3) sampling periods.
Average TemperatureAverage Wind SpeedTotal Precipitation
DateTime3 DaysFirst Day3 DaysFirst Day3 DaysFirst Day
°Cm s−1mm
15-May-09Pre-Plant10.516.03.003.583.63.05
23-June-09Sidedress26.030.70.390.5610.90.25
10-May-10Pre-Plant7.2012.23.974.067.90.25
30-June-10Sidedress21.422.20.030.310.00.00
26-May-11Pre-Plant12.413.21.531.008.10.00
6-July-11Sidedress23.125.60.060.180.30.00
Table 4. Cumulative and seasonal cumulative nitrous oxide (N2O) emissions.
Average20102011Average
CumulativePost-Plant Pre-Sidedress Post-SidedressPost-SidedressSummer/Fall
kg N ha−1
PP-Inject2.941.20 a 0.650.220.32 b0.39
PP-1-hr1.850.69 b0.620.130.41 b0.38
PP-3-day1.780.42 b0.670.170.22 b0.45
SD-Inject3.15..0.313.7 a0.96
SD-Surf1.91..0.450.7 b0.69
p-valueNS0.01NSNS0.01NS
PP2.19..0.17 b0.32 b0.40
SD2.53..0.38 a2.20 a0.83
p-valueNS..0.040.003NS
Treatment × YearNSNSNS<0.0001NS
Means with a different lowercase letter differ at p ≤ 0.10.
Publisher’s Note: MDPI stays neutral with regard to jurisdictional claims in published maps and institutional affiliations.

