Article

Effect of Mounting Angle on Bending Subsoiling Tool–Soil Interactions Using DEM Simulations

1
College of Agricultural Equipment Engineering, Henan University of Science and Technology, Luoyang 471000, China
2
Collaborative Innovation Center of Machinery Equipment Advanced Manufacturing of Henan Province, Luoyang 471000, China
*
Author to whom correspondence should be addressed.
Agriculture 2022, 12(11), 1830; https://doi.org/10.3390/agriculture12111830
Submission received: 30 September 2022 / Revised: 17 October 2022 / Accepted: 26 October 2022 / Published: 1 November 2022
(This article belongs to the Section Agricultural Technology)

Abstract

:
Mechanical subsoiling is an effective practice to promote better water infiltration and crop root development. The bending subsoiling tool (BST) is a primary subsoiling tool and is used to remove soil compaction and restore soil productivity. In this study, a discrete element model was developed and validated using laboratory soil bin tests to investigate the effects of the mounting angle of the BST (5°–33°) on soil disturbance behaviors and draft forces. The results show that the upheaval, failure and fragmentation of soil was achieved by successive shearing, uplifting, extrusion, tension and turning actions from the cutting share and cambered shank of the BST. Increasing soil depths gave smaller soil disturbance ranges in lateral, forward and upward directions. With an increase in mounting angle, both the draft force and soil rupture distance ratio initially decreased and then increased, whereas the soil loosening efficiency initially increased and then decreased. Overall, increasing the mounting angle of the BST from 5° to 33° gave a greater soil surface flatness that increased rapidly when the mounting angle increased from 26° to 33°. Appropriately increasing mounting angle of the BST from 5° to 26° could lift more moist soil from the deep seed and middle layers (5.0–15.5% increase) into the shallow seed layer (depth of <50 mm) without seriously affecting the mixing of the deep layer and other layers. Considering both the soil disturbance characteristics and draft forces, a mounting angle of 26° appeared to outperform the other angles.

1. Introduction

With the gradual improvement of mechanization level in agriculture, field soil is compacted during the working process of various heavy agricultural vehicles and equipment [1,2]. As a result, the fields in arid and semi-arid areas generally become “waterlogged fields” during the ample rainfall season and experience drought during the inadequate rainfall season, which results in unstable and low crop yields [3]. As one of the core technologies of conservation tillage, subsoiling practice has been employed to remove soil compaction and restore soil productivity [4,5,6,7,8]. Subsoiling technology mainly consists of natural, chemical, biological and mechanical methods [2,9]. Natural and biological methods need to go through a long-term process and crop production may be seriously affected as crop cultivation should be stopped. Effect of chemical subsoiling on crop growth is insignificant and additional fertilization may cause environmental pollution. Mechanical subsoiling is an effective method to solve the soil compaction problem. A good subsoiling tool would lift moist soil of the top layer into the seed zone and reduce the mixing between infertile (deep) layer soil and top layer soil in addition to having a high soil loosening efficiency. The bending subsoiling tool (BST) is a primary subsoiling tool, and the understanding of soil–tool interaction is critical for improving the design of BSTs for conservation tillage.
The discrete element method (DEM) was used in this study to deal with discontinuous soil particles. In the DEM, interactions between the particles are calculated using contact models and governed by physical laws [10]. After calculating all the forces acting upon a particle, its position and orientation are calculated by integrating Newton’s second law of motion [11]. Hang et al. [12] found that the tine spacing of subsoiling tools had an important effect on the soil disturbance profile and soil velocities at various depths. Ding et al. [13] investigated the effect of working depth on a subsoiling tool performance under near quasi-static conditions using DEM modelling. Huang et al. [14] proposed a subsoiler model using the DEM that was able to predict the soil movement with a relative error of <20%. Tanaka et al. [15] simulated the soil loosening process caused by a vibrating subsoiler based on the DEM. The above studies showed that the DEM is an advanced and effective approach for simulating soil–subsoiling tool interactions. However, the previous literature has mainly focused on soil disturbance and cutting force predictions of simple subsoiling tools (e.g., the arc-shaped subsoiling tool). By contrast, the structure of the bending subsoiling tool (BST) is much more complicated (e.g., cambered shank). The effects of the mounting angle of BSTs on soil displacements at various depths and resultant soil surface conditions, soil layer mixing and soil loosening efficiency, which are the prerequisite for designing high-performance BSTs, are absent in previous DEM studies.
The specific objectives of this study were to: (1) develop a soil–BST interaction model using EDEM (Experts in Discrete Element Modeling) (DEM Solutions Ltd. Edinburgh, Scotland, UK) and validate the model using laboratory soil bin tests, and (2) investigate the effects of the mounting angle on soil disturbance behaviors (e.g., soil movement and soil layer mixing) and draft forces of bending subsoiling tool.

2. Materials and Methods

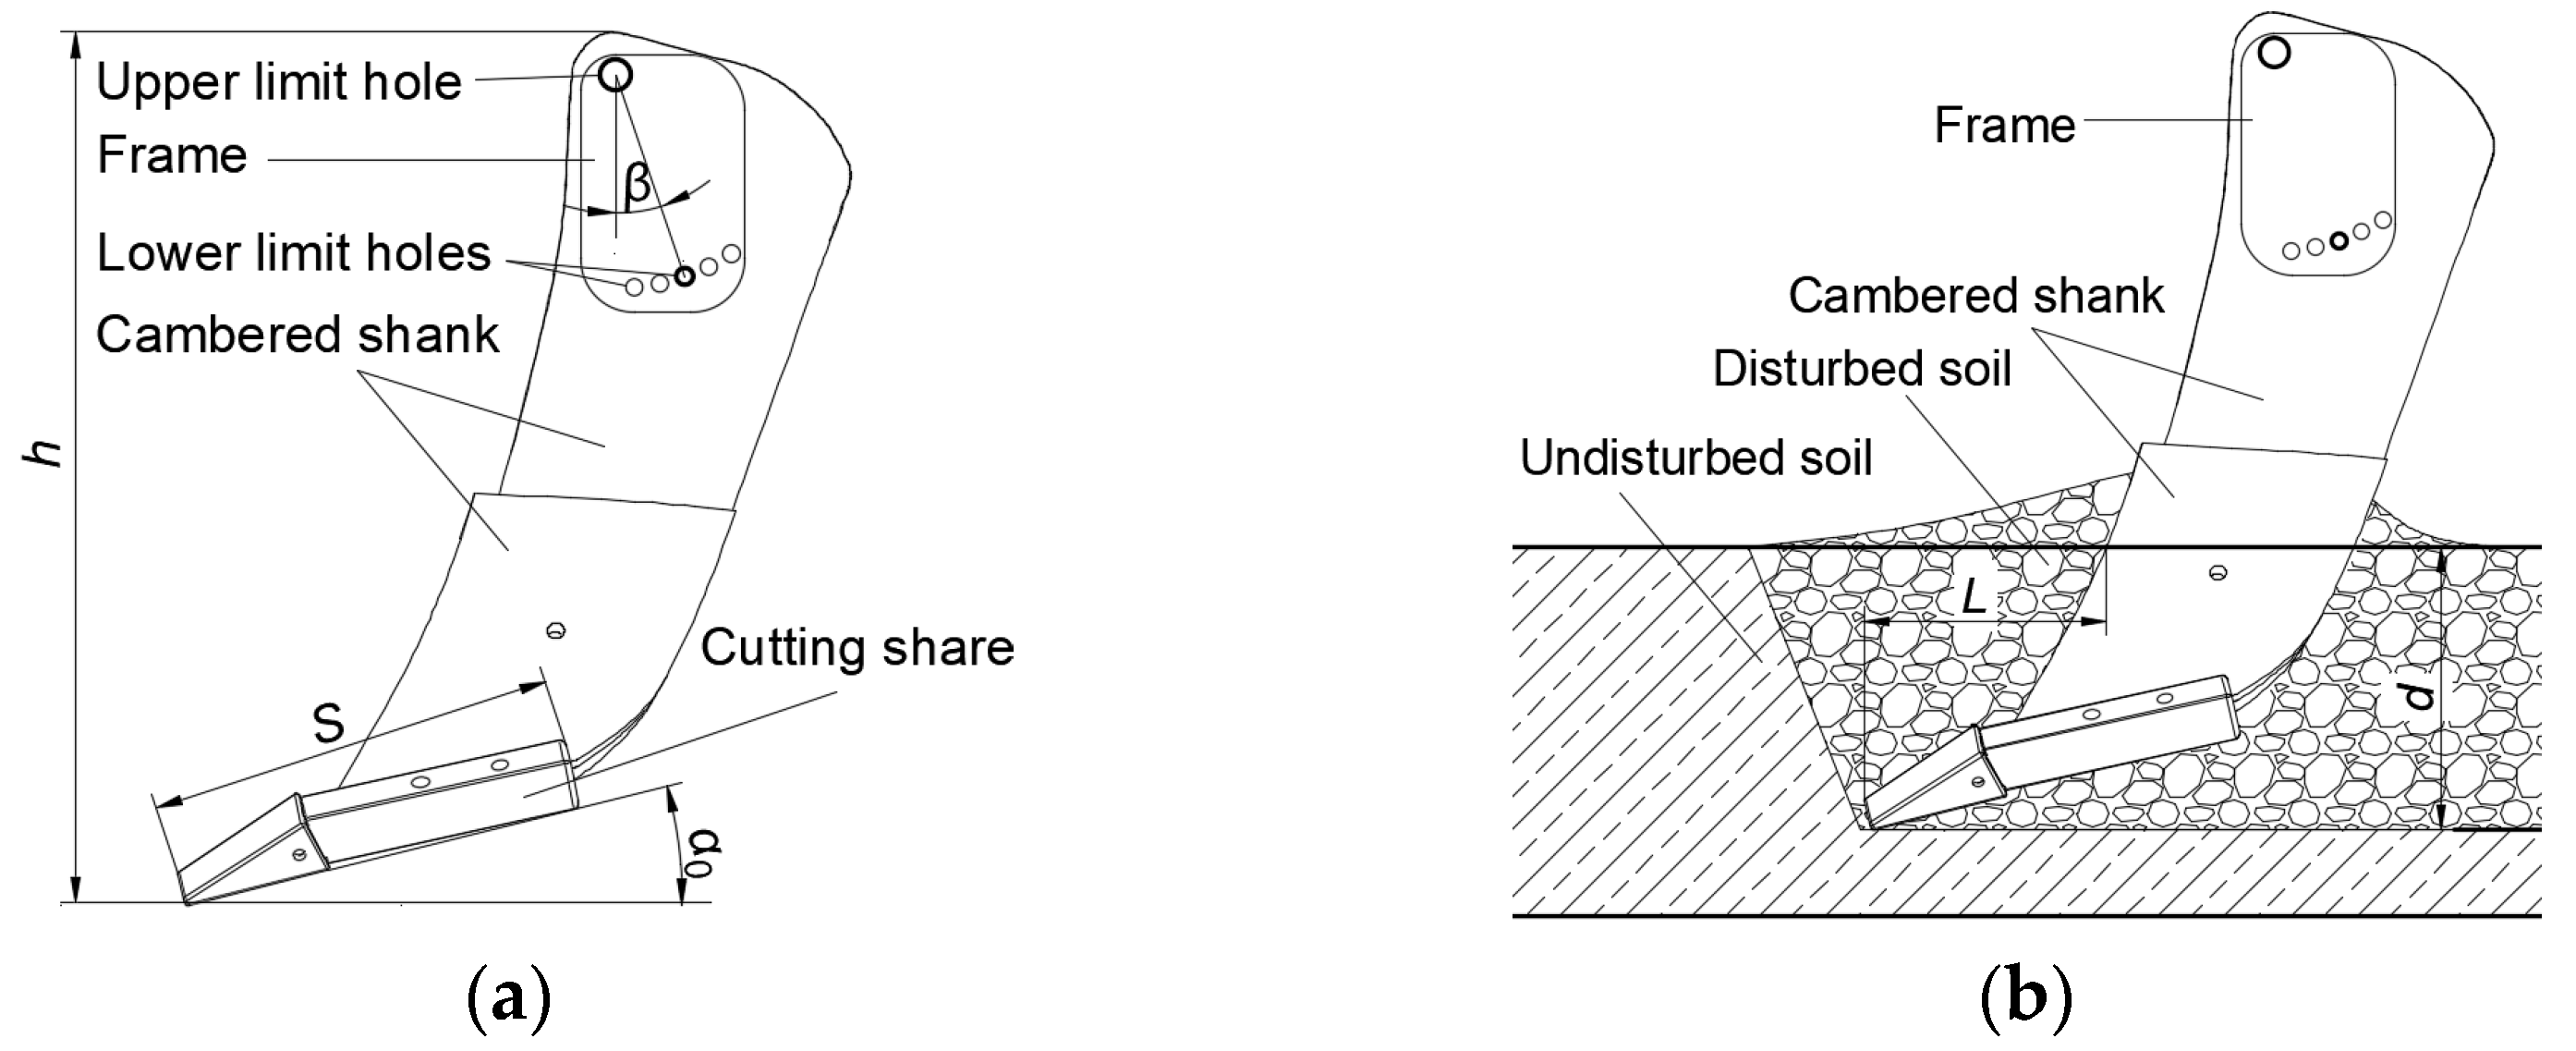
2.1. Description of the Subsoiling Tools

The bending subsoiling tool (BST) tested mainly consists of a cutting share and a cambered shank (Figure 1a). The length of the cutting share (S) is 413 mm. The cambered shank was connected via the frame and the mounting angle (β) of the BST was defined as the angle between the oblique connection line (between the upper and lower limit holes) and the vertical line. For a given working depth (d), increasing β leads to smaller longitudinal length (L)/working depth (d) ratio (Figure 1b). Previous researchers have demonstrated that the good tillage performance of subsoiling tools was associated with an L/d ratio of 0.6–1.2 [16]. A working depth of 300 mm was determined for the subsoiling tool in accordance with both the national standard (GB/T 24675.2—2009) and the local working depth of subsoiling tools [12,14]. Thus, with a d of 300 mm, the mounting angles used were 5°, 12°, 19°, 26° and 33°.

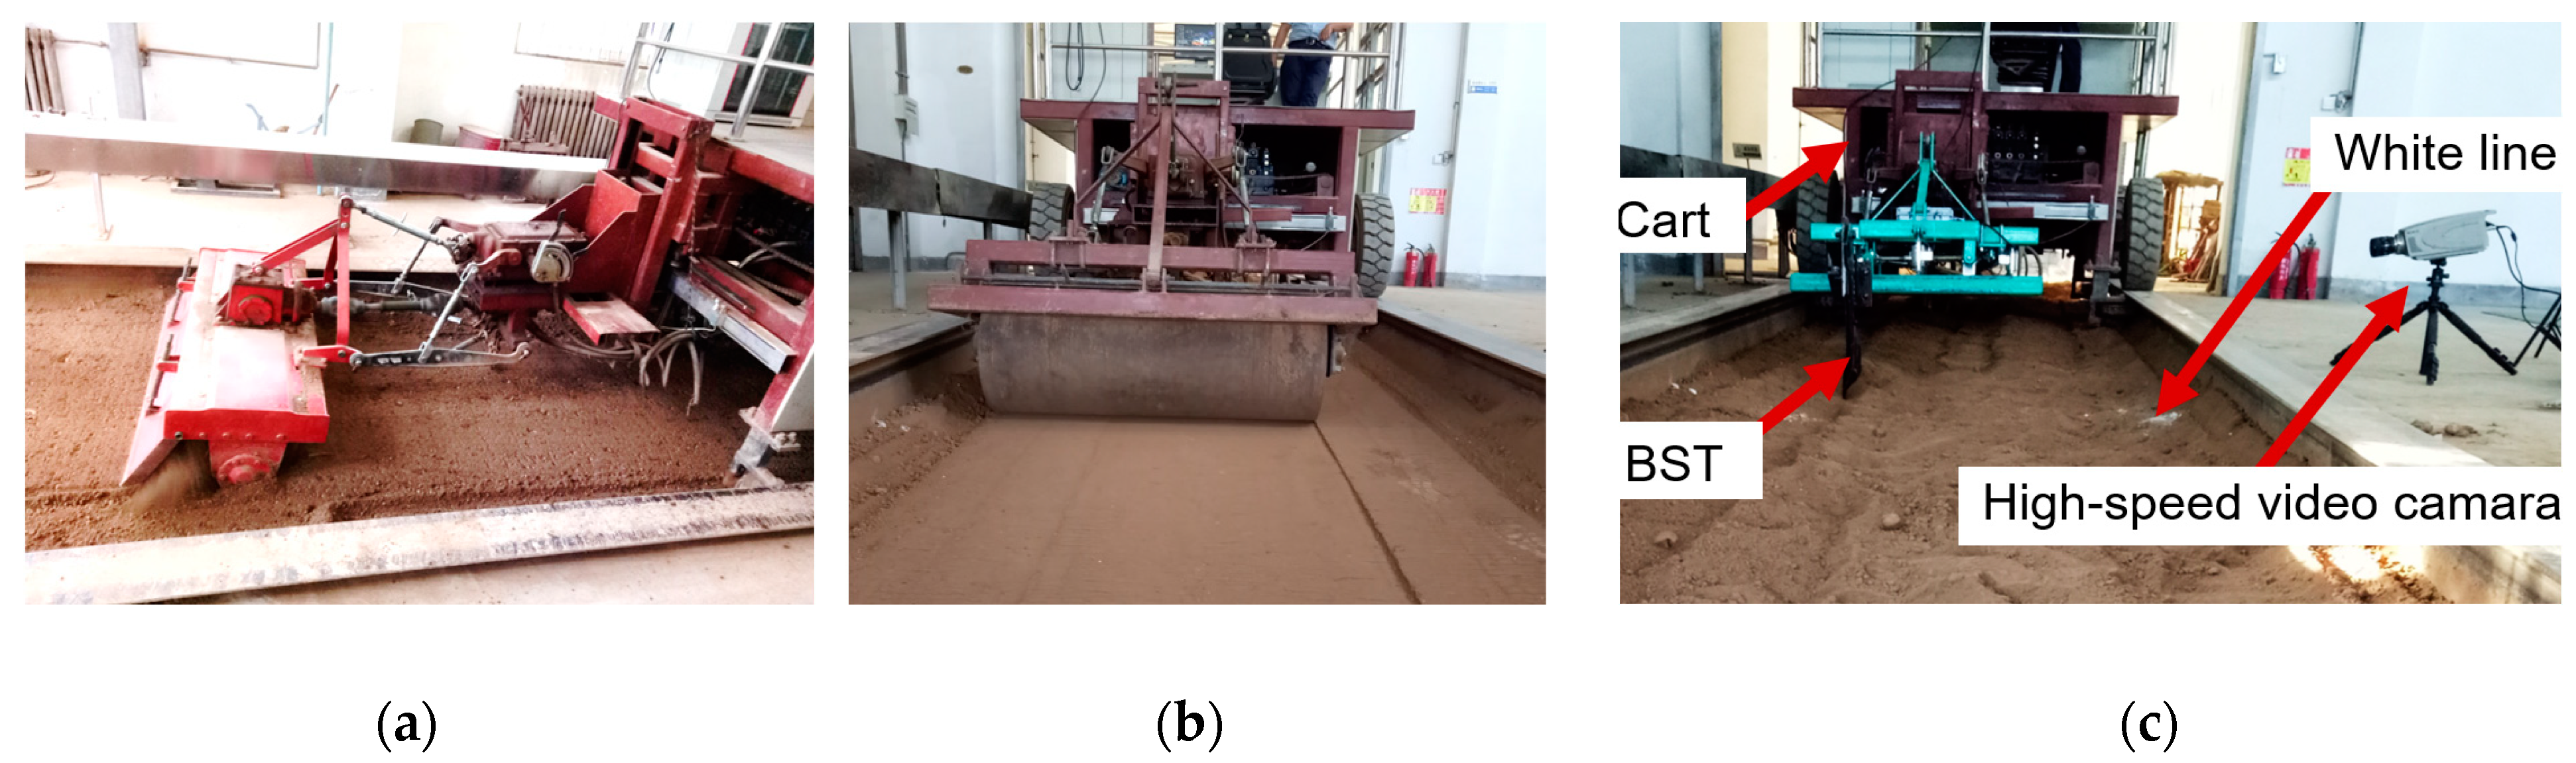
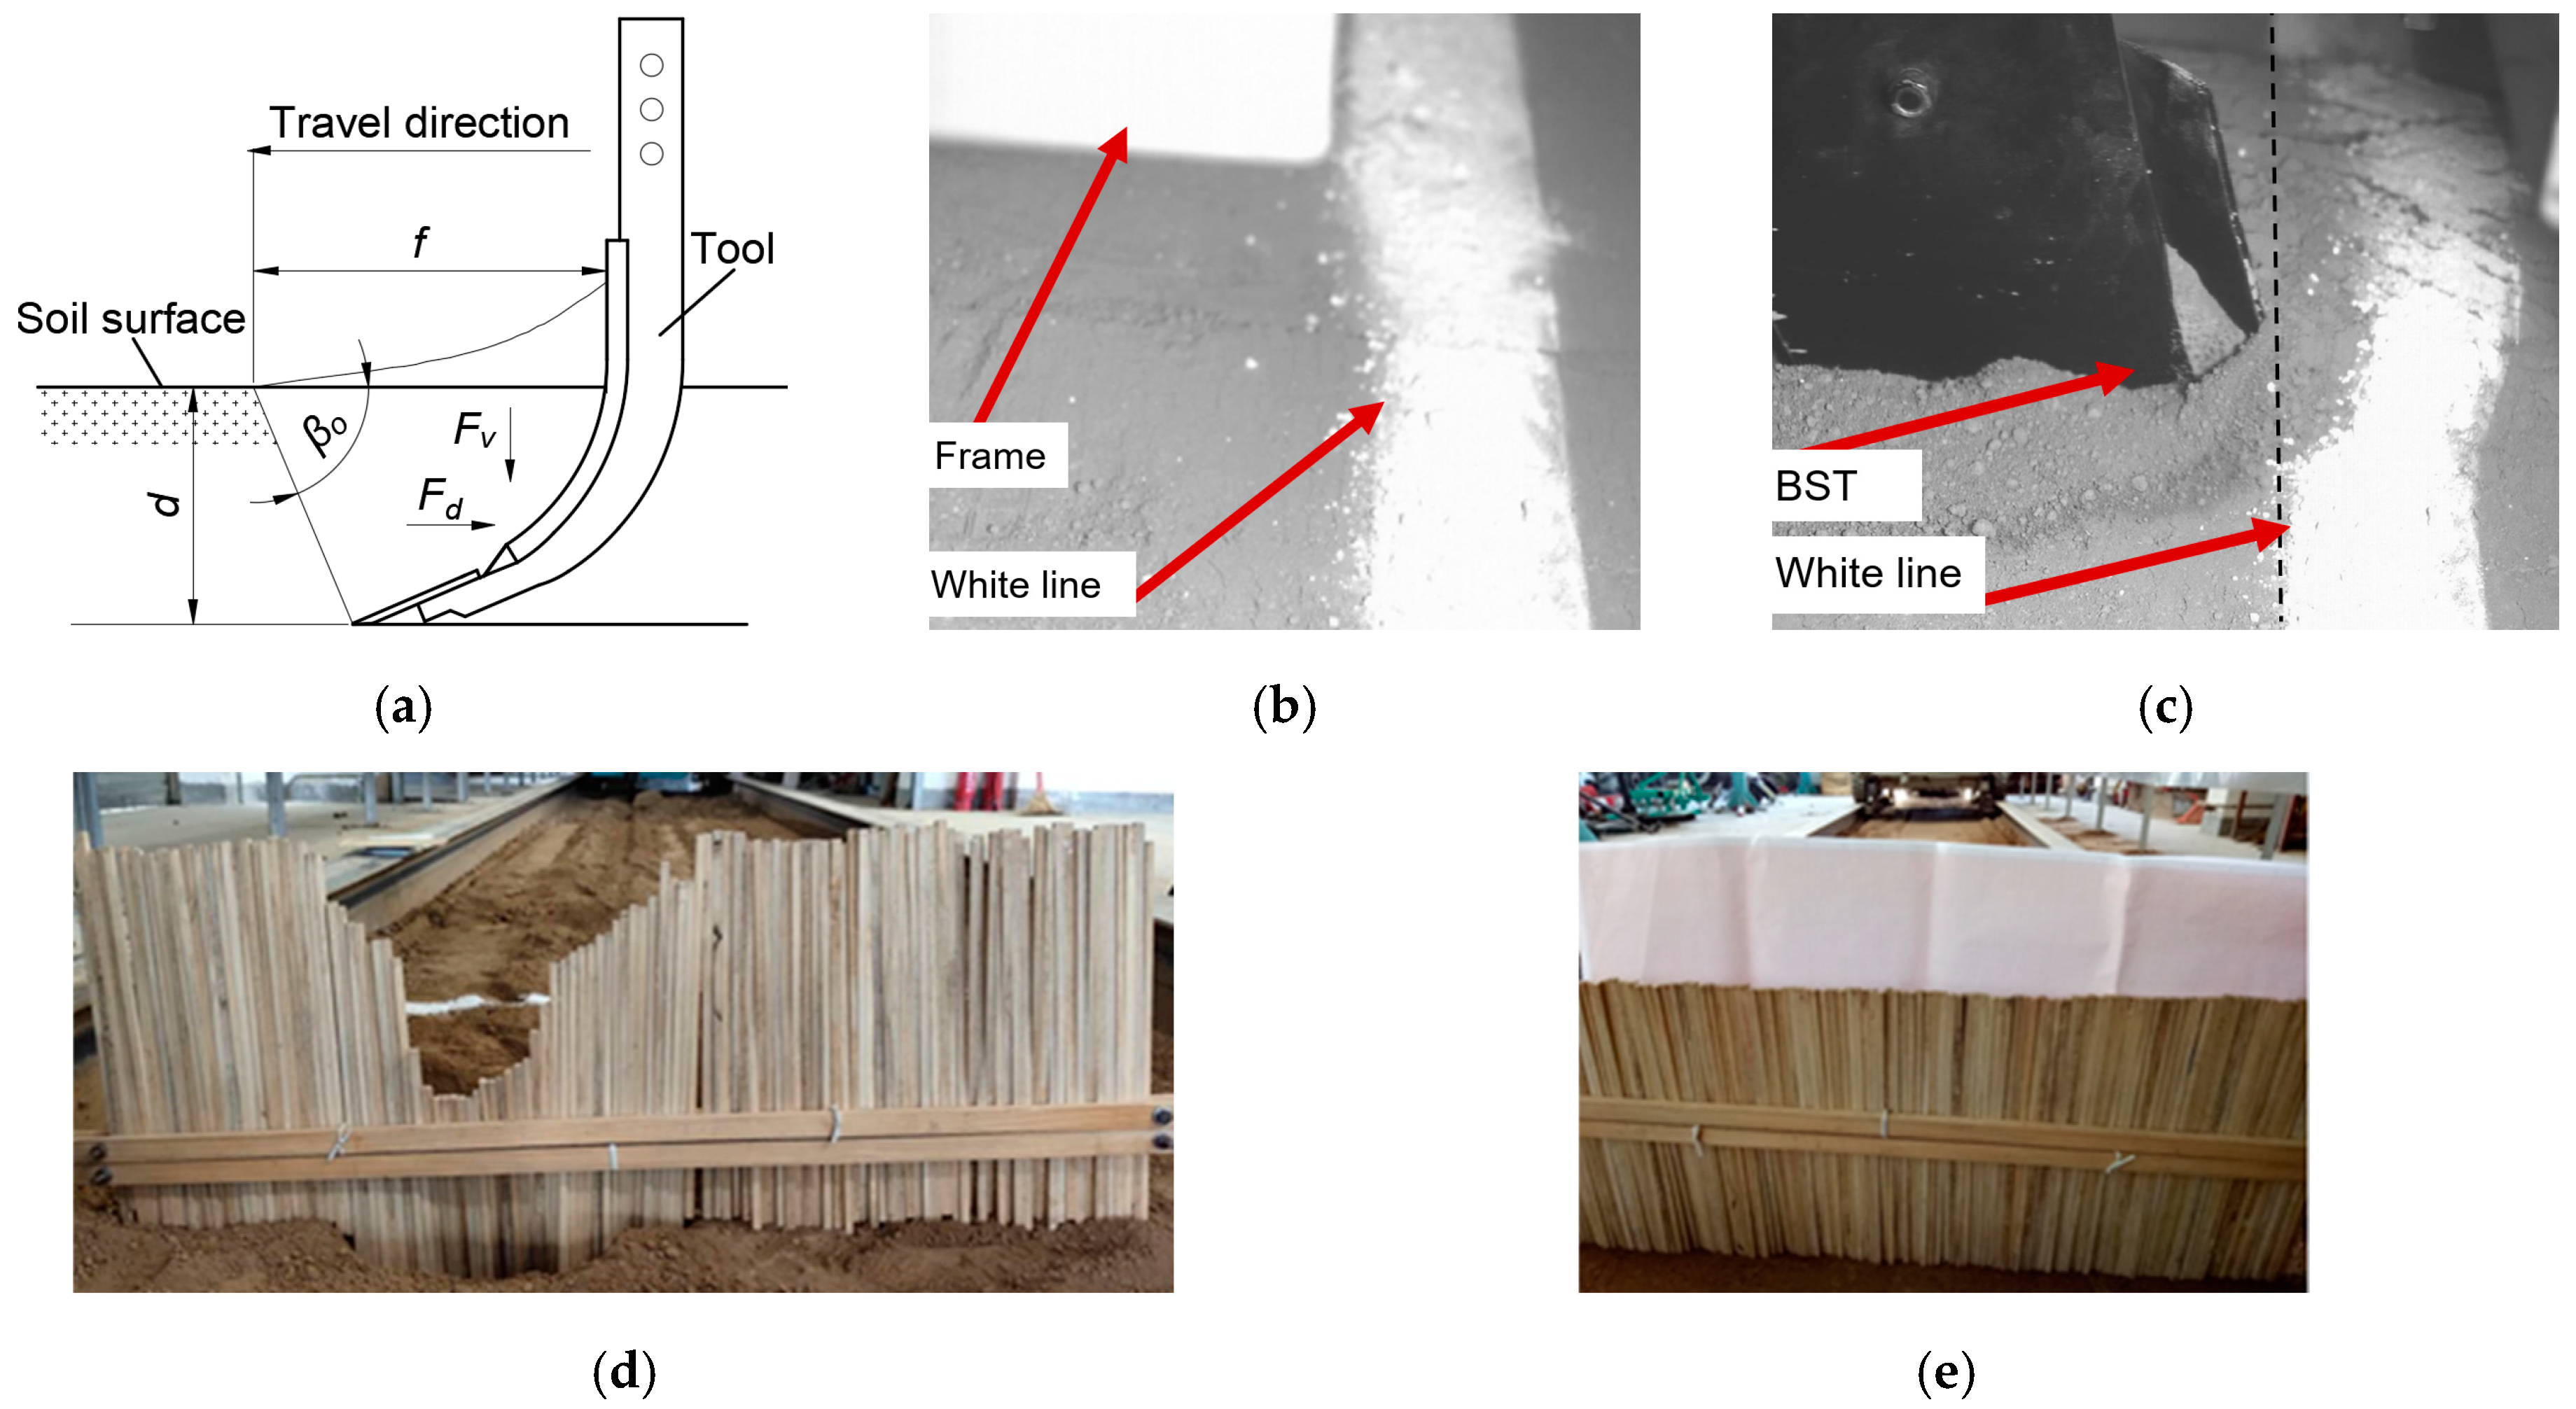
2.2. Laboratory Soil Bin Test

The subsoiling test was performed in the laboratory soil bin. Before the subsoiling test, soil was prepared by water spraying, rotary tillage and compaction in succession (Figure 2a,b). The density and moisture content of the prepared soil was 1443 kg m−3 and 12.2%, respectively. After soil preparation, the subsoiling tool and its supporting frame were connected to a TCC electric soil-bin cart with a four-wheel drive (Autobona Inc., Harbin, China) (Figure 2c). The BST is a new type of high-speed (>5 km/h) subsoiling tool matching with medium or large tractors [17,18,19]. However, the local working speed of subsoiling tools is generally not higher than 5.5 km·h−1 in accordance with Hang et al. [20] and Li [21]. Therefore, a relatively lower working speed of 5.5 km·h−1 was determined, i.e., the BST was run at a working speed of 5.5 km·h−1 and a working depth of 300 mm. The draft force during subsoiling was monitored using force sensors placed on the three-point hitch (accuracy: ±0.01 N).
Soil rupture distance ratio (mr) can be used to characterize the soil longitudinal structural failure and it was defined as follows:
m r = f d
where f and d are the soil rupture distance and working depth of the BST, respectively (Figure 3a). Soil rupture distance was calculated in accordance with working speed of the subsoiling tool (5.5 km·h−1) and the time interval between the moment when soil particles in the white line began to move and the moment when the tool arrived at the white line (Figure 3b,c). Working depth was measured by a steel ruler according to the distance between the soil surface and the bottom of the subsoiling trench. Soil distance area and soil surface flatness were measured using a profile meter that consisted of 1500 free-dropping wooden pins (10 mm wide) (Figure 3d,e). The specific measuring process can be found in previous studies [10,12]. To ensure the stability of the test data, the travel distance with a constant working speed was used for measurements.

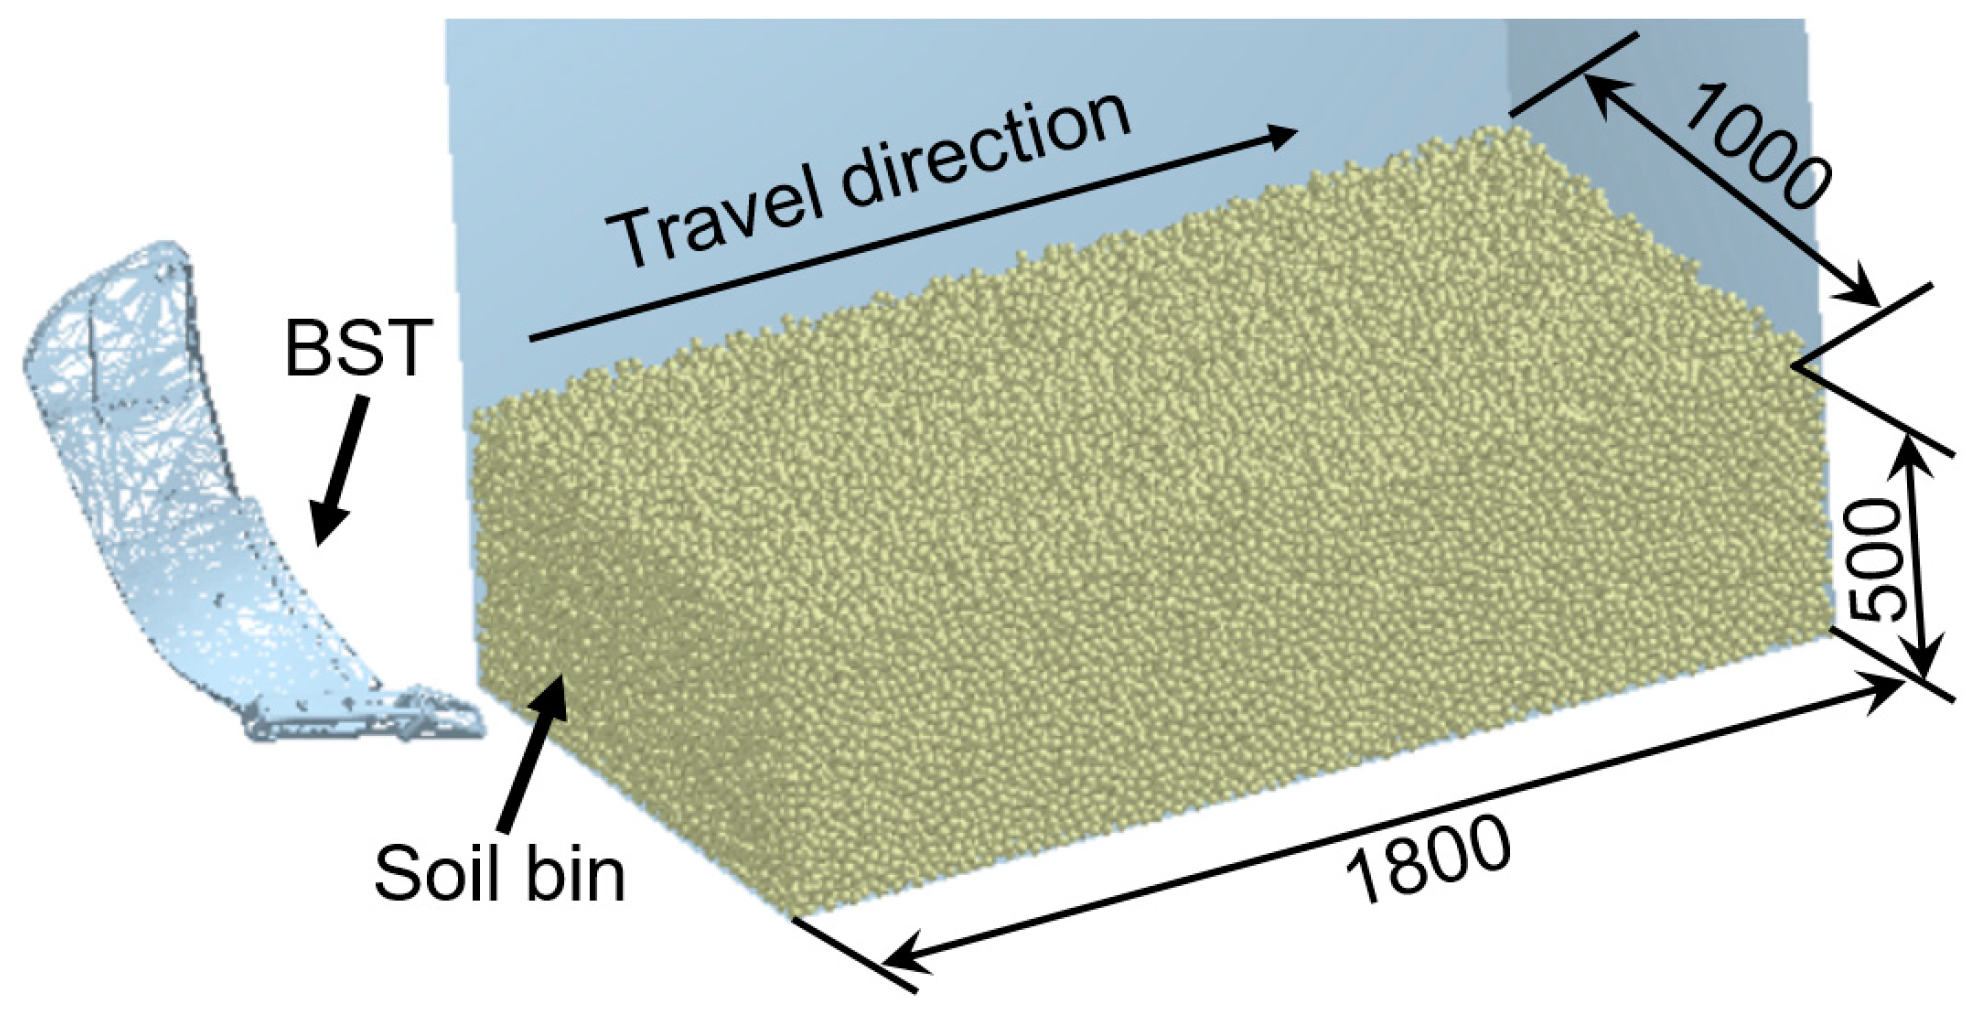
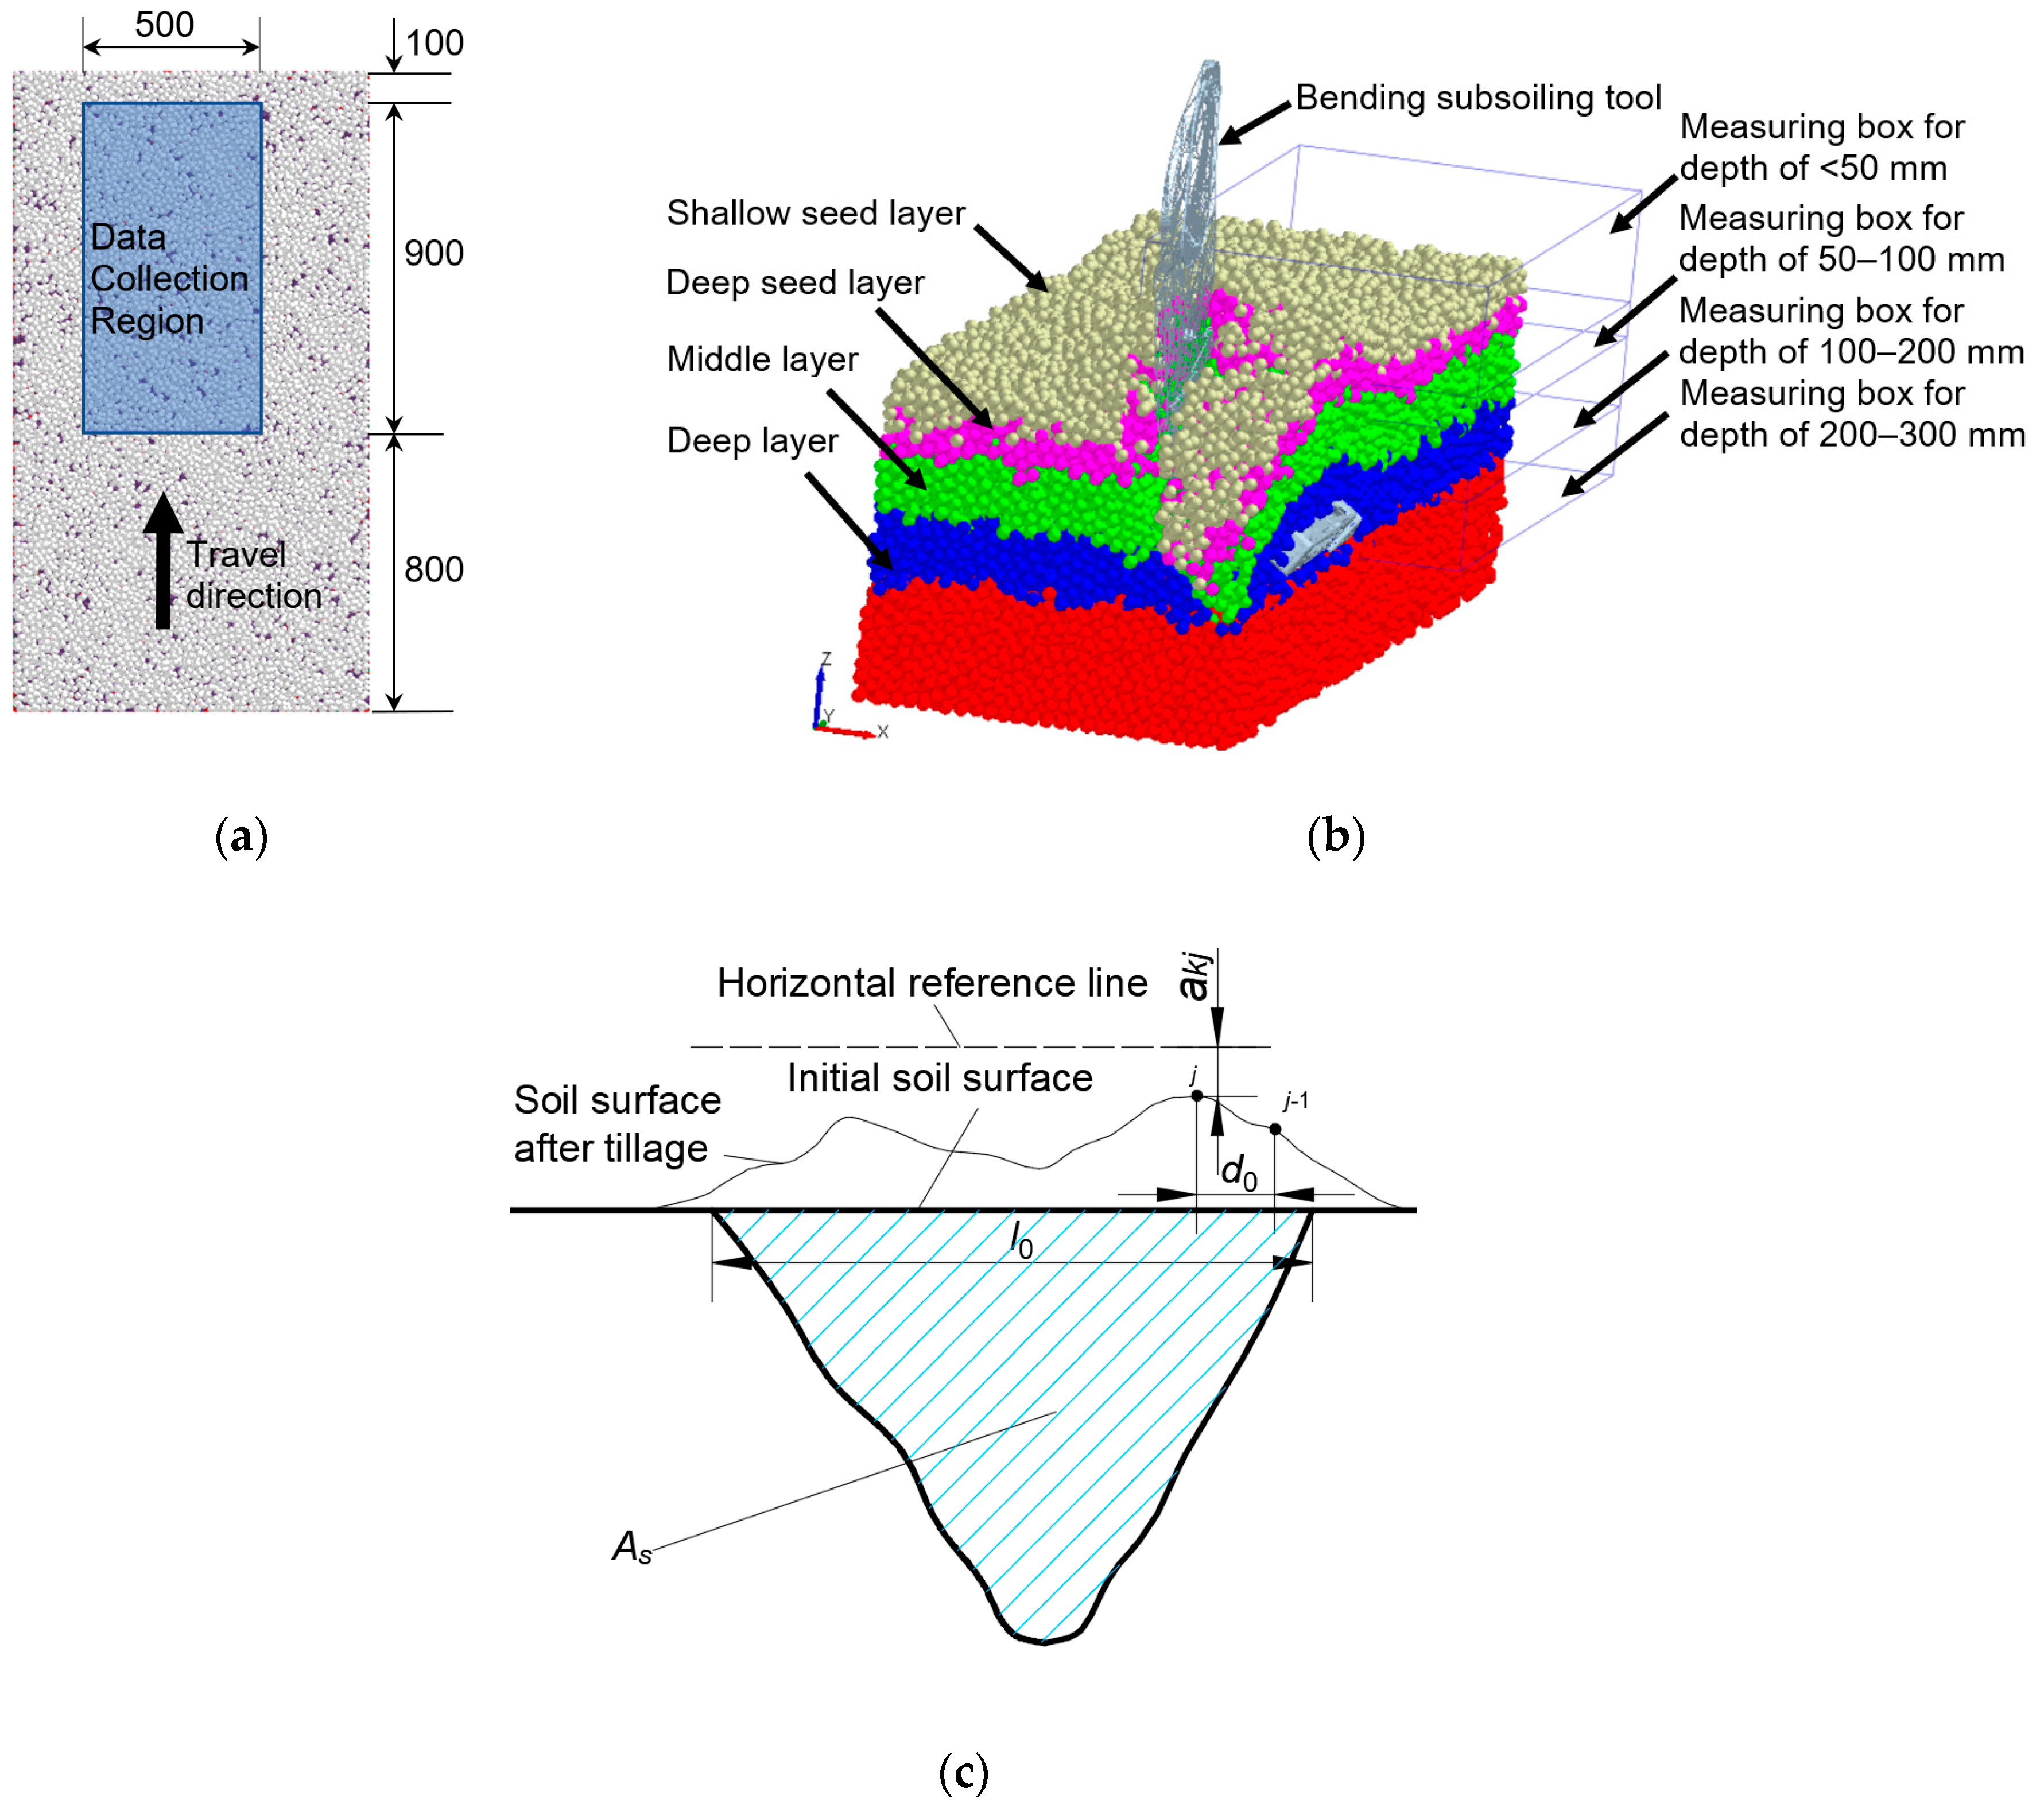
2.3. EDEM Simulations

The DEM parameters in the EDEM model mainly include material parameters and interaction parameters. Material parameters were defined as the intrinsic characteristics of soil particles, e.g., density, shape, size distribution, Poisson’s ratio and yield strength. The dimensions of the virtual soil bin in the EDEM model were 1.8 m long, 1 m wide and 0.5 m deep to allow for the tool to reach its stable conditions in terms of draft forces and avoid the edge effect of bin walls on soil particle flows during tillage. Spherical particles with radii ranging from 9.5 mm to 10.5 mm were randomly generated from a dynamic factory to realize realistic soil packing and movement [11,22,23]. The soil surface was then pushed down to a certain depth in the virtual soil bin using a rigid plate to achieve the bulk density of the tested soil. The density of the steel, Poisson’s ratio and the yield strength of the soil and steel were determined in accordance with existing studies [24,25] (Table 1). The contact model between soil particles and the tool was Hertz–Mindlin (no slip). The interaction model between soil particles was a linear cohesion model integrated into a hysteretic spring contact model that has been used in many DEM studies [24,26]. The interaction properties are characteristics exhibited by the particle in contact with boundaries, surfaces, and other (or similar) particles, including energy density and coefficients of restitution and coefficients of static and rolling friction, which were obtained by a combination of measurements (incline plane test) and searches of the literature [24,25]. The 3D model of the tool was constructed using CATIA software and it was then imported into the EDEM model. The working speed and working depth of the tool model were 5.5 km·h−1 and 300 mm, respectively, in accordance with laboratory soil bin tests (Figure 4).
For a given soil layer, the soil layer mixing was quantified by the mass ratio of the mass of soil particles that moved to various depths after tillage to the total particle mass of the original soil layer in the data collection region. The mass of the particles that moved to various depths was measured using various measuring boxes, as shown in Figure 5a. The data collection region is shown in Figure 5b. The width of the region (500 mm) was determined by the soil disturbance width of the BST; the first 800 mm in length was used to ensure soil throw reached equilibrium conditions; the last 100 mm length was used to eliminate any end effects as the tool left the bin. The effects of the mounting angle on the degree of soil layer mixing were then analyzed.
The soil disturbance area (As) was determined based on the existing method [25], i.e., the simulated furrow profile was obtained by connecting the boundary of disturbed soil of different layers. The soil ridge profile and resultant surface flatness were calculated from the coordinates of surface particles after subsoiling. The surface flatness was calculated as [26]:
a k = j = 1 n k a k j n k S k = j = 1 n k ( a k j a k ) 2 n k 1      
where ak is the average vertical distance from the measured points on the soil surface after tillage to the horizontal reference line in the k-th measurement (k = 1, 2, 3, 4, 5) (mm); akj is the vertical distance from the j-th measured point of the soil surface after tillage to horizontal reference line in the k-th measurement (mm) (Figure 5c); nk is the number of measured points in the k-th measurement where the value depends on the width of soil ridge formed after tillage and the spacing between two adjacent points d0. Here d` is 20 mm; jnk; Sk is the soil surface flatness in the k-th measurement (mm).

3. Results and Discussion

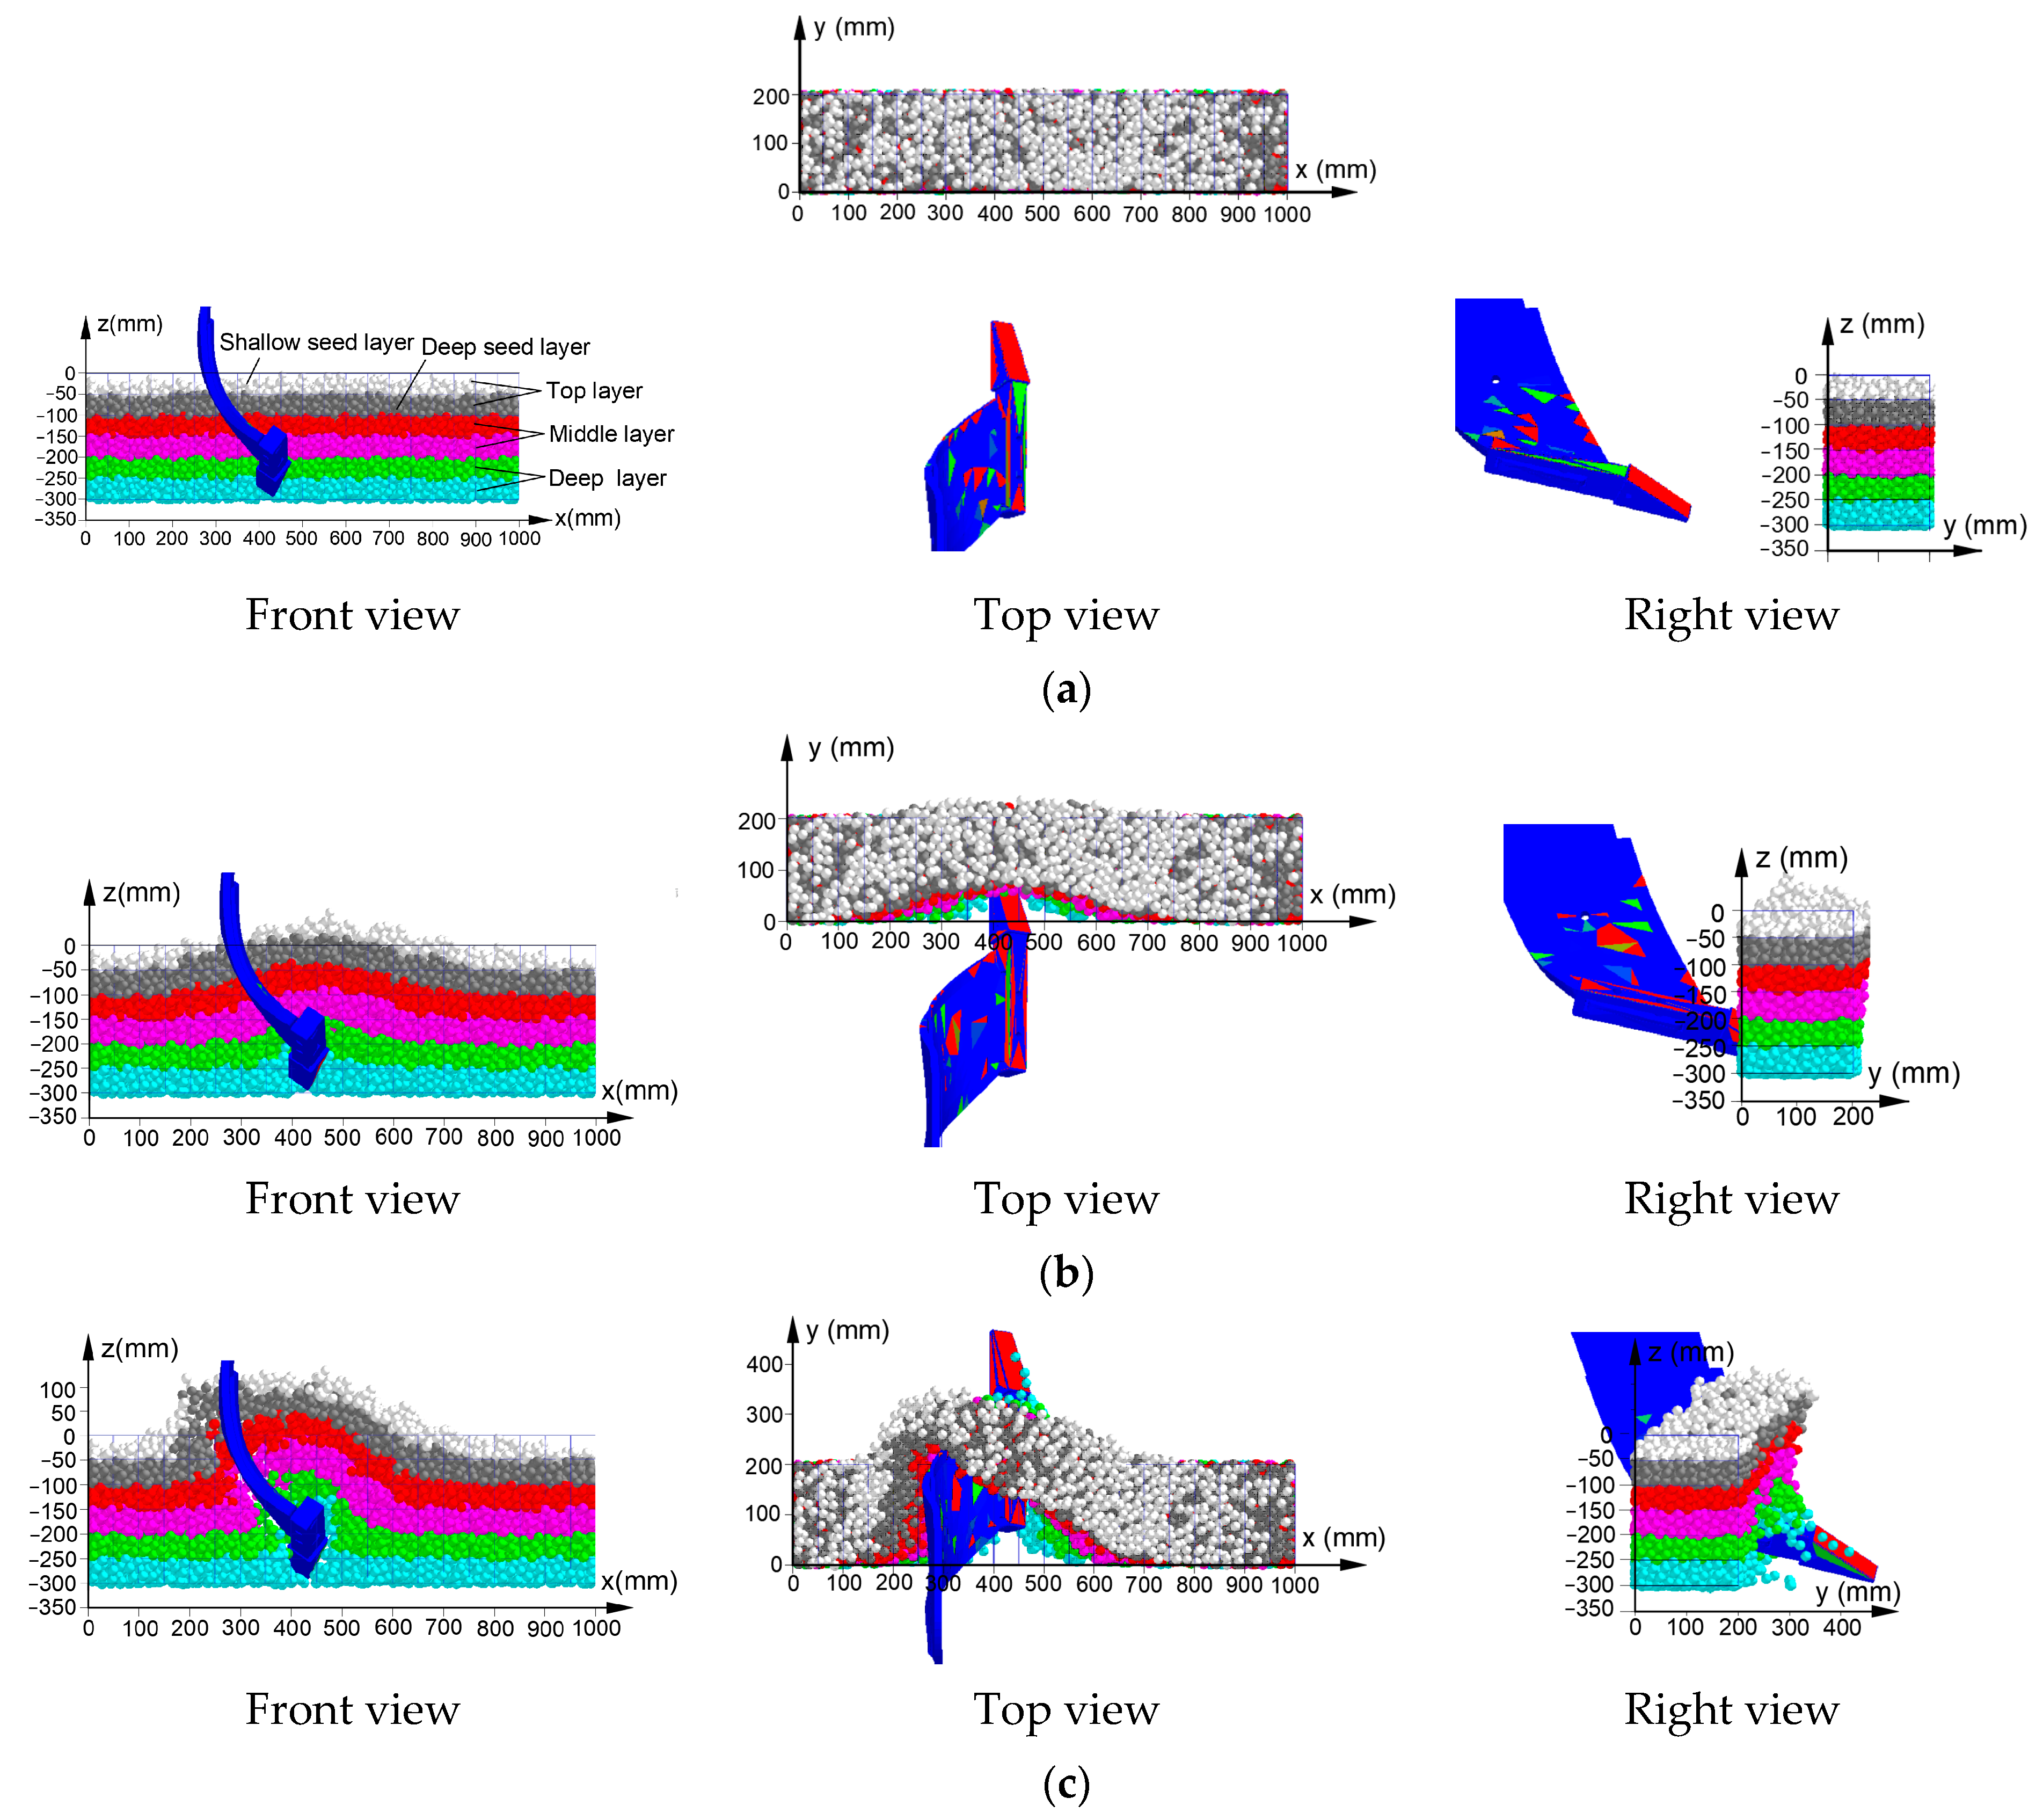
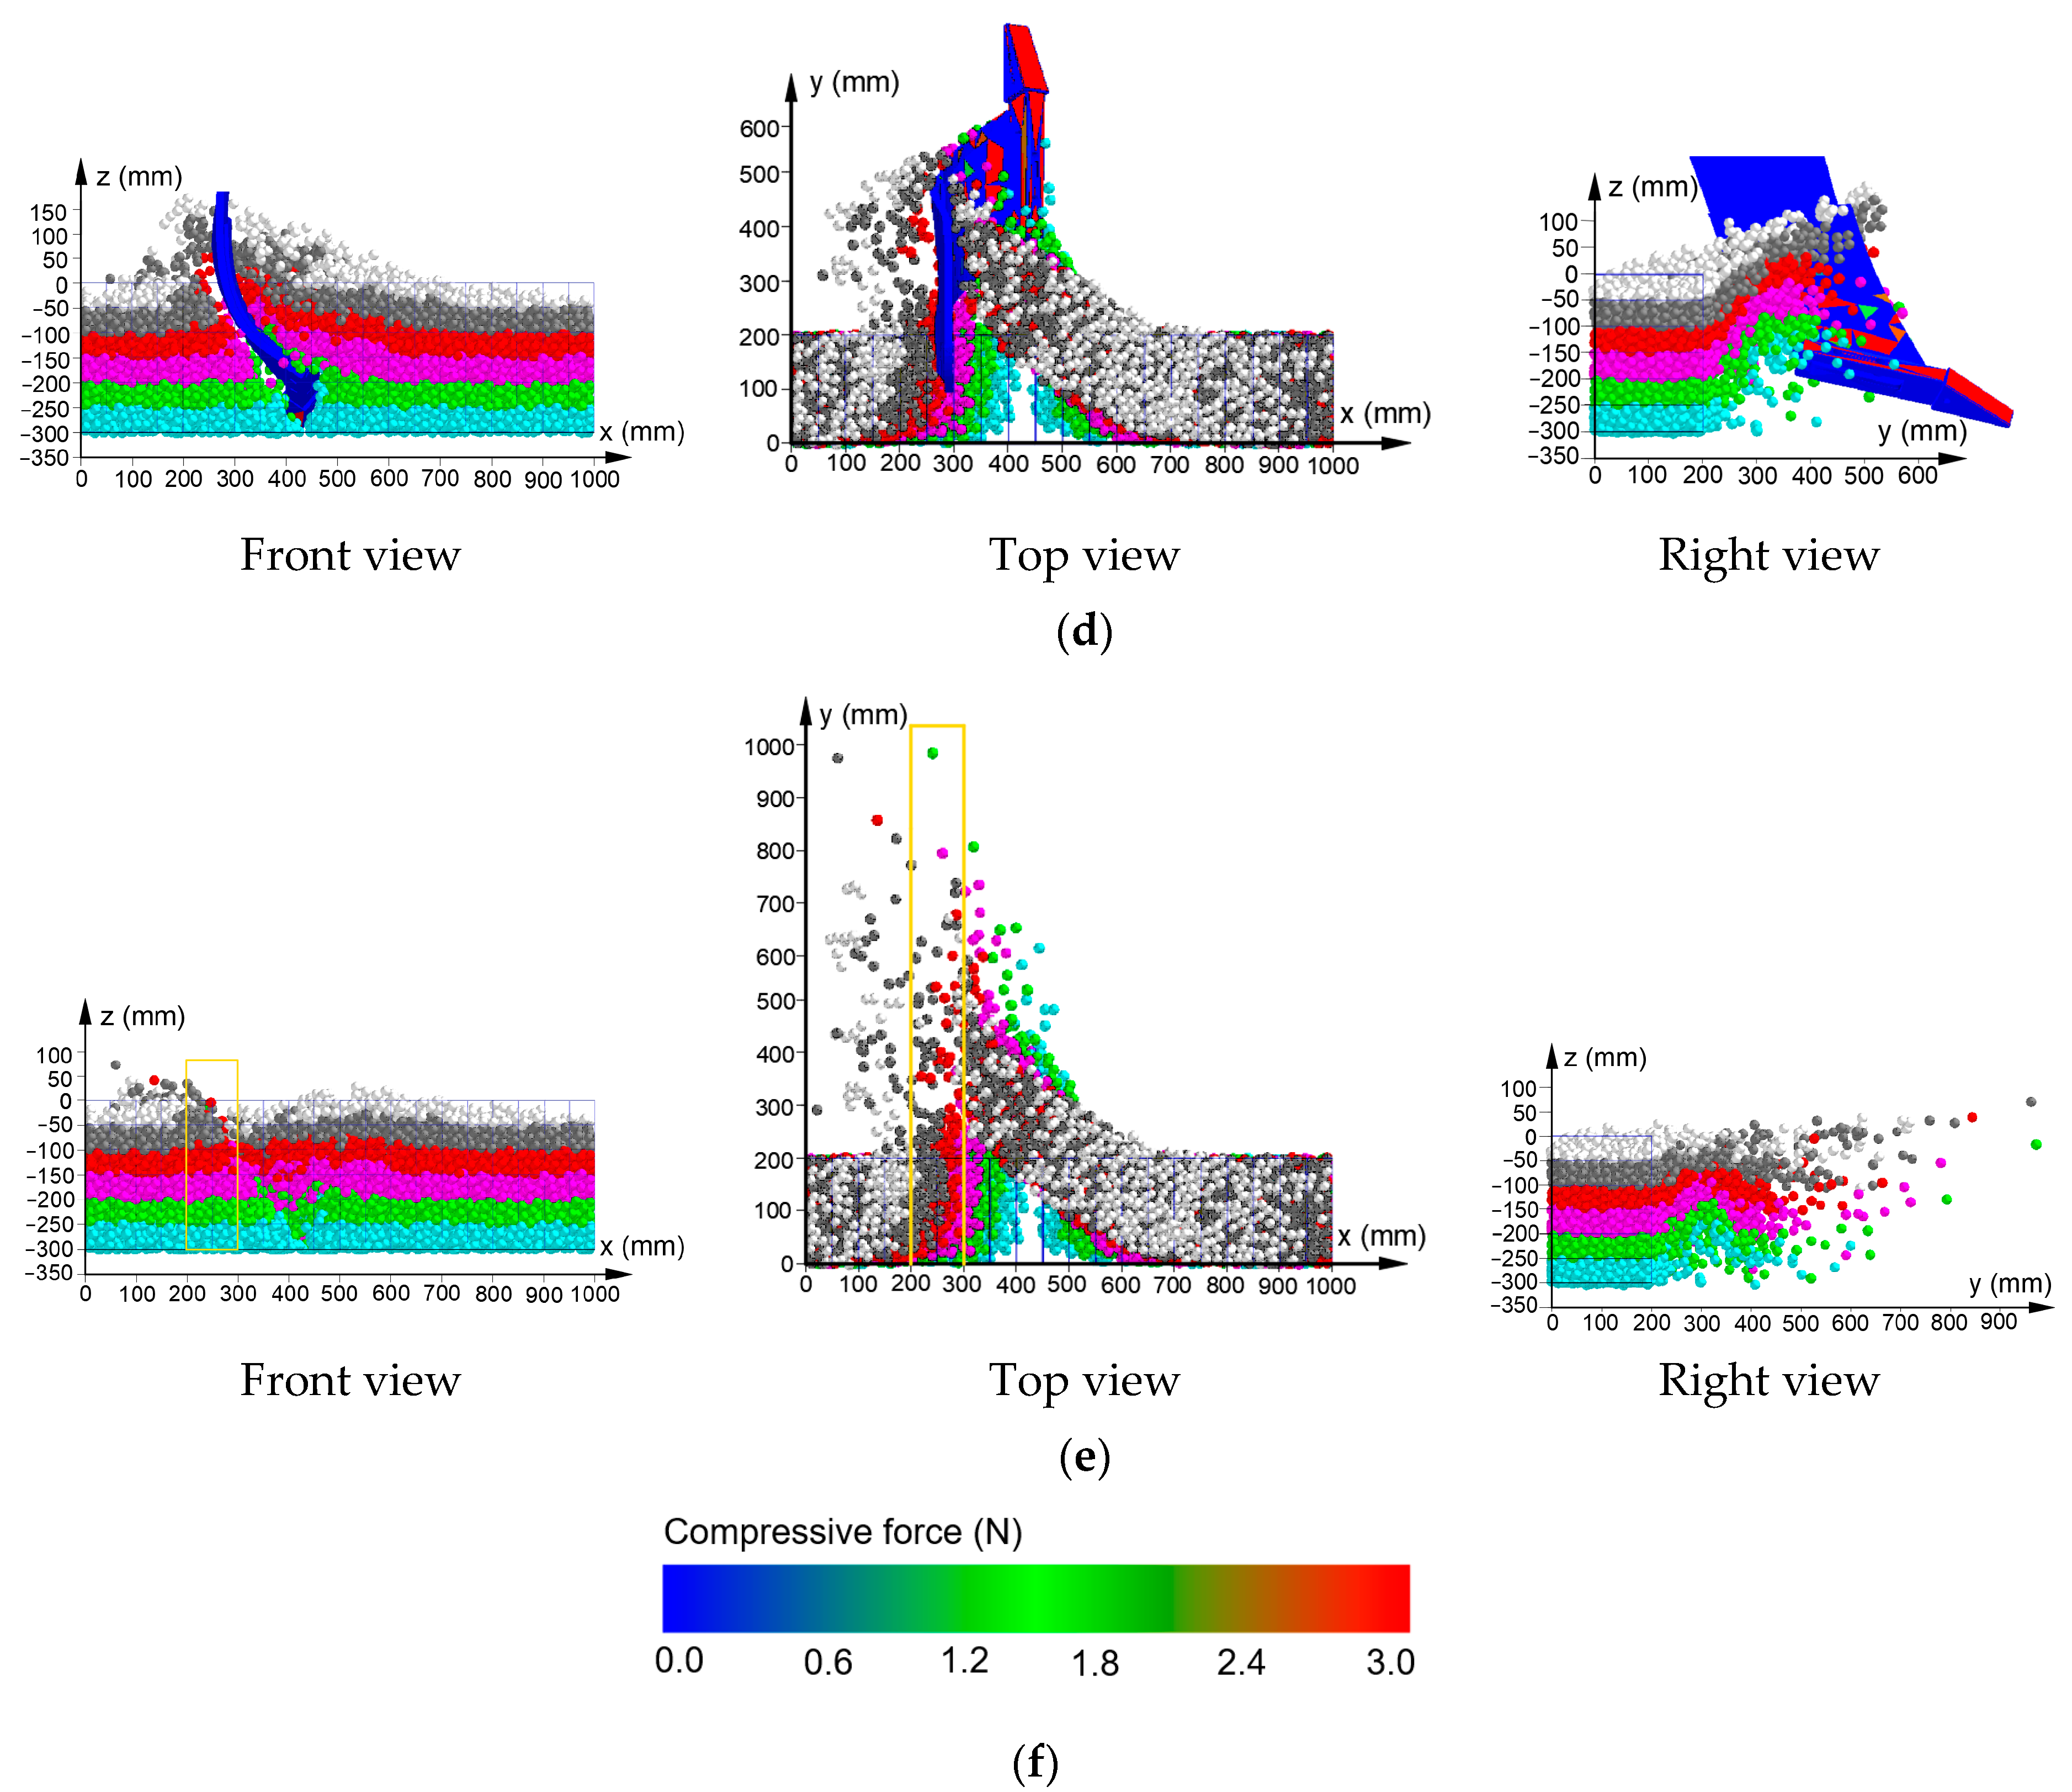
3.1. Soil–Bending Subsoiling Tool (BST) Interaction Analysis

In the “Analyst” section of the EDEM software, soil within the working depth (300 mm) was divided into four layers: the shallow seed layer (0–50 mm), deep seed layer (50–100 mm), middle layer (100–200 mm) and deep layer (200–300 mm). We selected 200 mm-thick soil particles in the midsection of the virtual soil bin, which corresponded to the stable subsoiling process and other particles were hidden. The selected particles from the surface to the bottom of the subsoiling trench were then marked using different colors (Figure 6a). The effects of the bending subsoiling tool (BST) on particle movement in various directions was investigated using three views (front, right and top) in different subsoiling periods (Figure 6).
Figure 6 demonstrates how soil particles at various layers were disturbed by the BST in different periods. At time t1 (3.92 s), it was found that the compressive force of particles acting on the BST was mainly distributed at the cutting share and the cutting edge of the cambered shank (red area) before the BST contacted the selected soil. At time t2 (4.16 s), the cutting share of the BST began to enter the selected soil and soil particles in the disturbed area moved laterally and upward (Figure 6b). The disturbed soil movement had some features: (1) the disturbance area at the left of the cambered shank was much smaller than that at the right, and (2) the vertical (i.e., z direction) and forward (i.e., y direction) displacements were reduced for particles from the shallow seed layer to the deep layer. These features indicated that the BST had a greater impact on the shallower particles and the particles at the right of cambered shank. At time t3 (4.4 s), the cutting share started to leave the selected soil zone (Figure 6c). Moreover, the disturbed soil failed due to the combined effects of the shear and tensile forces of the cambered shank. The soil disturbance range in three directions (i.e., x, y, z) decreased with the increase in depth. At time t4 (4.6 s) (Figure 6d), the continuous forward and upward movements of disturbed soil particles under the tensile force of the BST further improved the soil fragmentation degree. More shallow particles (e.g., top layer and middle layer) were found at positions with relatively large forward distances from the original selected particles; this indicated that soil particles in the disturbance area were forced by vertically uneven extrusion forces from front soil in addition to the action of the BST during tillage, which could explain the lesser disturbance in deeper soil at 4.16 s. At time t5 (5.2 s), the BST left the selected particles and the disturbed soil particles then backfilled into the furrow (Figure 6e).
The forward displacement of soil particles at various layers ranged from 0 to 1000 mm and most displacements were smaller than 800 mm. The previous shallow seed layer particles in the center of tillage path were thrown onto the two sides of the BST and the area between x1 at 200 mm and x2 at 300 mm (i.e., yellow rectangular) was filled with particles from the previous deeper layers (Figure 6e). This indicated that moister surface soil in the yellow rectangular region after tillage was separated from previous drier surface soil, which was favorable for subsequent seeding operations.
The above analysis shows that the upheaval, failure and fragmentation of soil were achieved by successive shearing, uplifting, extrusion, tension and turning actions from the cutting share and cambered shank of the BST. The soil disturbance range in three directions (i.e., lateral, forward and upward) was decreased with increasing soil depths.

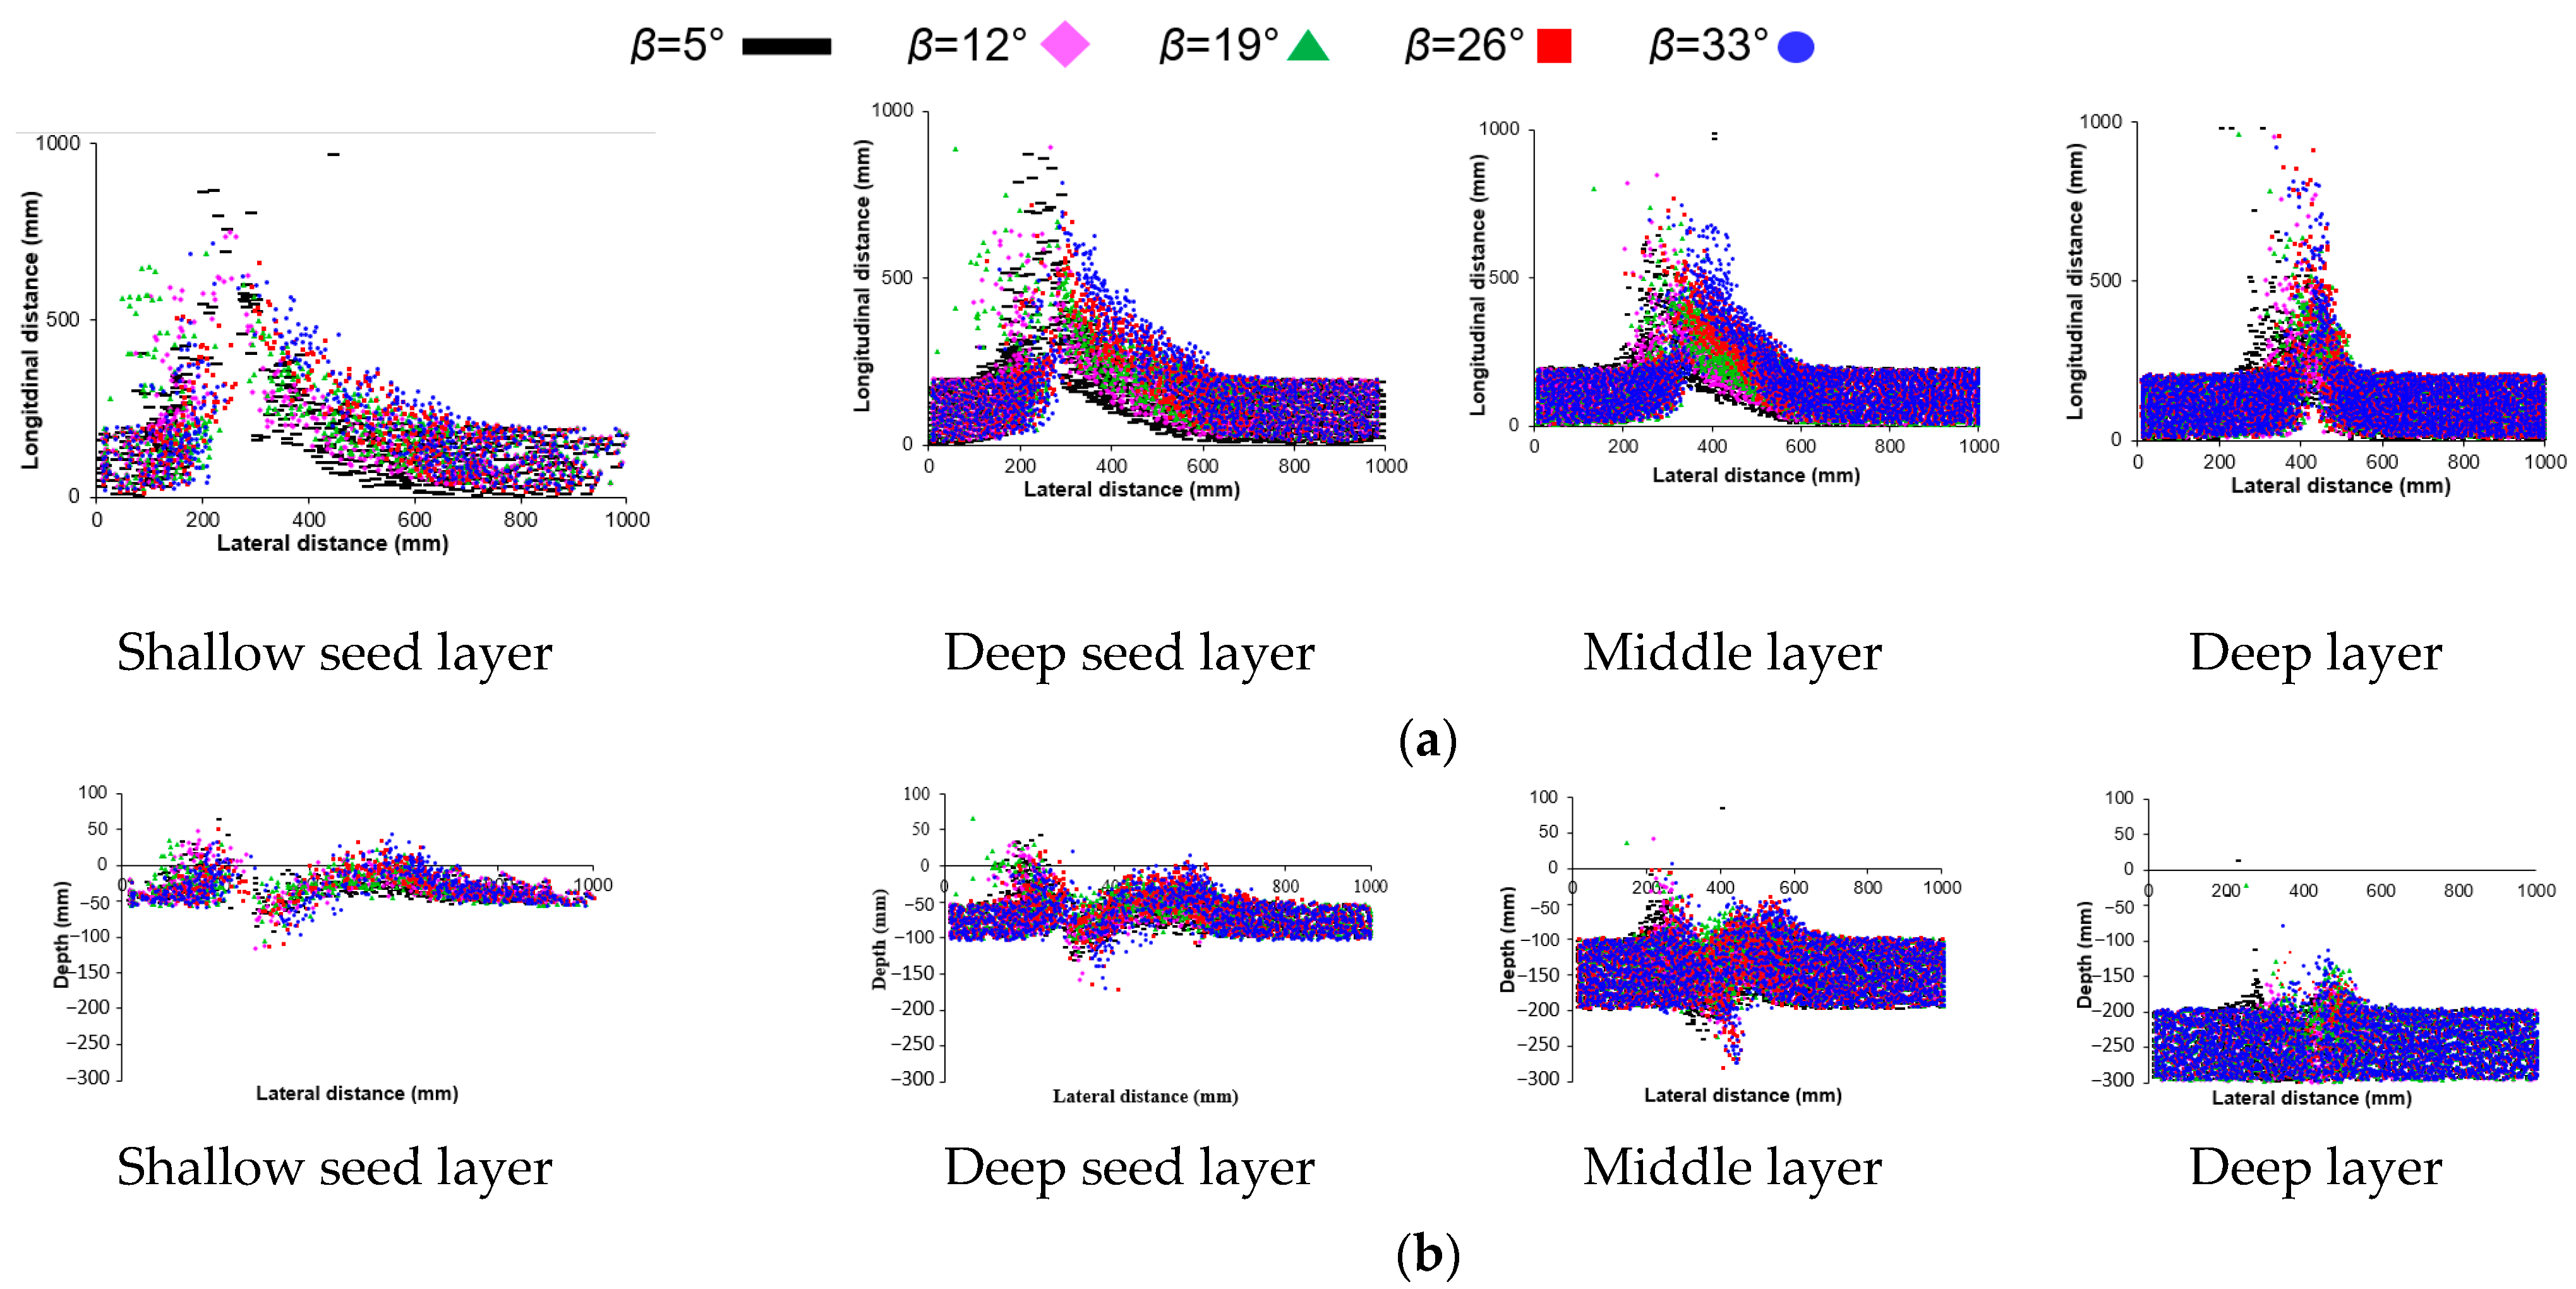
3.2. Effects of the Mounting Angle on Soil Particle Displacement

To quantify soil particles’ movements, the coordinates of the 200 mm-thick particles selected in the midsection of virtual soil bin were collected. Moreover, the effects of the mounting angle on particle displacement in various layers was quantitatively investigated (Figure 7). Smaller forward soil displacement during tillage implies less tractor power requirement [22,27]. Additionally, a smaller forward displacement of surface soil is favorable for reducing soil moisture loss and weed seed germination [22]. Larger lateral soil displacement means a larger soil disturbance area, which corresponds to higher soil loosening efficiency. Larger vertical displacement of the deeper moist soil of the top layer after subsoiling favors seed germination rate. By contrast, more mixing between the deep layer and top layer soils is considered poorer performance [26,27] as it will lift the infertile deep layer soil into the seed zone, which negatively affects subsequent crop growth.
Effect of the mounting angle (β) of the BST on the lateral and longitudinal (i.e., forward) movements are shown in Figure 7a. The lateral soil disturbance widths at a longitudinal distance of 0 mm reduced with increasing soil depth. With the increase of β from 5° to 33°, the lateral soil disturbance widths at la ongitudinal distance of 0 mm initially increased and then decreased. Moreover, the maximum lateral soil disturbance widths were 607.9, 502.8, 391.4 and 205.5 mm for the shallow seed layer, deep seed layer, middle layer and deep layer, respectively, when β = 26°. Thus, the soil disturbance range of each layer was at a maximum when β was 26°. Overall, increasing β gave smaller forward (i.e., longitudinal) displacement of particles at various depths, indicating that the tensile action of the BST on soil particles was lower at higher β values. The lateral displacement (right side) of the top and middle layers gradually increased with increasing β. By contrast, the lateral displacement of the deep layer initially increased and then decreased; the maximum lateral displacement was at a β of 26°.
As shown in Figure 7b, overall, the number of deep seed layer particles that moved to depths of <50 mm and deep layer particles that moved to a depth of 100–200 mm increased gradually with increasing β from 5° to 33°. However, the vertical displacement of deep layer particles at various β values was relatively small, which again indicated that the BST could loosen the soil without mixing the deep layer with other layers.

3.3. Effects of the Mounting Angle on Soil Layer Mixing

As shown in Figure 8, the mass ratios of soil particles left within their initial layers (not moved to other depths) after the passing of the subsoilers were the largest for all layers except for the deep seed layer. With the increase of the mounting angle from 5° to 33°, the mass ratios of deep seed layer particles that moved to a depth of <50 mm initially increased and then decreased (Figure 8b). Moreover, the largest mass ratio of 51.2% was at a β of 26°, which was 15.5% bigger than that at a β of 5°. The mass ratios of middle layer particles that moved to a depth of <50 mm gradually increased with increasing β and the largest mass ratio was 6.7% bigger than the smallest one (Figure 8c). Additionally, the mass ratios of middle layer particles that moved to a depth of 50–100 mm initially increased and then decreased, and the relatively large mass ratio (20.4%) was when β was 19° and 26°. By contrast, the mass ratios of the deep layer particles that moved to a depth of 100–200 mm did not vary much (13.9–16.5%) (Figure 8d).
The above results indicate that increasing the mounting angle of the bending subsoiling tool from 5° to 26° could lift more moist soil from the deep seed and middle layers into the shallow seed zone, which is favorable for the seed germination rate of crops. Additionally, increasing mounting angle would not seriously affect the mixing of deep layer and other layers.

3.4. Effect of the Mounting Angle on Soil Disturbance Behaviors

3.4.1. Soil Surface Flatness

Soil surface flatness can be used to evaluate vertical soil disturbance characteristics, which may seriously affect subsequent seeding operations. As shown in Table 2, soil surface flatness (SSF) increased gradually with the increase in mounting angle from 5° to 26°. With a further increase in mounting angle from 26° to 33°, SSF increased rapidly. The error between simulated and experimental SSF ranged from 2.55 mm to 5.27 mm. The above results indicate that mounting angles should be smaller than 33° to obtain a smoother soil surface after subsoiling operations and improve the uniformity of seeding depth.

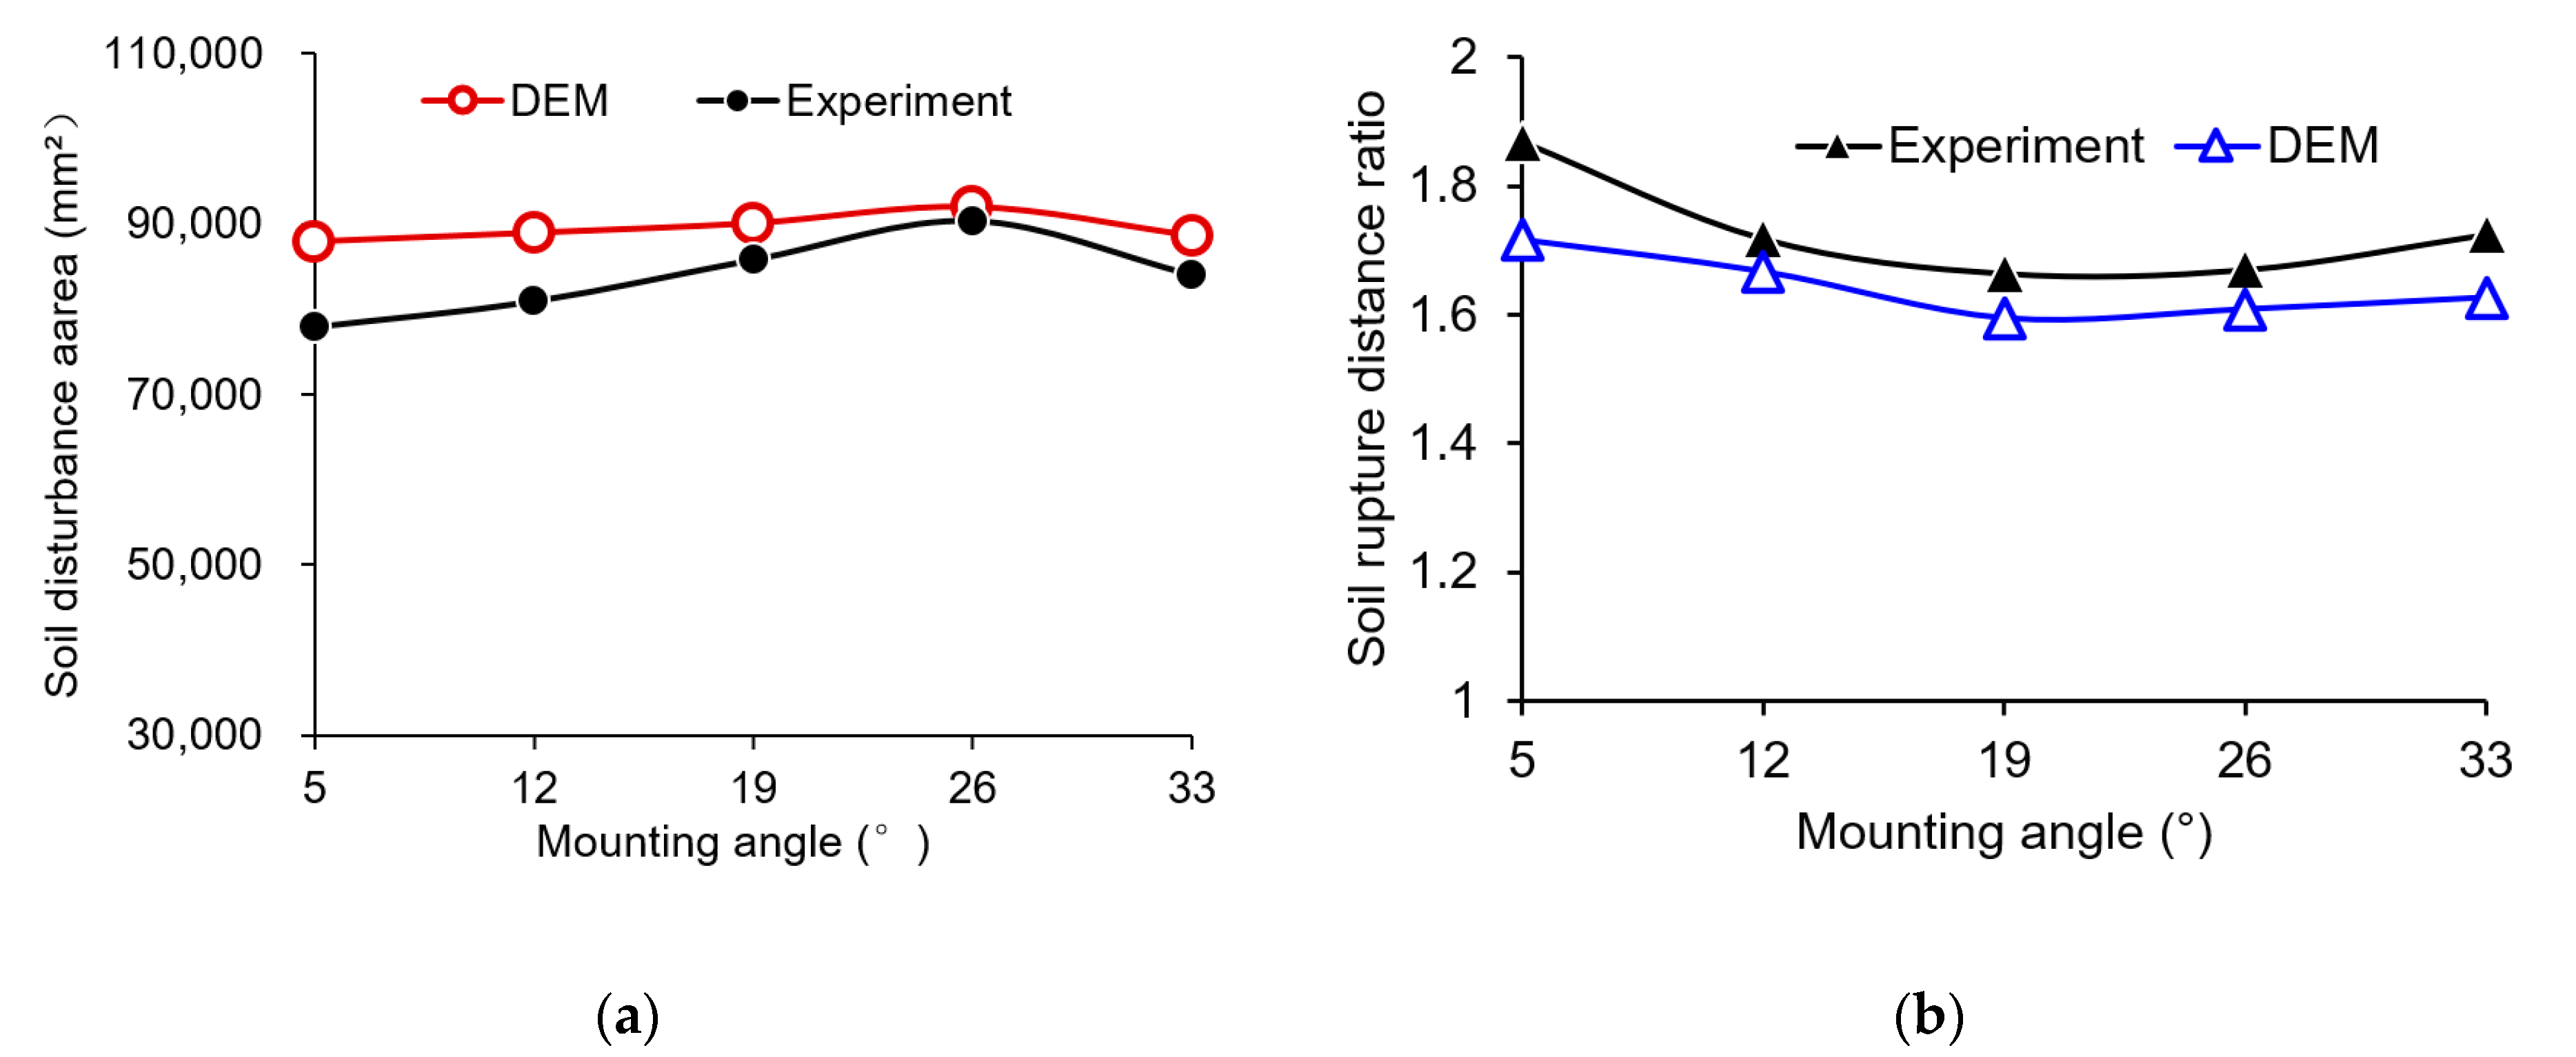
3.4.2. Soil Disturbance Area and Soil Rupture Distance Ratio

As shown in Figure 9a, soil disturbance area initially increased and then decreased when increasing the mounting angle from 5° to 33°. Moreover, the largest soil disturbance area was associated with a mounting angle of 26°. The average relative error between the simulated and experimental soil disturbance areas at various mounting angles was 7.04%. By contrast, the soil rupture distance ratio initially decreased and then increased with the increase in mounting angle (Figure 9b). The relative errors between the simulated and experimental soil rupture distance ratios ranged from 2.97% to 8.15%. The relatively small errors imply that the developed DEM model can be used to simulated soil–tool interactions with a good accuracy.

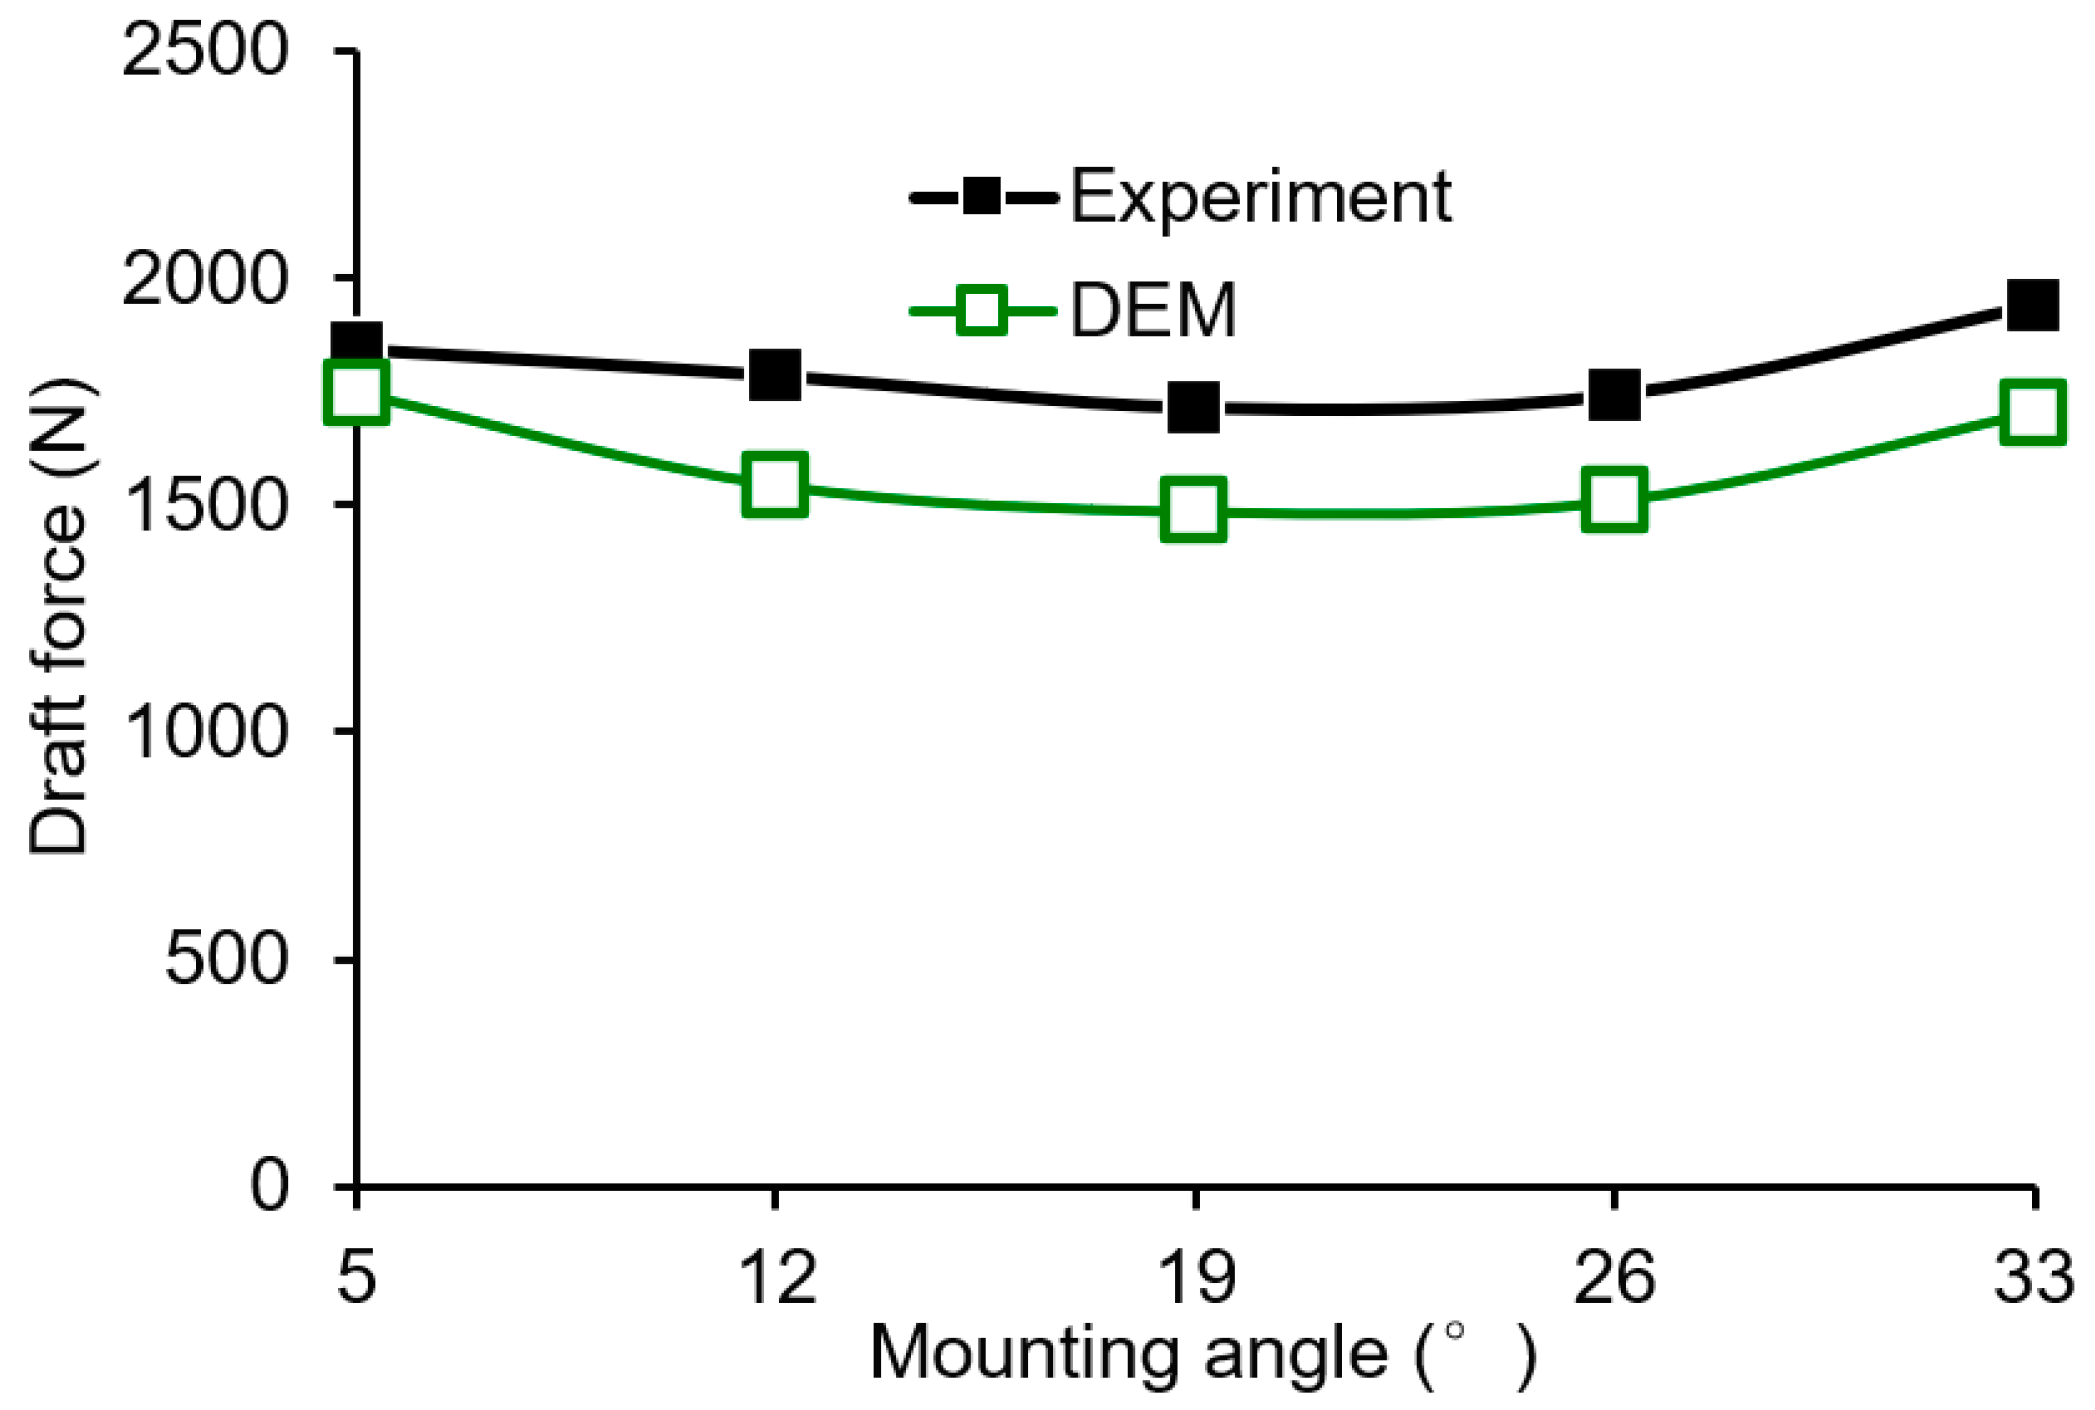
3.5. Effect of the Mounting Angle on Draft Force

As shown in Figure 10, draft forces of the bending subsoiling tool (BST) initially decreased and then increased with the increase in mounting angle from 5° to 33°. The comparably lower draft forces of the BST were at mounting angles of 19° and 26°. The variation trend for the draft force is very similar to that of the soil rupture distance ratio. Higher soil rupture distance ratios would give a larger longitudinal soil disturbance range, which may result in higher draft forces for the BST. The relative errors between the simulated and experimental draft forces of the BST at various mounting angles ranged from 5.36% to 13.53%. Therefore, the subsoiling model was further validated.
Soil loosening efficiency (SLE) is generally defined as the ratio of soil disturbance area to draft force [25]. The laboratory soil bin tests showed that SLEs were 42.29, 45.34, 50.04, 49.57 and 40.19 mm2 N−1 for BSTs with mounting angles of 5°, 12°, 19°, 26° and 33°, respectively. The comparably higher SLEs were associated with mounting angles of 19° and 26°.
The above analyses indicate that appropriately increasing the mounting angle can improve the soil loosening efficiency of bending subsoiling tools without seriously increasing the draft force and soil surface flatness.

4. Conclusions

In this study, a discrete element model was developed and validated using laboratory soil bin tests to investigate the effects of the mounting angle (5°–33°) of BSTs on soil disturbance behaviors and draft forces. The following conclusions were drawn:
(1)
The upheaval, failure and fragmentation of soil were achieved by successive shearing, uplifting, extrusion, tension and turning actions from the cutting share and cambered shank of the BST. The soil disturbance range in lateral, forward and upward directions decreased with increasing soil depths. The lateral displacement of the deep layer initially increased and then decreased, and the maximum lateral displacement was at a β of 26°.
(2)
A BST with mounting angle of 26° could lift more moist soil from the deep seed and middle layers (5.0–15.5%) into the shallow seed layer (depth of <50 mm) without seriously affecting the mixing of the deep layer with other layers. Additionally, the BST with mounting angle of 26° had the largest soil disturbance area, comparably lower soil rupture distance ratio, soil surface flatness and draft force and higher soil loosening efficiency. Considering the tool performance, a mounting angle of 26° is recommended for the BST.
(3)
The relative errors between the simulated and experimental soil rupture distance ratios and draft forces ranged from 2.97% to 8.15% and from 5.36% to 13.53%, respectively. Moreover, the average relative error between simulated and experimental soil disturbance areas at various mounting angles was 7.04%. The small relative errors indicate the established DEM model has a good accuracy and can be used to simulated soil–BST interaction.
The optimal combination of working parameters for the bending subsoiling tool (e.g., working speed, depth and mounting angle) will be investigated in our future studies.

Author Contributions

Methodology, X.W. and H.Z.; software, X.W.; validation, X.W. and H.Z.; formal analysis, X.W., H.Z. and J.J.; investigation, X.W. and H.Z.; resources, H.Z. and J.J.; data curation, X.W. and H.Z.; writing—original draft preparation, X.W.; writing—review and editing, H.Z. and J.J.; visualization, X.W. and H.Z.; supervision, H.Z. and J.J.; project administration, X.W., H.Z. and J.J.; funding acquisition, X.W., H.Z. and J.J. All authors have read and agreed to the published version of the manuscript.

Funding

The research was funded by the Science & Technology Program of Henan Province (grant number: 222102110456), National Natural Science Foundation of China (grant number: 52005162), Major science and technology project of Henan Province (grant number: 221100110800), Doctoral Research Fund of Henan University of Science and Technology (grant number: 13480042) and Key Scientific Research Project of Colleges and Universities of Henan Province (grant number: 21A416004).

Institutional Review Board Statement

Not applicable.

Informed Consent Statement

Not applicable.

Data Availability Statement

The data reported in this study are contained within the article.

Acknowledgments

The authors wish to express their sincerest gratitude and appreciation to Shaopeng Yang and Peng Li for their assistance in the laboratory soil bin tests.

Conflicts of Interest

The authors of this manuscript declare that they have no conflicts of interest.

References

  1. Pulido-Moncada, M.; Katuwal, S.; Kristensen, J.B.; Munkholm, L.J. Effects of bio-subsoilers on subsoil pore-system functionality: Case study with intact soil columns. Geoderma 2021, 385, 114897. [Google Scholar] [CrossRef]
  2. Song, W.; Jiang, X.; Li, L.; Ren, L.; Tong, J. Increasing the width of disturbance of plough pan with bionic inspired subsoilers. Soil Tillage Res. 2022, 220, 105356. [Google Scholar] [CrossRef]
  3. Zhang, Y.; Wang, S.; Wang, H.; Ning, F.; Zhang, Y.; Dong, Z.; Wen, P.; Wang, R.; Wang, X.; Li, J. The effects of rotating conservation tillage with conventional tillage on soil properties and grain yields in winter wheat-spring maize rotations. Agric. For. Meteorol. 2018, 263, 107–117. [Google Scholar] [CrossRef]
  4. Zheng, K.; McHugh, A.D.; Li, H.; Wang, Q.; Lu, C.; Hu, H.; Liu, W.; Zhang, Z.; Liu, P.; He, J. Design and experiment of anti-vibrating and anti-wrapping rotary components for subsoiler cum rotary tiller. IJABE 2019, 12, 47–55. [Google Scholar] [CrossRef]
  5. Zeng, Z.W.; Chen, Y.; Zhang, X.R. Modelling the interaction of a deep tillage tool with heterogeneous soil. Comput. Electron. Agric. 2017, 143, 130–138. [Google Scholar] [CrossRef]
  6. Zhang, Y.; Wang, R.; Wang, S.; Wang, H.; Xu, Z.; Jia, G.; Wang, X.; Li, J. Effects of different sub-soiling frequencies incorporated into no-tillage systems on soil properties and crop yield in dryland wheat-maize rotation system. Field Crop. Res. 2017, 209, 151–158. [Google Scholar] [CrossRef]
  7. Raper, R.L. Force requirements and soil disruption of straight and bentleg subsoilers for conservation tillage systems. Appl. Eng. Agric. 2005, 21, 787–794. [Google Scholar] [CrossRef] [Green Version]
  8. Spoor, G.; Tijink, F.G.J.; Weisskopf, P. Subsoil compaction: Risk, avoidance, identification and alleviation. Soil Tillage Res. 2003, 73, 175–182. [Google Scholar] [CrossRef]
  9. Wang, Y.; Li, N.; Ma, Y.; Tong, J.; Pfleging, W.; Sun, J. Field experiments evaluating a biomimetic shark-inspired (BioS) subsoiler for tillage resistance reduction. Soil Tillage Res. 2020, 196, 104432. [Google Scholar] [CrossRef]
  10. Chen, Y.; Munkholm, L.J.; Nyord, T. A discrete element model for soil–sweep interaction in three different soils. Soil Tillage Res. 2013, 126, 34–41. [Google Scholar] [CrossRef]
  11. Ucgul, M.; Fielke, J.M.; Saunders, C. Three-dimensional discrete element modelling of tillage: Determination of a suitable contact model and parameters for a cohesionless soil. Biosyst. Eng. 2014, 121, 105–117. [Google Scholar] [CrossRef]
  12. Hang, C.G.; Gao, X.J.; Yuan, M.C.; Huang, Y.X.; Zhu, R.X. Discrete element simulations and experiments of soil disturbance as affected by the tine spacing of subsoiler. Biosyst. Eng. 2018, 163, 73–82. [Google Scholar] [CrossRef]
  13. Ding, Q.; Ren, J.; Adam, B.E.; Zhao, J.; Ge, S.; Li, Y. DEM analysis of subsoiling process in wet clayey paddy soil. Trans. CSAM 2017, 48, 38–48. [Google Scholar] [CrossRef]
  14. Huang, Y.X.; Hang, C.G.; Yuan, M.C.; Wang, B.T.; Zhu, R.X. Discrete element simulation and experiment on disturbance behavior of subsoiling. Trans. CSAM 2016, 47, 80–88. [Google Scholar] [CrossRef]
  15. Tanaka, H.; Oida, A.; Daikoku, M.; Lnooku, K.; Sumikawa, O.; Nagasaki, Y. DEM simulation of soil loosening process caused by a vibrating subsoiler. Agric. Eng. Interna. CIGR E-J. 2007, 9, 1–18. [Google Scholar]
  16. Guo, Z.J.; Zhou, Z.L.; Zhang, Y.; Li, Z.L. Optimization of bionic soil engaging tools. Sci. China 2009, 39, 720–728. [Google Scholar]
  17. He, M.; Gao, H.W.; Dong, P.Y.; Cui, D.J.; Zhao, W.G. Subsoiling experiment on double cropping and conservation tillage adopt area. Trans. CSAM 2018, 49, 58–63. [Google Scholar] [CrossRef]
  18. Zhang, L.Y.; Zheng, X.; He, X.C. Performance analysis of the bending subsoiling tool. Jiangsu Agric. Sci. 2014, 42, 354–356. [Google Scholar]
  19. Lv, Z.B. Design and Experimental Study of the Multifunction Subsoiler and Key Components. Master’s Thesis, Jilin University, Changchun, China, 2013. [Google Scholar]
  20. Hang, C.G.; Huang, Y.X.; Li, W.; Zhu, R.X. Influence factors and reduction strategies of subsoiling tillage resistance. J. Northwest A F Univ. 2016, 44, 202–208. [Google Scholar] [CrossRef]
  21. Li, W. Influence Research of Subsoiling in Tandem on Soil Disturbance. Master’s Thesis, Northwest A&F University, Xianyang, China, 2017. [Google Scholar]
  22. Gürsoy, S.; Chen, Y.; Li, B. Measurement and modelling of soil displacement from sweeps with different cutting widths. Biosyst. Eng. 2017, 161, 1–13. [Google Scholar] [CrossRef]
  23. Sadek, M.; Chen, Y. Feasibility of Using PFC3D to Simulate Soil Flow Resulting from a Simple Soil-Engaging Tool. Trans. ASABE 2015, 58, 987–996. [Google Scholar] [CrossRef]
  24. Ucgul, M.; Saunders, C.; Fielke, J.M. Discrete element modelling of top soil burial using a full scale mouldboard plough under field conditions. Biosyst. Eng. 2017, 160, 140–153. [Google Scholar] [CrossRef]
  25. Wang, X.Z.; Li, P.; He, J.P.; Wei, W.Q.; Huang, Y.X. Discrete element simulations and experiments of soil-winged subsoiler interaction. IJABE 2021, 14, 50–62. [Google Scholar] [CrossRef]
  26. Zheng, K.; He, J.; Li, H.W.; Dao, P.; Wang, Q.J.; Zhao, H.B. Research on polyline soil-breaking blade subsoiler based on subsoiling soil model using discrete element method. Trans. CSAM 2016, 47, 62–72. [Google Scholar] [CrossRef]
  27. Wang, X.Z.; Yue, B.; Gao, X.J.; Zheng, Z.Q.; Zhu, R.X.; Huang, Y.X. Discrete element simulations and experiments of disturbance behavior as affected by the mounting height of the subsoiler’s wing. Trans. CSAM 2018, 49, 129–141. [Google Scholar] [CrossRef]
Figure 1. The (a) structure of bending subsoiling tool and (b) diagram showing the longitudinal distance (L) and working depth (d). (α0, β, S and h stand for rake angle, mounting angle, length of cutting share and tool height, respectively).
Agriculture 12 01830 g001
Figure 2. Laboratory soil bin test: (a) Rotary tillage; (b) Soil compaction; (c) Equipment for subsoiling test.
Agriculture 12 01830 g002
Figure 3. Measurement of soil rupture distance ratio: (a) Diagram showing soil rupture distance (f) and working depth (d); (b) Moment one when soil particles in the white line began to move; (c) Moment two when the tool arrives at the white line; (d) Measuring of soil disturbance area; (e) Measuring of soil surface flatness. (BST = bending subsoiling tool).
Agriculture 12 01830 g003
Figure 4. Discrete element models for the bending subsoiling tool (BST).
Agriculture 12 01830 g004
Figure 5. The (a) data collection region in the top view, (b) measuring box of particles mass for each depth and (c) diagram showing the vertical distance from soil surface after tillage to horizontal reference line (akj) and the spacing between two adjacent points (d0), furrow width (l0) and soil disturbance area (As).
Agriculture 12 01830 g005
Figure 6. Microcosmic process of soil disturbance of the bending subsoiling tool: (a) t1 = 3.92 s; (b) t2 = 4.16 s; (c) t3 = 4.4 s; (d) t4 = 4.6 s; (e) t5 = 5.2 s; and (f) the legend for compressive force on the bending subsoiling tool surface.
Agriculture 12 01830 g006aAgriculture 12 01830 g006b
Figure 7. Lateral, longitudinal and vertical movement of particles in different soil layers, as affected by mounting angle: (a) Lateral and longitudinal directions; (b) Lateral and vertical (i.e., depth) directions.
Agriculture 12 01830 g007
Figure 8. Mass ratio at various layers after subsoiling as affected by mounting angle: (a) Shallow seed layer; (b) Deep seed layer; (c) Middle layer; (d) Deep layer.
Agriculture 12 01830 g008
Figure 9. Soil disturbance area (a) and soil rupture distance ratio (b) as affected by mounting angle.
Agriculture 12 01830 g009
Figure 10. Draft forces of the bending subsoiling tool as affected by mounting angle.
Agriculture 12 01830 g010
Table 1. Major parameters for the discrete element model.
ParameterUnitValue
Density of steelkg m−37.8 × 10³
Shear modulus of steelPa7.3 × 1010
Shear modulus of soilPa5 × 107
Poisson’s ratio of steelDimensionless0.35
Poisson’s ratio of soilDimensionless0.3
Yield strength of soilPa1 × 106
Static friction coefficient of soil–steelDimensionless0.52
Static friction coefficient of soil–soilDimensionless0.70
Rolling friction coefficient of soil–steelDimensionless0.05
Rolling friction coefficient of soil–soilDimensionless0.225
Restitution coefficient of soil–soilDimensionless0.60
Damping coefficientDimensionless0.05
Stiffness coefficientDimensionless0.95
Cohesive energy densityJ m−33 × 104
Table 2. Soil surface flatness as affected by mounting angle.
Mounting Angle (°)Soil Surface Flatness (mm)
DEMExperimentDeviation
519.0316.482.55
1220.1816.873.31
1922.4017.135.27
2622.3517.524.83
3327.4623.404.06
Publisher’s Note: MDPI stays neutral with regard to jurisdictional claims in published maps and institutional affiliations.

