1. Introduction
Agricultural production consumes large amounts of freshwater worldwide. According to estimates by the Food and Agricultural Organization (FAO), irrigation in agriculture accounts for 70% of freshwater consumption [
1]. Although grapes for wine production are grown under water deficits or with no irrigation, monitoring of vine water status is extremely important, as it allows assertive water management in irrigated vines, thus contributing to optimizing the use of water resources. In addition, water management becomes crucial in the actual climate change scenario [
2] caused by global warming, where weather patterns are more difficult to predict and natural resources such as water availability become uncertain.
Monitoring the water status of vines essentially depends on crossing climatic data and measurements made by operators in the vineyard based on a method developed in 1965 by Schölander [
3]. This method is time-consuming and expensive [
4] and does not allow monitoring with a sufficient degree of detail for more efficient management of water in vineyards. This is due to the need for specific equipment with little mobility and the short window of opportunity for measurements, which does not allow extensive measurements to be carried out over large areas. Thus, at present, this monitoring is an arduous task for which the execution entails the allocation of many resources, making it a practice accessible only to large companies. Specifically, the need for technicians specially trained to transport and handle the Schölander chamber and the gas bottle—in addition to the price of this equipment—combined with the fact that measurements have to be carried out before sunrise, makes this kind of monitoring not possible for general use.
On the other hand, García-Tejera et al. [
5] show that evaporative demand, the hydraulic architecture of the plant, and the texture and depth of the soil play key roles in the final water potential observed. They also state that to establish irrigation programs based on water potential without considering the environmental and plant factors that influence it can create the paradox of having a plant suffer greater water stress even when high irrigation volumes are applied.
These studies highlight the importance of the soil–plant–atmosphere continuum (SPAC) model, both when considering that “water moves from the soil, through a plant, out into the surrounding atmosphere.” [
6] or with “water moving the ‘wrong way’ through the plant: from the atmosphere, through a plant, towards the soil” [
7].
This model has been frequently used to estimate water status, even with the use of sensory fusion [
8]. However, this always entails centralized weather stations and GSM communications, which in agricultural areas normally have different coverage problems or have few sensors with low spatial distribution [
9].
In recent years, the Internet of Things (IoT) concept has become popular, and agriculture is no exception. The number of published papers evidences the increasing discussion and relevancy of IoT applied to smart farming [
10].
Despite this, in our opinion, this is the first work that uses an IoT infrastructure (in this case based on the LoRaWAN protocol) to communicate with different sensors (sensors for the soil, plant and atmosphere) distributed in order to monitor the water potential using the SPAC model.
As previously mentioned, IoT solutions have been gaining importance globally. The benefit of using integrated soil–plant–atmosphere sensor systems coupled to an online platform will allow the continuous monitoring of water status in real-time and is economically more accessible to a wider range of producers. In addition, water management in agricultural activities is of major importance to achieve an environmentally sustainable sector in line with United Nations Sustainable Development Goals (SDG), namely, Goals 12 (“sustainable production and consumption”) and 13 (“climate action”) through the development of new innovative solutions in accordance with Goal 9 (“industry, innovative and infrastructures”) [
11].
Therefore, in light of the above issues, the objective of this work is to make the following contributions:
Develop an integrated network of sensors for soil–plant–atmosphere with wireless communication through the LoRaWAN protocol;
Create a platform for receiving data in real time obtained through sensors positioned in places with difficult access and connectivity;
Enable continuous, remote and general-time monitoring of the water status of vines so that in the near future it is possible to optimize the management of vineyards and water resources.
Related Work
The assessment of the water status in a vineyard is usually obtained through sensors in the soil (soil matrix potential), sensors in the vine (stomatal conductance and leaf water potential) and data from meteorological stations [
12]. In this work, the soil matrix potential is obtained through Watermark
® granular matrix sensors (Irrometer Company, Inc., Riverside, CA, USA) that are read using a hand-held soil moisture meter (Watermark
®, model 30KTCD [
13]). Leaf water potential measurements are made with a pressure chamber, and stomatal conductance is evaluated using a portable, open-system, gas exchange analyser (LI-6400; LI-COR, Lincoln, NE, USA [
14]). The whole process is laborious and requires several trips to the field (at least twice a day every two weeks). To overcome these limits, some authors assess plant or soil water status from modelling using data from weather stations [
15]. Some authors also measure sap flow through thermal dissipation (‘Granier’ method) as a complement to leaf water potential measurements and soil water content as indicators of water status [
16].
The Internet of Things (IoT) is a rapidly evolving paradigm that integrates smart electronic devices (such as sensors, actuators, and controllers) and computers throughout the internet to facilitate how human beings live and to help optimize present and future resource consumption and eventually fundamentals. This rapid evolution brings several new research problems that need solutions from multidisciplinary fields [
17].
Extensive research has been done globally potentiating needed IT- and IoT-based transformations. IoT provides its benefits to several application domains such as connected industry, smart traffic, security and surveillance, smart agriculture and automation, healthcare and medicine, smart cities and homes, energy consumption, environment and pollution, etc. A detailed discussion of major IoT applications from both technological and social perspectives can be found in [
18]. It has been stated, and we agree, that “Agriculture is one of the important domain around the world”.
Environmental aspects are relevant to agriculture. Talavera et al. [
19], in their survey study, explore fundamental efforts to use IoT applications for agro-industrial and environmental aspects. They were driven by the need to identify application areas, trends, architectures, and challenges that are open in these fields. They followed a systematic literature review published with peer-review from 2006 to 2016. From an initial pool of 3578 papers, 2652 were selected, 720 were eligible, and 72 met the inclusion and quality criteria; these were clustered into four application domains corresponding to: monitoring, control, logistics and prediction. The results from the review were compiled into an IoT architecture roughly common for the found solutions. The selected studies came from worldwide sources. Most research still addresses monitoring applications (62%), 25% also focusses on control, and the rest (l13%) are preliminary solutions in logistics and prediction. The temperature and humidity of the air, as well as soil moisture and solar radiation, were recognized as universally measured variables. Similarly, actuators such as valves, pumps, motors, sprinklers, humidifiers and lamps were widely used in irrigation, fertilization, pesticide management and illumination. They also observed that cloud storage has not been widely adopted, and communication technologies used were Wireless Personal Area Network (WPAN) protocols such as Bluetooth and ZigBee, followed by Wireless Metropolitan Area Networks (WMANs) supported by cellular technologies (GPRS/GSM/3G/4G).
Recently, low-power WAN (LPWAN) technologies such as LoRa and NB-IoT are becoming commonplace in IoT applications due to their low power requirements, wide coverage range and low cost compared to other long-distance technologies. In one survey [
20], the authors concluded that LoRa is the best option for smart agriculture applications. They affirm that for LPWAN, narrowband (NB)-IoT and long range (LoRa) are the two leading technologies. Thus, they provide a comprehensive survey of NB-IoT and LoRa as efficient solutions for connecting smart devices. They demonstrate that unlicensed LoRa has advantages in terms of battery life, capacity and cost. On the other hand, licensed NB-IoT offers benefits in terms of Quality of Service (QoS), latency, reliability and range. These technologies are appropriate for IoT applications that need to communicate tiny amounts of information over a long range. IoT solutions based on cellular technology can provide large coverage, but they consume a great amount of power. After comparing and describing the technical differences (physical features, network architecture and MAC protocol) and IoT factors (QoS, battery life, latency, network coverage, range, deployment model and cost) between LoRA and NB-IoT, the authors defined suitable application domains for each one. For Smart Agriculture, they selected LoRa based on device cost, battery life and coverage. The communication protocol and the system architecture are designated a LoRaWAN network, while LoRa defines the physical layer. Standardized technical development and advancement with technical solutions are the main goal of the LoRa Alliance, which was established in 2015. The LoRa Alliance
® (Fremont, CA, USA) is an open, non-profit association with the mission to support and promote the global adoption of the LoRaWAN
® standard [
21].
There are actual studies exploring this new era of precision agriculture. The application of IoT technologies with the integration of unmanned aerial vehicles (UAVs) for sensing and automation of agricultural fields is a current and future trend. One study [
22] conducted a survey of recent research in IoT and UAV technology applied to smart agriculture. Smart sensors, network protocols and solutions for smart farming were described. Further, the fundamental role of UAV technology in smart agriculture was presented by analysing its application in various scenarios such as irrigation, fertilization, pesticide spraying, weed treatment, plant growth monitoring, etc. Moreover, the use of UAV systems in complex agricultural environments was also analysed. In addition to the increasing use of UAV technology, the authors also stated that the growing trend is to use LoRaWAN and Wireless Sensor Networks (WSN). Most of the reported applications used a single group of parameters (e.g., sensor-based irrigation systems, nutrient portion definition based on soil sensors, monitoring of various soil characteristics, automatic irrigation and water quality by moisture estimation based on acquired image processing) or were targeted to the implementation of smart greenhouses.
2. Materials and Methods
As previously mentioned, there are several works with IoT systems for precision agriculture. However, in most cases, these systems are not suitable for multiple groups of parameters (atmosphere, plant and soil), and when they are, they are centred around applications in greenhouses. The developed system aims to determine the water stress of a vineyard, but it allows for other factors. In order to determine water stress, it is necessary to understand the exchange of water (in its liquid or gaseous state) or, in other words, evapotranspiration.
Figure 1 is a representation of these exchanges, which consist of transpiration of the vegetation, evaporation of daily water (irrigation or precipitation) and the humidity of the leaves and the soil.
Taking this model into account, our system was developed using sensors for the three groups of parameters: atmosphere, plant and soil.
Table 1 discriminates between the parameters measured by the different sensors and organizes them into distinct groups (“Atmosphere”, “Plant” and “Soil”). This choice also took into account energy consumption and the existence of a digital output by allowing more than one sensor to be connected to a module.
2.1. The Implemented System
The implemented system (
Figure 2) consists of sensor modules with wireless transmission using the LoRaWAN protocol (class A) communicating every 15 min, a gateway connected to The Things Network [
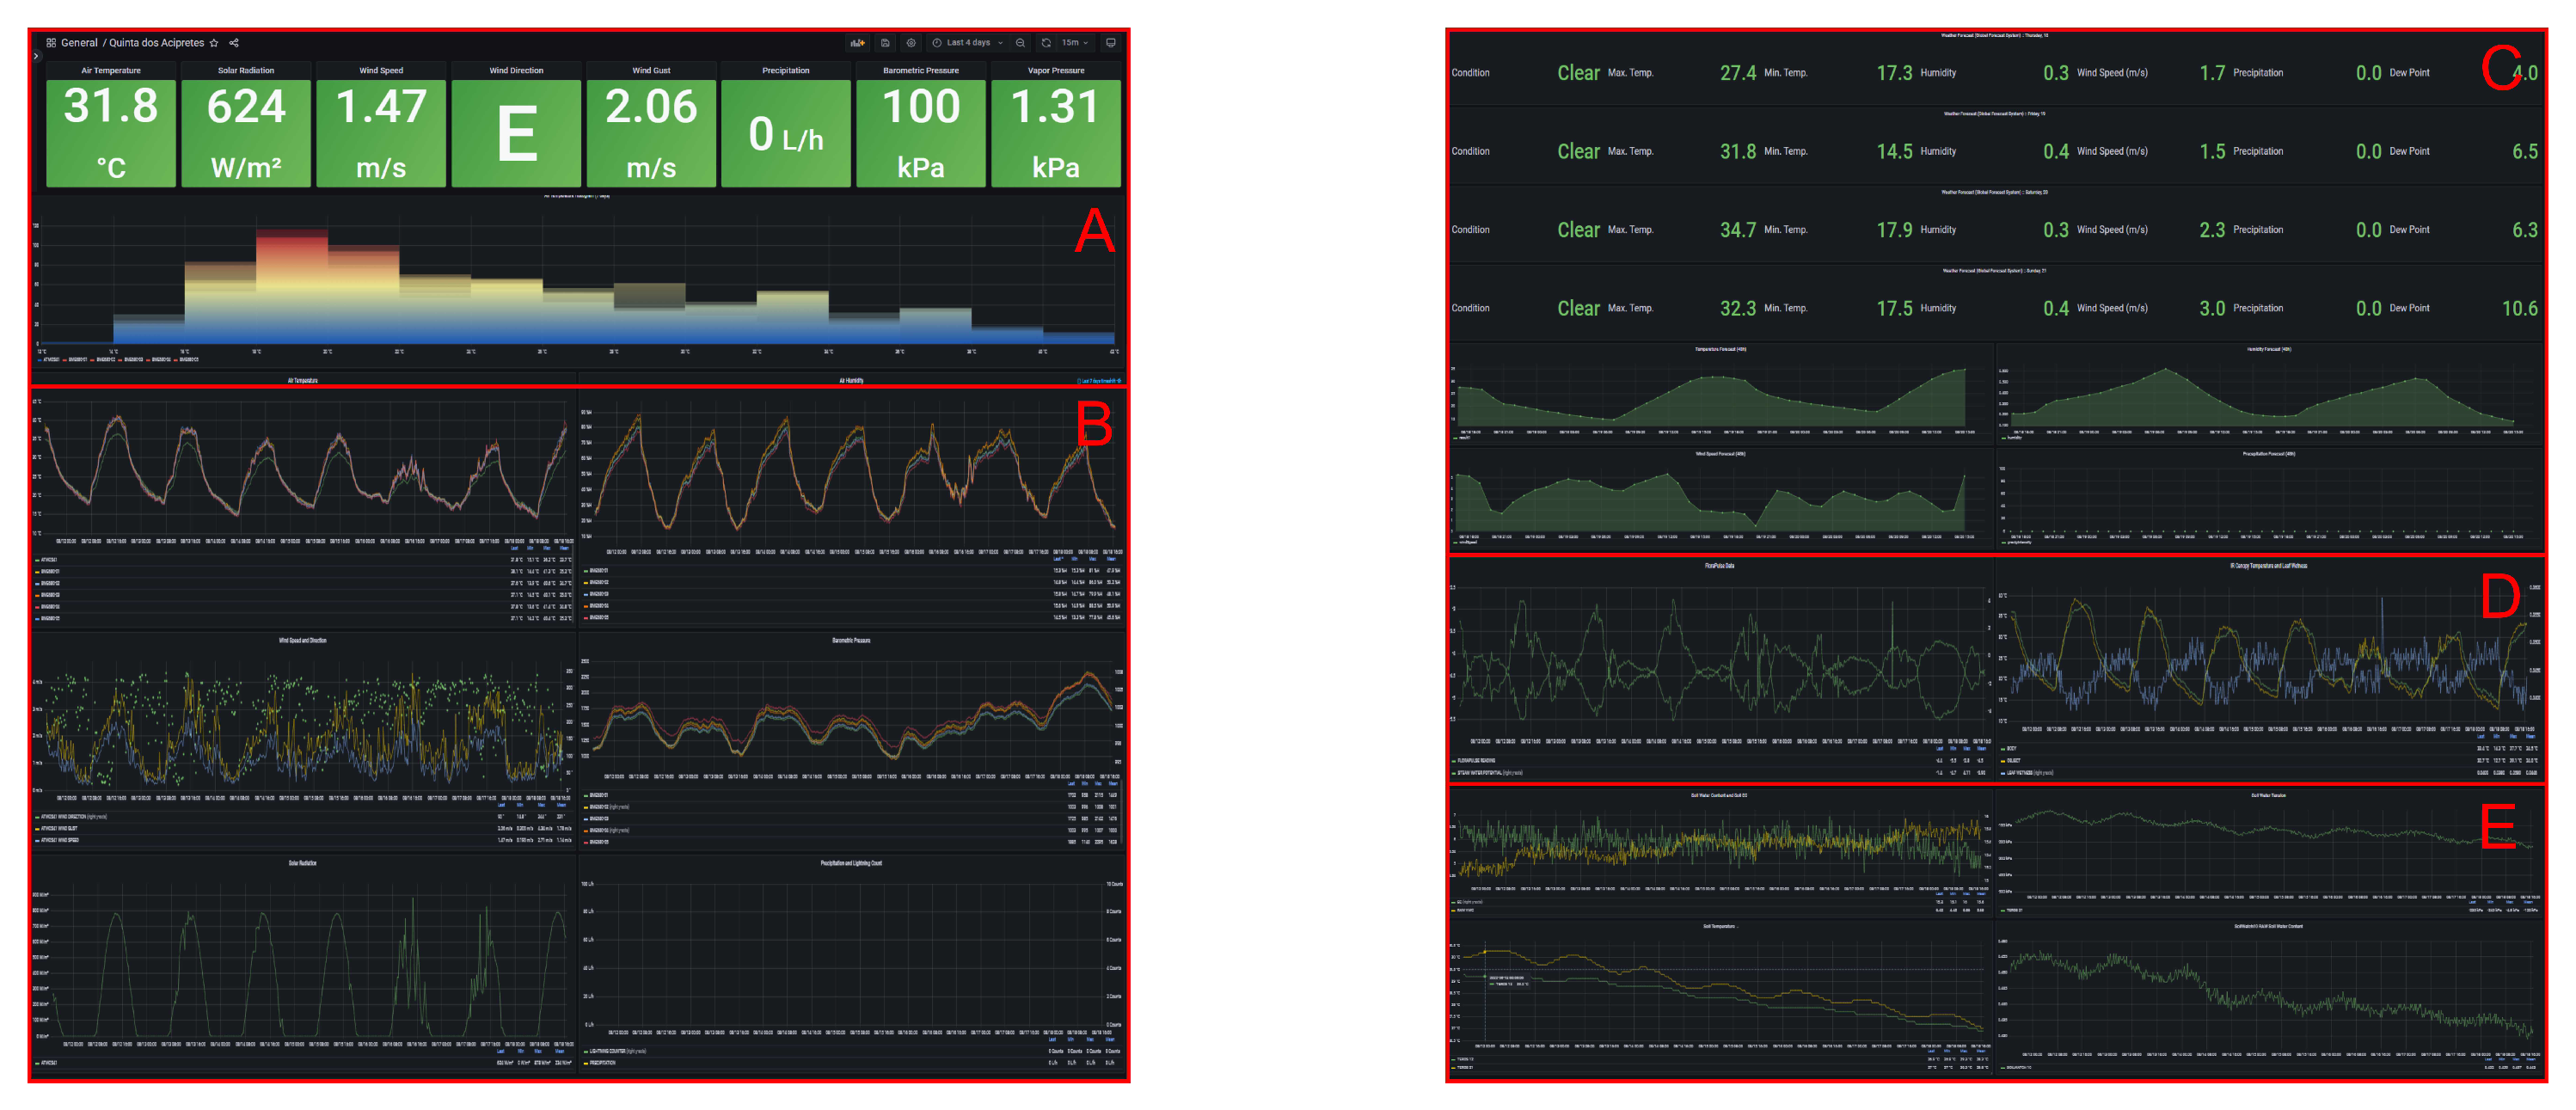
31] through a GSM/LTE connection, and a server with a time-series database in InfluxDB [
32] and Grafana [
33] as an observability platform.
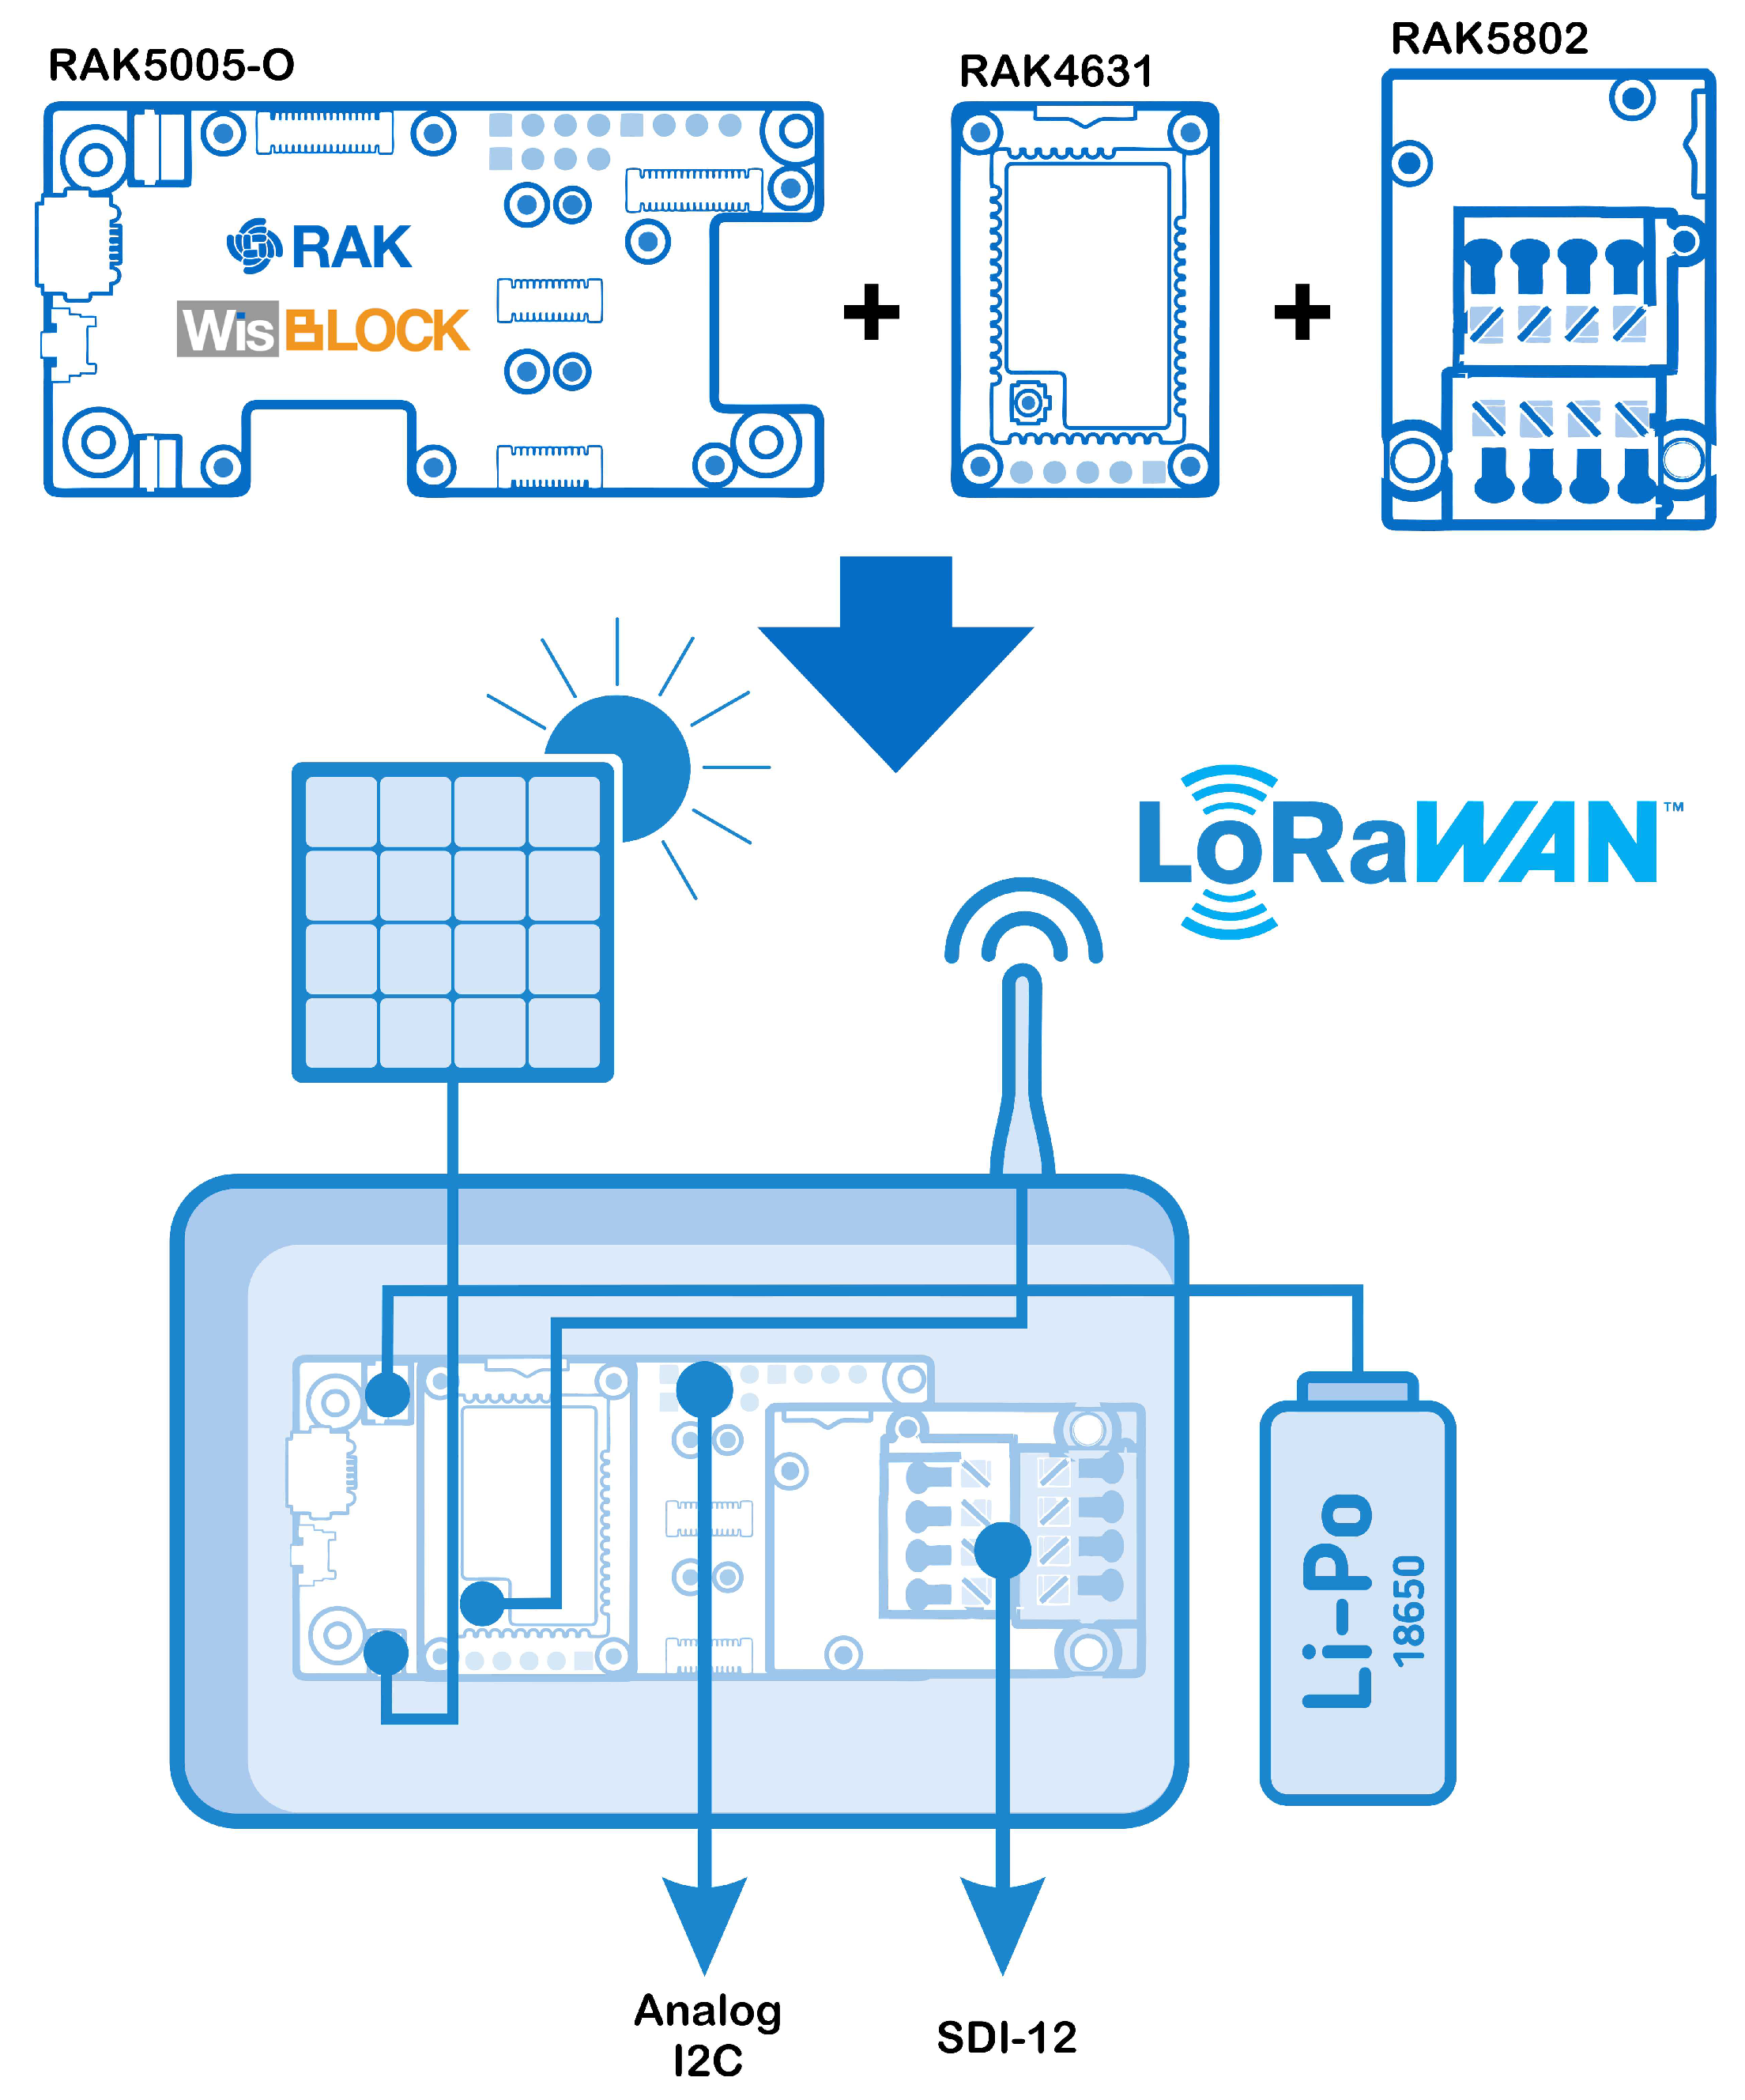
2.2. LoRaWAN Modules
The requirements for IoT modules based on the LoRaWAN protocol are: low cost, low consumption, small dimensions, fast prototyping and easy programming (compatible with the Arduino environment). In view of these requirements, we chose the modular system from RAK Wireless (RAK) [
34]. The developed module is depicted in
Figure 3.
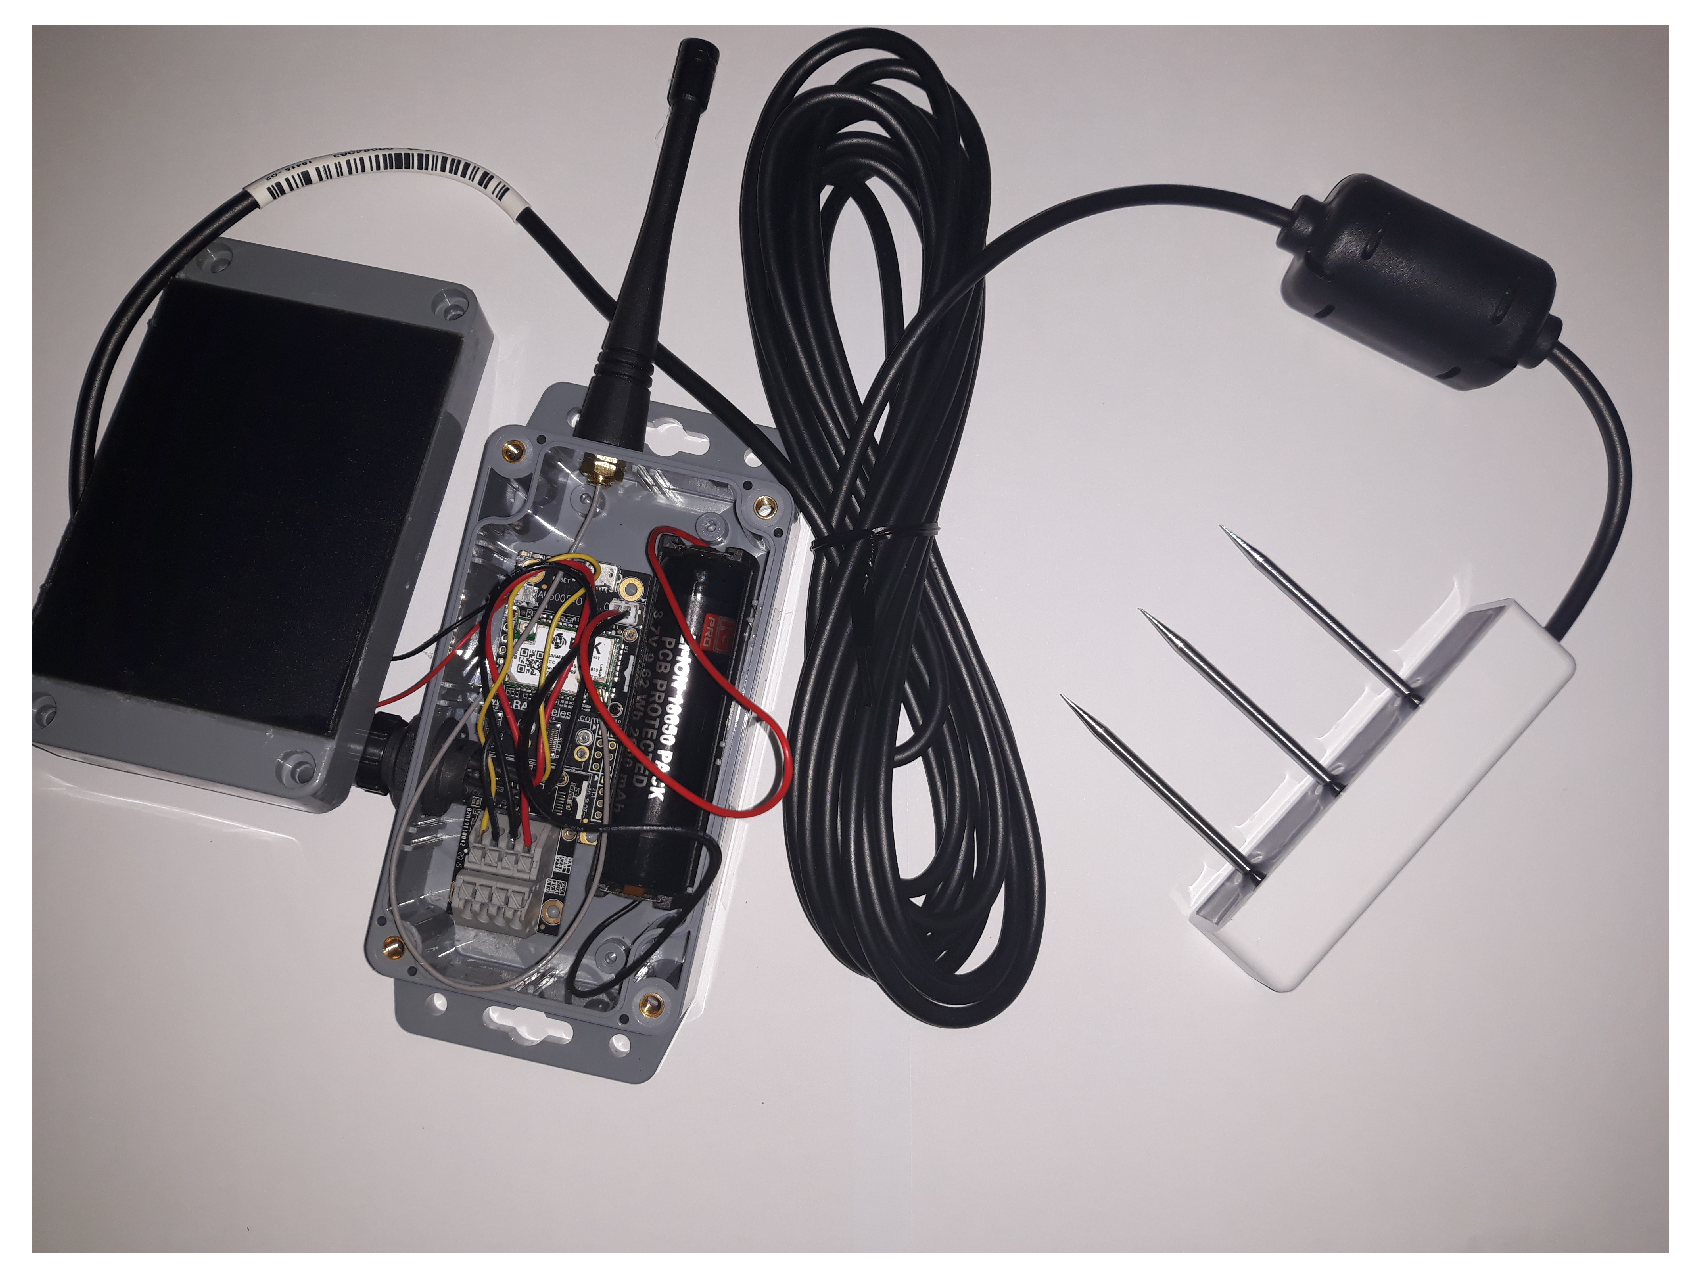
As the outputs required for connection to the chosen sensors (see
Table 1) are SDI-12, I2C and analogue, the modules for the RAK modular system were: the base module RAK5005-O (already supplied with connections for a 3.6 V lithium battery and solar charging—max 6 V); the core module RAK4631, based on Nordic nRF52840, with LoRa (SX1262)—the LoRaWAN protocol is implemented through a library; and the RAK5802 module, based on the 3PEAK TP8485E, which is designed to interface with the RS485 protocol. So that this last module could serve as an interface with the SDI-12 protocol, a dedicated library was developed. An example of a complete module connected to a sensor with SDI-12 communication (the TEROS 12) can be seen in
Figure 4.
All modules with the BME680 sensor and ATMOS41 have 2600 mAh lithium-ion batteries, and the remaining modules have batteries that provide a total of 4600 mAh of capacity. This is due to the fact that both the ‘Plant’ module and the ‘Soil’ module have three sensors connected to each module.
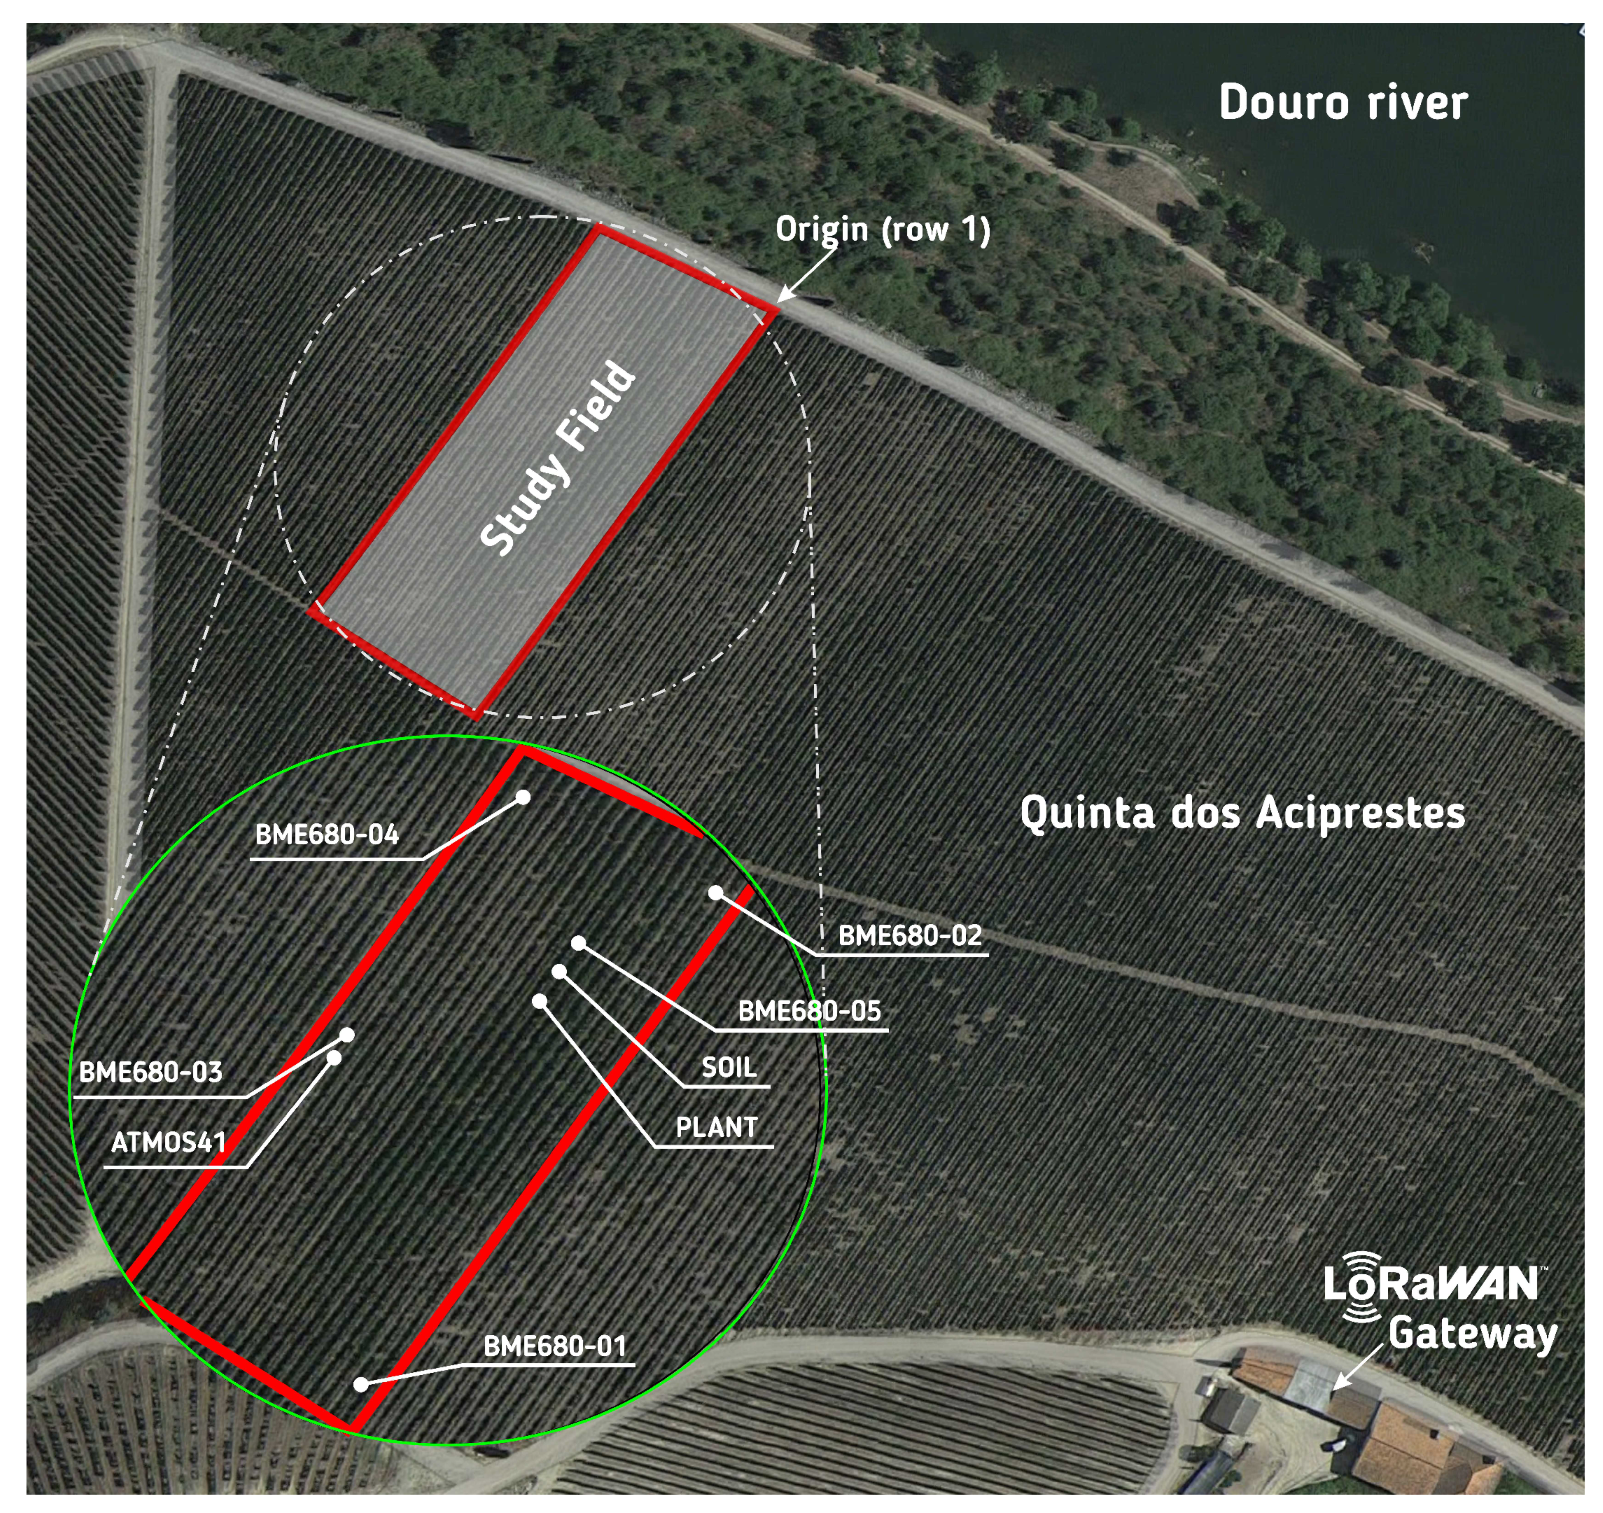
2.3. Implementation at Quinta dos Aciprestes in the Douro UNESCO Region
The entire system (the gateway and modules) was placed in a vineyard at Quinta dos Aciprestes (Real Companhia Velha, SA, Douro, Portugal) [
35].
Figure 5 shows the location of the installed modules and gateway. The ‘
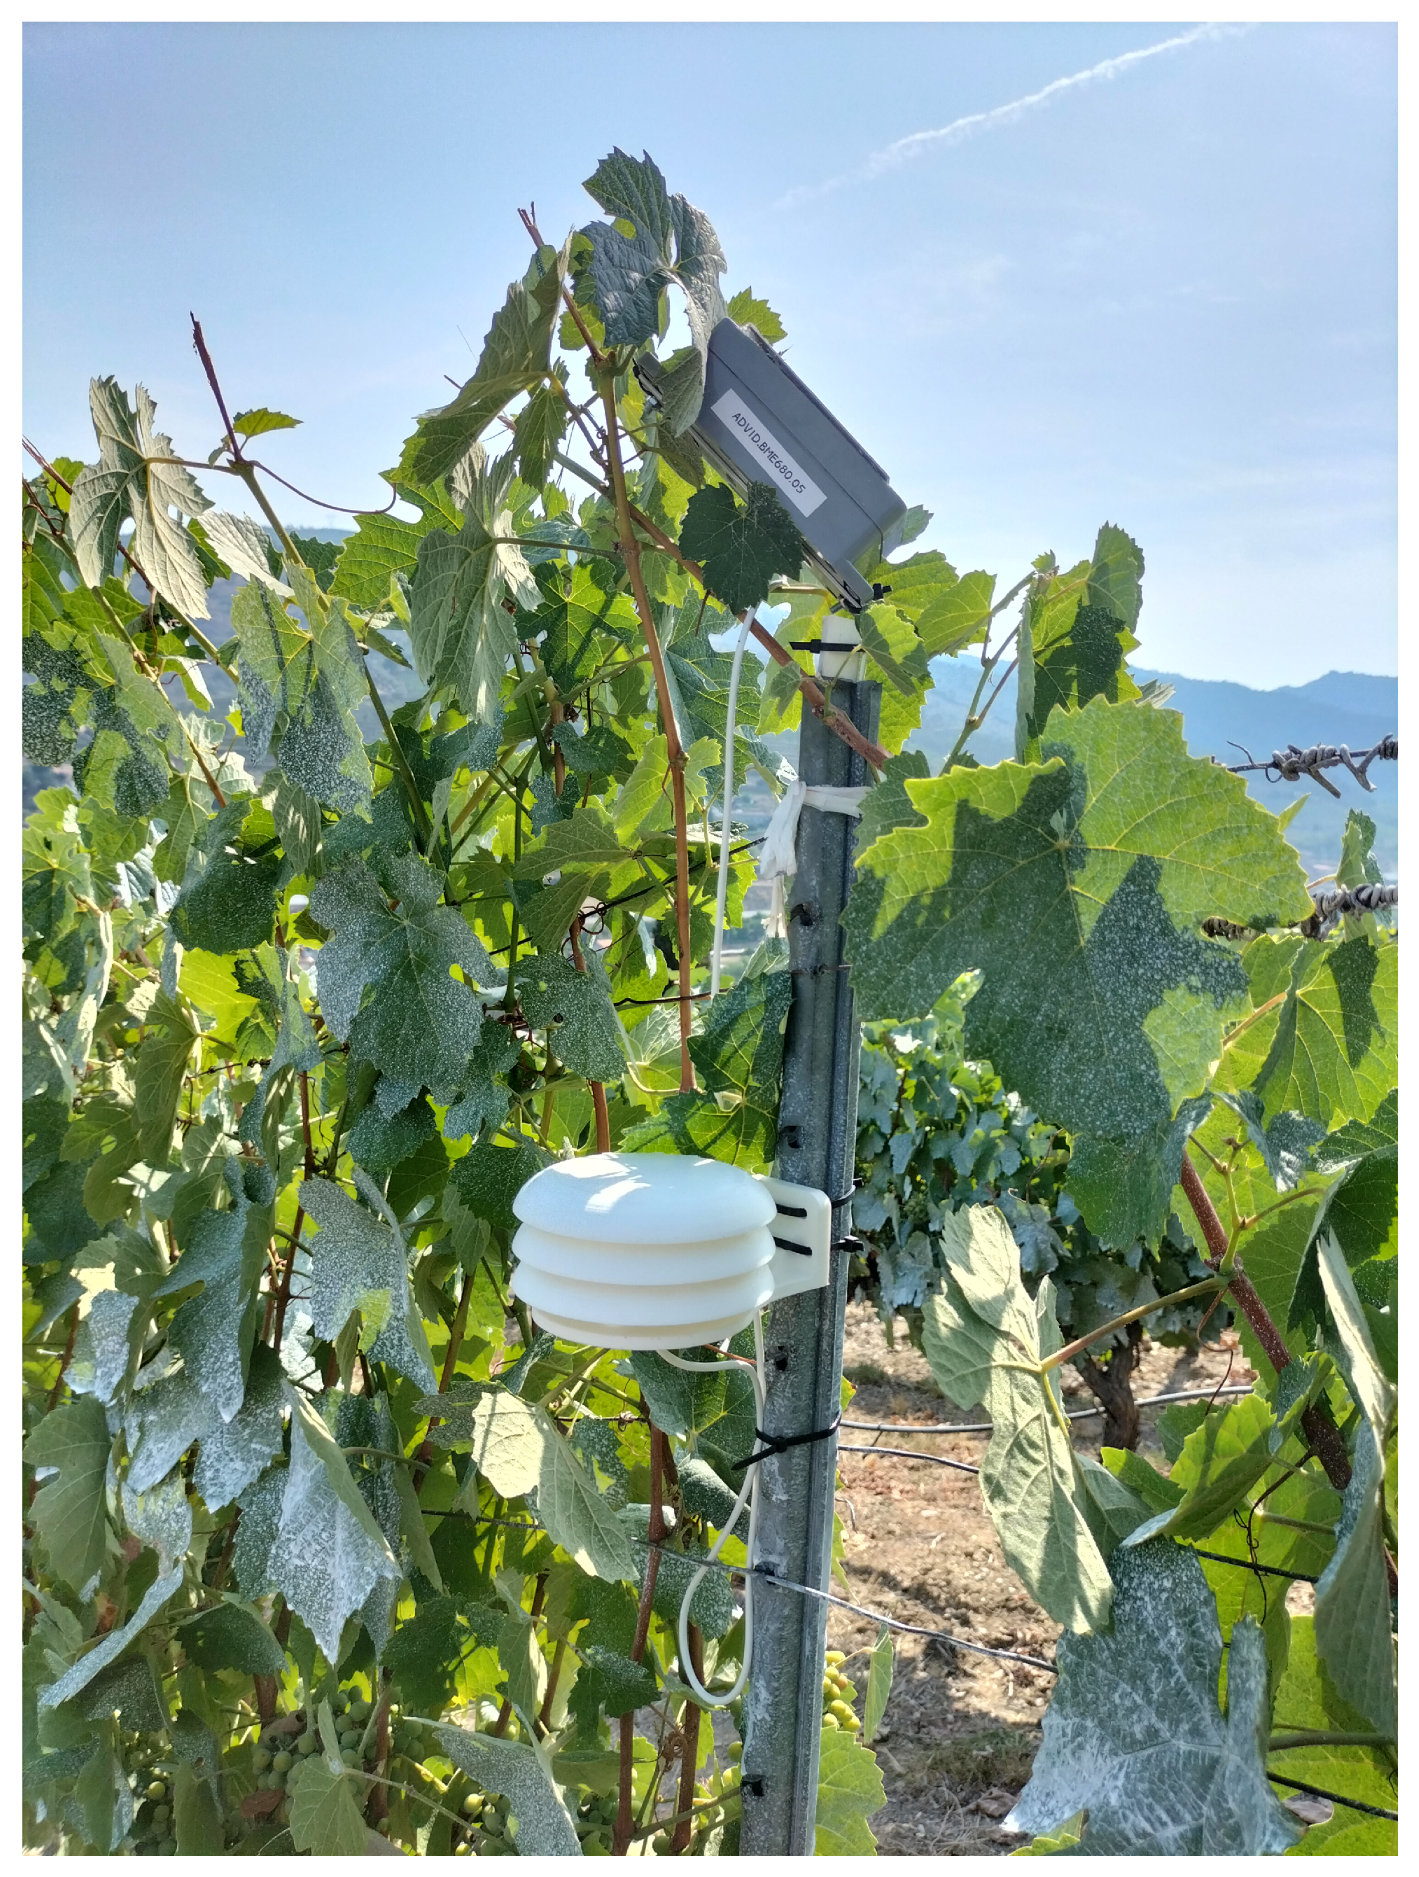
ATMOSPHERE’ sensors were placed in the vineyard and included five modules with BME680 (01 to 05) and one module with the ATMOS41 All-in-One weather station. A module for the ‘
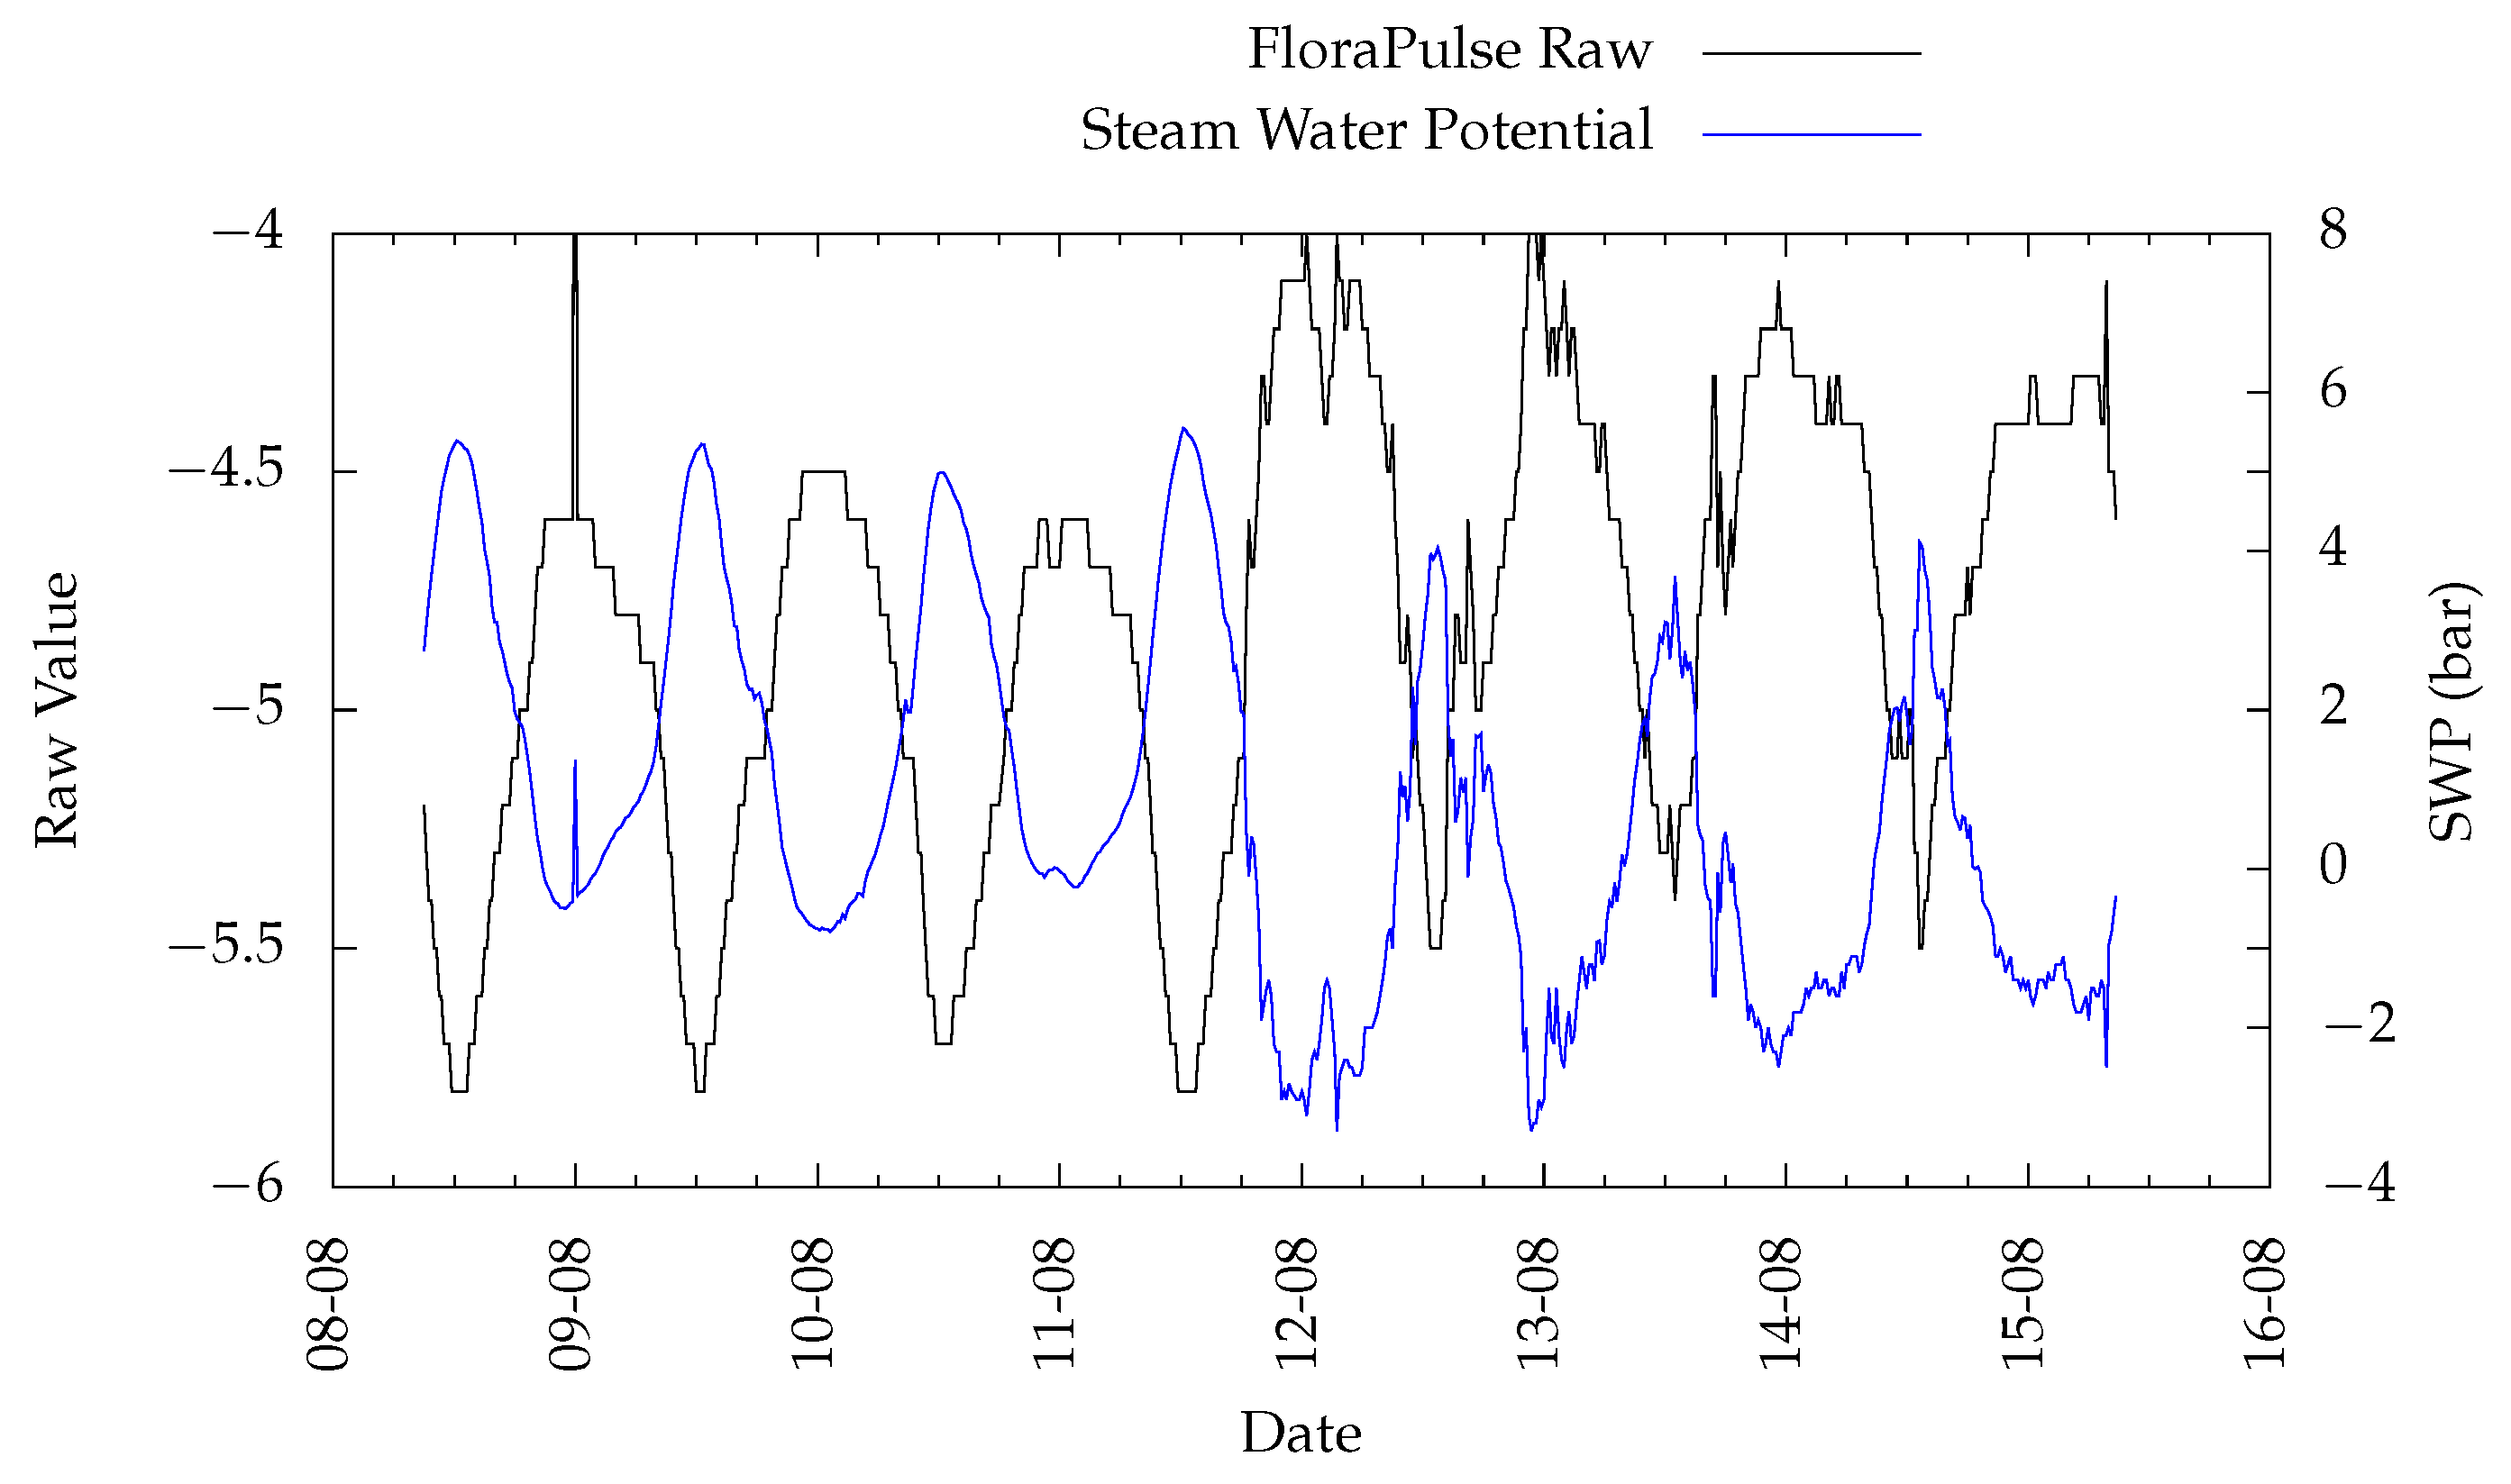
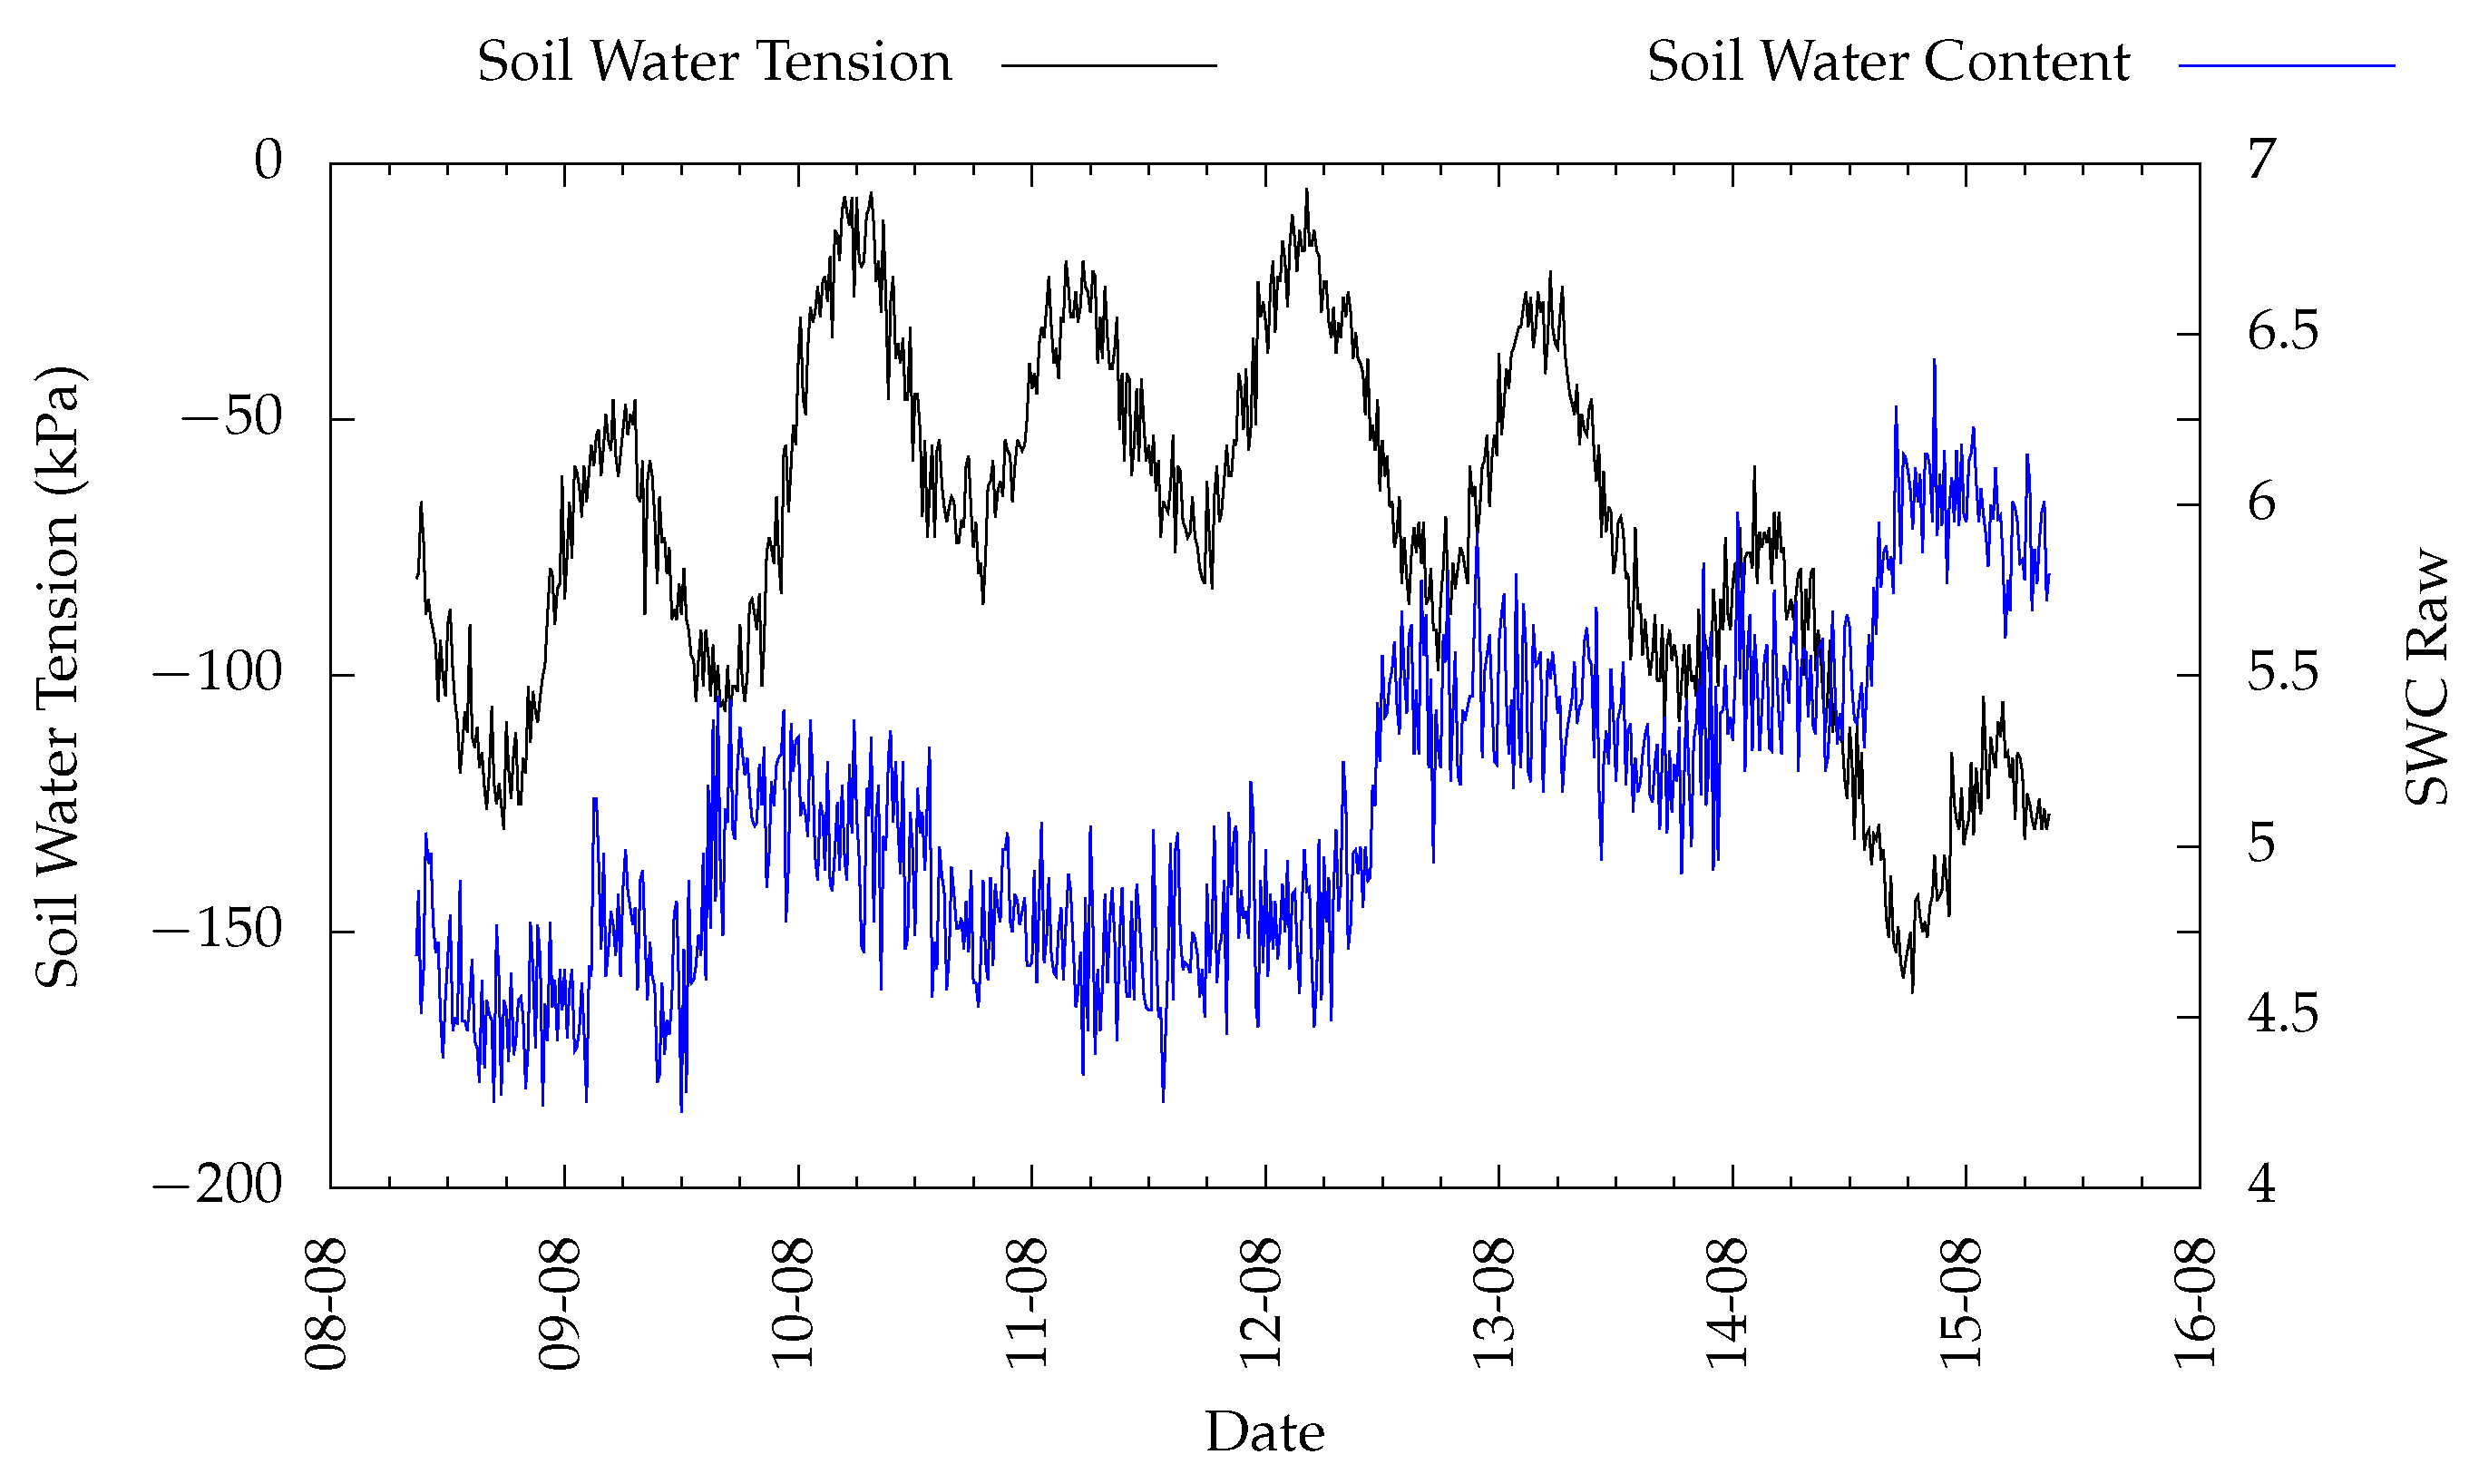
PLANT’ sensor group with stem water potential sensor (FloraPulse), leaf wetness sensor (PHYTOS 31) and the infrared radiometer sensor (SIL-411) was placed on a vine. Soil water content (TEROS 12 and SoilWatch10) and soil water potential (TEROS 21) were also placed in soil next to a vine and were connected to the module for the ‘
SOIL’ group.
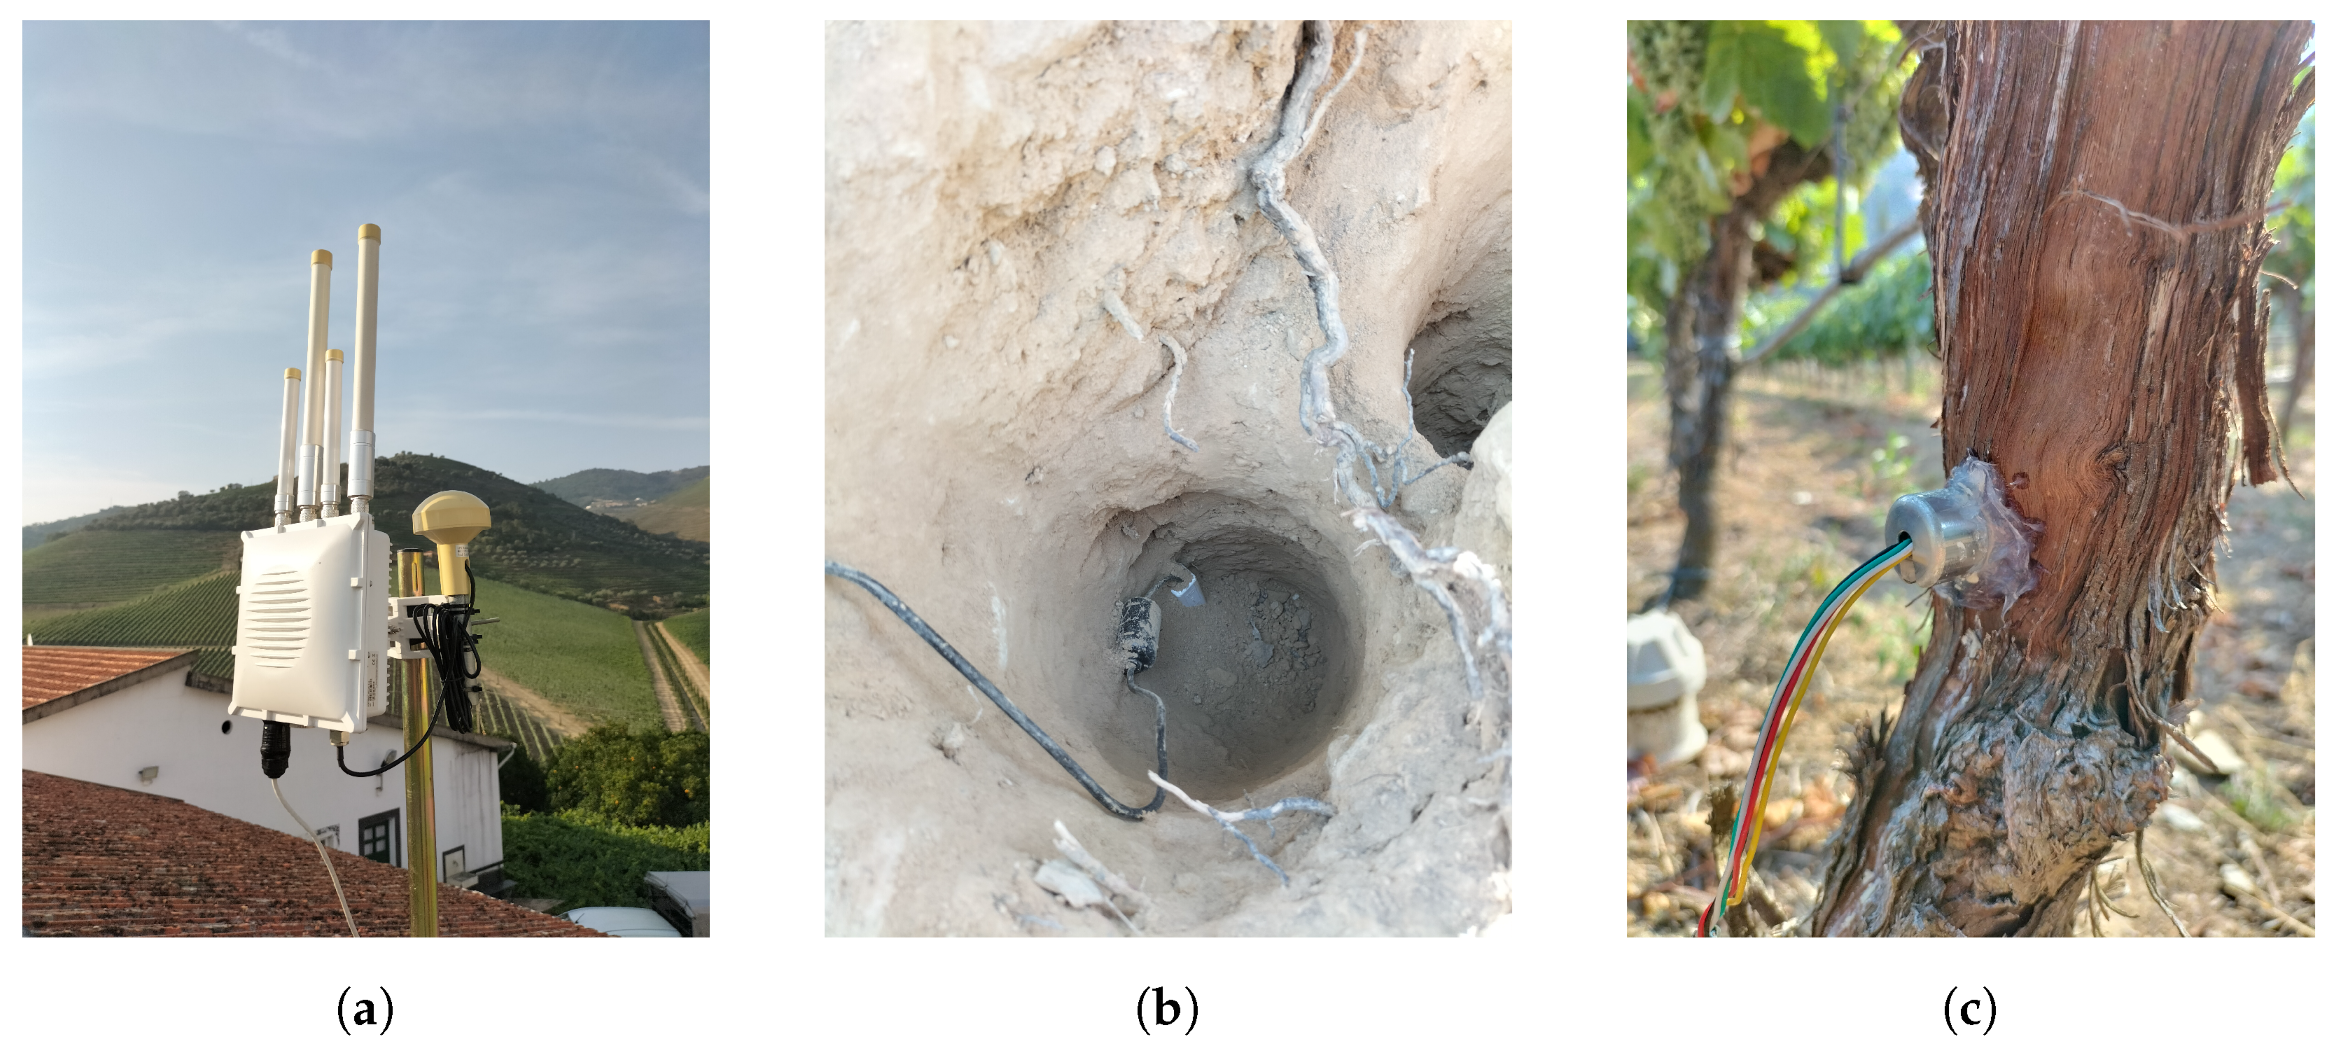
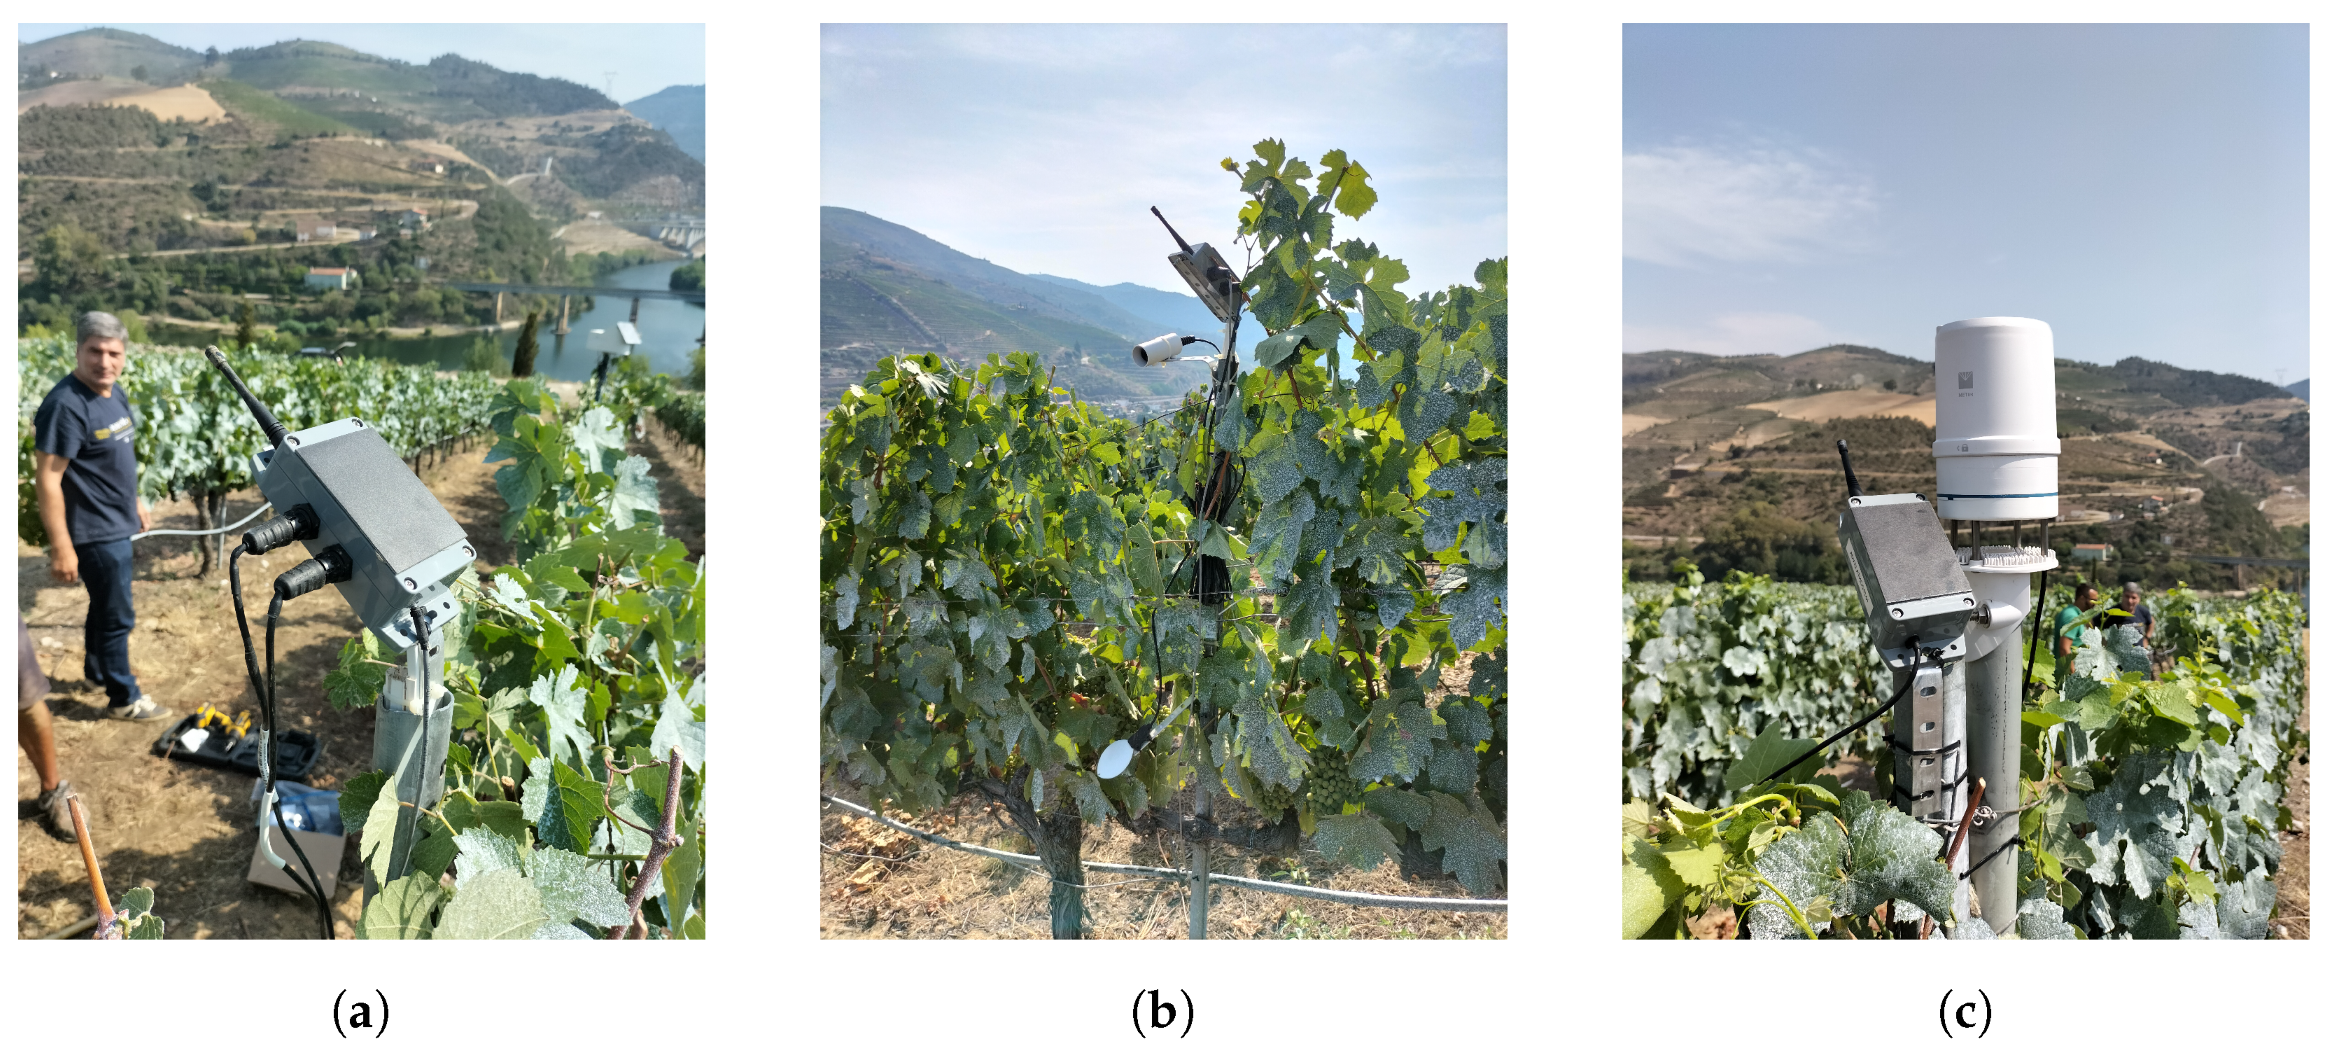
The installation of the gateway and all sensors and modules can be seen in
Figure 6 and
Figure 7.
4. Discussion
The implemented system, in terms of data communication, has been operating without losses. All eight modules have their batteries with voltage values higher than 4 V, which demonstrates that the battery–solar panel set is well-dimensioned for all modules.
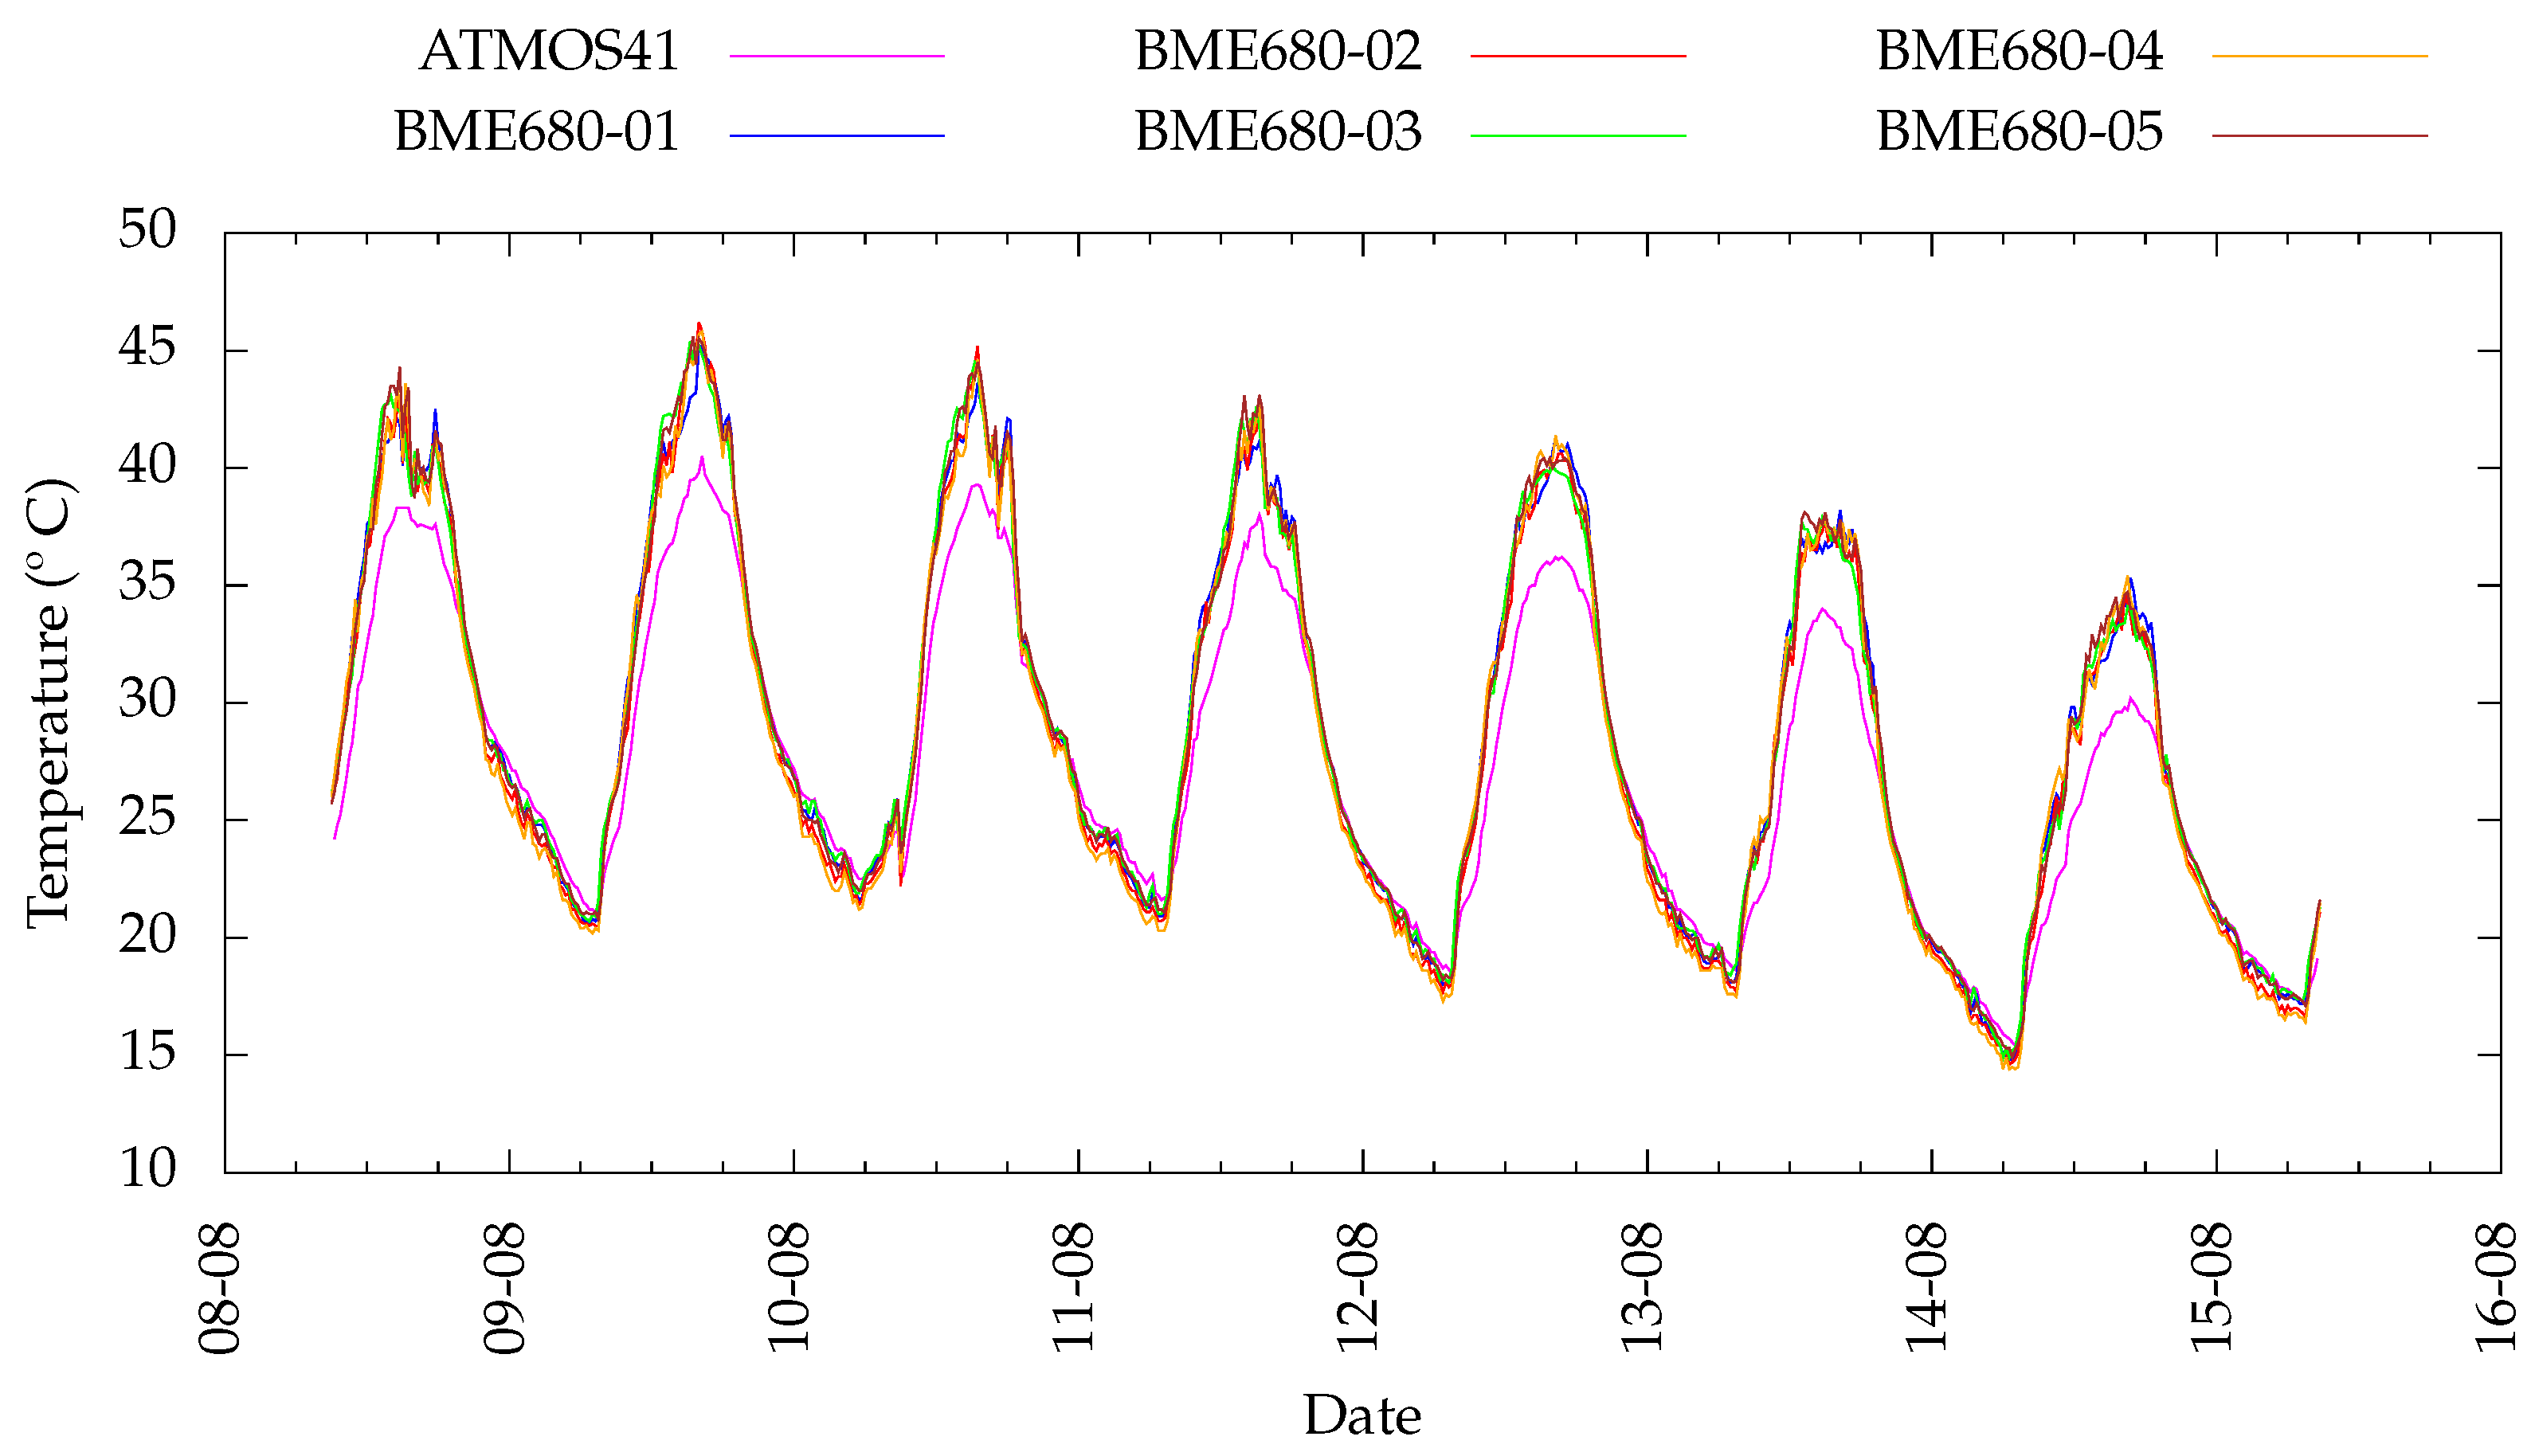
Regarding the data collected, it should be noted that there is a difference between the temperature values of the ATMOS41 and the BME680 sensors (
Figure 8). This may be due to the difference in shields, because in terms of accuracy, the two systems are nearly identical (±0.6 °C). However, the BME680 sensors use a 3D-printed PLA shield [
38] (
Figure 15), for which studies indicate that the error in the measurement of air temperature is not greater than 1.5 °C [
39]. As in the implemented system, the difference when solar radiation is high is greater (about 4 °C) than when it is low (about 2 °C); more studies will have to be carried out to determine the origin of this difference.
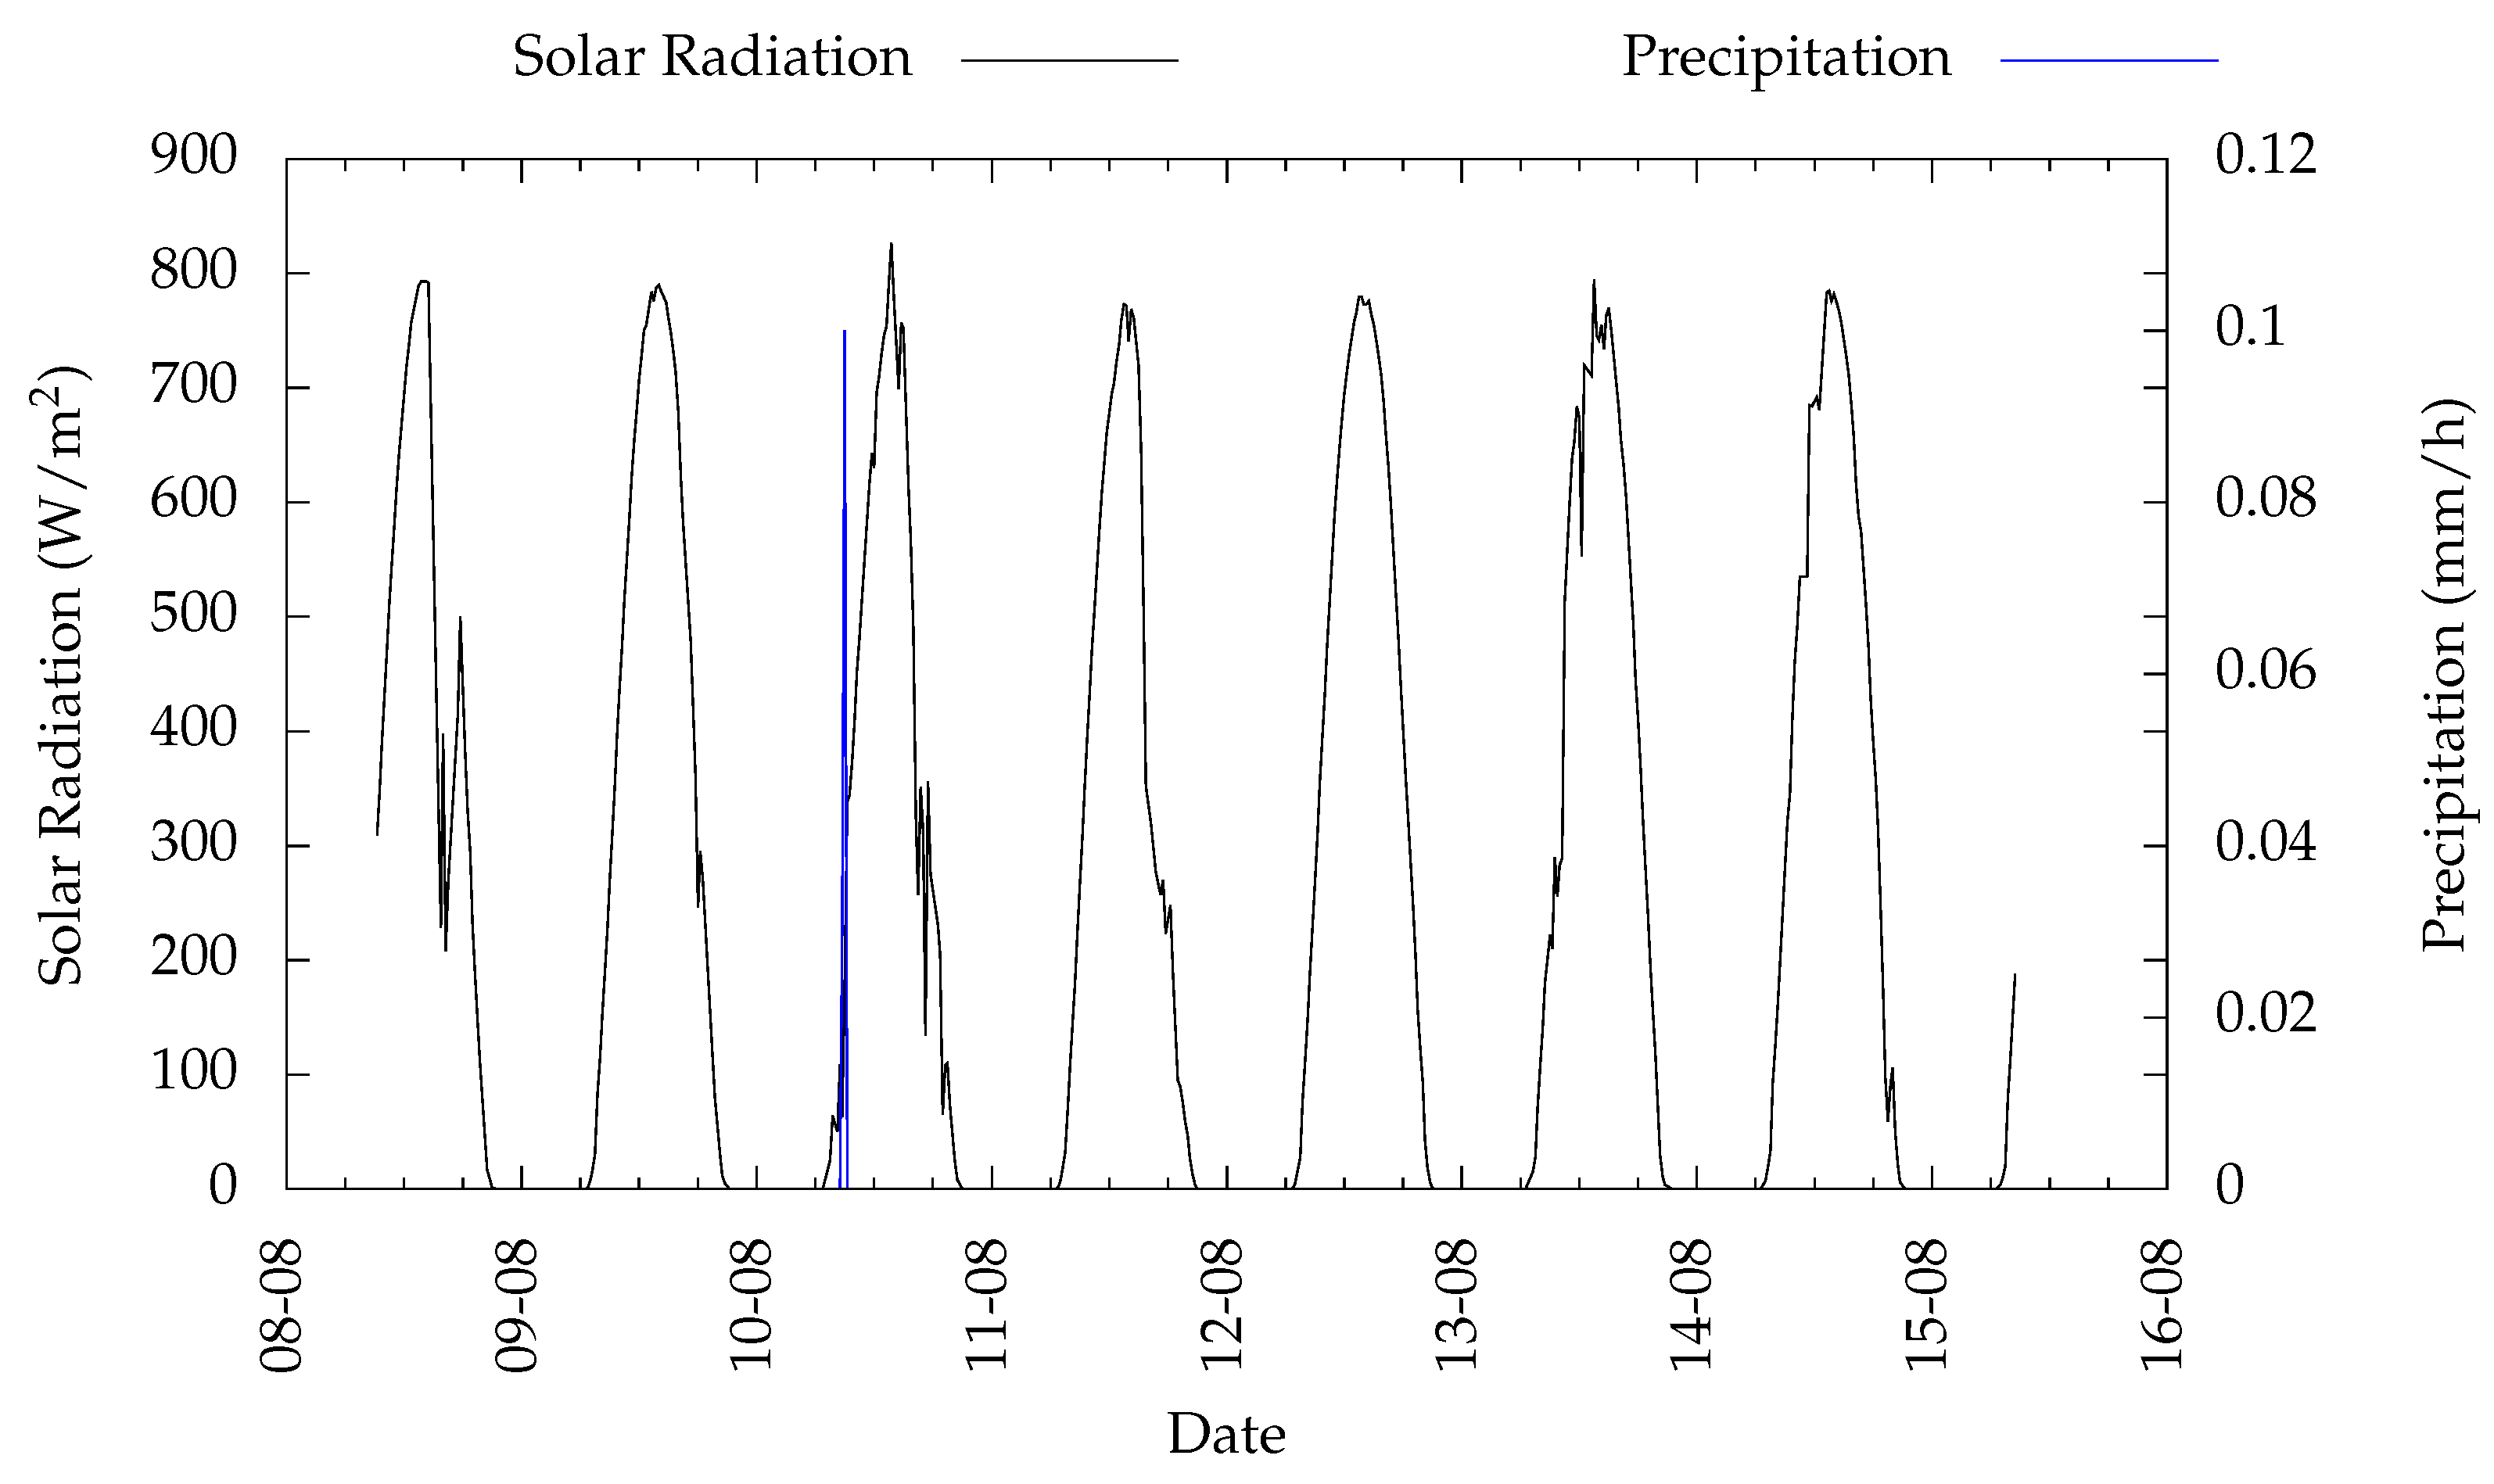
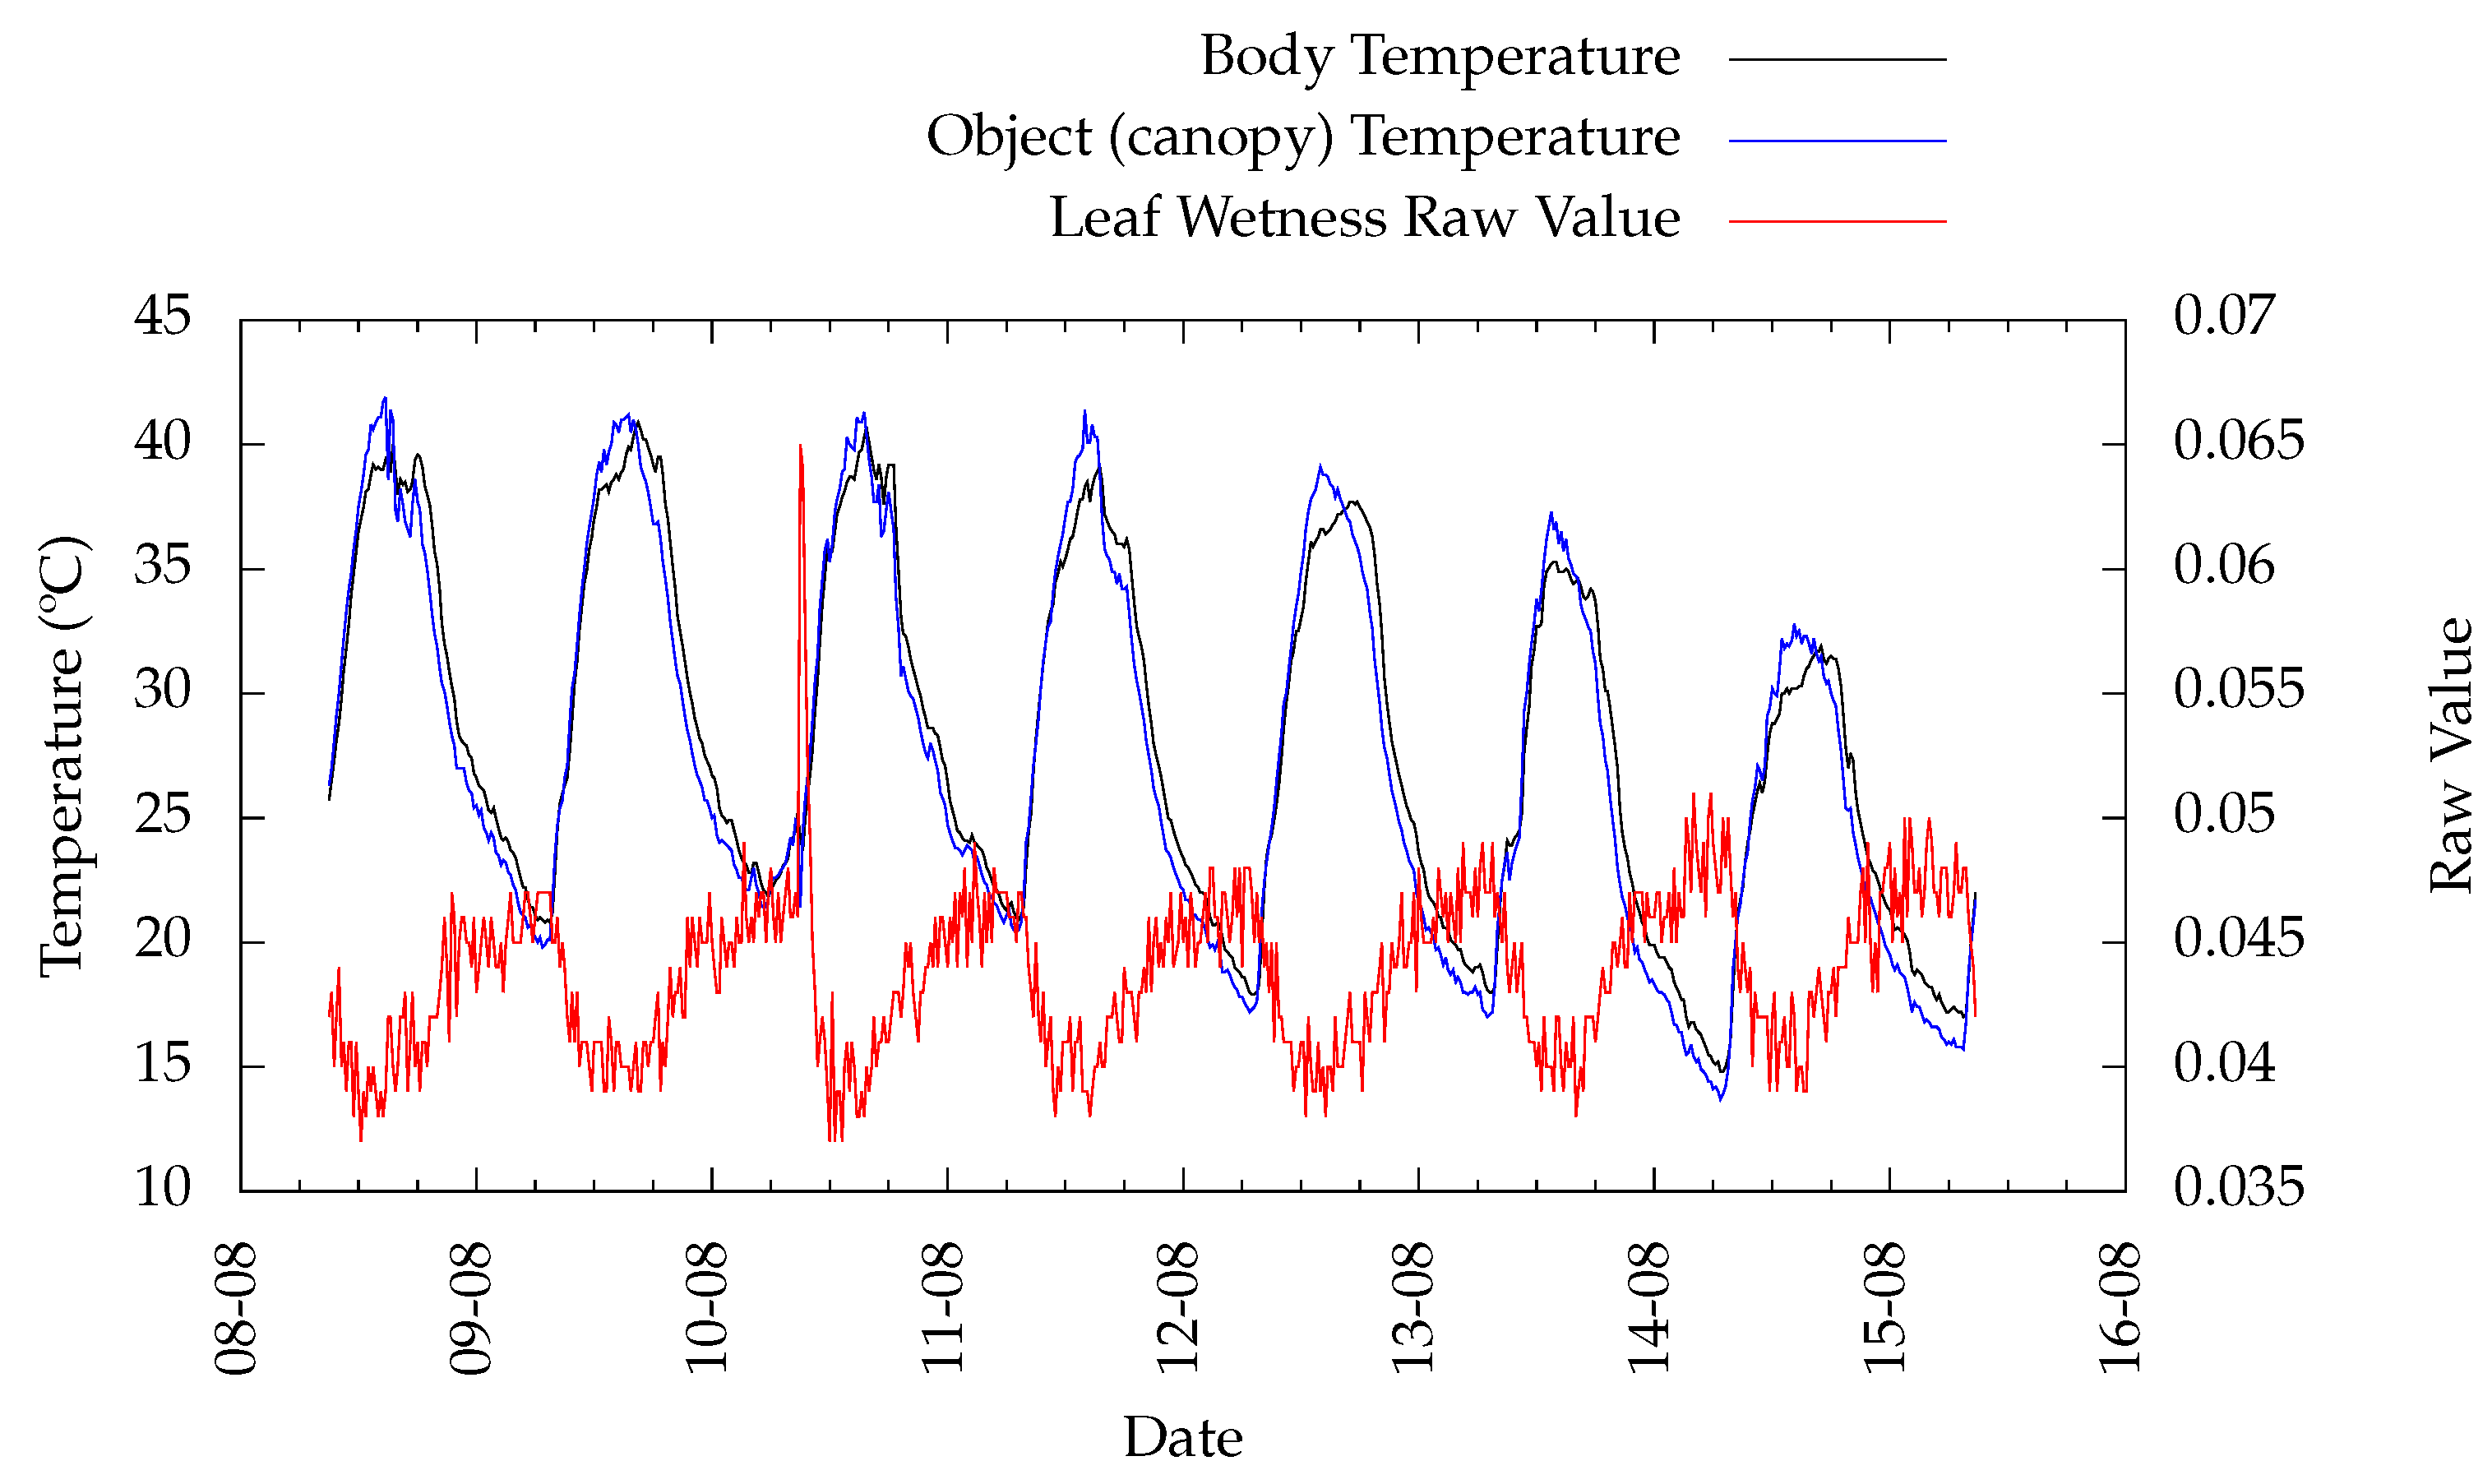
In relation to the remaining data, these are within the expected values. It should be noted that during the period presented in this study, there was only one episode of rainfall that can be observed, both in
Figure 9 on the precipitation curve, and in
Figure 11 on the leaf wetness curve.
A similar and, eventually, more generic study was developed in [
40]. On it, a low-cost, modular, Long-Range Wide-Area Network (LoRaWAN)-based IoT platform, called “LoRaWAN-based Smart Farming Modular IoT Architecture” (LoRaFarM) was proposed and aimed to improve the management of generic farms in a highly customizable way. The authors stated that the platform, built around a middleware core, is easily extensible with ad-hoc low-level modules (feeding the middleware with data coming from the sensors deployed in the farm) or high-level modules (providing advanced functionalities to the farmer). The proposed platform was evaluated on a farm in Italy, where it collected environmental data (air/soil temperature and humidity) related to the growth of farm products such as grapevines and greenhouse vegetables over a period of three months from July to September 2019. It should be noted that in their work, for soil moisture, air humidity sensors were used in water-resistant casings, which does not give the water content in the soil as is necessary and is provided by the system implemented and presented here. A web-based visualization tool for the collected data is also presented to validate the LoRaFarM architecture. In general, the LoRaFarM platform inherits its topological structure from the LoRaWAN architecture, as low-level communication patterns are built around the LoRaWAN technology. Specifically, data obtained from farm-level modules are collected by LoRaWAN-oriented End Nodes (ENs) and forwarded to a Network Server (NS) by a LoRaWAN Gateway (GW). In their case, the NS was built on The Things Network [
31], and the core middleware was developed to retrieve the data collected from the NS to feed high-layer modules (i.e., the Application Server (AS)) and to be available to end users. The results and discussion of the vineyard scenario reported are in concordance with the results we obtained and the discussion presented for the same environmental data. The actual study goes further, with data collected from plant groups, and it can be extended to other data for which the sensors are already implemented in the modules.
There are other studies that approach obtaining water stress without a wireless sensor network. As an alternative, timely optical remote sensing and non-invasive evaluation of plant water stress based on unmanned aerial vehicles (UAVs) has become common [
41]. In this study, remote and proximal sensing measurements were compared with plant physiological variables to test innovative services and support systems to farmers for optimizing irrigation practices and scheduling. The experiment was conducted in two vineyards located in Sardinia, Italy. The indicators of crop water status (crop water stress index and linear thermal index) were calculated from UAV images and ground infrared thermal images and then related to physiological measurements. Remote and proximal sensing images acquired with high-resolution thermal cameras mounted at ground level or on unmanned aerial vehicles (UAV) have spatial resolutions of a few centimetres. They can provide information accurate enough for both assessing plant water status in the field and implementing appropriate irrigation management strategies. The crop water stress index (CWSI), a thermally derived indicator of water deficit based on leaf/canopy temperature measurements, has been used to assess the water status of crops in several plants, such as grapevines, French beans, wheat, rice, maize and cotton. Many studies of plant water stress have analysed the relationships between air temperature, remote sensing indices, and physiological parameters such as stomatal conductance (Gs) and stem water potential (SWP). However, any image acquisition is costly, even when using low-cost UAV solutions. The technique applied in this study built on the use of the CWSI, which has been tested in several studies using ground and satellite data. The use of CWSI maps gives the main advantage of managing irrigation at a large scale by considering the spatial variability of vine water status and developing an approach for providing precision irrigation recommendations.
Another study was based on low-resolution thermal infrared imaging [
42]. The goal of this work was to demonstrate the capability of VineScout, a ground robot designed to assess and map vineyard water status using thermal infrared radiometry. Trials were carried out in Douro Superior (Portugal) under different irrigation treatments during the 2019 and 2020 seasons. Grapevines were non-invasively monitored at different times of the day using leaf water potential as reference indicators of plant water status. Grapevine canopy temperatures, recorded with an infrared radiometer, as well as environmental data acquired with a multispectral sensor were saved on the robot controller’s computer. The authors state that the promising outcomes gathered with VineScout using different sensors based on thermography, multispectral imaging and environmental data disclose the need for further studies considering new variables related to plant water status, and more grapevine cultivars, seasons and locations to improve the accuracy, robustness and reliability of the predictive models in the context of precision and sustainable viticulture. Leaf water potential was used as a reference indicator of the plant water status (ground truth), and its measurement was taken simultaneously with vineyard monitoring by the robot by a Schölander pressure bomb. One of the main advantages of the VineScout approach to assess plant water status is that vineyard water status variability can be mapped, expanding the concept and application of precision viticulture—in this case, precision irrigation or variable-rate irrigation to optimize water usage and efficiency. The data collected were extracted by pen drive after the map was completed.
These approaches have some advantages, but for a region such as the Demarcated Region of the Douro, with vineyards on steep slopes and a quite heterogeneous environment where conditions on one level may be very different from those on a neighbouring level, they are not the most suitable. Approaches based on wireless sensor networks are the most suitable for this region, and due to the poor GSM network coverage, LoRaWAN technology is the most suitable.
This work shows that through the combination of different technologies, it is possible, even in remote areas, to monitor atmospheric, plant and soil status remotely and in real time, overcoming the challenges of traditional methods (Schölander method) used for water status determination.
5. Conclusions
Regarding climate change, the effects of high temperatures and water scarcity are increasingly significant across the globe. For the success of agriculture, especially for vineyards, the assessment of plants’ water status is essential in order to act in a timely and conscientious manner towards efficient management of the culture and water resources. In this sense, this study leads to lower cost and a more effective way of continuously monitoring crop water status remotely and in real time, overcoming the challenges of the Schölander method. This is particularly important in regions where access to parcels and their management is difficult. Furthermore, installation of the LoRaWAN module adds value due to its reduced costs and superior range compared to WiFi or Bluetooth, which is especially valuable for applications in remote areas where cellular networks have little coverage. Altogether, this will support producers in efficient management of their farms, allowing increased quality while contributing to environmental and economic sustainability.
The developed system aims to monitor water stress of the vineyard; however, it allows for other parameters. Water stress arises as the relation between several biotic and abiotic factors. Following that, it is necessary to understand water flux in the atmosphere, plant and soil, as considered in the development of this sensor network.
The system was implemented in a Douro vineyard (Quinta dos Aciprestes) that shares the connection problems of remote areas. Through the implementation of a wireless transmission system based on LoRaWAN protocol (class A) and an online platform (Grafana) for data observation, the system has been operating without communication losses. The installed batteries present the correct voltage, demonstrating that the battery–solar panel set is well-dimensioned for all modules. Regarding the data collected, it should be noted that there is a difference between the temperature values between the ‘ATMOSPHERE’ group sensors, and more studies will have to be carried out to determine the origin of this difference. In relation to the remaining data, they are within the expected values.
As future work, all system data, together with data collected on-site with a Schölander camera and meteorological data, will eventually become training data to feed a machine learning system. This will allow more accurate estimation of the water stress of the vineyard and can be the base of an information-support decision system with one or more systems such as smart harvest, smart irrigation, etc.


 ,
, 


