1. Introduction
With the continuous development of modern society and the economy, the global consumption level continues to rise. People’s demand for poultry meat, eggs, and other poultry-related products is increasing, and the livestock and poultry farming industry bear a wide scope for development. Such a large-scale demand for livestock and poultry products will inevitably lead to a continuous expansion in the scale of the farming industry. However, in the context of tight feed grain supplies, soil resources needed for breeding, and scarce water resources, the farming industry needs to continuously improve the quality and efficiency of production. Inefficient farming methods will increasingly worsen farming pollution, leading to an increased environmental burden and deviating from the concept of environmental protection.
Sparrow ducks, commonly known as “hemp ducks”, are the main species of domestic ducks and one of the most abundant, widely distributed, and diverse species of domestic ducks in the world. Occupying about 70% or more of the total waterfowl breeding, duck breeding is roughly divided into three types: meat, egg, and both meat and egg, which have high economic value. Large-scale hemp duck farming can meet the huge market demand for poultry meat and eggs, but at the same time, it faces pressure and challenges in many aspects [
1]. As countries around the world pay attention to the ecological environment, the development of waterfowl farming has been subject to certain restrictions and regulations. Many areas have been prohibited and restricted, and the spatial range suitable for farming hemp ducks continues to shrink [
2]. At present, farming is developing in the direction of intensification and ecology. Large-scale farming and higher rearing density will have a greater impact on the temperature, humidity, ventilation, harmful gases, dust, and microbial content of poultry houses. It indirectly has a series of adverse effects on the intake, growth performance, and animal welfare of birds. For example, unreasonable duck flock density rates will lead to poor living conditions, causing physiological diseases, such as body abrasions, skin damage, and fractures. Considering animal behavior, such as pecking and fighting among a species, the unreasonable density will bear a negative impact on the efficiency and economy of the livestock and poultry industry [
3,
4].
From the above information, it can be concluded that rearing density is one of the key factors affecting livestock and poultry production on a large scale, as well as animal welfare, and the key to solving the problem of improving breeding efficiency lies in the real-time monitoring of breeding density and the reasonable scheduling of the spatial quantity of the flock: our work is focused on the former. At present, in the hemp duck farming industry, much of the counting is carried out manually or by artificial machinery, which are both very laborious. When hemp duck flocks are in motion, it further increases the difficulty of manual counting, thus affecting the breeding efficiency. In essence, the density of the hemp duck flock depends on the size of the effective activity space as well as the population size, and given the constant limitations of the current breeding area, the main factor affecting the problem is therefore the number of hemp ducks. For this reason, we focused on the hemp duck flock count.
With the development of technology, monitoring equipment plays a huge role in farming. There are various methods to monitor the behavior of individual animals, such as the insertion of chips to record physiological data, the use of wearable sensors, and (thermal) imaging techniques. Some methods employ wearable sensors attached to the feet of birds to measure their activity, but this may have an additional impact on the monitored animals [
5,
6,
7]. In particular, in commercial settings, technical limitations and high costs lead to the low feasibility of such methods. Therefore, video assessment based on optical flow would be an ideal method to monitor poultry behavior and physiology [
4]. Initially, many surveillance videos were manually observed, inefficient, and relied on the staff’s empirical judgment without standards [
8]. However, in recent years, due to the advent of the era of big data and the rapid development of computer graphics cards, the computing power of computers has been increasing, accelerating the development of artificial intelligence. Research related to artificial intelligence is increasing, and computer vision is becoming more and more widely used in animal detection.
For example, the R-CNN proposed by Girshick et al., in 2014 introduced a two-stage detection method for the first time. This method uses deep convolutional networks to obtain excellent target detection accuracy, but its many redundant operations greatly increase space and time costs, and is difficult to deploy in actual duck farms [
9,
10]. Law et al., proposed a single-stage detection method, CornerNet, and a new pooling method: corner pool. However, the method, based on key points, often encounters a large number of incorrect object bounding boxes, which limits its performance and cannot meet the high performance requirements of the duck breeding model [
11]. Duan et al., constructed the CenterNet framework on the basis of CornerNet to improve the accuracy and recall and designed two custom modules with stronger robustness to feature-level noise, but the anchor-free method is a process with key point combinations of the first two, and due to the simple network structure, time-consuming processing, low rate, and unstable measurement results, it cannot meet the requirements of high performance and high accuracy rate needed in the industrial farming of hemp ducks [
12].
Our work uses a single-stage object detection algorithm, which only needs to extract features once to achieve object detection, and its performance is higher compared to the multi-stage algorithm. At present, the mainstream single-stage target detection algorithms mainly include the YOLO series, Single Shot MultiBox Detector (SSD), RetinaNet, etc. In this paper, we transfer and apply the idea of crowd counting based on CNN to the problem of counting ducks [
13,
14]. Along with the output of the detection results, we embedded an object counting module to respond to industrialization needs. Object counting is also a common task in the computer vision community. Object counting can be divided into multi-category object counting and single-category object counting; this work employed single-category counting of a flock of hemp ducks [
15,
16,
17,
18].
The objectives that this paper hopes to achieve are:
- (1)
We built a new large-scale dataset of drake images and named it the “Hemp Duck Dataset”. The Hemp Duck Dataset contains 1500 labels for the whole body frame and head frame for duck target detection. The Hemp Duck Dataset was released for the first time by the team. We have made it public and provide the access method at the end of the article.
- (2)
This study constructed a comprehensive working baseline, including hemp duck identification, hemp duck object detection, and hemp duck image counting, to realize the intelligent breeding of hemp ducks.
- (3)
This project model introduced the CBAM module to build the CBAM-YOLOv7 algorithm.
2. Materials and Methods
2.1. Acquisition of Materials
The hemp duck is one of the most abundant, widely distributed, and diverse species of domestic ducks in China, with the characteristics of small size, feed saving, and high egg production efficiency, which is of great research value. We used the DJI Pocket 2, an extremely adaptable and flexible miniature gimbal camera, to capture the image and video datasets used in this study. Data were collected from the original waterfowl farm in Ya’an, Sichuan Province, China, founded by Professor Lin-Quan Wang, a renowned waterfowl breeder from Sichuan Agricultural University.
In the process of preparing the dataset, we first collected data from 10 different hemp duck houses by changing the image shooting angle and distance several times. Then, we manually screened and discarded some data with high repetition and some redundant data that were not captured due to the obstruction of the hemp ducks’ house. In the end, our dataset contained a total of 1500 images, including 1300 images in the training set and 200 images in the test set.
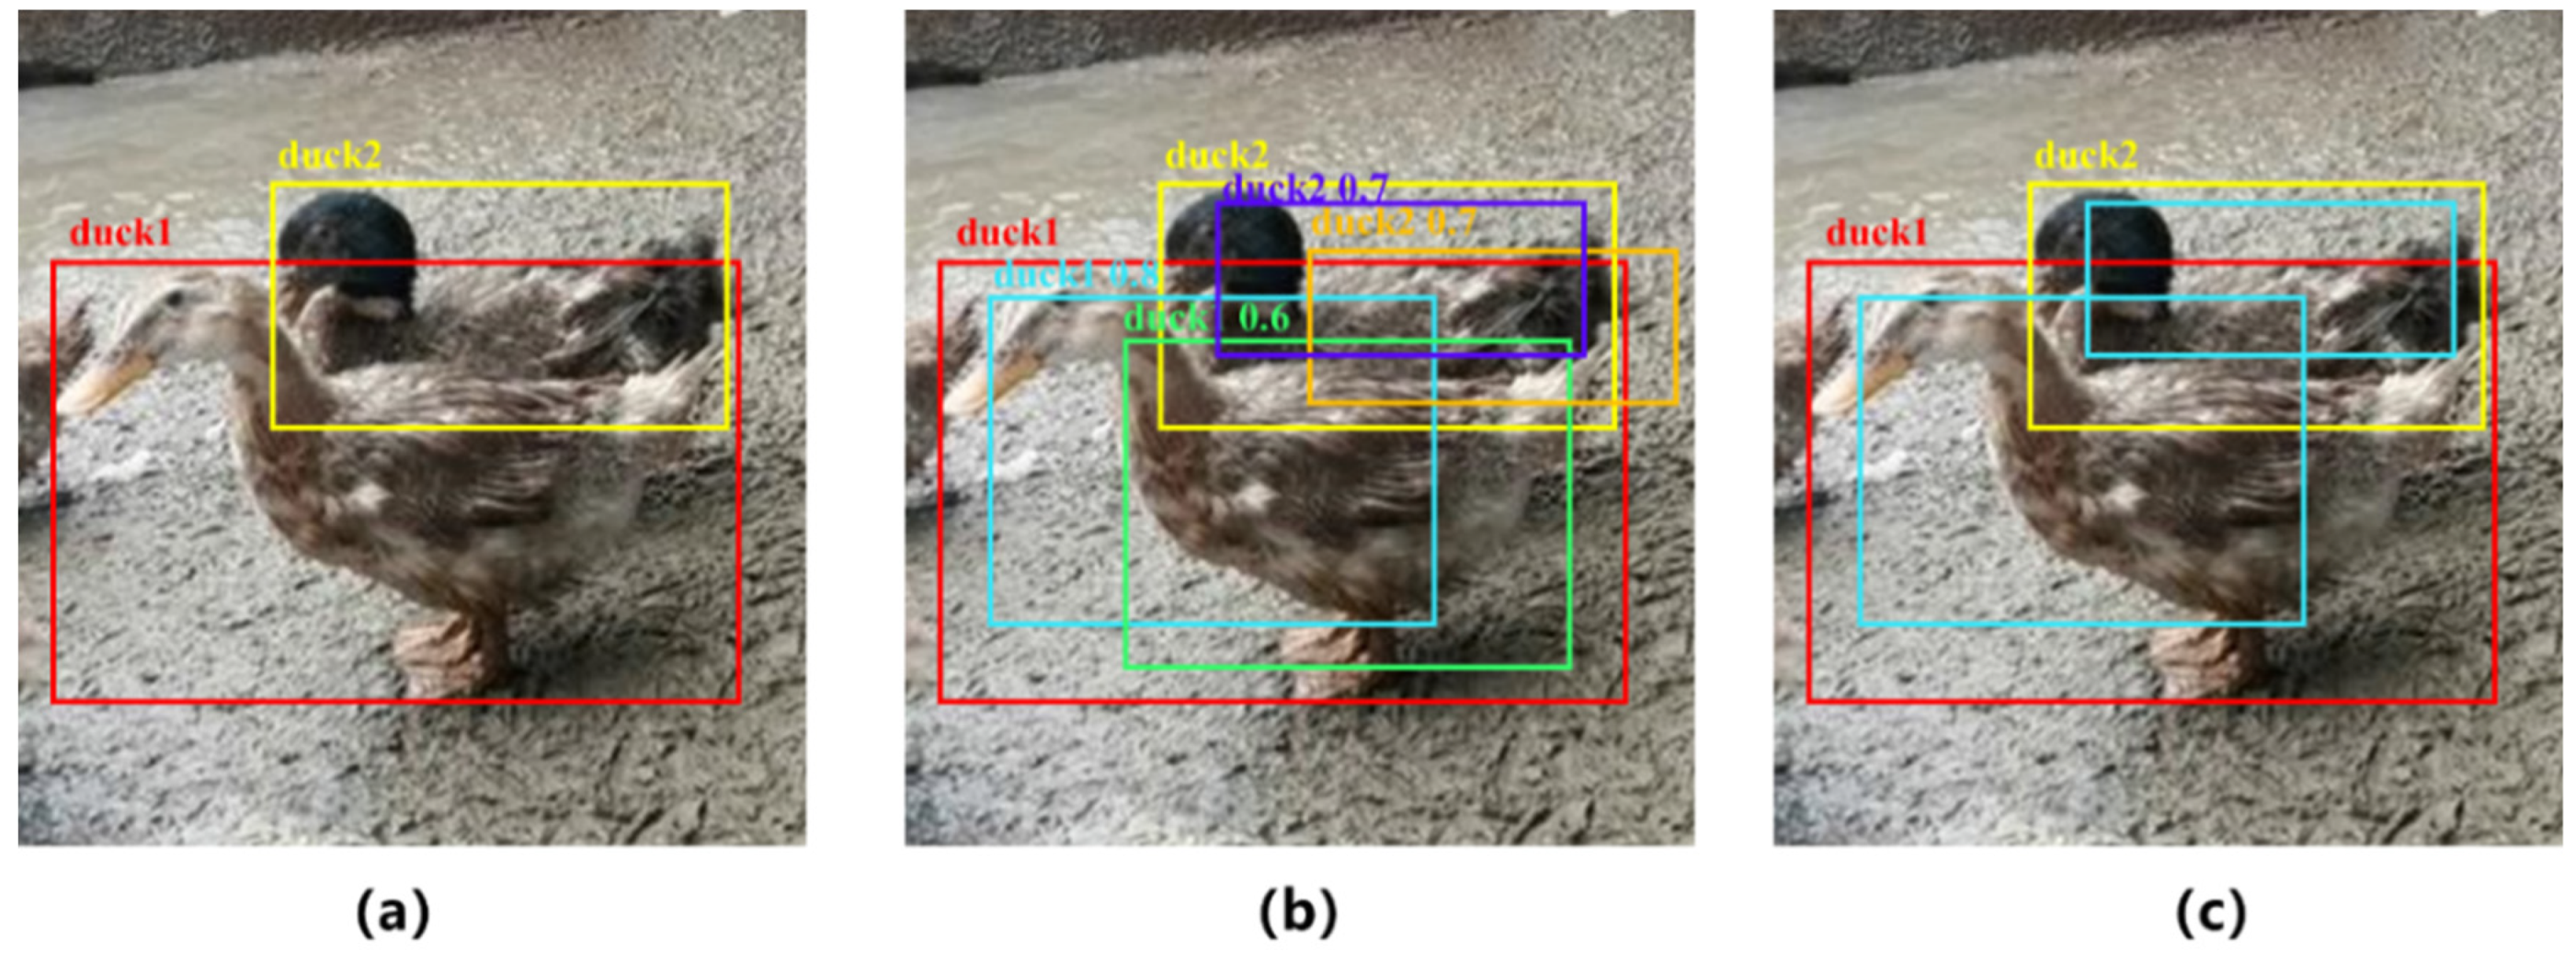
Figure 1 shows the analysis of the challenges posed by non-maximum suppression for the hemp duck detection, identification, and counting tasks.
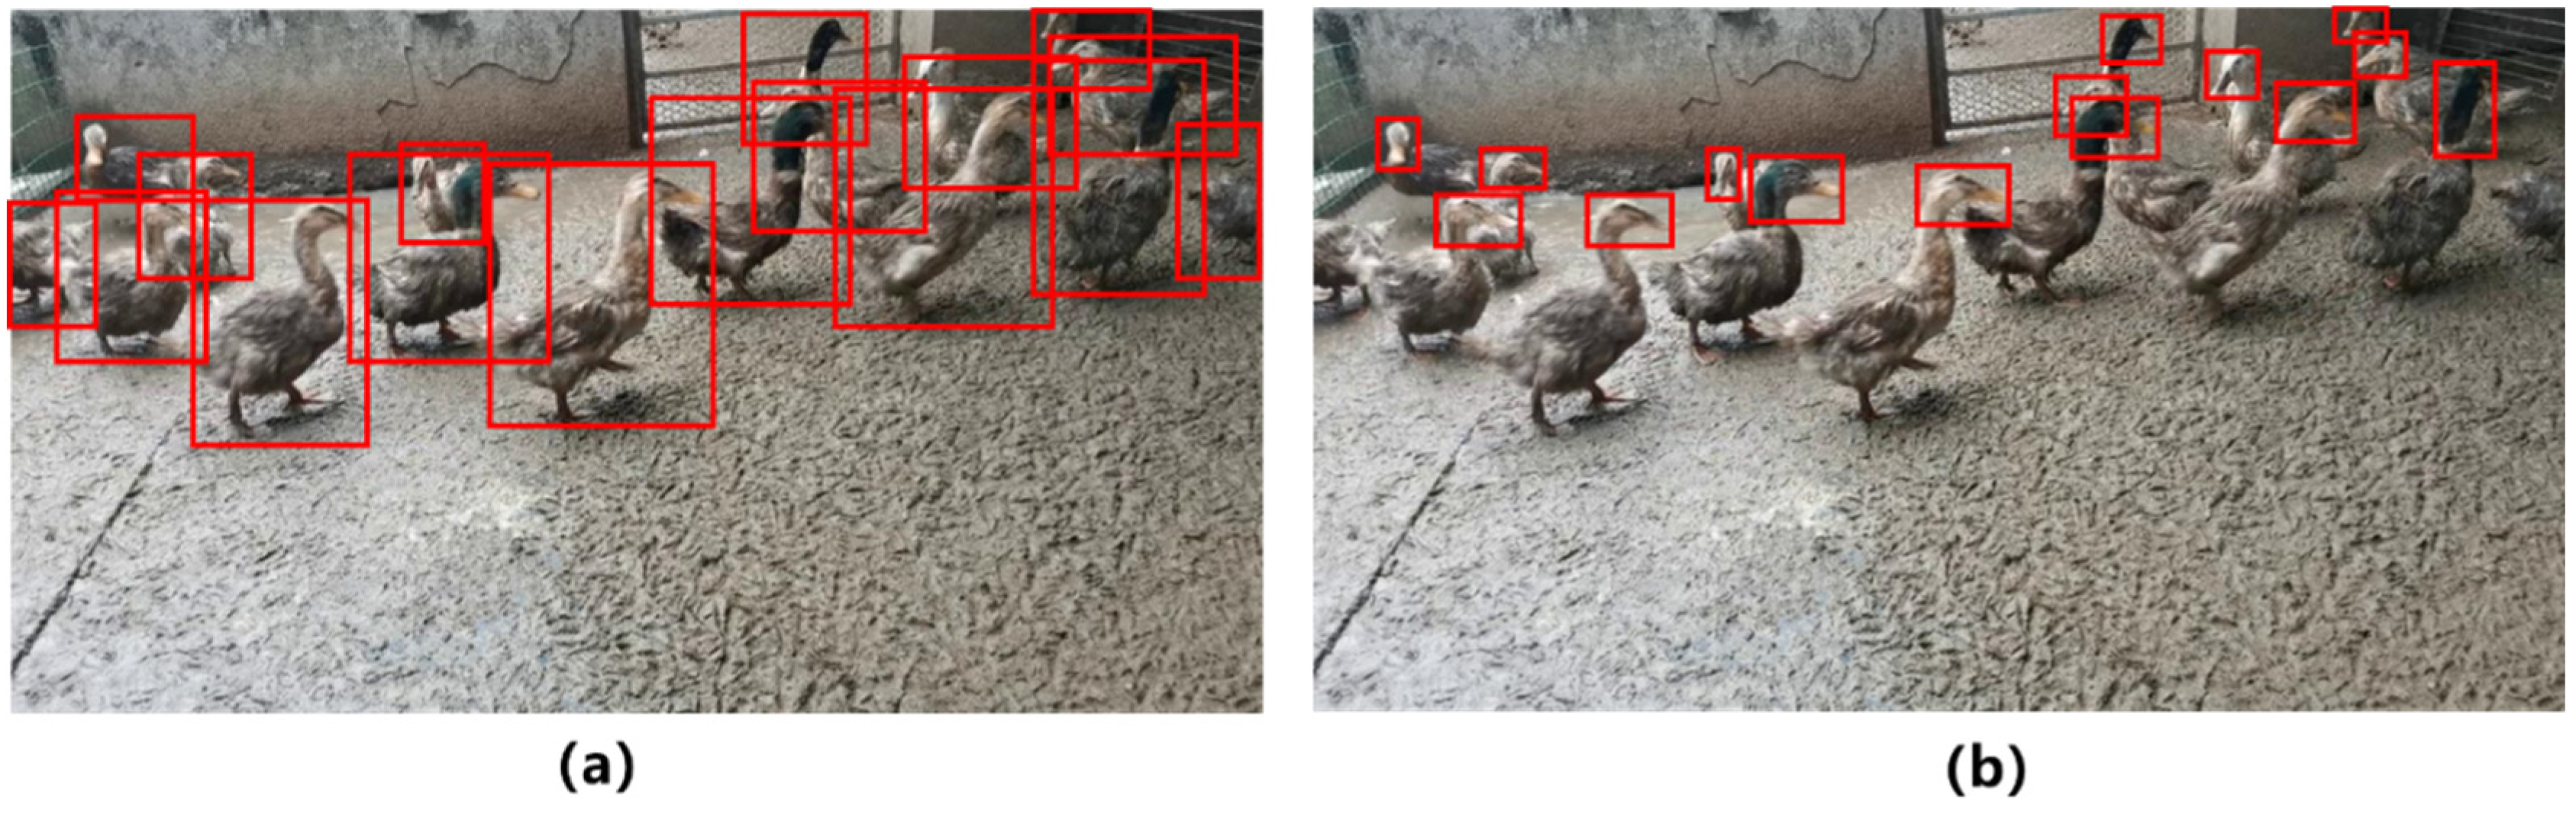
Figure 2 shows an example of a dataset labeling effort.
In the prediction phase of the object detection work, the network output multiple candidate anchor boxes, but many of them were overlapping around the same object, as shown in
Figure 1b. Non-maximum suppression was able to retain the best one among this group of candidate anchor boxes, as shown in
Figure 1c. We named two different ducks hemp duck A and hemp duck B. When hemp duck A and hemp duck B are too close, the prediction box of hemp duck A may be eliminated due to the screening of non-maximum intrusion. Therefore, it is a challenge to accurately estimate the number of dense Hemp Duck Datasets with inclusion.
Since labeling the whole hemp duck body resulted in many overlapping labeling boxes, which affected the accuracy of individual hemp duck counting, we chose the method of labeling only the hemp duck head and conducted a comparison experiment between the two.
2.2. Data Pre-Processing
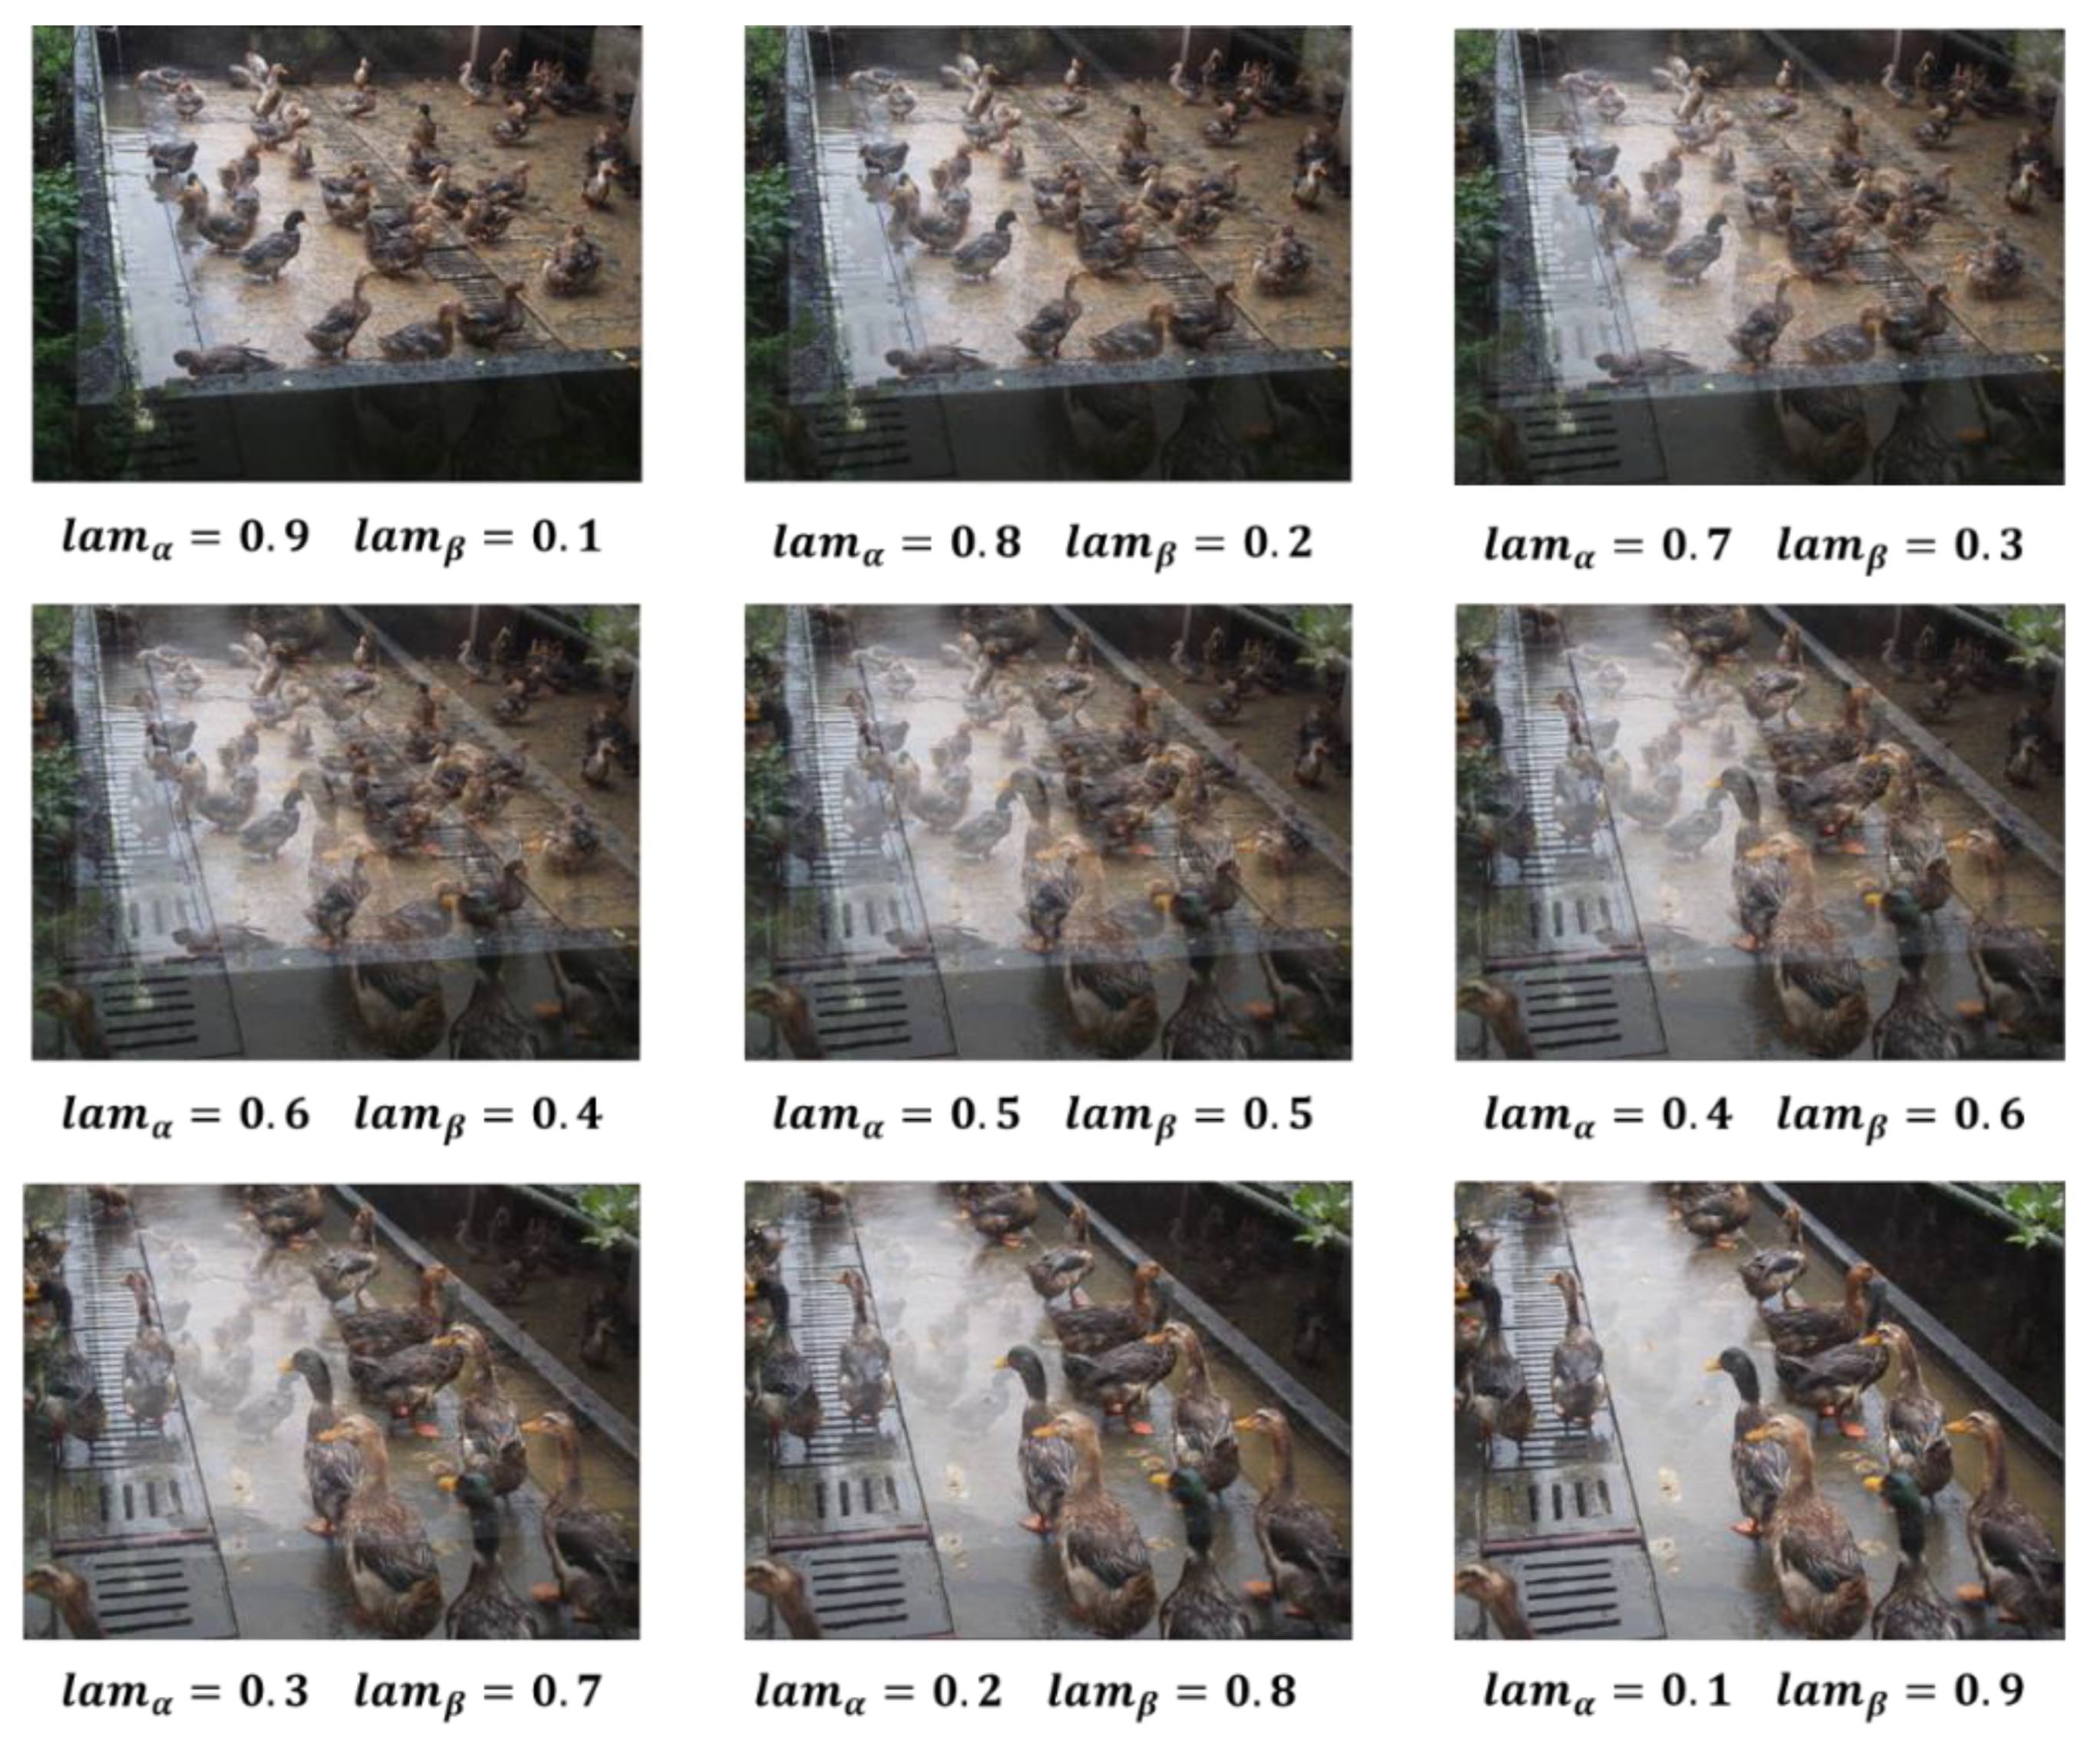
2.2.1. Mixup Data Augmentation
Mixup is an unconventional data enhancement method based on a simple data-independent data enhancement principle that uses linear interpolation to construct new training samples and labels [
19]. The formula for processing the data labels is as follows:
Among it, the two data pairs
and
are the training sample pairs in the original dataset (the training sample and its corresponding label);
is a parameter that follows the distribution of
;
is the training sample of the mixup after the data enhancement operation;
is the label of
.
Figure 3 shows the data results of the hemp ducks after the mixup data enhancement process with different fusion proportions.
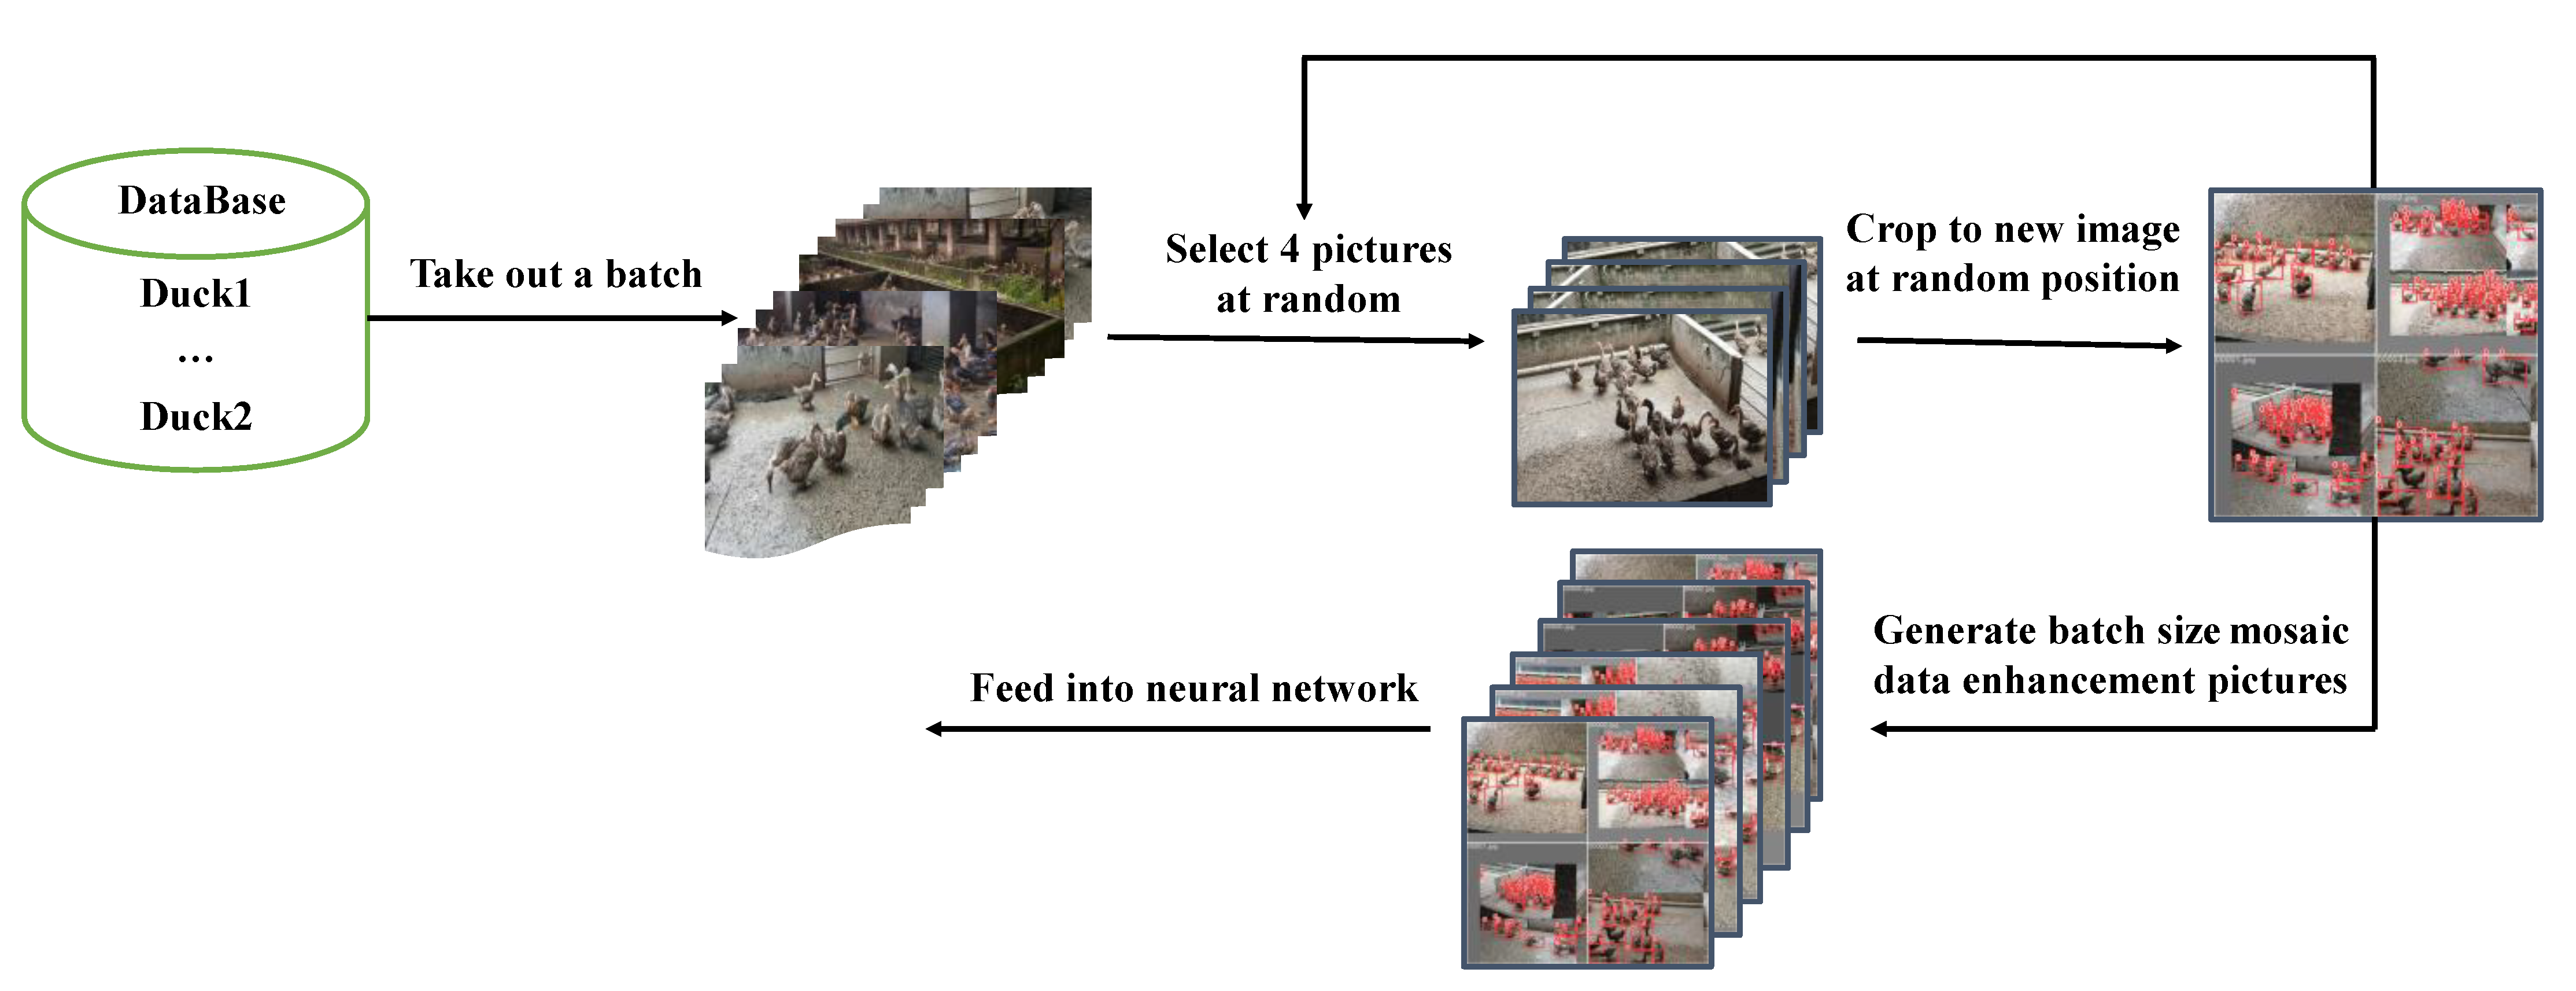
2.2.2. Mosaic Data Augmentation
The YOLOv4 network uses Mosaic data augmentation, the idea of which is to randomly cut four images and combine them into one image as newly generated training data, greatly enriching the detection dataset, making the network more robust, and reducing the GPU video memory occupation [
14].
Figure 4 represents the workflow of Mosaic’s data augmentation operation.
2.3. Experimental Environment
The GPU of the project team computer was an NVIDIA GeForce RTX3090, with 3840 CUDA stream processors and 24 GB video memory. The CPU included 14-core Intel (R) Xeon (R) gold 6330, 2.00 GHz, and 60 GB memory. The operating system was Windows 10 and PyTorch version 1.8.1, Python version 3.8, and CUDA version 11 were used.
2.4. Training Parameters
The training parameters of the training process used in the experiment are shown in
Table 1.
2.5. Evaluation Metrics
In order to evaluate the performance of the algorithm, the evaluation indices used in this study were precision (P), recall (R), mean average precision (mAP), F1 score, and frames per second (FPS).
Precision represents the proportion of positive samples in the samples with positive prediction results. The calculation formula is as follows:
Recall represents the prediction result as the proportion of the actual positive samples in the positive samples to the positive samples in the whole sample. The calculation formula is as follows:
The F1 score is the weighted average of precision and recall, calculated as follows:
Precision reflects the model’s ability to distinguish negative samples. The higher the precision, the stronger the model’s ability to distinguish negative samples. Recall reflects the model’s ability to identify positive samples. The higher the recall, the stronger the model’s ability to identify positive samples. The F1 score is a combination of the two. The higher the F1 score, the more robust the model.
The average precision (AP) is the average value of the highest precision under different recall conditions (generally, the AP of each category is calculated separately). The calculation formula is as follows:
In Pascal VOC 2008 [
20], the threshold value of the IOU is set to 0.5. If one object is repeatedly detected, the one with the highest confidence is the positive sample and the other is the negative sample. On the smoothed PR curve, the precision value of 10 bisectors (including 11 breakpoints) was obtained on the horizontal axis 0–1, and the average value was calculated as the final AP value.
The mean average precision (mAP) is the mean value of the average precision and the mean AP value of each category. The calculation formula is as follows:
where S is the number of all categories, and the denominator is the sum of the APs of all categories. The object detection object in this study was only one type of hemp duck, therefore, AP = mAP.
2.6. Related Network
In this section, the YOLOv7 algorithm is first introduced, and then the improvement proposed in this paper of adding an attention mechanism to YOLOv7 is introduced in detail [
13].
2.6.1. YOLOv7
In this paper, a recognition and detection algorithm based on computer vision is proposed for object detection and population statistics of farm ducks. By using this algorithm, breeders can obtain the quantity and behavior dynamics of mallard ducks in real time so as to realize the rapid management and strategy formulation of farms, optimize the reproduction rate and growth of ducks, and help to maximize the economic benefits.
In view of the small density of individuals in the duck population and the real-time requirement of population statistics, we chose the latest Yolov7 model. You Only Look Once (Yolov7) is a single-stage object detection algorithm.
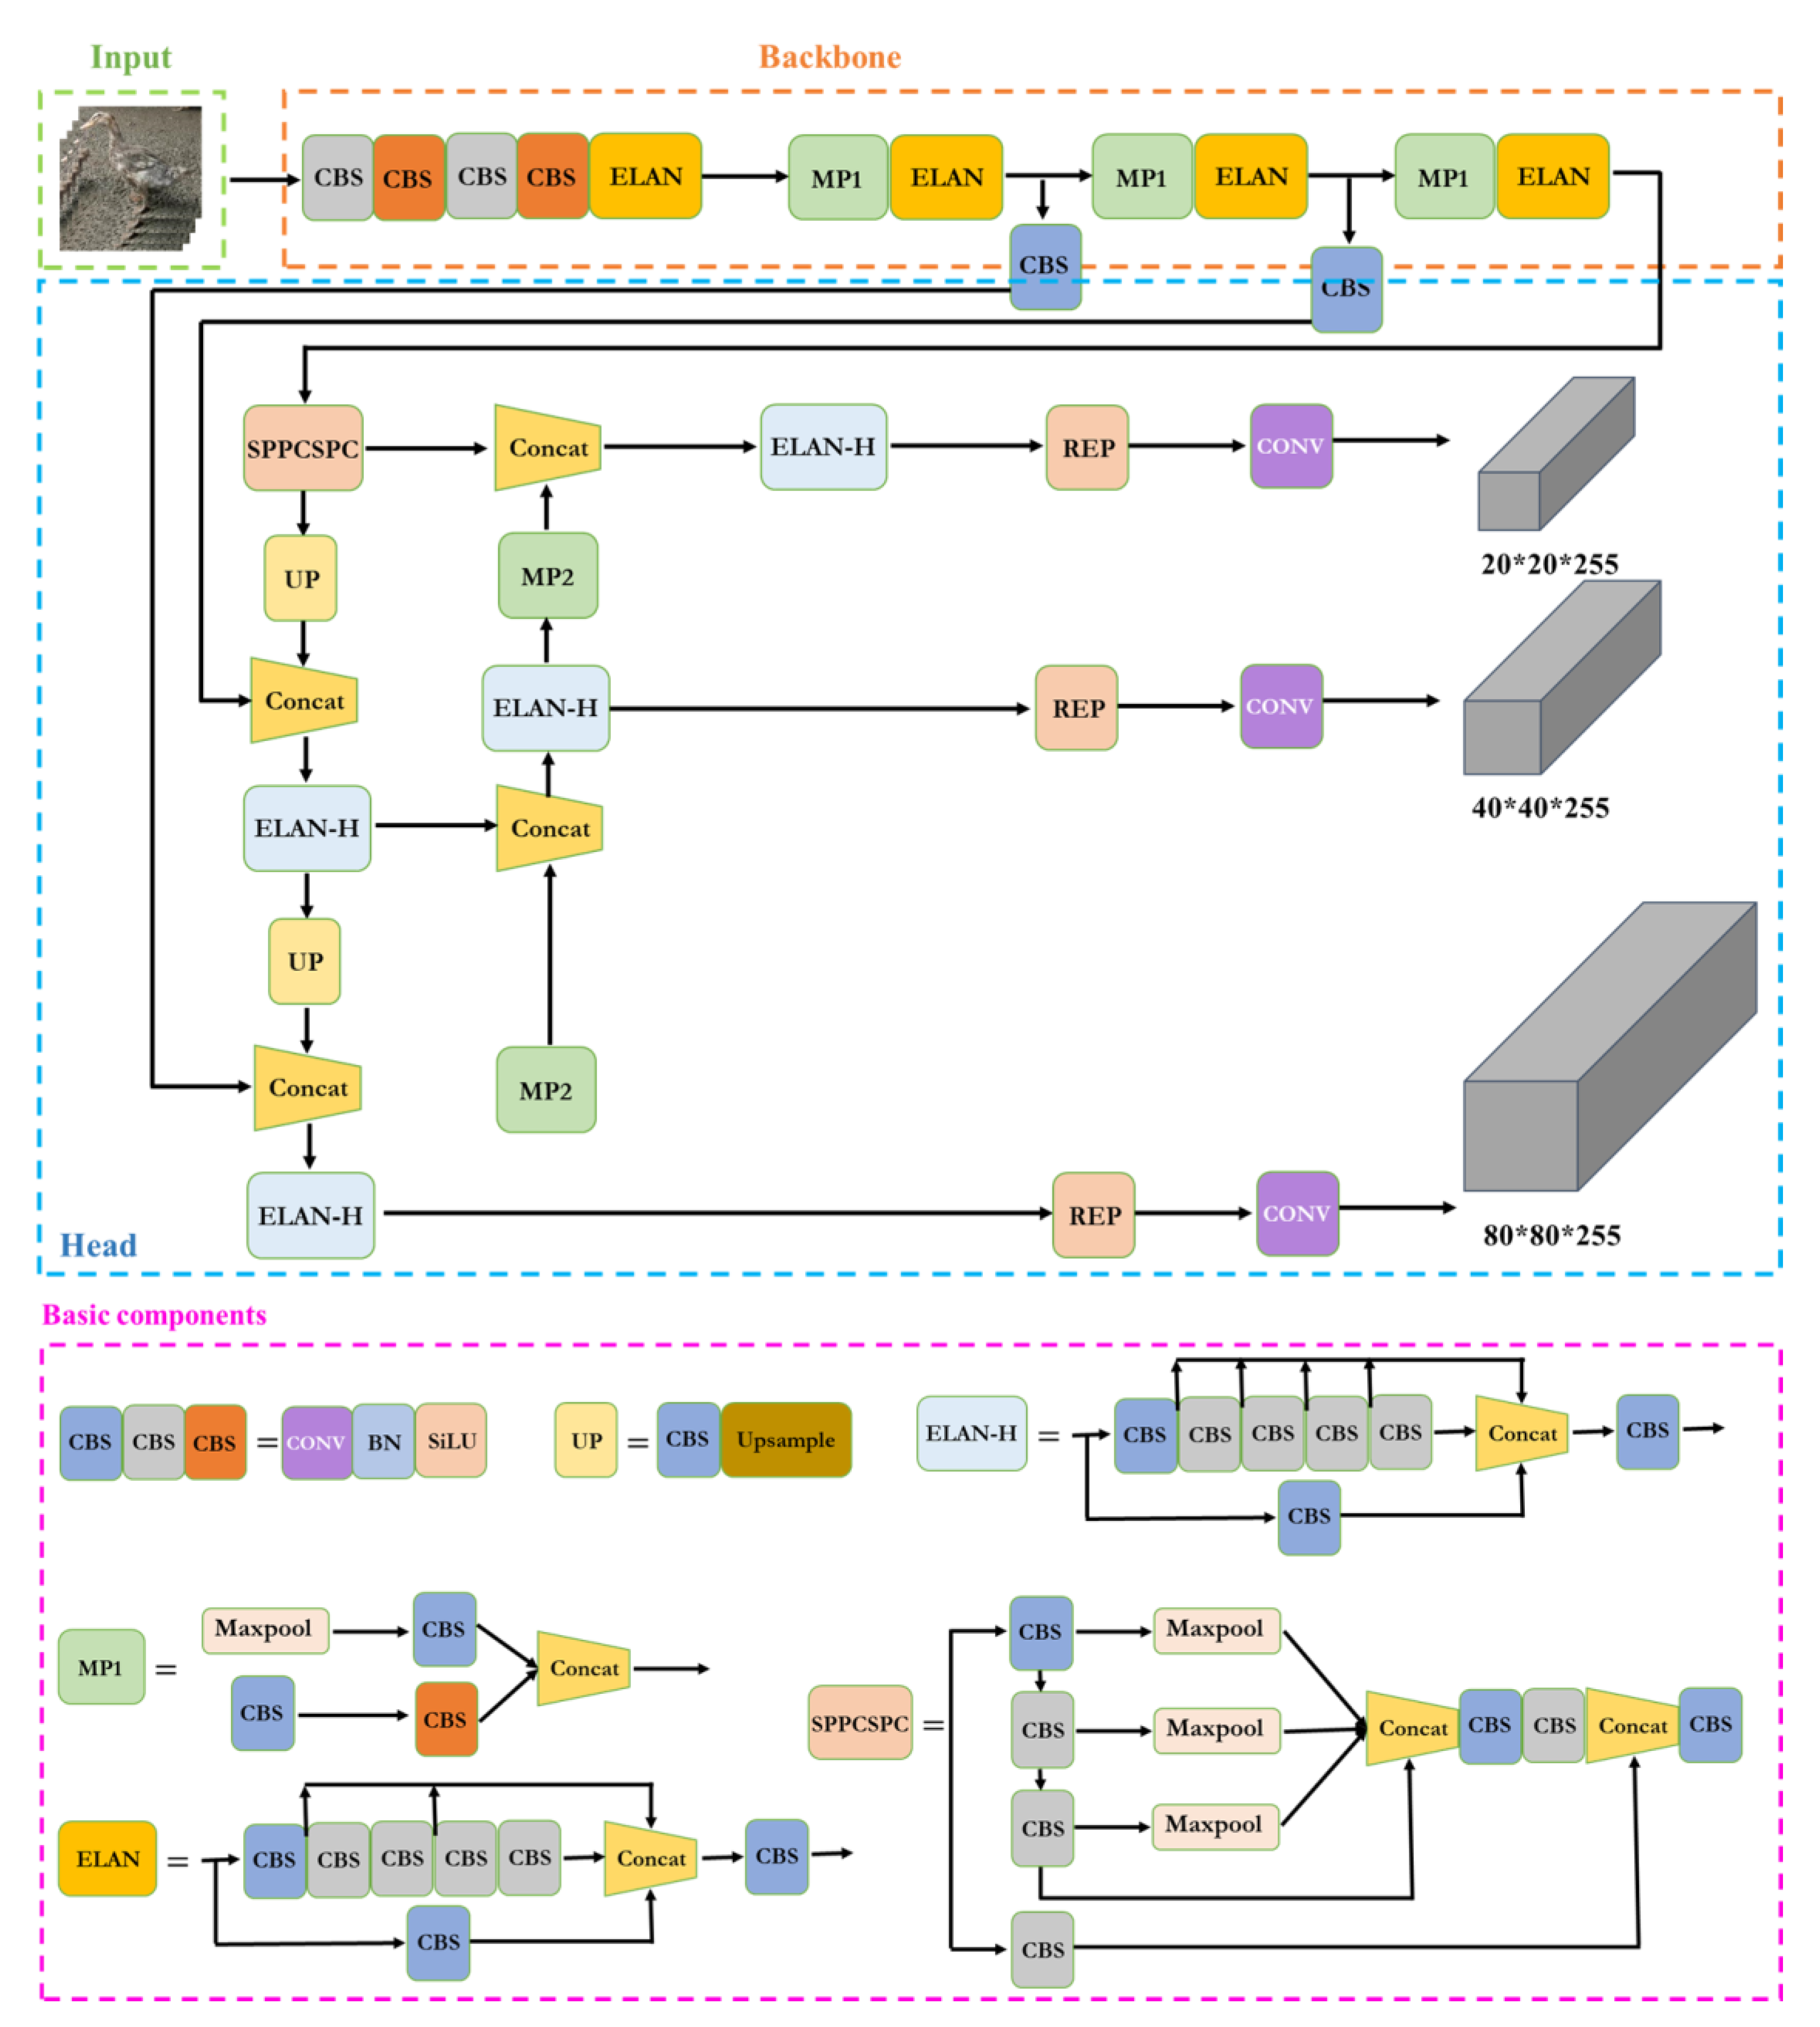
Figure 5 shows the network structure diagram of Yolov7 [
13]. The Yolov7 model preprocessing method is integrated with Yolov5, and the use of Mosaic data augmentation is suitable for small object detection [
13,
14,
21]. In terms of architecture, extended ELAN (E-ELAN) based on ELAN is proposed. Expand, shuffle, and merge cardinality are used to continuously enhance the learning ability of the network without destroying the original gradient path. Group convolution is used to expand the channel and cardinality of the computing block in the architecture of the computing block. Different groups of computational blocks are guided to learn more diverse features [
13].
Then, it focuses on some optimization modules and methods known as trainable “bag-of-freebies” [
13], including the following:
RepConv without identity connection is used to design the architecture of planned reparametrized convolution, which provides more gradient diversity for different feature maps [
22].
The auxiliary detection head is introduced, and the soft labels generated by the optimization process are used for lead head and auxiliary head learning. Therefore, the soft labels generated from it should better represent the distribution and correlation between source data and object and obtain more accurate results [
23].
- (1)
The batch normalization layer is directly connected to the convolution layer so that the normalized mean and variance of the batch are integrated into the deviation and weight of the convolution layer in the inference stage.
- (2)
By using the addition and multiplication method of implicit knowledge in YOLOR combined with the convolution feature map, it can be simplified into vectors by precomputation in the inference stage so as to combine with the deviation and weight of the previous or subsequent convolution layer [
24].
- (3)
The EMA model is used purely as the final inference model. Finally, real-time object detection can greatly improve the detection accuracy without increasing the reasoning cost so that the speed and accuracy in the range of 5–160 FPS exceed all known object detectors, and fast response and accurate prediction of object detection can be achieved [
25].
2.6.2. Improved YOLOv7 with Attention Mechanism
The attention mechanism is a common data processing method that is widely used in machine learning tasks in various fields [
26]. The core idea of the attention mechanism of computer vision is to find the correlation between the original data, and then highlight the important features, such as channel attention, pixel attention, multi-order attention, and so on.
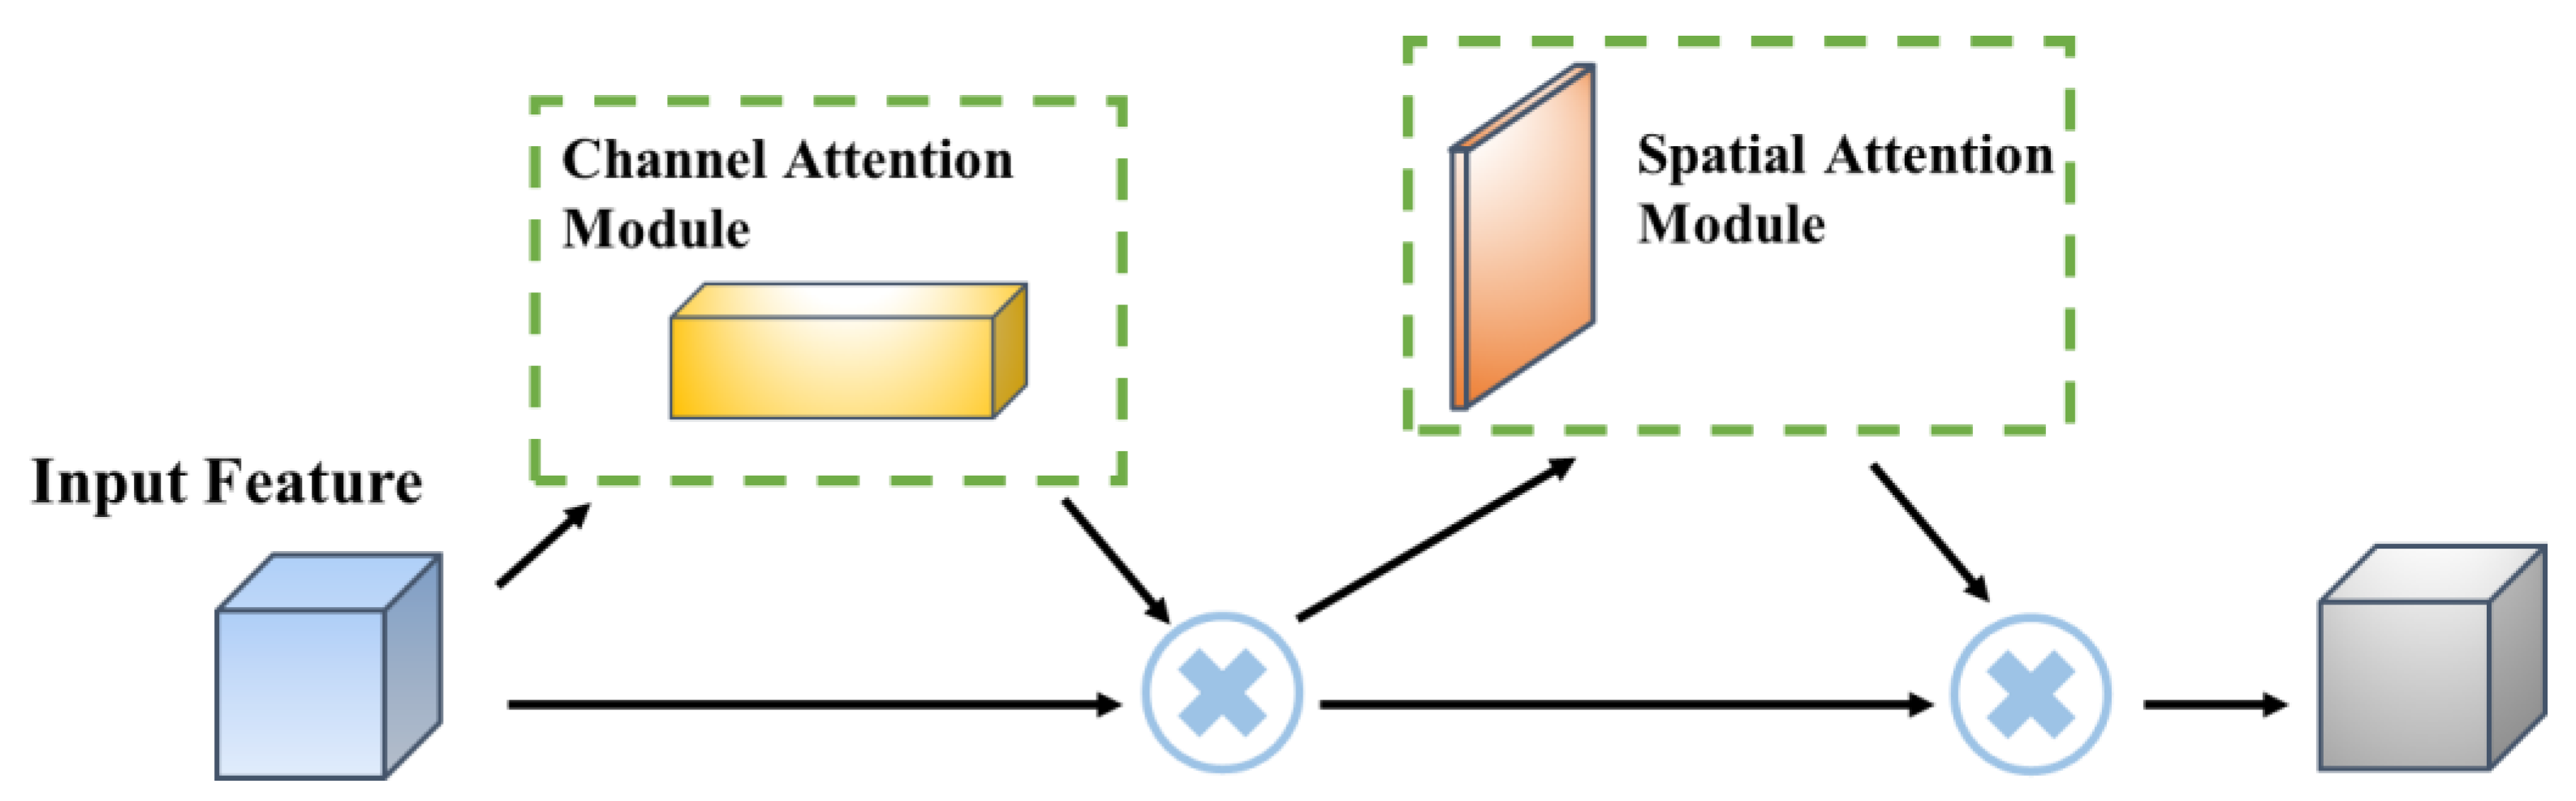
The CBAM mainly includes a channel attention module and a spatial attention module [
10]. The module structure is shown in
Figure 6.
CBAM [
27] is a lightweight attention module, which can perform attention operations in the channel and spatial dimensions. It is composed of a channel attention module (CAM) and a spatial attention module (SAM). The CAM can make the network pay more attention to the foreground of the image and the meaningful area, while the SAM can make the network pay more attention to a position rich in contextual information of the whole picture [
28,
29].
2.6.3. YOLOv7 Introduces the CBAM Attention Mechanism
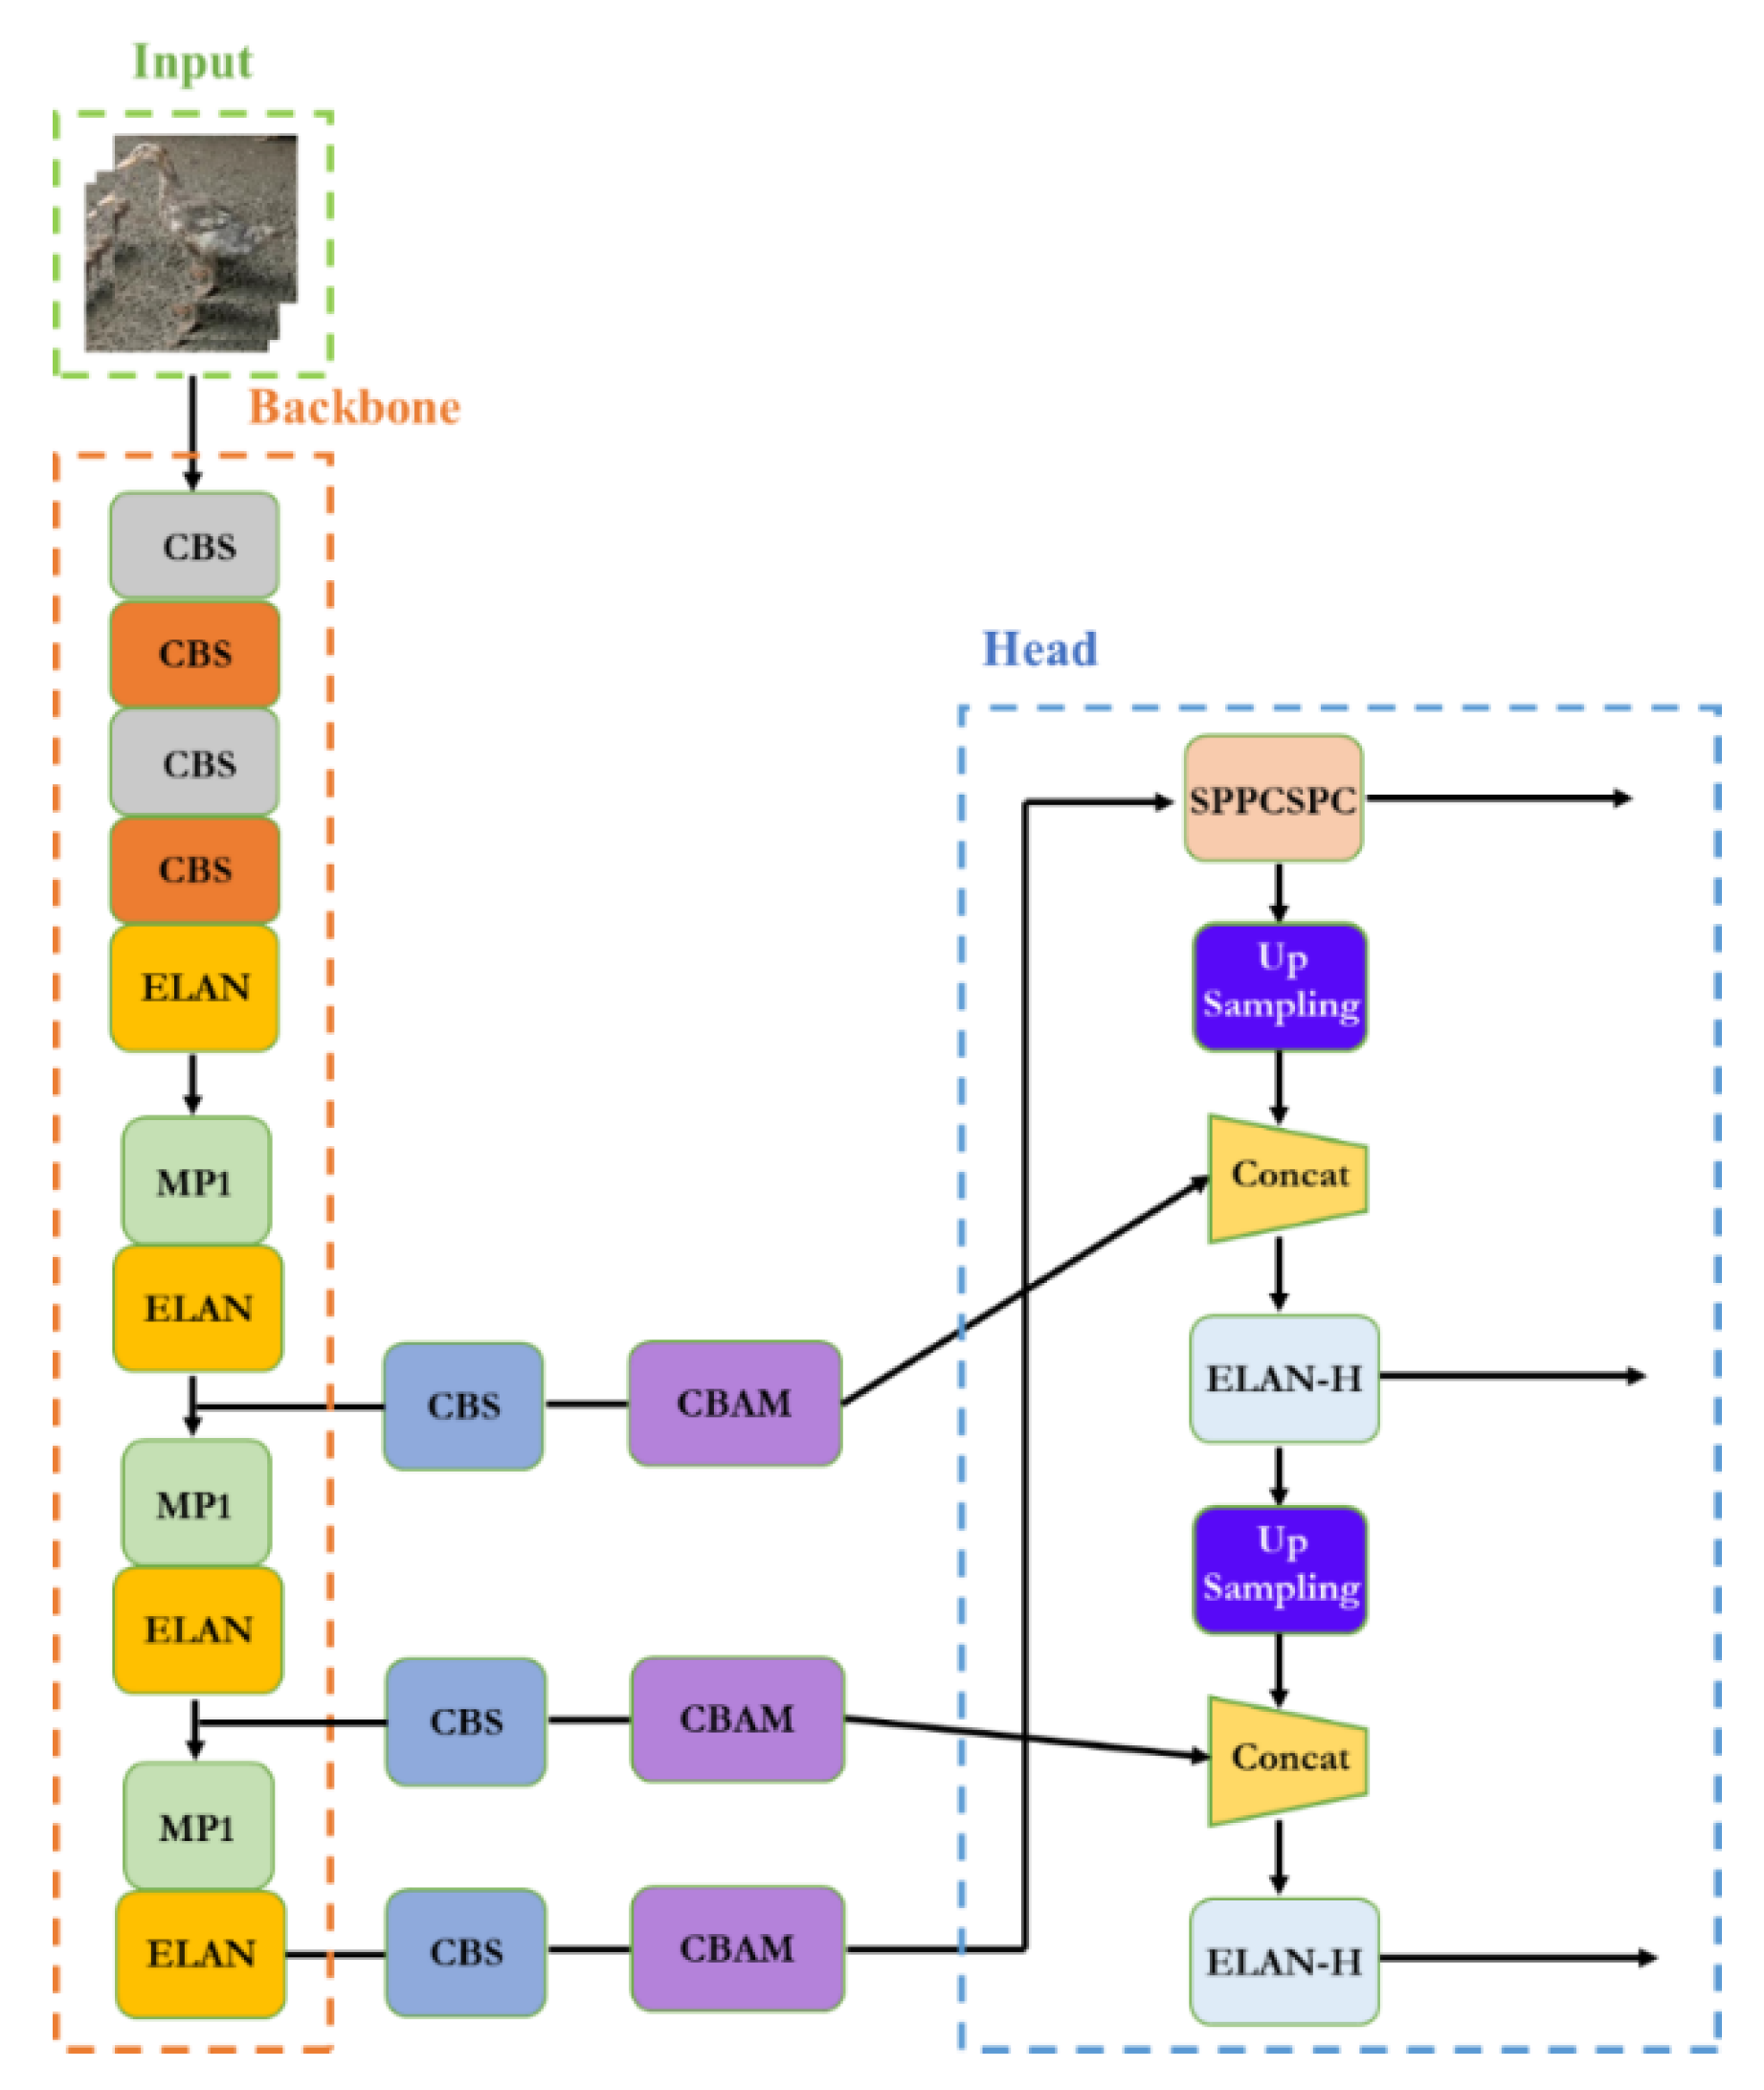
The CBAM attention mechanism was added to the YOLOv7 network structure [
13,
27], and the network structure is shown in
Figure 7. The function of this module is to further improve the feature extraction ability of the feature extraction network. Once we added the attention mechanism to the backbone network, the attention mechanism module destroyed some of the original weights of the backbone network. This led to errors in the prediction results of the network. In this regard, we chose to add the attention mechanism to the part of enhancing feature network extraction without destroying the original features of network extraction.
The CBAM attention mechanism works as follows:
In the channel attention module, the input feature map of H
W
C is subjected to a global max pooling (GMP) and a global average pooling (GAP), and two feature maps with a size of 1
1
C are obtained. The two feature maps are sent to a two-layer multilayer perceptron. The number of neurons in the first layer of the MLP is C/r (r is the reduction rate), and the activation function is ReLU. The number of neurons in the second layer is C, and the weights of these two layers of neural networks are shared. Then, the output features are added based on element-wise computation, and the final channel attachment feature is generated through sigmoid activation. Finally, the channel attention feature is multiplied by the original input feature map to obtain the input feature of the spatial attention module [
10].
In the spatial attention module, the feature map in the previous step is used as the input.
After GMP and GAP, two feature maps with a size of H × W × 1 are obtained. Then the Concat operation is performed. After the dimensionality reduction of the feature map, the spatial attention feature is generated by sigmoid activation. Finally, the spatial attention feature is multiplied by the input feature map to obtain the final feature map [
27].
3. Experiment Results
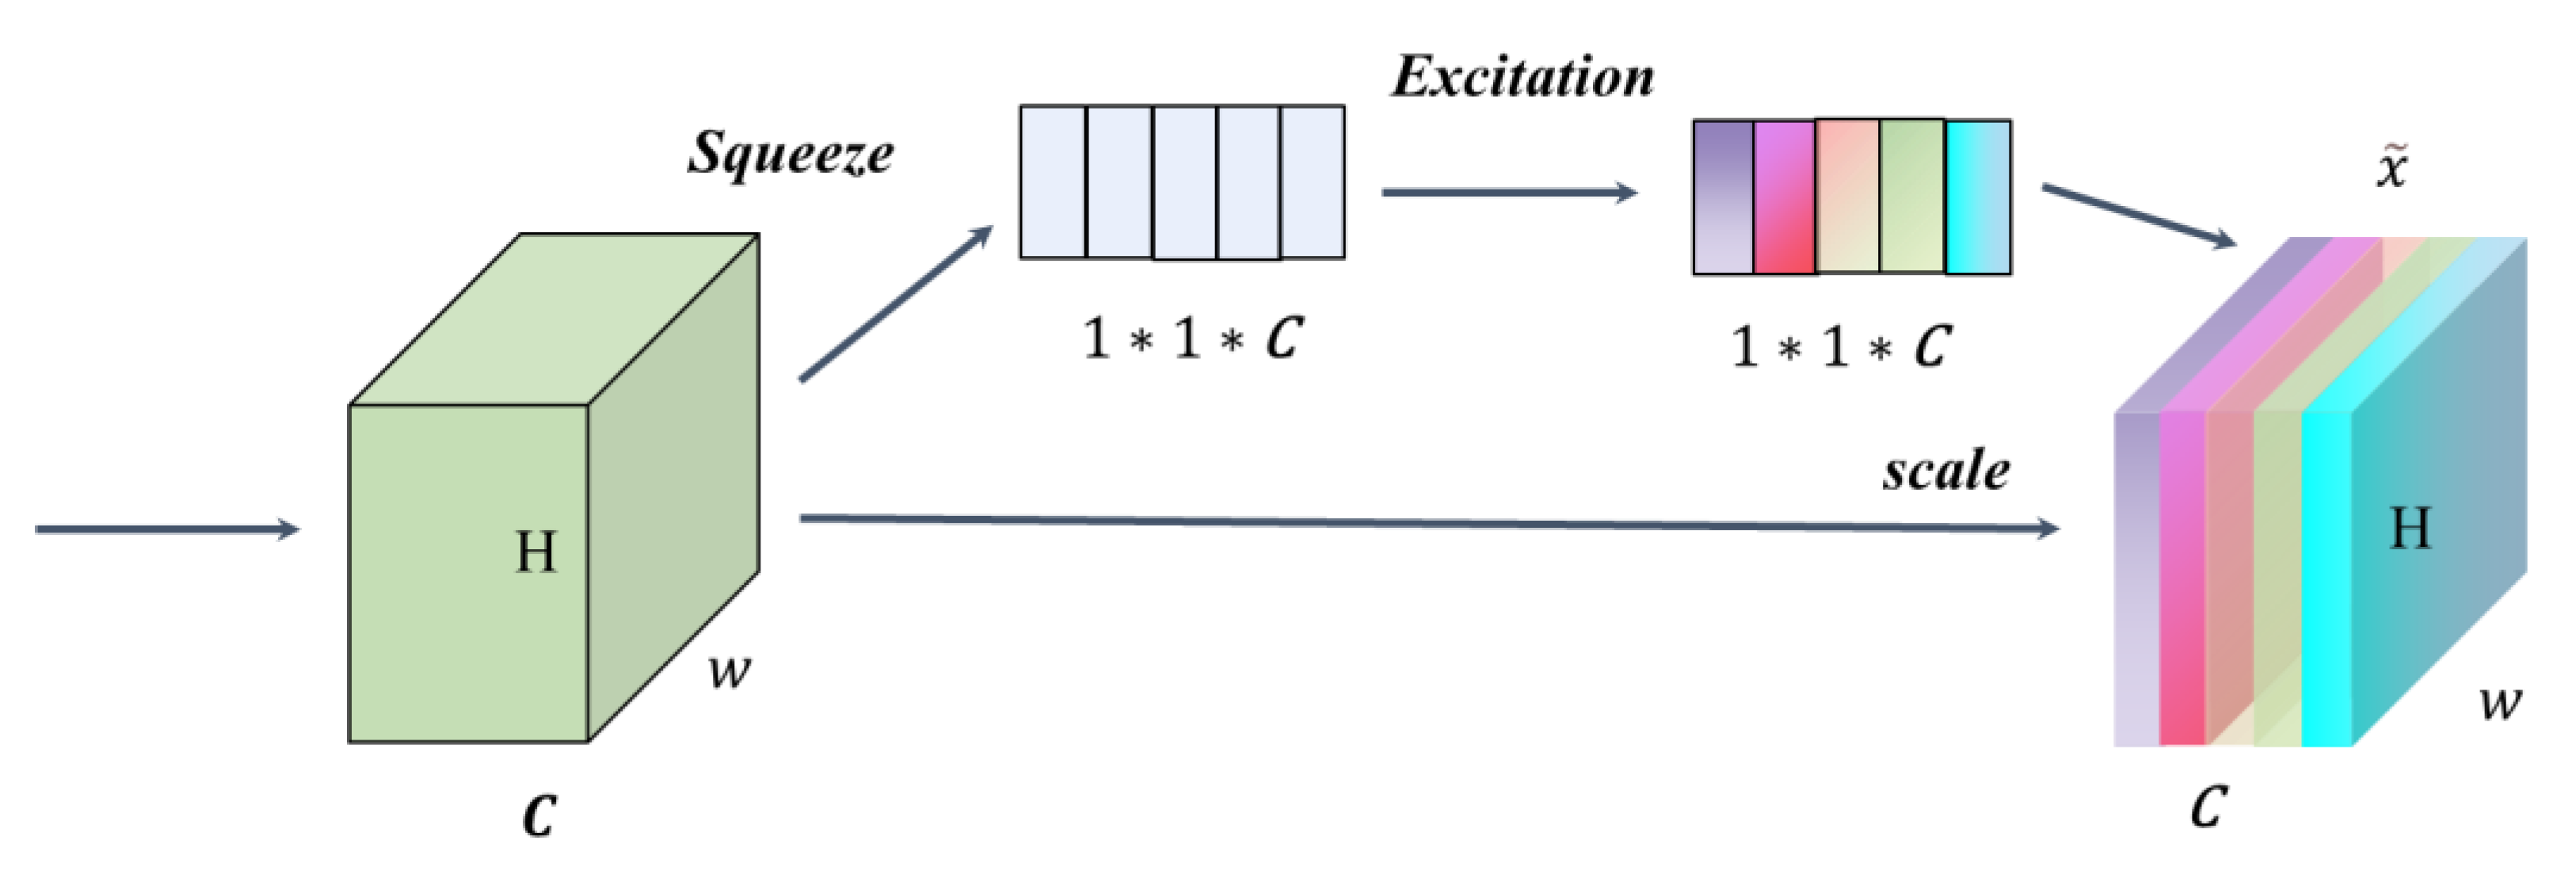
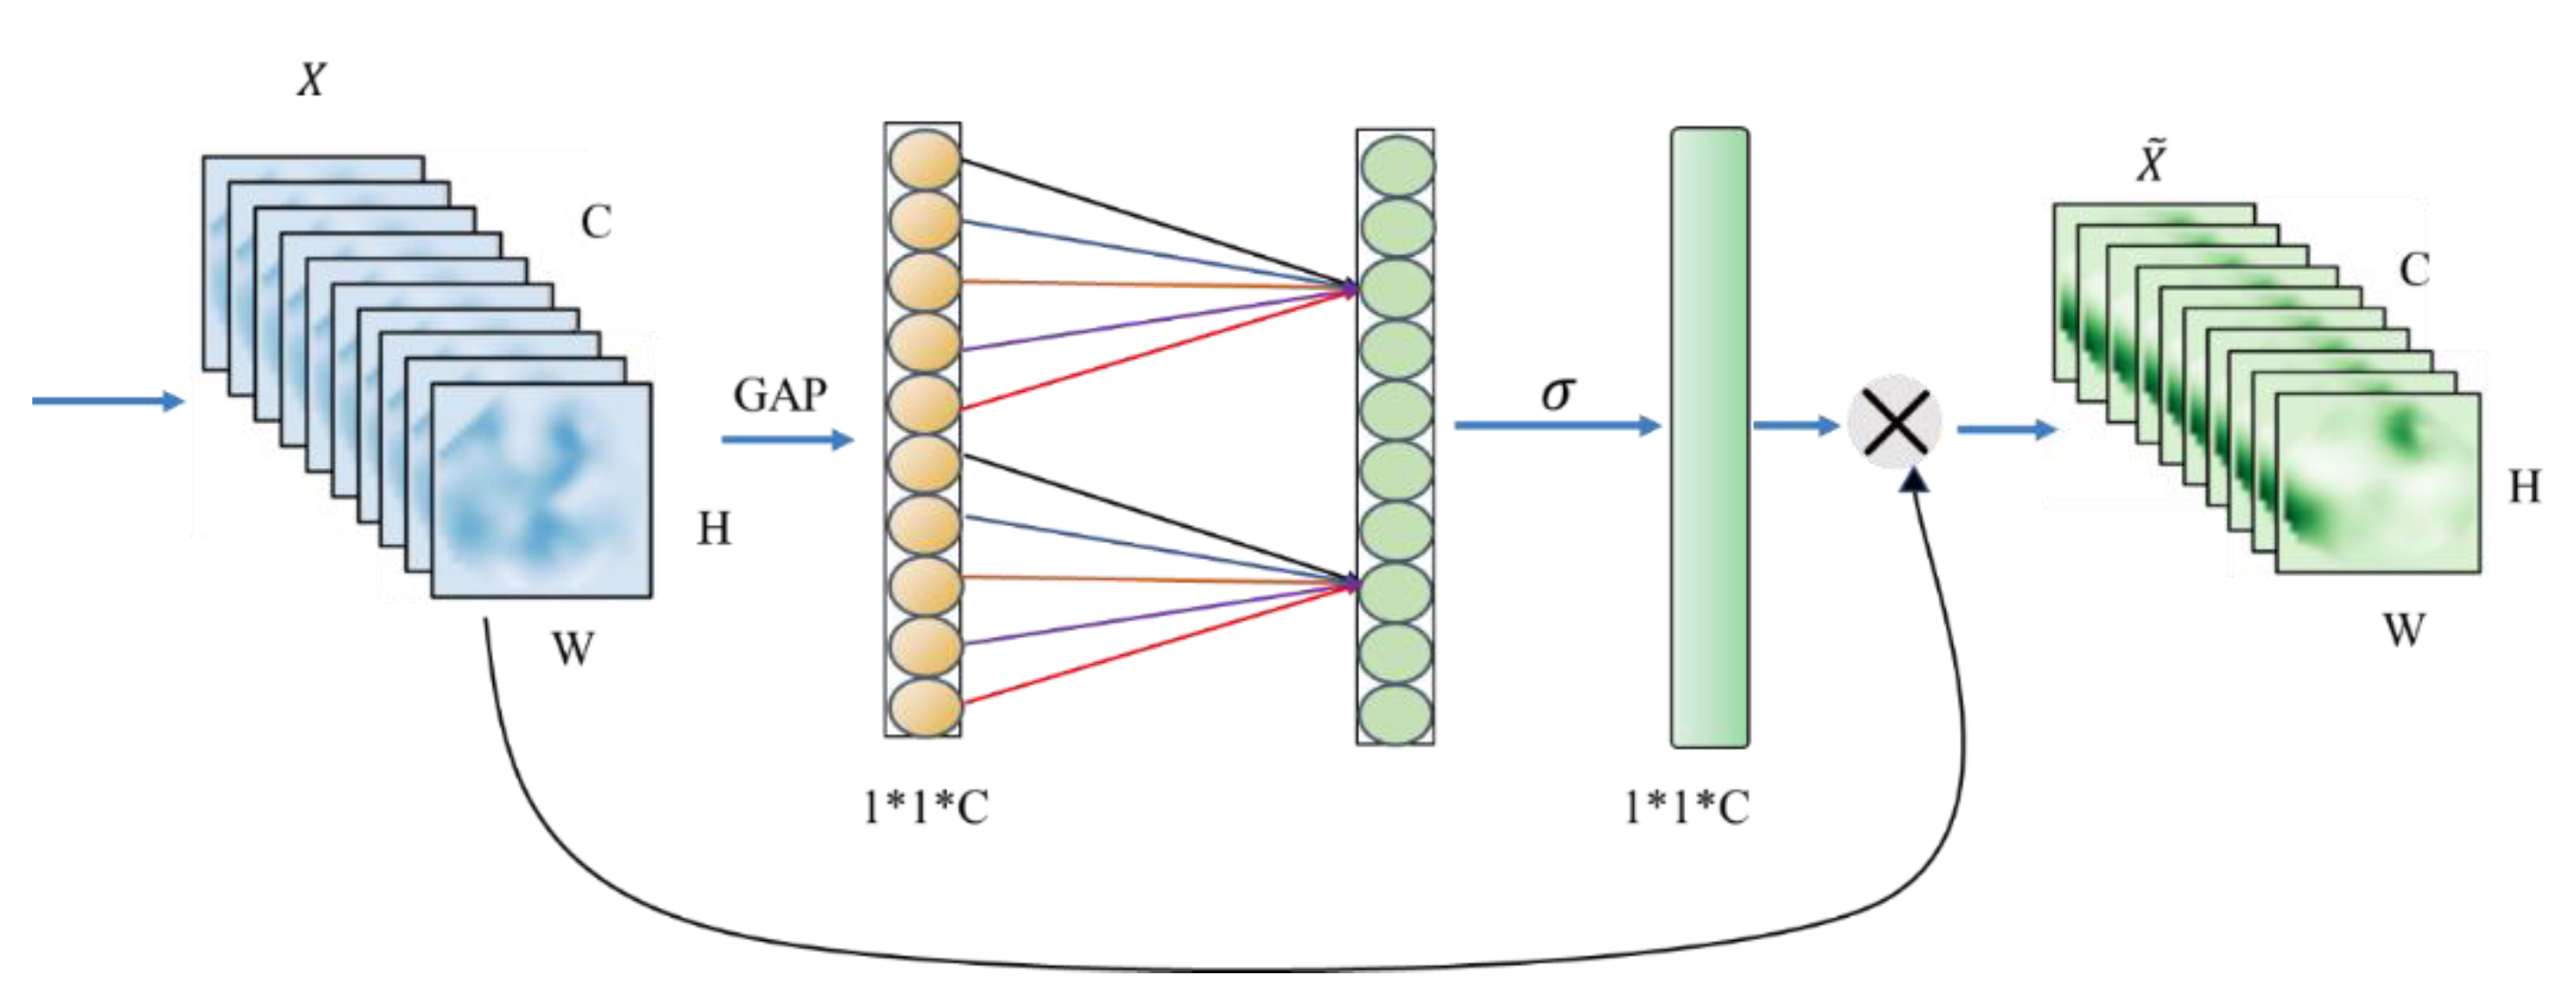
In order to evaluate the effect of the CBAM-YOLOv7 algorithm, we borrowed SE and ECA modules to replace the CBAM modules for ablation experiments. SE mainly includes squeeze and excitation operations [
30]. The module structure is shown in
Figure 8.
The SE mechanism can flexibly capture the connection between global information and local information, allowing the model to obtain the object area that needs to be focused on and assign it more weight, highlighting significant useful features and suppressing and ignoring irrelevant features, thereby improving accuracy.
The ECA module proposes a local cross-channel interaction strategy without dimensionality reduction, which can effectively avoid the influence of dimensionality reduction on the learning effect of channel attention. The ECA module consists of a one-dimensional convolution determined by nonlinear adaptation, which captures local cross-channel interaction information by considering each channel and its k neighbors. Since only a few parameters are involved, it is a very lightweight plug-and-play block, but with significant effect gain [
31]. The structure of ECA is shown in
Figure 9.
3.1. Object Detection Network Comparison Experiment Results
In the process of selecting the object detection model of the hemp ducks, we applied the existing popular object detection model to the Hemp Duck Dataset for training and testing, and compared the precision, recall, F1 score, mAP@0.5, and other evaluation indicators. Finally, YOLOv7 was selected as the object detection model in this study for subsequent experiments.
Table 1 shows the comparison of the evaluation indexes of each object detection model on the Hemp Duck Dataset. The experimental results are shown in
Table 2.
As can be seen in
Table 2, YOLOv7 performed overall better than the other detection algorithms tested, leading in terms of the precision, F1 score, and mAP@0.5 and a close second in terms of the recall, mAP@0.5:0:0.95, and detection speed. For example, the recall rate of the YOLOv7 algorithm was 15.6% higher than that of YOLOV4. The remaining indicators are basically superior to the other target detection algorithms. Finally, we chose YOLOv7 as the target detection algorithm used in the experiment.
3.2. Contrast Experiment Results of Introducing Attention Mechanism
In order to verify the effectiveness of the improved algorithm, this study used CBAM as the attention mechanism and added it to the YOLOv7 object detection algorithm to conduct experiments on the Hemp Duck Dataset. The experimental results are shown in
Table 3, and the recall rate, mAP@0.5, and mAP@0.5:0.95 were used as the measures.
As can be seen in
Table 3, compared to the original YOLOv7 algorithm, the accuracy rate of the SE-YoloV7 algorithm decreased by 0.44%, the recall rate decreased by 0.11%, the mAP decreased by 0.09%, and the FLOPS increased by 0.02G. The accuracy rate of the ECA-YOLOv7 algorithm decreased by 0.25%, the recall rate increased by 0.11%, the mAP also decreased, and the FLOPS increased by 0.02G. The results in
Table 3 show that the SE-Yolov7 and ECA-YOLOV7 algorithms not only had a lower effect than the original YOLOv7, but also increased the model parameters and the computational pressure. Compared to the original YOLOv7 algorithm, the accuracy of the CBAM-YOLOV7 algorithm increased by 1.04%, the recall increased by 0.93%, the mAP@0.5 by 1.15%, and the mAP@0.5:0.95 by 0.60%. In addition, the value of the FLOPS parameter of the CBAM-Yolov7 model is equal to that of the SE-Yolov7 and ECA--YOLOv7 models. By comparing and analyzing the experimental results, it can be concluded that the algorithm in this paper demonstrated better performance than both the original algorithm and the algorithm with the SE and ECA modules. Compared to the SE-YOLOv7 and ECA-YOLOv7, the CBAM module not only improved the channel attention module, but also added a spatial attention module, analyzed it from two dimensions, and determined the order from the channel to the space.
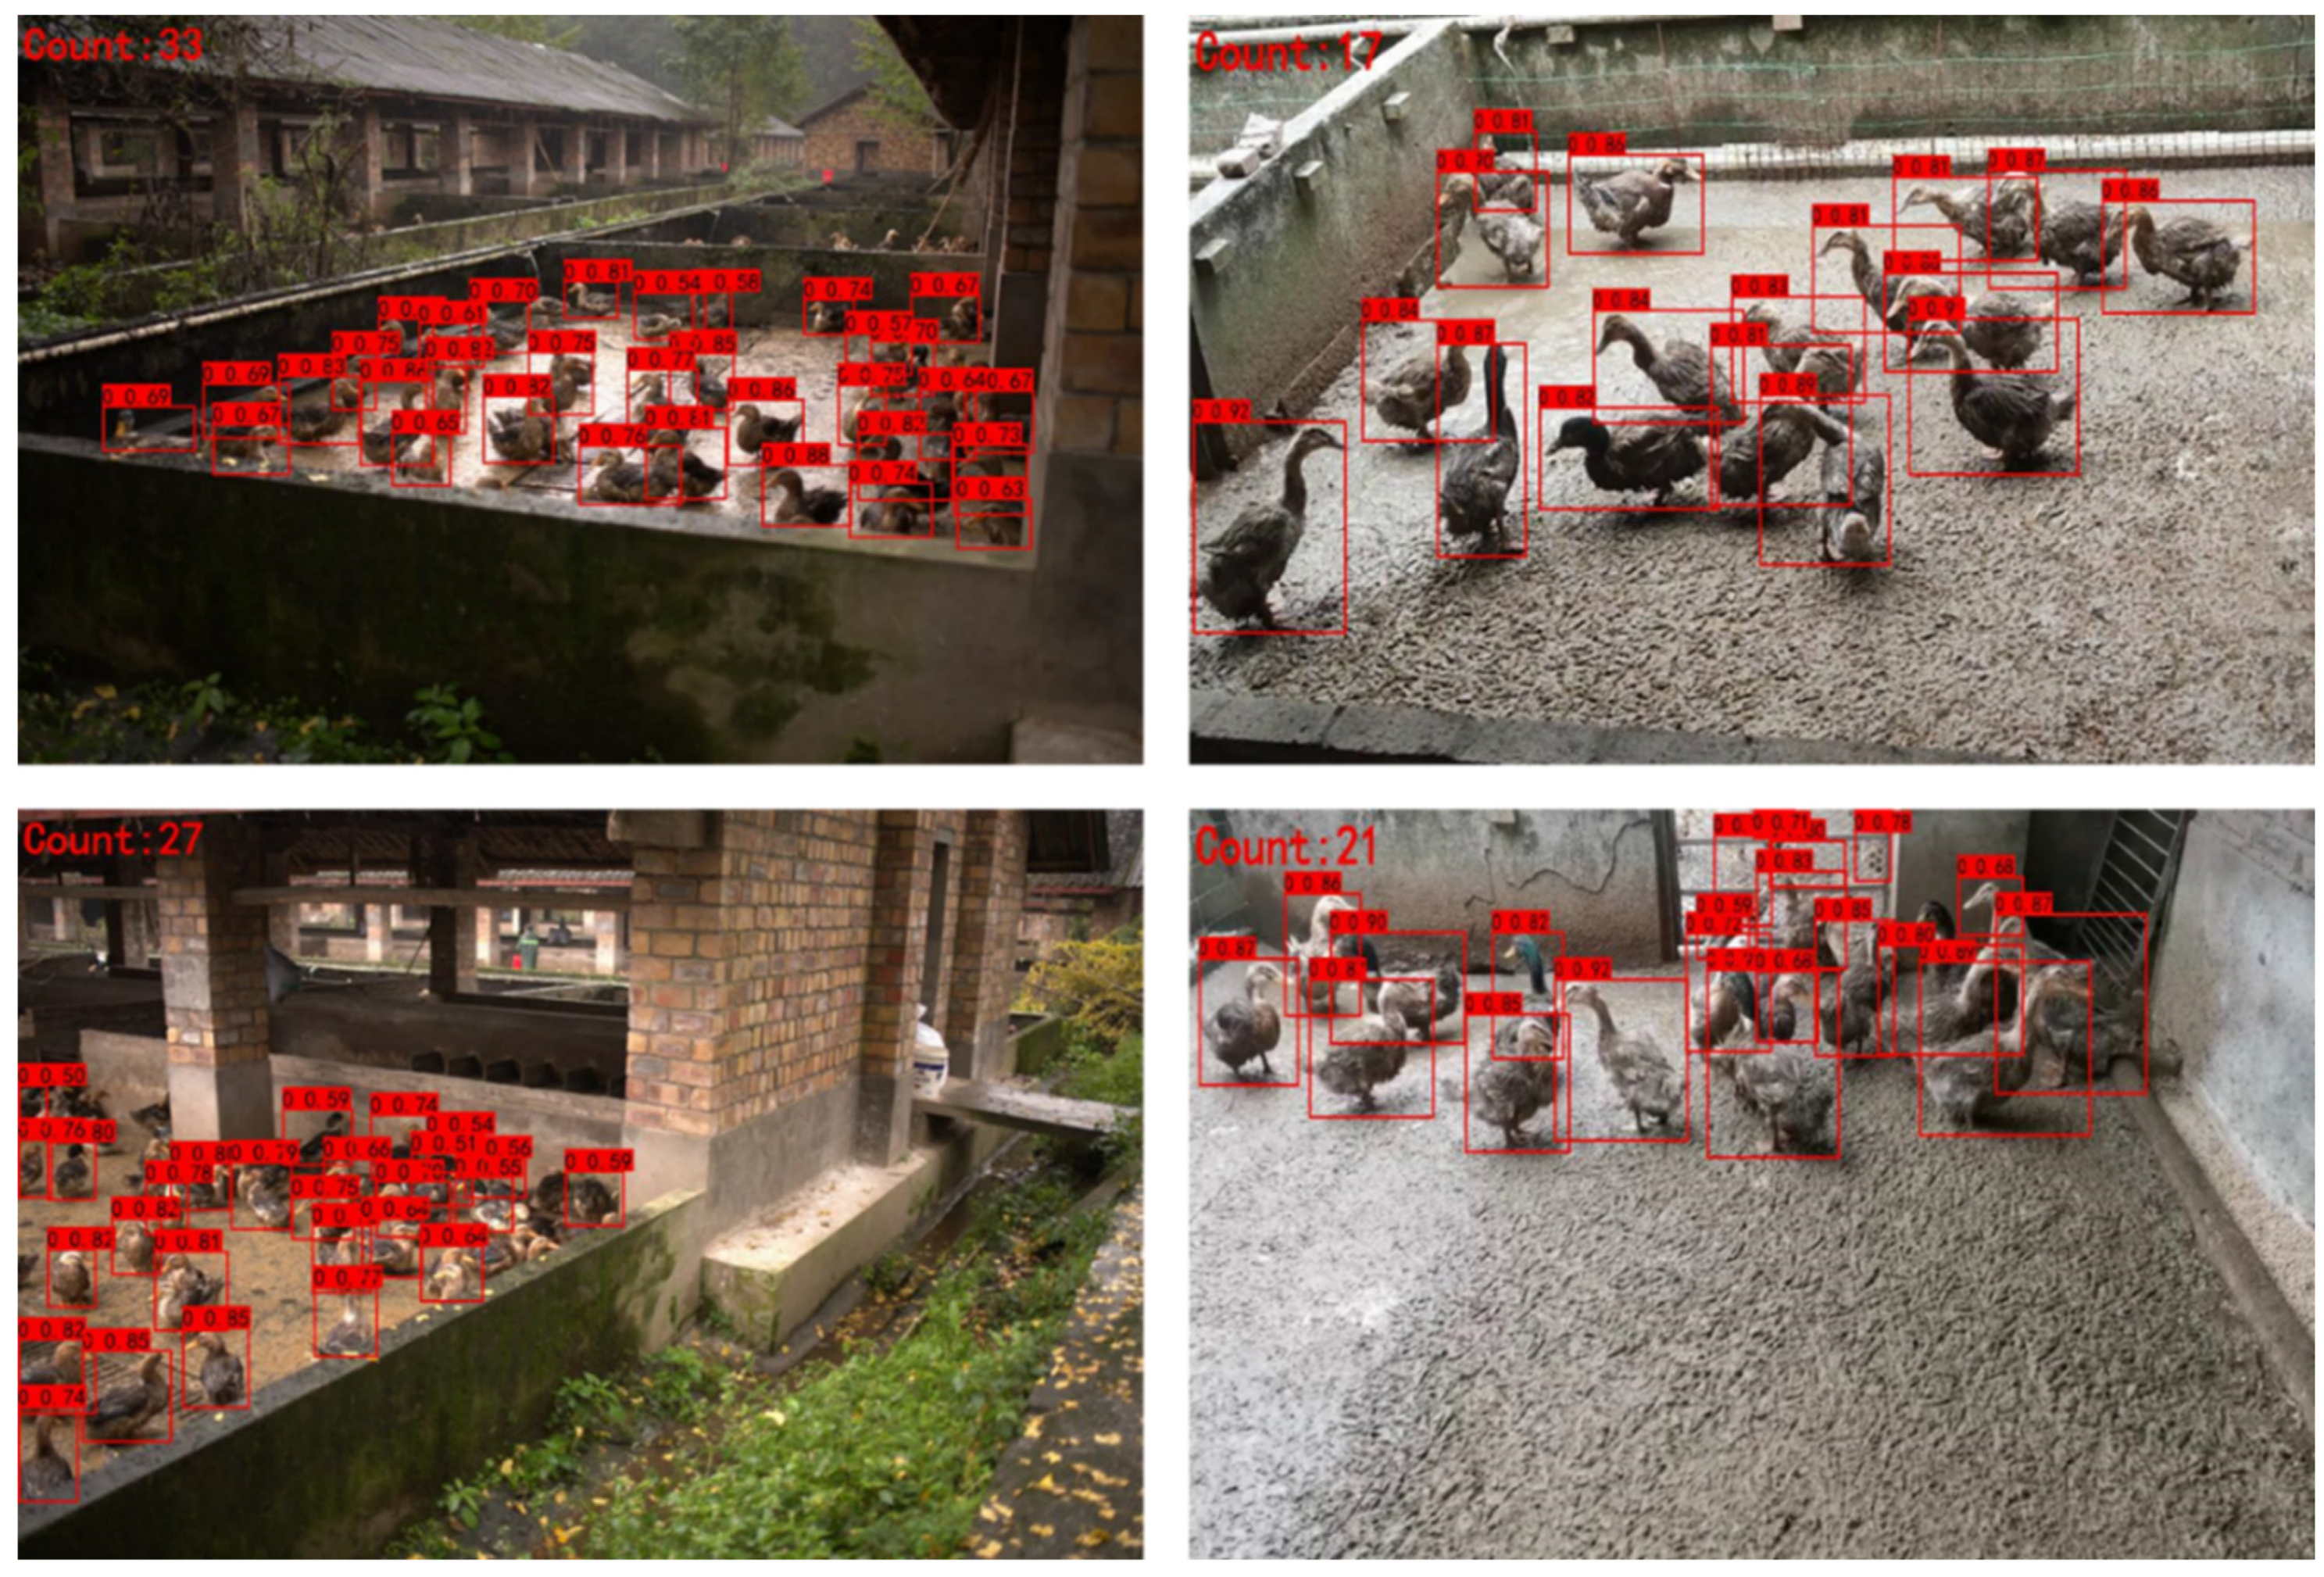
Figure 10 shows the detection effect of the CBAM-YOLOv7 algorithm on the Hemp Duck Dataset.
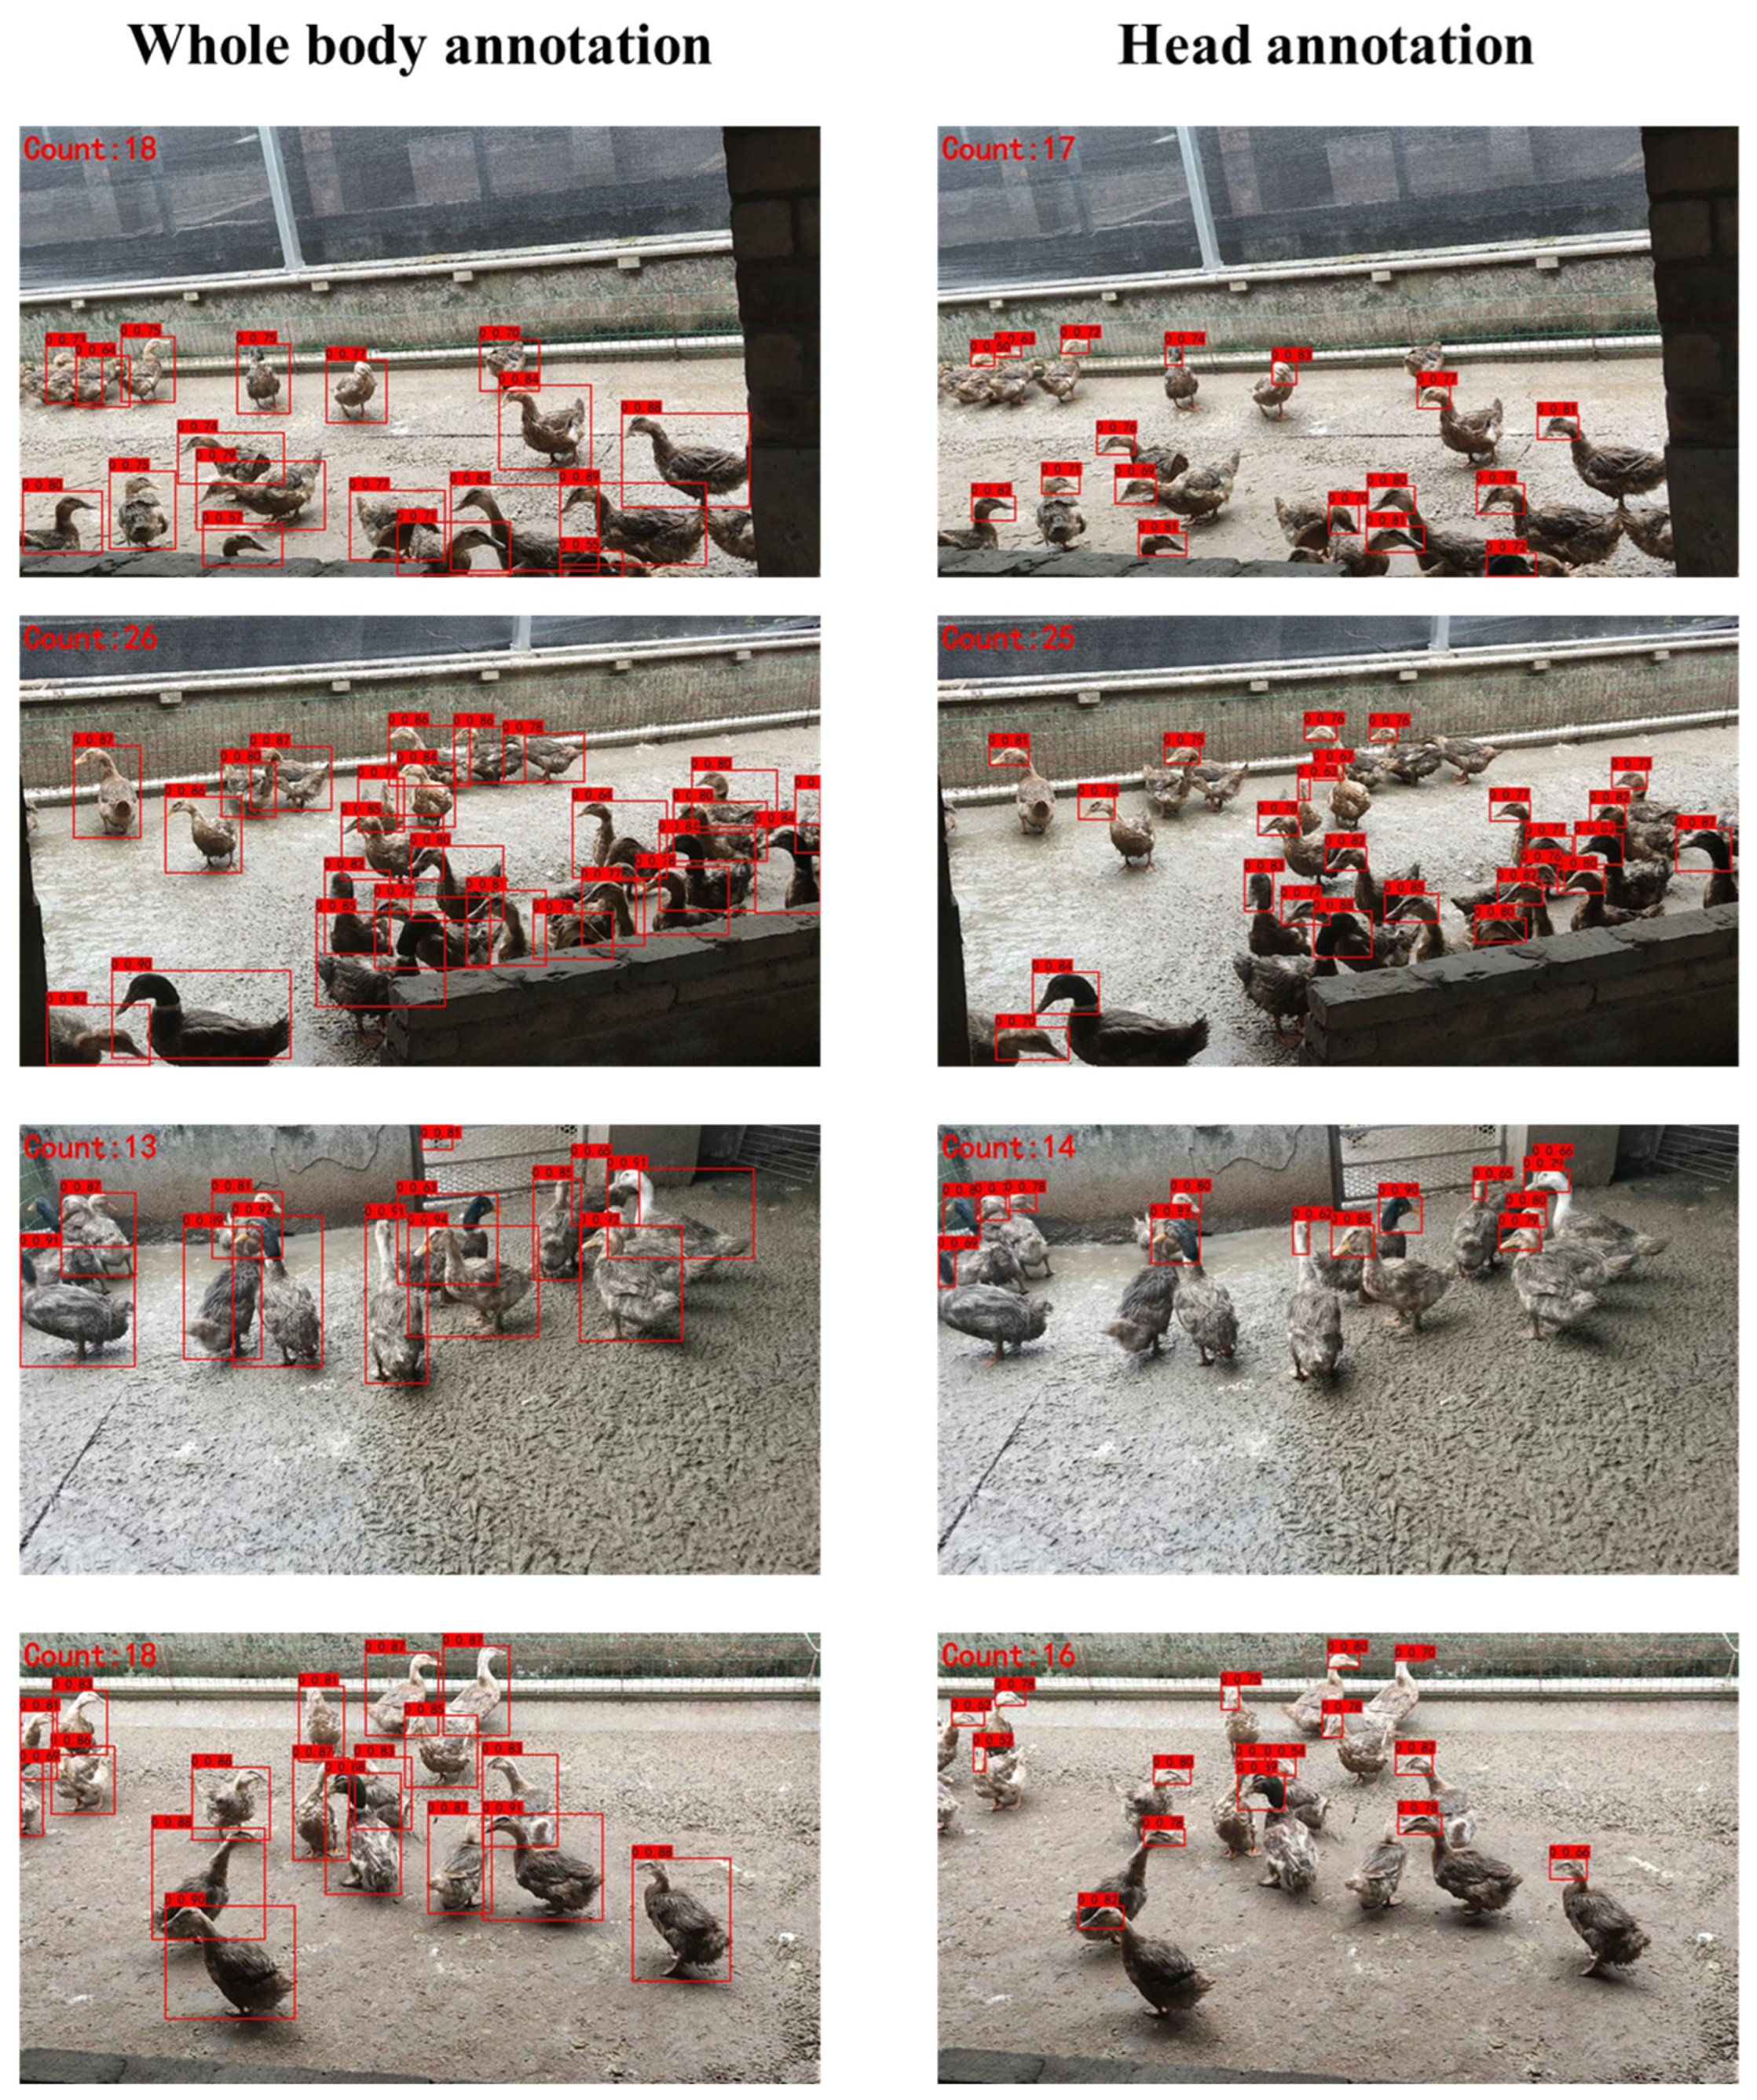
3.3. Comparison of Experiment Results with Different Data Annotation Methods
In a previous article, we took into account the data sheet annotation section and compared the data annotation of the whole body with the data annotation of the hemp duck with only the head. For this, we used the improved CBAM-YOLOv7 algorithm on two different annotation methods. The experimental results are shown in
Table 4.
As can be seen in
Table 4, the experimental data of the head annotation are far inferior to that of the whole body annotation. We discuss the reasons for this. Usually, the model extracts the features contained in the pixels of the original image through convolution, and the receptive field reflects the correspondence between the information of a single high-level feature and the original pixels, which is determined by the network convolution kernel. In this case, as the number of network layers increases, a single high-level feature reflects the larger range of pixels in the original image, and the field of view is wider and the high-level information can better reflect the macro outline of the object in the original image. Then, as the number of network layers increases and the receptive field becomes larger, the microscopic information is lost, so that the information about the small object will be aggregated to a point, and the small object originally contains fewer pixels. If it increases, there will be fewer features after aggregation. For example, a small object of 10 × 10 pixels may have only 1 × 1 features after convolution, or even multiple small objects of 10 × 10 pixels. After multiple convolution operations, only one feature may be generated, which leads to the failure of pixel recognition. Therefore, the head annotation method is unsuitable for the task of count estimation on the Hemp Duck Dataset.
Figure 11 shows the detection results of two different labeling methods based on the YOLOv7 algorithm on the Hemp Duck Dataset.
In the graph of the results, it can be seen that the two labeling methods obtained different results in estimating the number of hemp ducks. Based on the comparison, the experimental results of labeling the whole body method are more accurate.
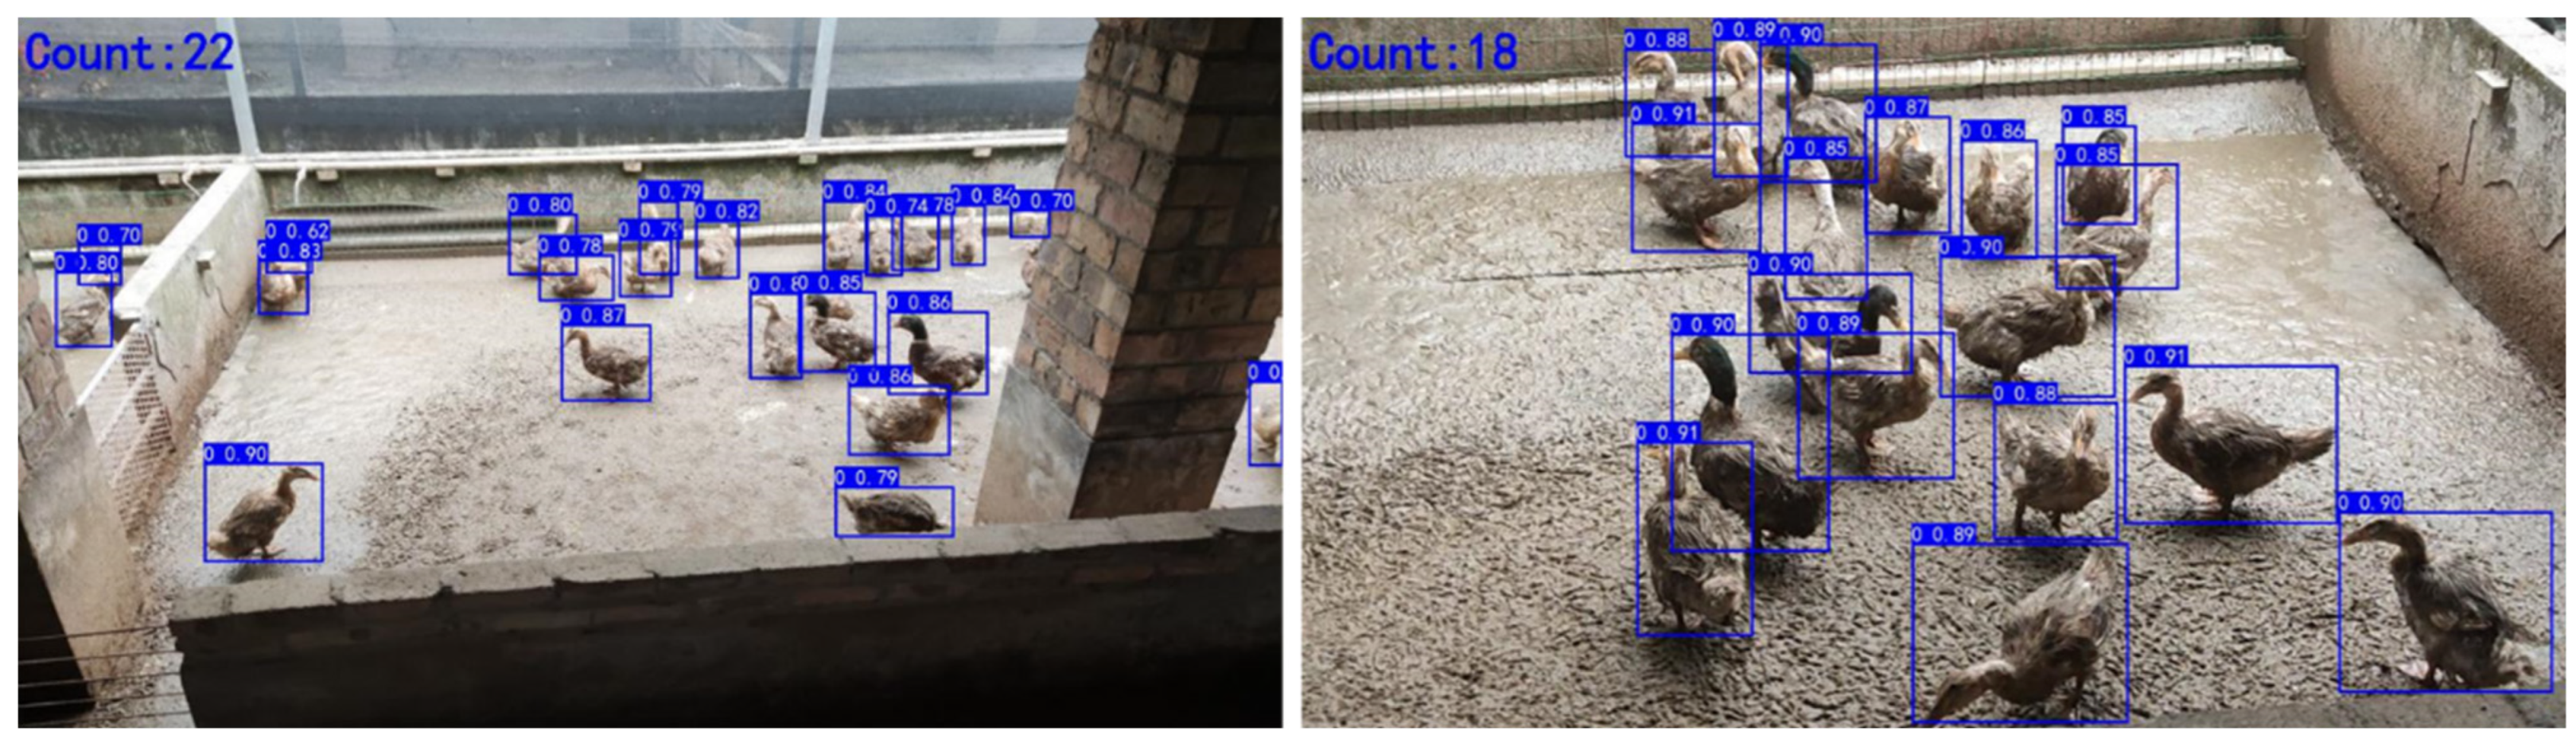
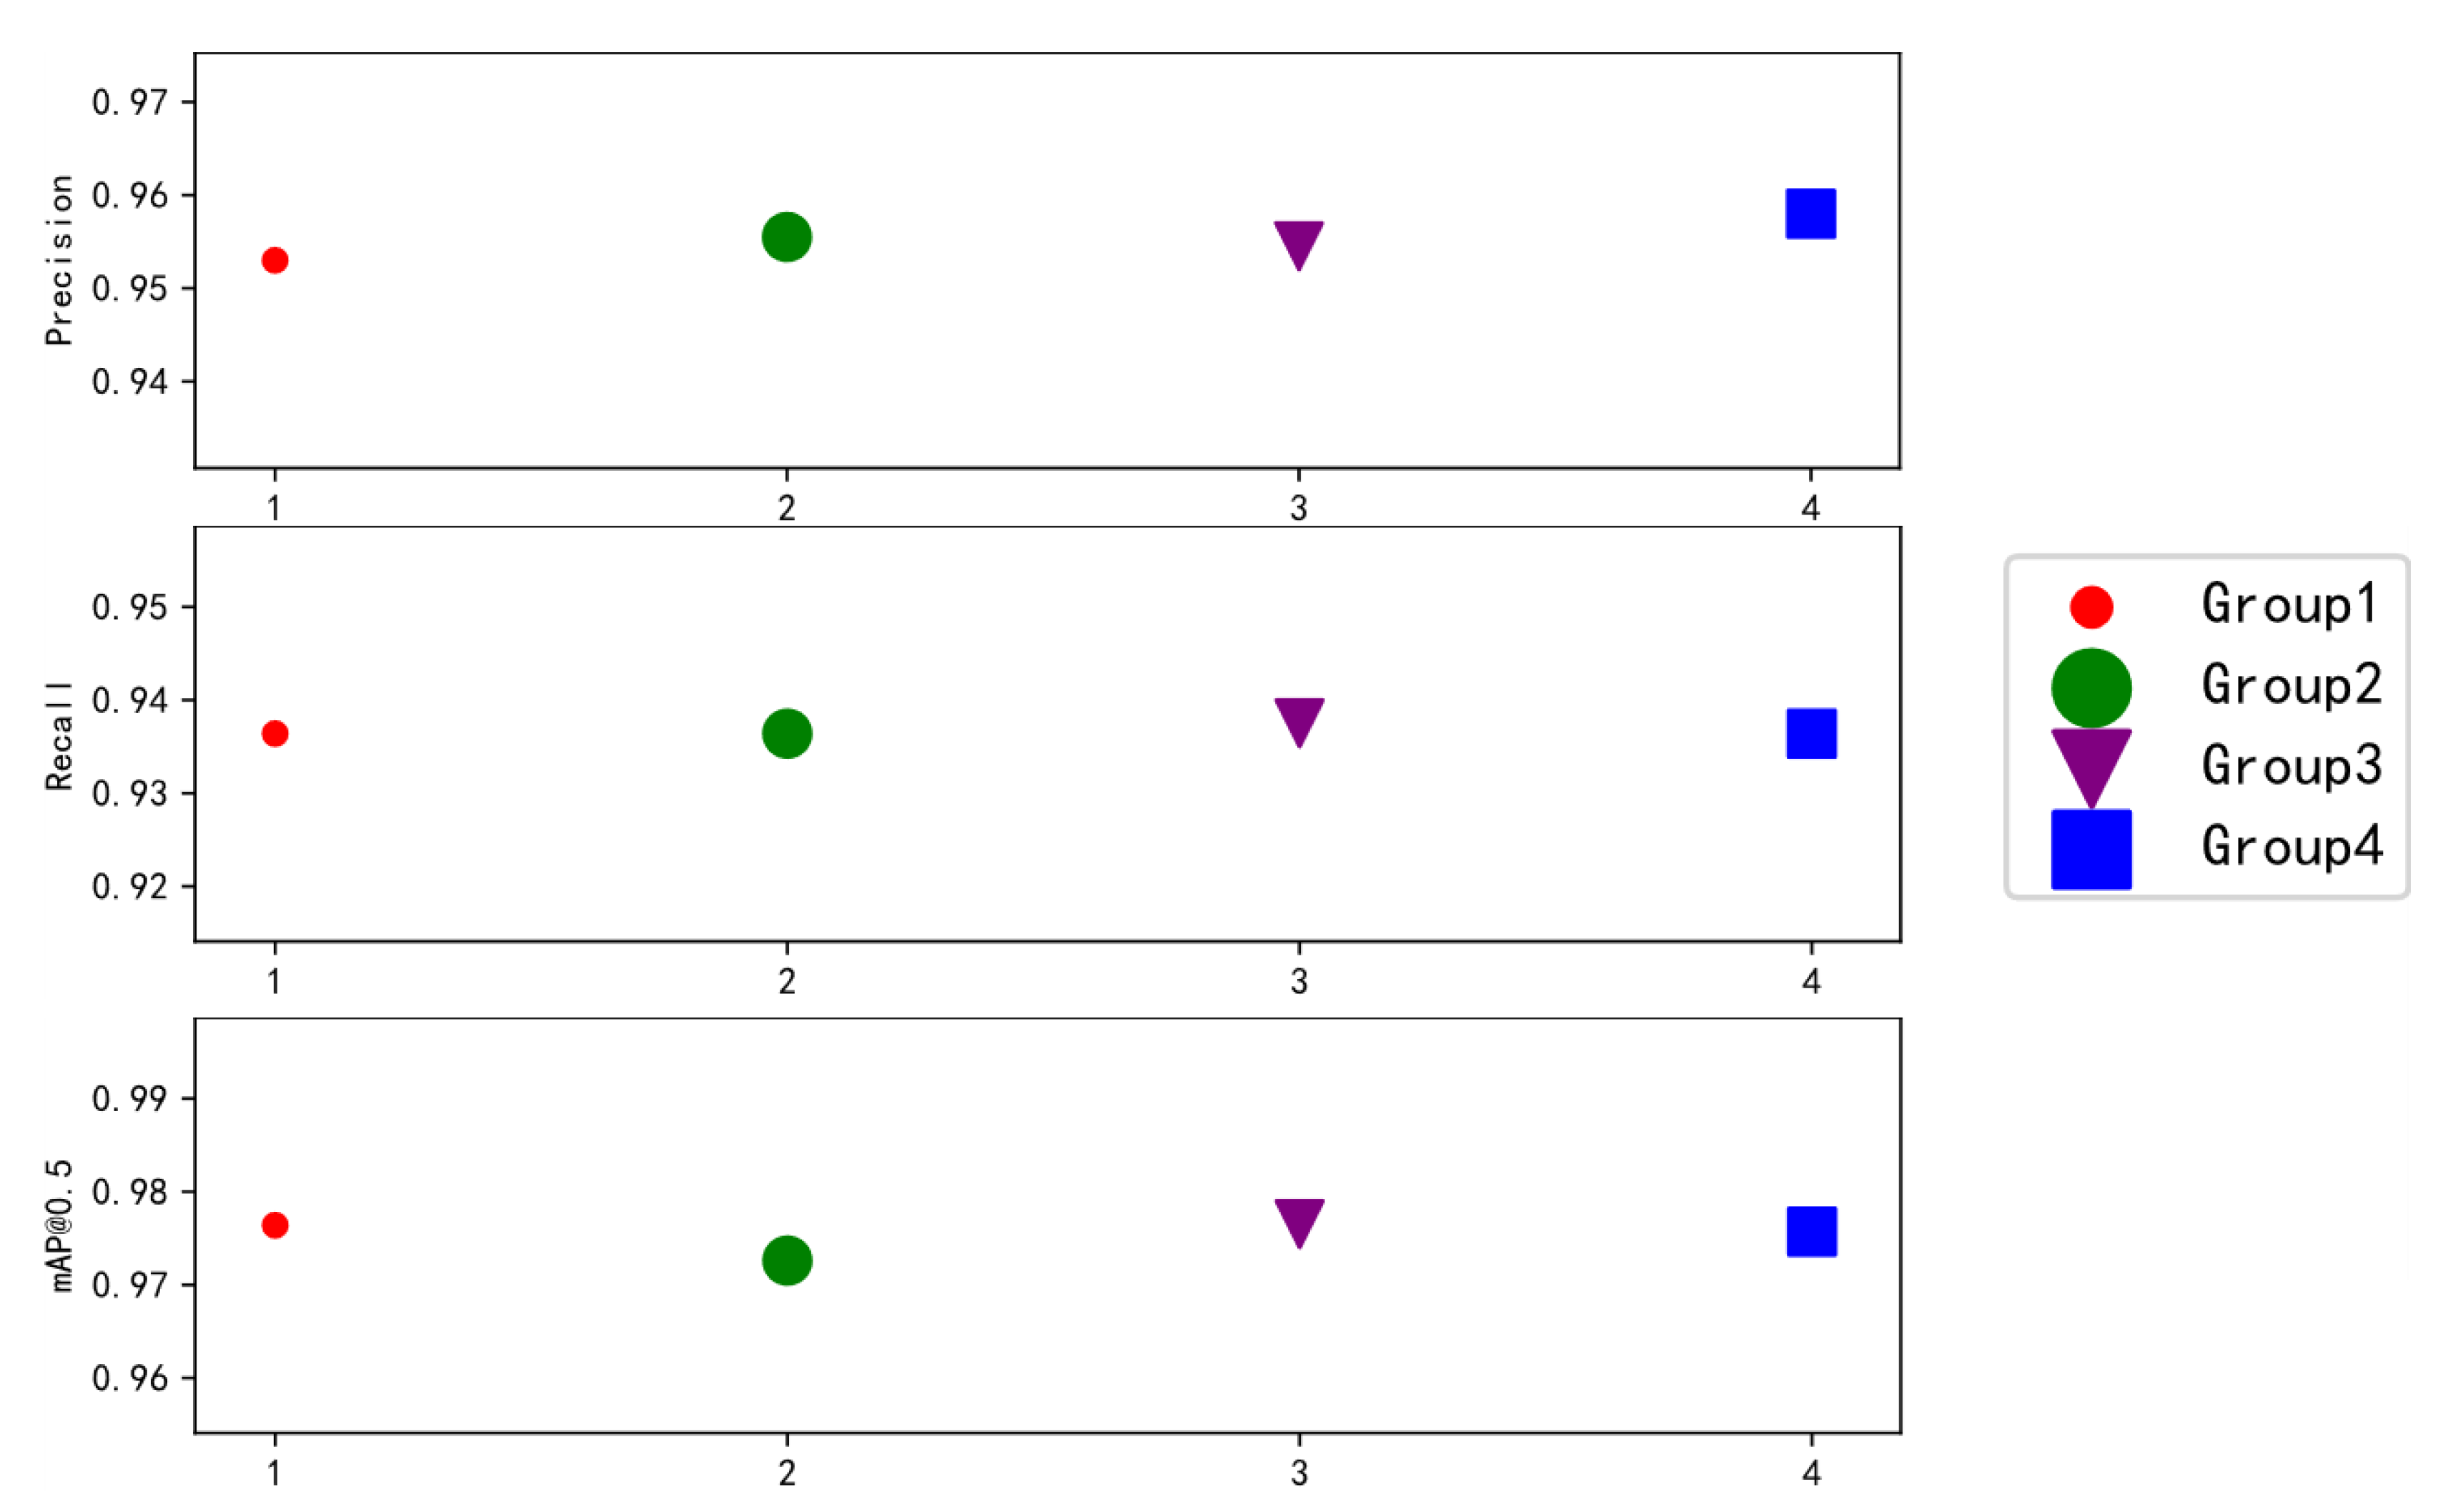
3.4. Results of Ablation Experiment
Figure 12 shows the prediction chart of Yolov7 algorithm without adding training skills. Based on the original YOLOv7 algorithm, we tried some training techniques in the ablation experiment, using different tricks to process the model, such as mosaic processing and image fusion. Through the experiments, we verified the experimental data obtained when using the above treatments. The experimental results are shown in
Table 5.
In the ablation experiments of YOLOv7, each group of experiments corresponded to a set of training skills and evaluation indicators. Among them, “√” indicates that this training technique was used, and “×” indicates that this training technique was not applicable.
As can be seen in
Table 5, overall, the simultaneous use of Mosaic and mixup fared better than using just one method or neither.
Figure 13 shows the comparative effect of the results of the four groups of ablation experiments on Precision, Recall and mAP@0.5 indicators.
4. Discussion
4.1. Contribution to Animal Target Detection and Counting
Poultry farming has a very large market size; however, the number of experiments for target testing and counting of poultry is low. Therefore, conducting reasonable data annotation of the original poultry pictures and improving the algorithmic network structure to obtain good feature information had a very significant impact on the experiments achieving good results. There are few methods for estimating intelligent poultry target detection counts, and this study fills this gap to some extent. The experiments in this project present a reflection on the implementation of automated poultry counting and provide an experimental basis for the target detection counting of poultry.
4.2. Contribution to Intelligent Farming of Sisal Ducks
The manual counting method is inefficient and the results are not always accurate, both because of the constant movement of the ducks and the high labor costs. As a result, it is difficult and costly to avoid duplication of effort. In this study, we used an improved YOLOv7 algorithm to obtain an efficient and accurate stocking density and to control the stocking density to a suitable value. The accuracy rate of the algorithm increased by 1.04%, the recall rate increased by 0.93%, the mAP@0.5 increased by 1.15%, and the mAP@0.5:0.95 increased by 0.60%. The use of minimal manual labor costs will improve farming efficiency and reduce problems such as irrational disease and pecking and fighting among species. At the same time, making hemp duck farming intelligent by using deep neural network models provides an efficient approach to duck target detection and breeding density management.
This study was based on the YOLOv7 model, migrating the learning method to the intelligent farming of hemp ducks while improving the original YOLOv7 so that the model has higher target detection, improves the robustness of the model, and is more adaptable to realistic scenarios. Moreover, we have filled the gap of few automated estimation algorithms for agricultural poultry farming numbers.
4.3. Comparison of Methods
Two-stage: First stage: focus on finding the location of the target object and obtaining a suggestion frame, ensuring sufficient accuracy and recall. Second stage: focus on classifying the suggestion frame and finding a more accurate location. Two-stage structure sampling is used to deal with category imbalance, but at the same time, it is slow and generally seen in competition scenarios.
One-stage: Instead of obtaining a suggestion frame stage, the class probability and position coordinates of the object are generated directly, and the final detection result is obtained directly after a single detection, which is faster than the multi-stage algorithm and generally has a slightly lower accuracy. The YOLOv7 and improved algorithms used in this study are single-stage detection, but the collection of some methods as well as the module re-referencing and dynamic tag assignment strategies make it much faster and more accurate. For large-scale, high-density breeding of sisal ducks, the single-stage algorithm can better focus on the real-time changes in the number of sisal ducks and obtain better results.
4.4. Limits and Future Work
It should not be overlooked that there are still limitations to this study. Firstly, the study did not consider disturbances caused by the external environment, such as birds in the farm field environment, and most of the images in the dataset were based on high light and average weather conditions, which may not be sufficiently representative. In the future, we will collect more duck datasets under different conditions.
Secondly, there are false detection and missing detection data in the detection results. For error detection, we adopted two methods to find a more appropriate confidence level, namely, adding more negative samples for training, and using the image dataset generated by GAN [
32] for data enhancement. For missed detection, we used two measures. One was to filter out the samples with a large loss value in each training iteration and add them to the training set of the next iteration so that the detection model could pay more attention to the samples that were easily missed. The second was to use the method proposed by Soft NMS [
33] to combine multiple weighted frames according to the confidence level of the IoU, optimize the final generated frame, and improve the detection performance of dense small target objects.
To sum up, this study aimed to explore different algorithms to determine the best algorithm under a wide range of environmental conditions with duck count uncertainty and deploy the network model to hardware devices for practical application in farms.
5. Conclusions
In this study, a large-scale dataset for estimating the count of hemp ducks was constructed, including 1500 pictures of hemp ducks, which can be collected by individuals to provide data support for visual research in the field of poultry. In this study, three CBAM modules were added to the backbone network of the YOLOv7 algorithm to optimize the YOLOv7 network structure. An improved YOLOv7 algorithm with an attention mechanism was proposed, and SE-YOLOv7 and ECA-YOLOv7 were introduced for comparative experiments. In comparison, the precision rate, recall rate, and mAP all improved, and the FLOPS only increased by 0.02 G with no increase in computational pressure. In addition, this study considered the overlapping problem of hemp duck labeling frames, proposed two labeling methods, whole body labeling and head-only labeling, and conducted comparative experiments. The feature information was lost, and the dense counting task of hemp ducks could not be realized. The algorithm in this paper achieved good detection results on the task of counting dense hemp duck groups. The CBAM-YOLOv7 algorithm was proposed to improve the detection accuracy, and the advantages and disadvantages of the two labeling methods were discussed. Future research will continue to optimize the network structure of the proposed algorithm and deploy the network to the hardware environment used in field farming.

 ,
, 


