Article

Assessing the Influence of Soil Quality on Rainfed Wheat Yield

by
Kamal Nabiollahi
1,*,
Eskandari Heshmat
1,
Amir Mosavi
2,3,4,*,
Ruth Kerry
5,
Mojtaba Zeraatpisheh
6,7 and
Ruhollah Taghizadeh-Mehrjardi
8,9,10
1
Department of Soil Science and Engineering, Faculty of Agriculture, University of Kurdistan, Sanandaj 6617715175, Iran
2
Faculty of Civil Engineering, Technische Universität Dresden, 01069 Dresden, Germany
3
Institute of Research and Development, Duy Tan University, Da Nang 550000, Vietnam
4
School of Economics and Business, Norwegian University of Life Sciences, 1430 As, Norway
5
Department of Geography, Brigham Young University, Provo, UT 84602, USA
6
Key Laboratory of Geospatial Technology for the Middle and Lower Yellow River Regions, College of Environment and Planning, Henan University, Ministry of Education, Kaifeng 475004, China
7
College of Environment and Planning, Henan University, Ministry of Education, Kaifeng 475004, China
8
Department of Geosciences, Soil Science and Geomorphology, University of Tübingen, 72070 Tübingen, Germany
9
Faculty of Agriculture and Natural Resources, Ardakan University, Ardakan 8951656767, Iran
10
DFG Cluster of Excellence “Machine Learning”, University of Tübingen, 72070 Tübingen, Germany
*
Authors to whom correspondence should be addressed.
Agriculture 2020, 10(10), 469; https://doi.org/10.3390/agriculture10100469
Submission received: 21 July 2020 / Revised: 24 September 2020 / Accepted: 5 October 2020 / Published: 12 October 2020

Abstract

:
Soil quality assessment based on crop yields and identification of key indicators of it can be used for better management of agricultural production. In the current research, the weighted additive soil quality index (SQIw), factor analysis (FA), and multiple linear regression (MLR) are used to assess the soil quality of rainfed winter wheat fields with two soil orders on 53.20 km2 of agricultural land in western Iran. A total of 18 soil quality indicators were determined for 100 soil samples (0–20 cm depth) from two soil orders (Inceptisols and Entisols). The soil properties measured were: pH, soil texture, organic carbon (OC), cation exchange capacity (CEC), electrical conductivity (EC), soil microbial respiration (SMR), carbonate calcium equivalent (CCE), soil porosity (SP), bulk density (BD), exchangeable sodium percentage (ESP), mean weight diameter (MWD), available potassium (AK), total nitrogen (TN), available phosphorus (AP), available Fe (AFe), available Zn (AZn), available Mn (AMn), and available Cu (ACu). Wheat grain yield for all of the 100 sampling sites was also gathered. The SQIw was calculated using two weighting methods (FA and MLR) and maps were created using a digital soil mapping framework. The soil indicators determined for the minimum data set (MDS) were AK, clay, CEC, AP, SMR, and sand. The correlation between the MLR weighting technique (SQIw-M) and the rainfed wheat yield (r = 0.62) was slightly larger than that the correlation of yield with the FA weighted technique (SQIw-F) (r = 0.58). Results showed that the means of both SQIw-M and SQIw-F and rainfed wheat yield for Inceptisols were higher than for Entisols, although these differences were not statistically significant. Both SQIw-M and SQIw-F showed that areas with Entisols had lower proportions of good soil quality grades (Grades I and II), and higher proportions of poor soil quality grades (Grades IV and V) compared to Inceptisols. Based on these results, soil type must be considered for soil quality assessment in future studies to maintain and enhance soil quality and sustainable production. The overall soil quality of the study region was of poor and moderate grades. To improve soil quality, it is therefore recommended that effective practices such as the implementation of scientifically integrated nutrient management involving the combined use of organic and inorganic fertilizers in rainfed wheat fields should be promoted.

1. Introduction

Winter wheat, the second main cereal in the world [1,2,3], is annually grown on over 200 million ha [4]. Rainfed winter wheat is the main crop of semi-arid regions where mean precipitation is 350–500 mm [4]. The production of rainfed winter wheat per unit area is low. One of the main causes for this low production is that the most suitable soil types for planting have not been identified. Evaluation of soil quality under diverse soil types is vital for identifying problematic areas and assessing sustainable soil management [5,6,7,8]. To overcome this problem and also to increase wheat yield, information on soil quality is needed [9].
The quality of soil is measured through several soil indicators, including chemical, physical, and biological features [10] rather than individual soil indicators. The interpretation of the latter’s response to ecological change is difficult [11]. Quantifying soil quality can, therefore, improve understanding of soil ecosystems and inform decision-making [12]. The soil management assessment framework (SMAF) as one of the conceptual frameworks to evaluate soil quality has been designed to make a quantitative evaluation of soil quality [9,13]. A soil quality index (SQI) is calculated by applying SMAF scoring algorithms to soil indicator properties. This is the most frequently used process for assessing soil quality. Soil quality indicators generate SQIs in an easy and flexible format based on an integrated valuation of SQIs and their weights [14,15,16,17]. SQIs have been successfully applied at various scales for different purposes such as assessing the impacts of agricultural practices, soil management, salinization, and alkalization on soil quality and crop production [18,19,20,21,22,23].
Minimum data set (MDS) and factor analysis (FA) approaches have been extensively applied for indicator selection in soil quality assessment [24,25,26,27] as they can decrease the time-consuming, labor-intensive and costly processes involved in measuring extra soil properties [13]. Multiple linear regression analysis (MLR) has been applied to assign weights to soil indicators [6]. If the soil indicator weights are assigned based on MLR, the soil indicators that affect the crop yield will have the largest weight. However, MLR has only rarely been used for weighting quality measures [6,28]. Therefore, one aim of this work is to confirm whether MLR is a useful weighting method. Crop yield is commonly used to assess soil quality [29] and could be beneficial for determining key individual soil quality indicators [30]. Although crop yield has been neglected in many previous studies, in sustainable agricultural systems, high soil quality is characterized by high productivity [31]. The development of crops and their production depend on the soil type. On shallow soils (e.g., Entisols) with near-surface lithic contact, which is a root limiting layer with a high degree of erosion, and low fertility, crop growth is limited and crop expansion will decrease. By comparison, cultivated crops can grow vigorously on deeper soils (e.g., Inceptisols), which have greater soil depth, permeability, water retention, fertility, and a lower degree of erosion [5,15,32,33]. Therefore, a systematic soil quality assessment for rainfed winter wheat, as one of the most important crops throughout the world, based on yield under various soil types is essential to develop appropriate soil management strategies and to enhance the rainfed winter wheat yield. This paper applies a soil quality assessment framework to perform soil quality evaluations for rainfed winter wheat for two different soil orders. In so doing it will address several aims:
i-
to evaluate the quality of soils based on the two weighting methods: multi linear regression and factor analysis;
ii-
to establish a minimum data set for assessing soil quality for rainfed winter wheat;
iii-
to evaluate the impacts of soil type on soil quality and rainfed winter wheat yield;
iv-
to assess soil quality in rainfed winter wheat systems based on rainfed winter wheat yields.

2. Materials and Methods

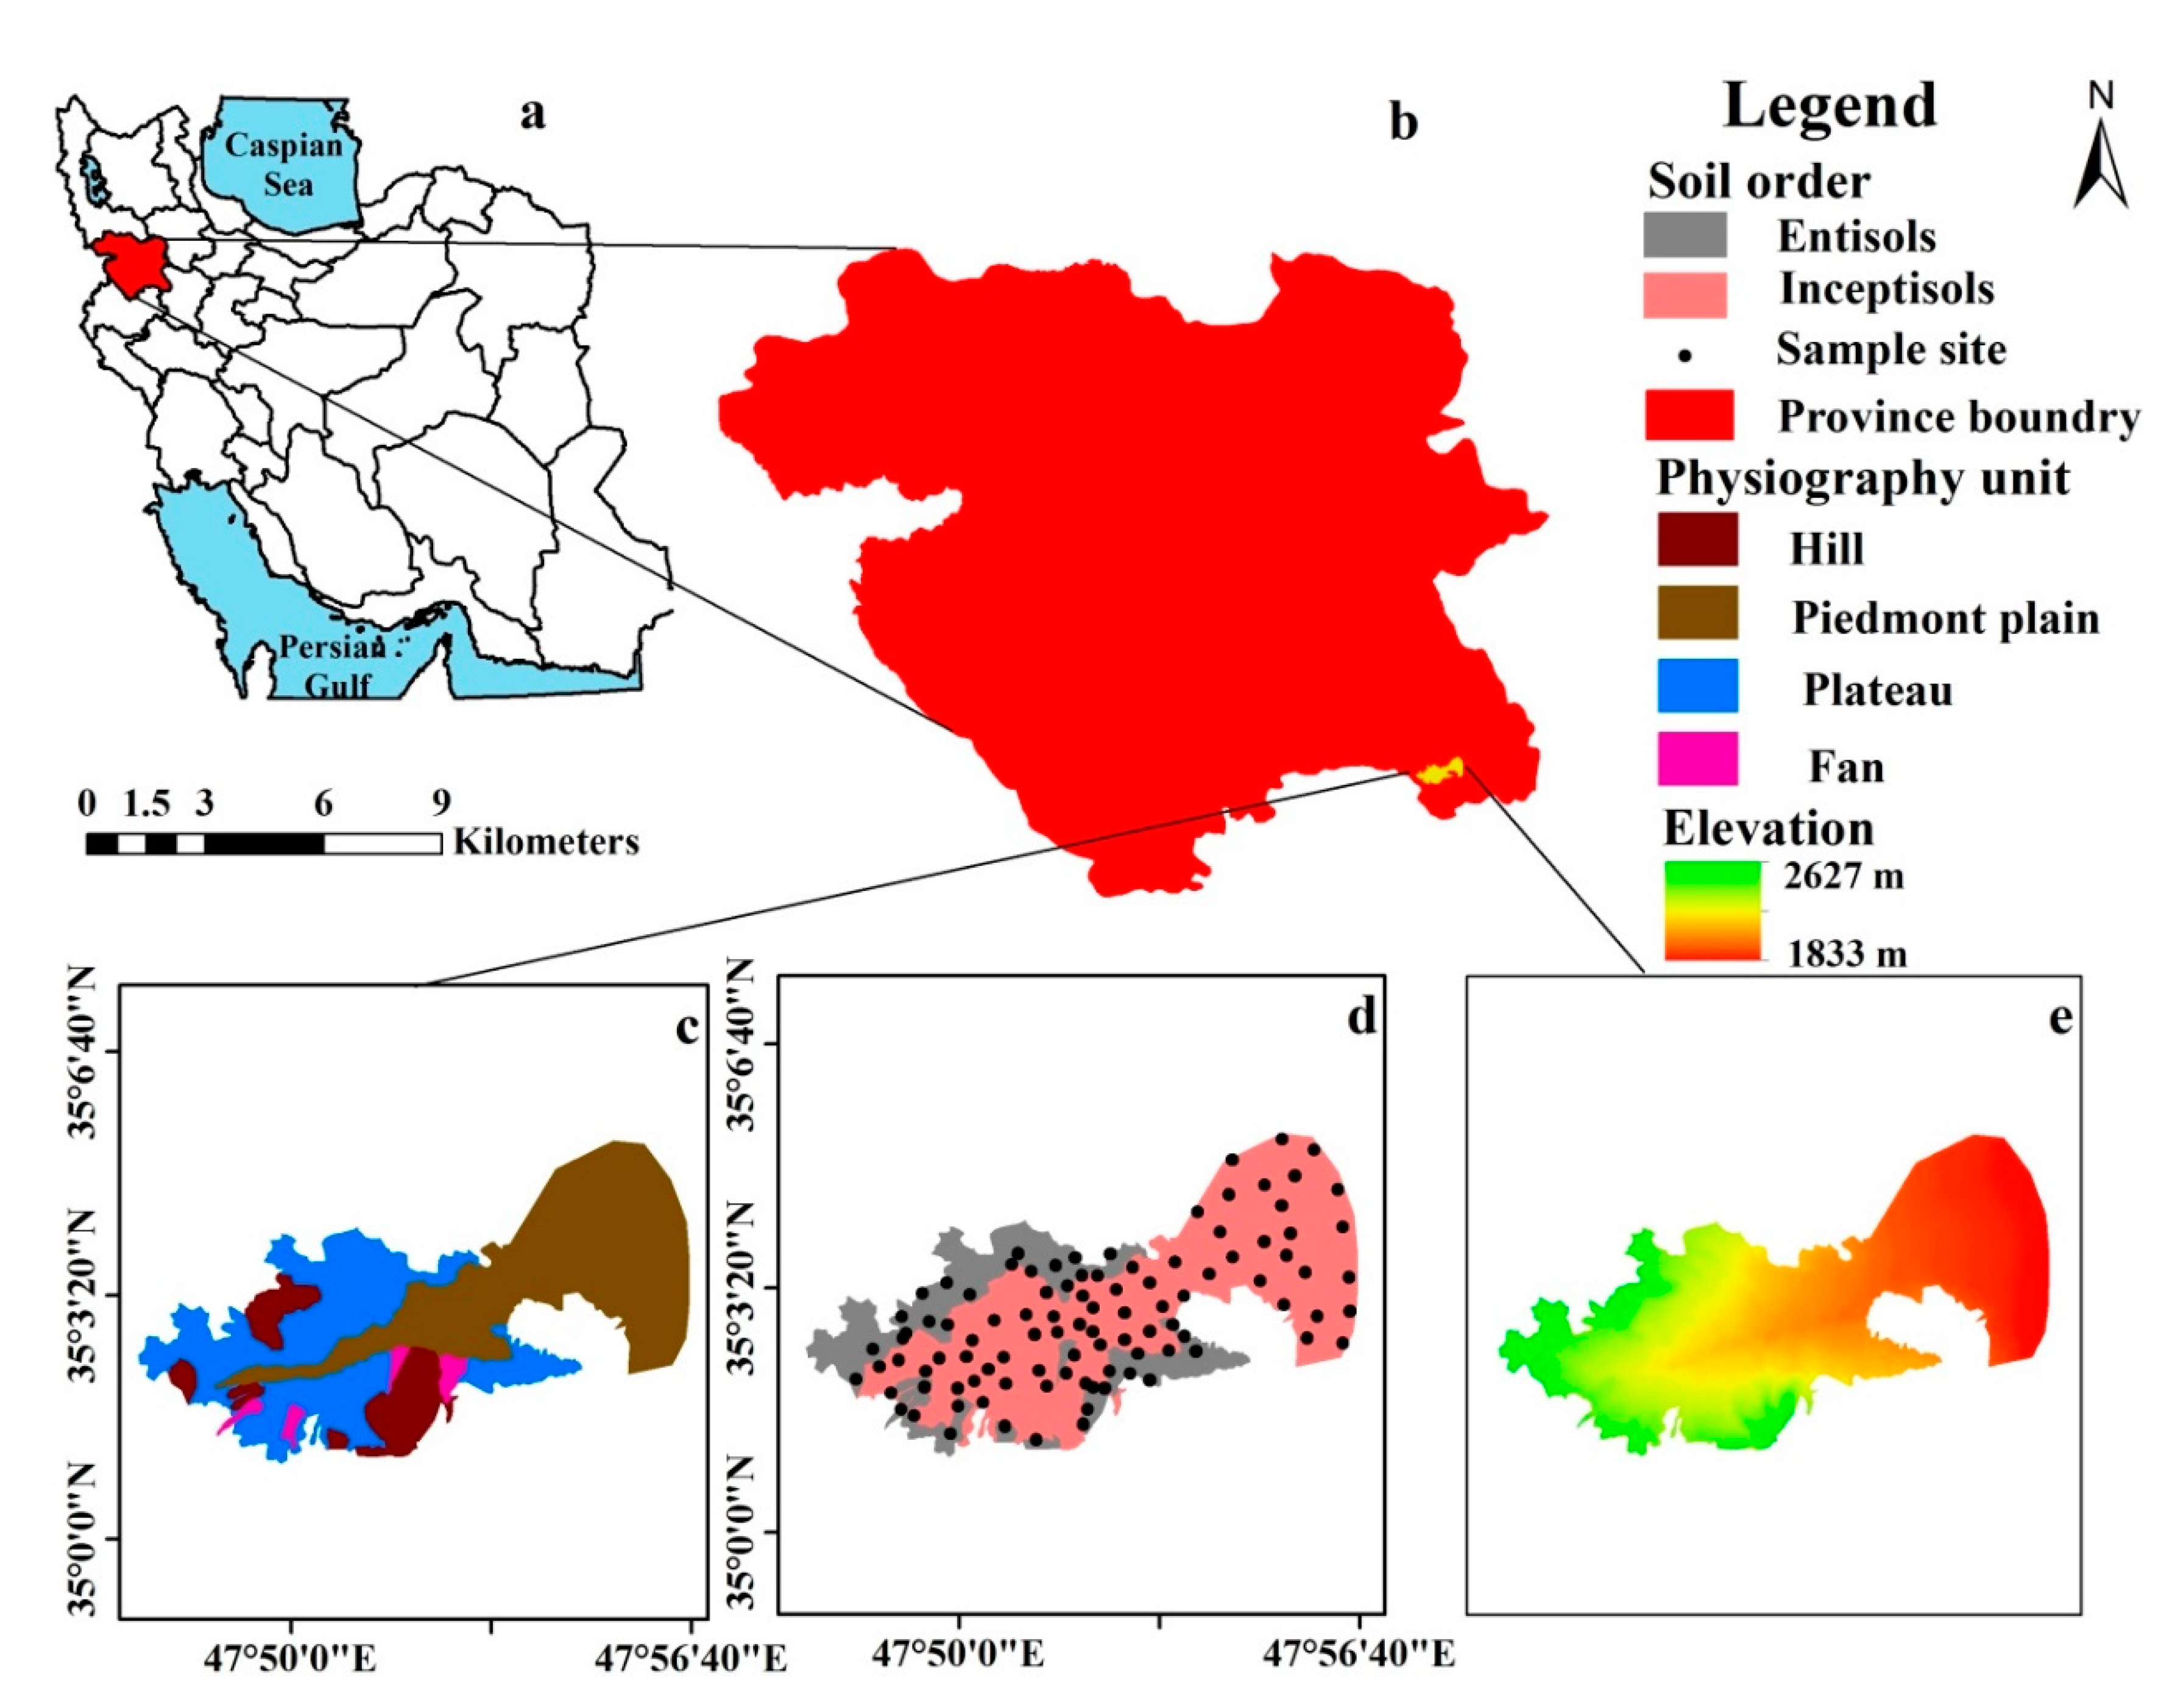
2.1. Description of the Study Area
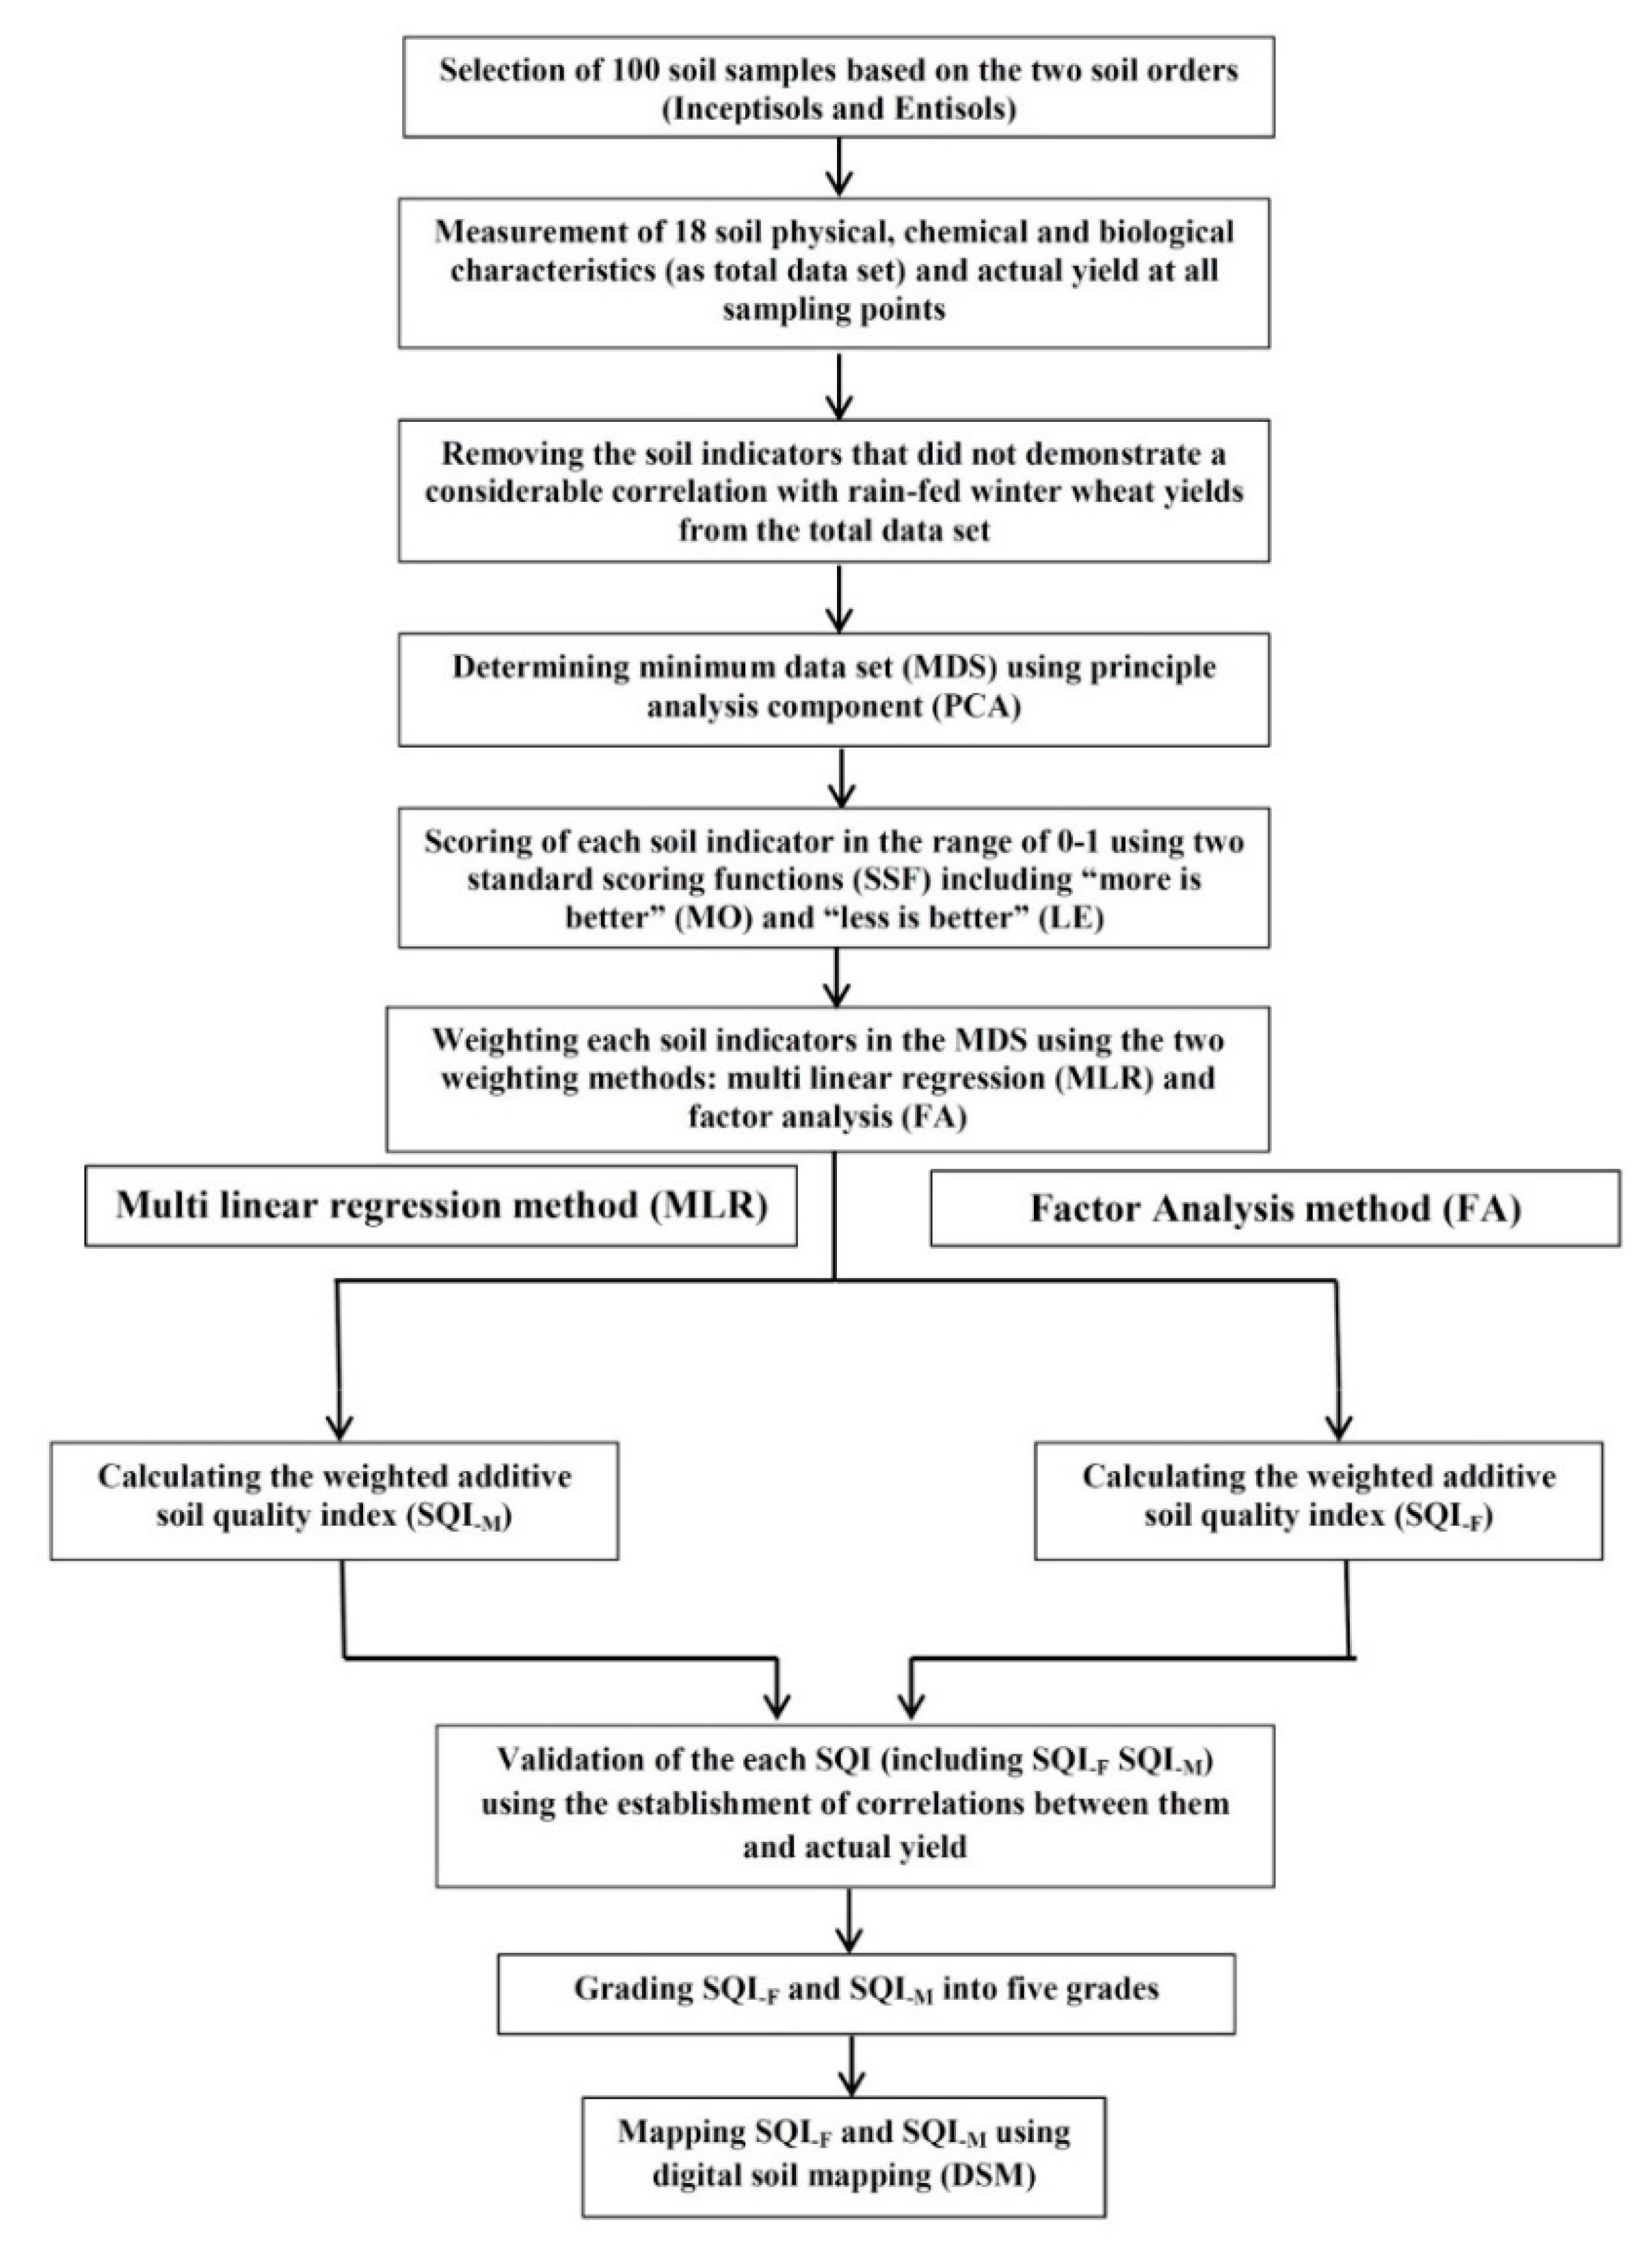
The study area had an area of 53.20 km2 and was located in the city of Ghorveh, western Iran (Figure 1). The climate is semi-arid with a mean annual rainfall of 369.8 mm, mainly concentrated in the winter (October to March). The yearly mean temperature (10.8 °C) is relatively cool. The area is categorized by a Xeric soil moisture regime and a Mesic soil temperature regime. Elevation changes from 1833 to 2627 m and slopes range from 1 to 30% (Figure 1). The primary land use is cropland, where farm machinery operations with conventional tillage systems are commonly completed by 15 October. Winter wheat (Triticum aestivum L.) was planted on 15 October at a depth of 4 cm, 17 cm row spacing and a seed rate of 160 kg ha−1. Burning crop residue is a common practice in the study area. Wheat and fallow is a common 2-year crop rotation. Triple superphosphate fertilizer was applied at a rate of 50 kg ha−1, on wheat fields before sowing. Nitrogen fertilizer (urea) was applied at a rate of 100 kg ha−1, on wheat fields before sowing, and at the stem elongation stage. Commonly used herbicides and pesticides are 24D and Deltamethrin, respectively. Management factors such as application rate of fertilizer, crop rotation, variety of winter wheat, seeding method, planting density, setting of planting, machinery etc. are similar throughout the study area.
Based on the USDA soil taxonomy classification method [34] and the World Reference Base for Soil Resources (WRB) of the FAO [35], the majority of the soils in the study area were Entisols (Leptosols) and Inceptisols (Cambisols). The main physiographic units were piedmont plain, fan, plateau, and hill (Figure 1). The soils of the piedmont plain and the majority of the plateau were Inceptisols and were deep with a surface horizon (Ap) and subsurface horizon (Bk and Bw). Conversely, the soils of the hill and the majority of fans, called Entisols, were thin with surface horizon (Ap) and lithic contact near to the soil surface. Each stage of this work was carried out and Figure 2 summarizes these procedures as a flowchart. The stages of this work were:
i-
Selection of 100 soil samples based on two soil orders (Entisols and Inceptisols);
ii-
Measuring 18 soil physical, chemical, and biological characteristics as a total data set. Actual yield of rainfed winter wheat was also measured at 100 sampling points using a 1 m2 quadrat;
iii-
Removing the soil indicators that did not demonstrate a consistent correlation with rainfed winter wheat yields from the total data set;
iv-
Determining the minimum data set (MDS) using principal component analysis (PCA);
v-
Scoring of each soil indicator in the MDS in the range of 0–1 using two standard scoring functions (SSF) including “More is better” (MO) and “Less is better” (LE) to standardize soil indicators measured on different scales;
vi-
Weighting each soil indicator in the MDS using two weighting approaches including multi linear regression (MLR) and factor analysis (FA);
vii-
Calculating the two weighted additive soil quality indices (SQIw): SQIw-F (FA method) and SQIw-M (MLR method);
viii-
Validating each SQI (SQIw-F and SQIw-M) using the establishment of correlations between them and the actual yields of rainfed winter wheat;
ix-
Grading each SQI (SQIw-F and SQIw-M) into five grades (very high, high, moderate, low, and very low);
x-
Mapping each SQI (SQIw-F and SQIw-M) using digital soil mapping (DSM) approaches.

2.2. Sampling and Soil Analysis

Soil and winter wheat samples were collected at 100 locations, from the center of 1 m2. Soil samples were collected soon after the winter wheat harvest. Figure 1d shows that at the soil order level, 35 and 65 composite samples were collected at a depth of 0–20 cm from the Entisol and Inceptisol orders, respectively. Each composite soil sample (0–20 cm depth) was a combination of five subsamples (one sample from each corner and one from the center of a 1 m2 quadrat).
The following soil properties were measured according to standard methods: soil organic carbon (SOC) [36], soil bulk density (BD) [37], particle density (PD) [37], soil porosity (PO) [38], soil pH [39], electrical conductivity (EC) [40], mean weight diameter (MWD) of soil aggregates [41], cation exchange capacity (CEC) [42], calcium carbonate equivalent (CCE) [43], particle size distribution [44], exchangeable sodium percentage (ESP), soil microbial respiration (SMR) [45], total nitrogen (TN) [46], available phosphorus (AP) [47], available potassium (AK) [48], and available Fe, Mn, Zn, and Cu [49].

2.3. Measurement of Actual Yield

From each sample site, wheat samples and plants (planting density within 1 m2 was uniform) were harvested by hand within a 1 m2 quadrat (in August 2017). All the plant samples were oven-dried for 48 h at 75 ℃ and then wheat grains were weighed to obtain their dry grain weights. Wheat yield (Equation (1)) for all of the 100 sampling sites were gathered from the farms.
Yield = ((N1 × 10000) × N2 × (N3/1000))/(1000)
where Y is yield (t ha−1), N1 is ear number per m2, N2 is grain number per ear (yield components in wheat), and N3 is thousand grain weight.

2.4. Assessment of Soil Quality Index (SQI)

2.4.1. Determining the Minimum Data Set (MDS)

The total data set comprised the following soil properties: soil texture, pH, OC, BD, PO, EC, MWD, CEC, CCE, SMR, ESP, TN, AK, AP, AFe, AMn, AZn, and ACu. These soil properties were selected based on previous literature [5,15,16,17,22,24,26,27,33,50,51,52,53,54]. Initially, the soil quality indicators that did not demonstrate a significant correlation with wheat yields were removed and were not included in the MDS [6]. Then, PCA was applied to select soil quality indicators for the MDS [9,13]. In the PCA method, those PCs with large Eigenvalues (≥1) were selected as soil quality indicators of the MDS. For each PC, variables received a weight representing their contributions to the PC. Only highly weighted variables were selected from each PC to define the minimum data set [13,31].

2.4.2. Indicator Scoring of Soil Quality Indicators

A linear scoring function for each soil quality indicator in the MDS was used to eliminate the effect of soil quality indicators measured on different scales [13,51]. Two standard scoring functions (SSF), “More is better” (Equation (2)) and “Less is better” (Equation (3)) were applied to allocate a score in the 0–1 range to each soil quality indicator. The “More is better” SSF was used for all of the MDS indicators except sand where the “Less is better” SSF was used. These standard scoring functions were selected according to previous literature (Table 1). For the “More is better” SSF, each soil quality indicator was divided by the maximum observed value such that maximum values received a score of 1. Conversely, for “Less is better”, each soil quality indicator was divided by the minimum value such that the lowest value received a score of 1. Table 1 shows the maximum and minimum threshold values for all soil quality indicators.
Y = (X − L)/(H − L)
Y = 1 − (X − L)/(H − L)
where Y is the linear score in the range of 0 and 1, X is the variable value, L is the lowest value, and H is the highest value [55].

2.4.3. Weighting of Soil Quality Indicators

Soil quality indicator weights in the MDS were assigned by two weighting approaches (MLR and FA). In the MLR method, modeling was carried out by using the wheat yield and the MDS soil quality indicators as dependent and independent variables, respectively. The weight of each soil quality indicator was defined as the ratio of its standardized regression coefficient divided using the summation of the standardized regression coefficients of all MDS soil quality indicators. In the FA method, soil quality indicators were weighted based on communality. Communality of each soil quality indicator explained a certain percentage of the variation in the MDS data. For all soil quality indicators, weight values resulted from the ratio of communality of all soil quality indicators in the MDS to the summation of each soil quality indicator in the MDS approaches [56].

2.4.4. Calculating of Soil Quality Index

According to the method proposed by [58,59], the chosen soil indicators were used to calculate the Weighted Additive Soil Quality Index (SQIw) (Equation (4)):
S Q I = i = 1 n W i N i
where Wi is the weighting factor for soil indicators and Ni is the indicator score. Two SQIs, the SQIw-F (FA method) and the SQIw-M (MLR method) were computed using the two weighting methods.

2.4.5. Validation of the Soil Quality Index

The measured wheat yield was used for validation of soil quality indices. Correlations between each SQIw (SQIw-F SQIw-M) and actual yield of rainfed winter wheat were analyzed.

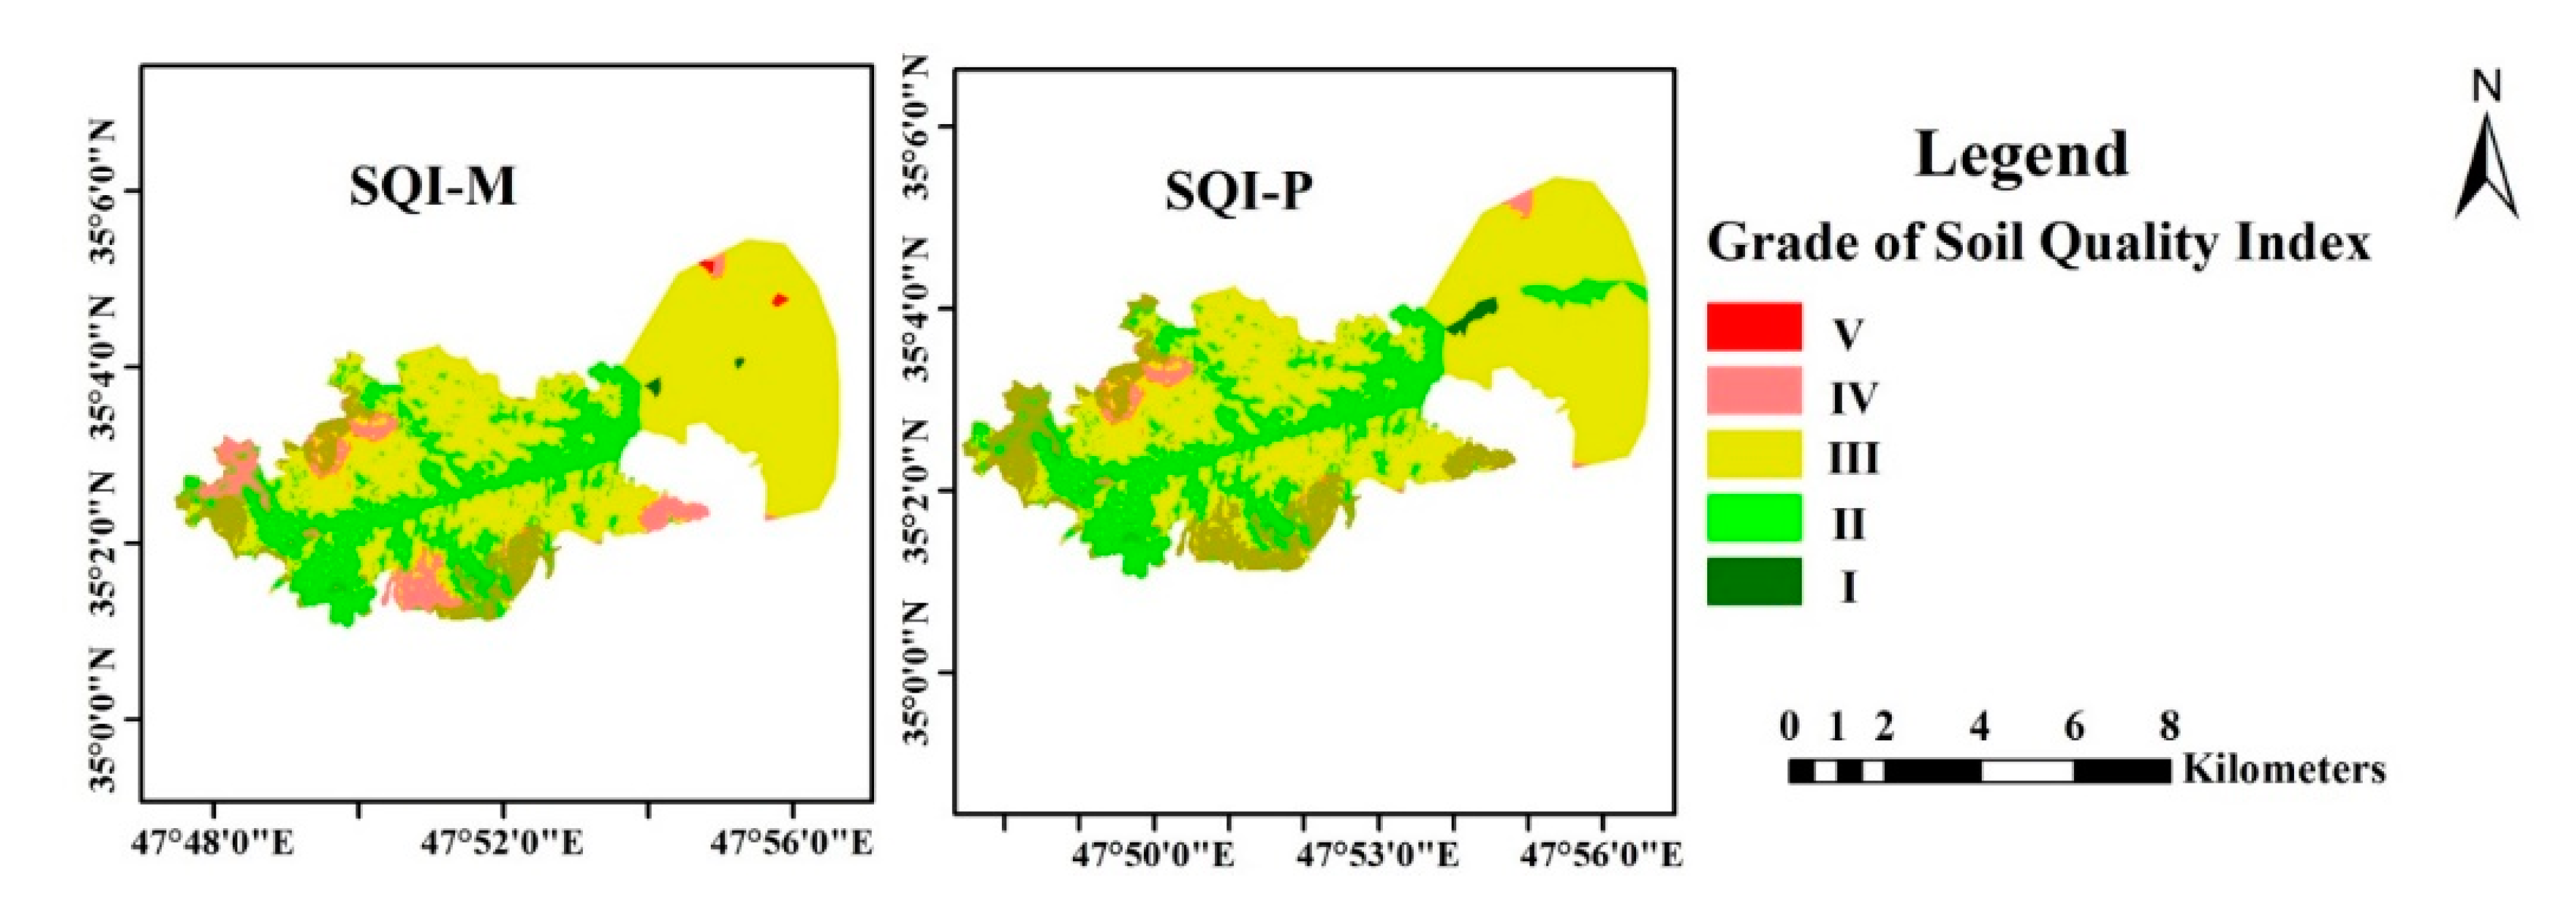
2.4.6. Grading and Mapping of Soil Quality Index

The two SQIs, SQIw-F (FA method) and the SQIw-M (MLR method), were separated into five grades (very high, high, moderate, low, and very low). Then, the two SQIs maps were plotted from predictions of soil quality at unmeasured locations using digital soil mapping (DSM) approaches. DSM approaches are useful tools for mapping soil properties [60]. In DSM, quantitative models have been applied to link between soil observations and auxiliary variables to understand spatial variation in soil properties [60]. In this approach a set of auxiliary variables (e.g., terrain attributes) is applied to map different soil properties [17,25,61]. In the current research, an artificial neural network (ANN) model and a set of auxiliary variables (i.e., soil map, terrain attributes, and remotely sensed data) were used to predict and map the SQIs (SQIw-M and SQIw-F) in the R software environment. Validation of the DSM maps and the ANN model was performed using the coefficient of determination (R2) and root mean square error (RMSE) and through leave-one-out (LOO) cross-validation.

2.5. Statistical Analysis

Prior to statistical analysis, the normality of all data was examined using the Kolmogorov-Smirnov test and visual examination of histograms. All statistical analyses including the two weighting methods (multi linear regression and factor analysis) and principal component analysis to determine minimum data set were performed with the statistical software SPSS 17.0 [62]. Significant differences between all of the measured soil properties were tested using an independent samples t-test. The statistical significance of the difference was p < 0.05.

3. Results

3.1. Soil Indicators Variability and Rainfed Wheat Yield

Table 2 shows the descriptive statistics of the soil properties measured and rainfed wheat yield at each sampling point. Almost all of the soils were basic (pH 7.60–8.92) with a mean pH of 8.09. EC values were low (0.1 and 0.30 dSm−1) with a mean value of 0.17 dSm−1. The OC and TN contents were also low in the studied soils, with mean values of 0.15% (range = 0.06 to 0.52%) and 0.02% (range = 0.01 to 0.10%), respectively. Based on the general evaluation of the coefficient of variation (CV), the CVs of OC and TN were high (more than 35%), suggesting a high variability across the study area. This large variation in OC and TN can be mostly due to the variability in topography. CEC, ESP, MWD, BD, SMR, and CCE were in the range of 6.25–29.00 cmoL ckg−1, 1.11–5.72%, 0.55–5.10 mm, 1.1–1.6 g cm−3, 75.70–205 mg CO2 g day−1, and 1.25–30.25%, respectively. The average sand, silt, and clay contents were 48.66%, 28.18%, and 23.15%, respectively. The mean AK, AP, ACu, AZn, AFe, and AMn contents were 128. 67, 13.14, 0.43, 0.28, 3.49, and 1.1 mg kg−1, respectively, and were randomly dispersed across the study area (with a CV of more than 35%, except for AP, AK). The mean rainfed wheat yield was 1.16 ton ha−1 and ranged between 0.5 and 1.85 ton ha−1. The CV of rainfed wheat yield was moderate (25.71%).

3.2. The Minimum Data Set (MDS)

Based on the Pearson’s correlation coefficients among the rainfed wheat yield and all soil indicators (Table 3), soil indicators including silt, SP, BD, AZn, ACu, AFe, CCE, pH, and EC were deleted because they were not significantly correlated with rainfed wheat yield. The soil indicators retained for PCA comprised OC, sand, clay, MWD, CEC, SMR, ESP, TN, AK, AP, and AMn. The first six PCs had eigenvalues of more than 1 and explained 98% of the variance of the original data (Table 4). The PCA results showed that SMR had the highest loadings (0.866) with respect to PC1 compared to other soil quality indicators. AK (−0.855), sand (0.882), CEC (−0.889), clay (−0.816), and AP (0.900) also had the highest loadings with respect to PC2, PC3, PC4, PC5, and PC6, respectively, compared to other soil quality indicators (Table 4). OC also had a high loading (−0.603) for PC4, but had a strong correlation (r > 0.60) with CEC and therefore it was not used as a property to represent PC4.

3.3. Weighting

MLR and FA were applied to allocate the soil indicator weights. In the MLR method, clay and AK had the highest weights (0.20 and 0.193, respectively), sand and SMR had the lowest weights (0.132 and 0.134, respectively), and AP and CEC had intermediate weights (0.163 and 0.177, respectively), (Table 5). In the FA method, according to communality analysis (Table 5), clay and CEC had maximum weights (0.217 and 0.196, respectively), sand and SMR had minimum weights (0.100 and 0.136, respectively), and AK and AP had intermediate weights (0.179 and 0.172, respectively).

3.4. SQI and Weighting Methods

Using the MLR weighting technique (SQIw-M), the values of SQIw-M for the studied soils varied from 0.16 to 0.73, with an average of 0.559 and a CV of 21.16%. Using the FA weighting technique (SQIw-F), the values of SQIw-F varied from 0.17 to 0.77, with a mean of 0.579 and a CV of 22.09%. Table 6 shows the grades of soil quality indices (SQIw-M and SQIw-F). Percentage of grades I (very high quality), II (high quality), III (moderate quality), IV (low quality), and V (very low quality) in the study area for the SQIw-F, were 1%, 26.03%, 48.03%, 18.27%, and 6.67% respectively, and for the SQIw-M were 0.25%, 23.55%, 50.06%, 11.04%, and 15.10%, respectively. For SQIw-F and SQIw-M, grade III was dominant, accounting for 48.03 and 50.06% of all locations, respectively, therefore, the majority of the study area has moderate soil quality (Table 6). For both SQIw-M and SQIw-F, there were lower percentages of grades I, II, and III for Entisols (0%, 8.42%, and 15.78% for SQIw-M and 0%, 6.14%, and 15.85% for SQIw-F, respectively) compared to Inceptisols (0.25%, 15.13%, and 34.28% for SQIw-M and 1.00%, 19.89%, and 32.18% for SQIw-F, respectively) (Table 6, Figure 3). Conversely, there were lower percentages of grade IV and V of SQIw-M for Inceptisols (3.05% and 5.79% for SQIw-M, and 3.85% and 2.10% for SQIw-F, respectively), compared to Entisols (7.99% and 9.31% for SQIw-M, and 14.42% and 4.57% for SQIw-F, respectively) (Table 6, Figure 3).

3.5. SQI According to Soil Orders

The SQIs were calculated using two weighting methods, SQIw-M and SQIw-F. For Entisols, the SQIw-M ranged from 0.22 to 0.72 and SQIw-F ranged from 0.20 to 0.77, with an average of 0.54 and 0.56, respectively. For Inceptisols, the SQIw-M and SQIw-F values ranged between 0.16 to 0.73 and 0.16 to 0.76, averaging 0.57 and 0.59, respectively (Table 6). The mean values for both SQIs (SQIw-F and SQIw-M) were lower in Entisols than in Inceptisols although these values were not significantly different (Table 7). For both SQIw-M and SQIw-F, the majority of grades I, II, and III were located in the piedmont plain and plateau geomorphology units. In contrast, the majority of grades IV and V of both SQIw-M and SQIw-F were located in the hill geomorphology unit (Figure 1 and Figure 3).

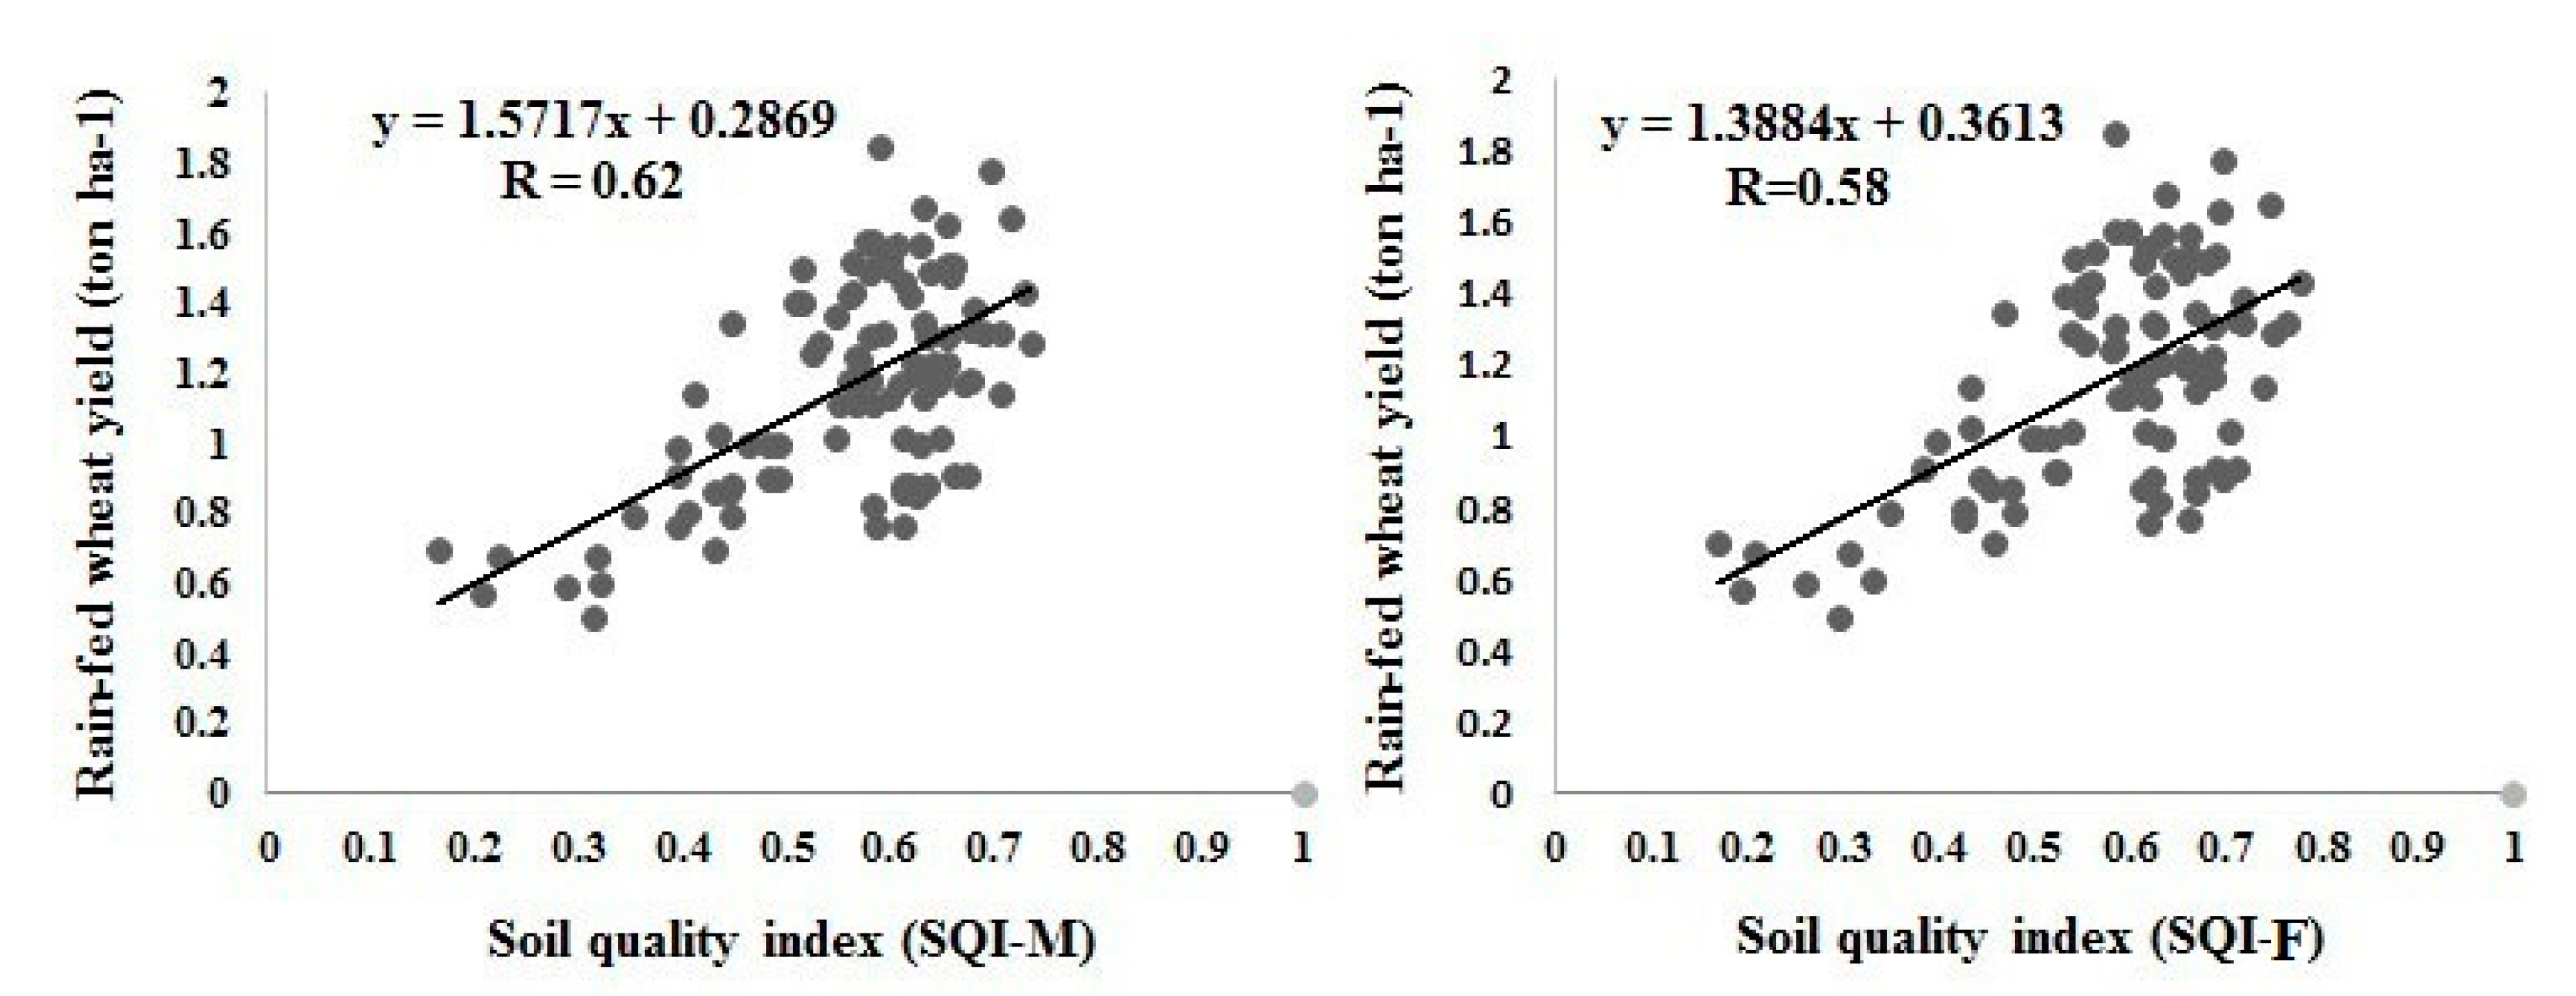
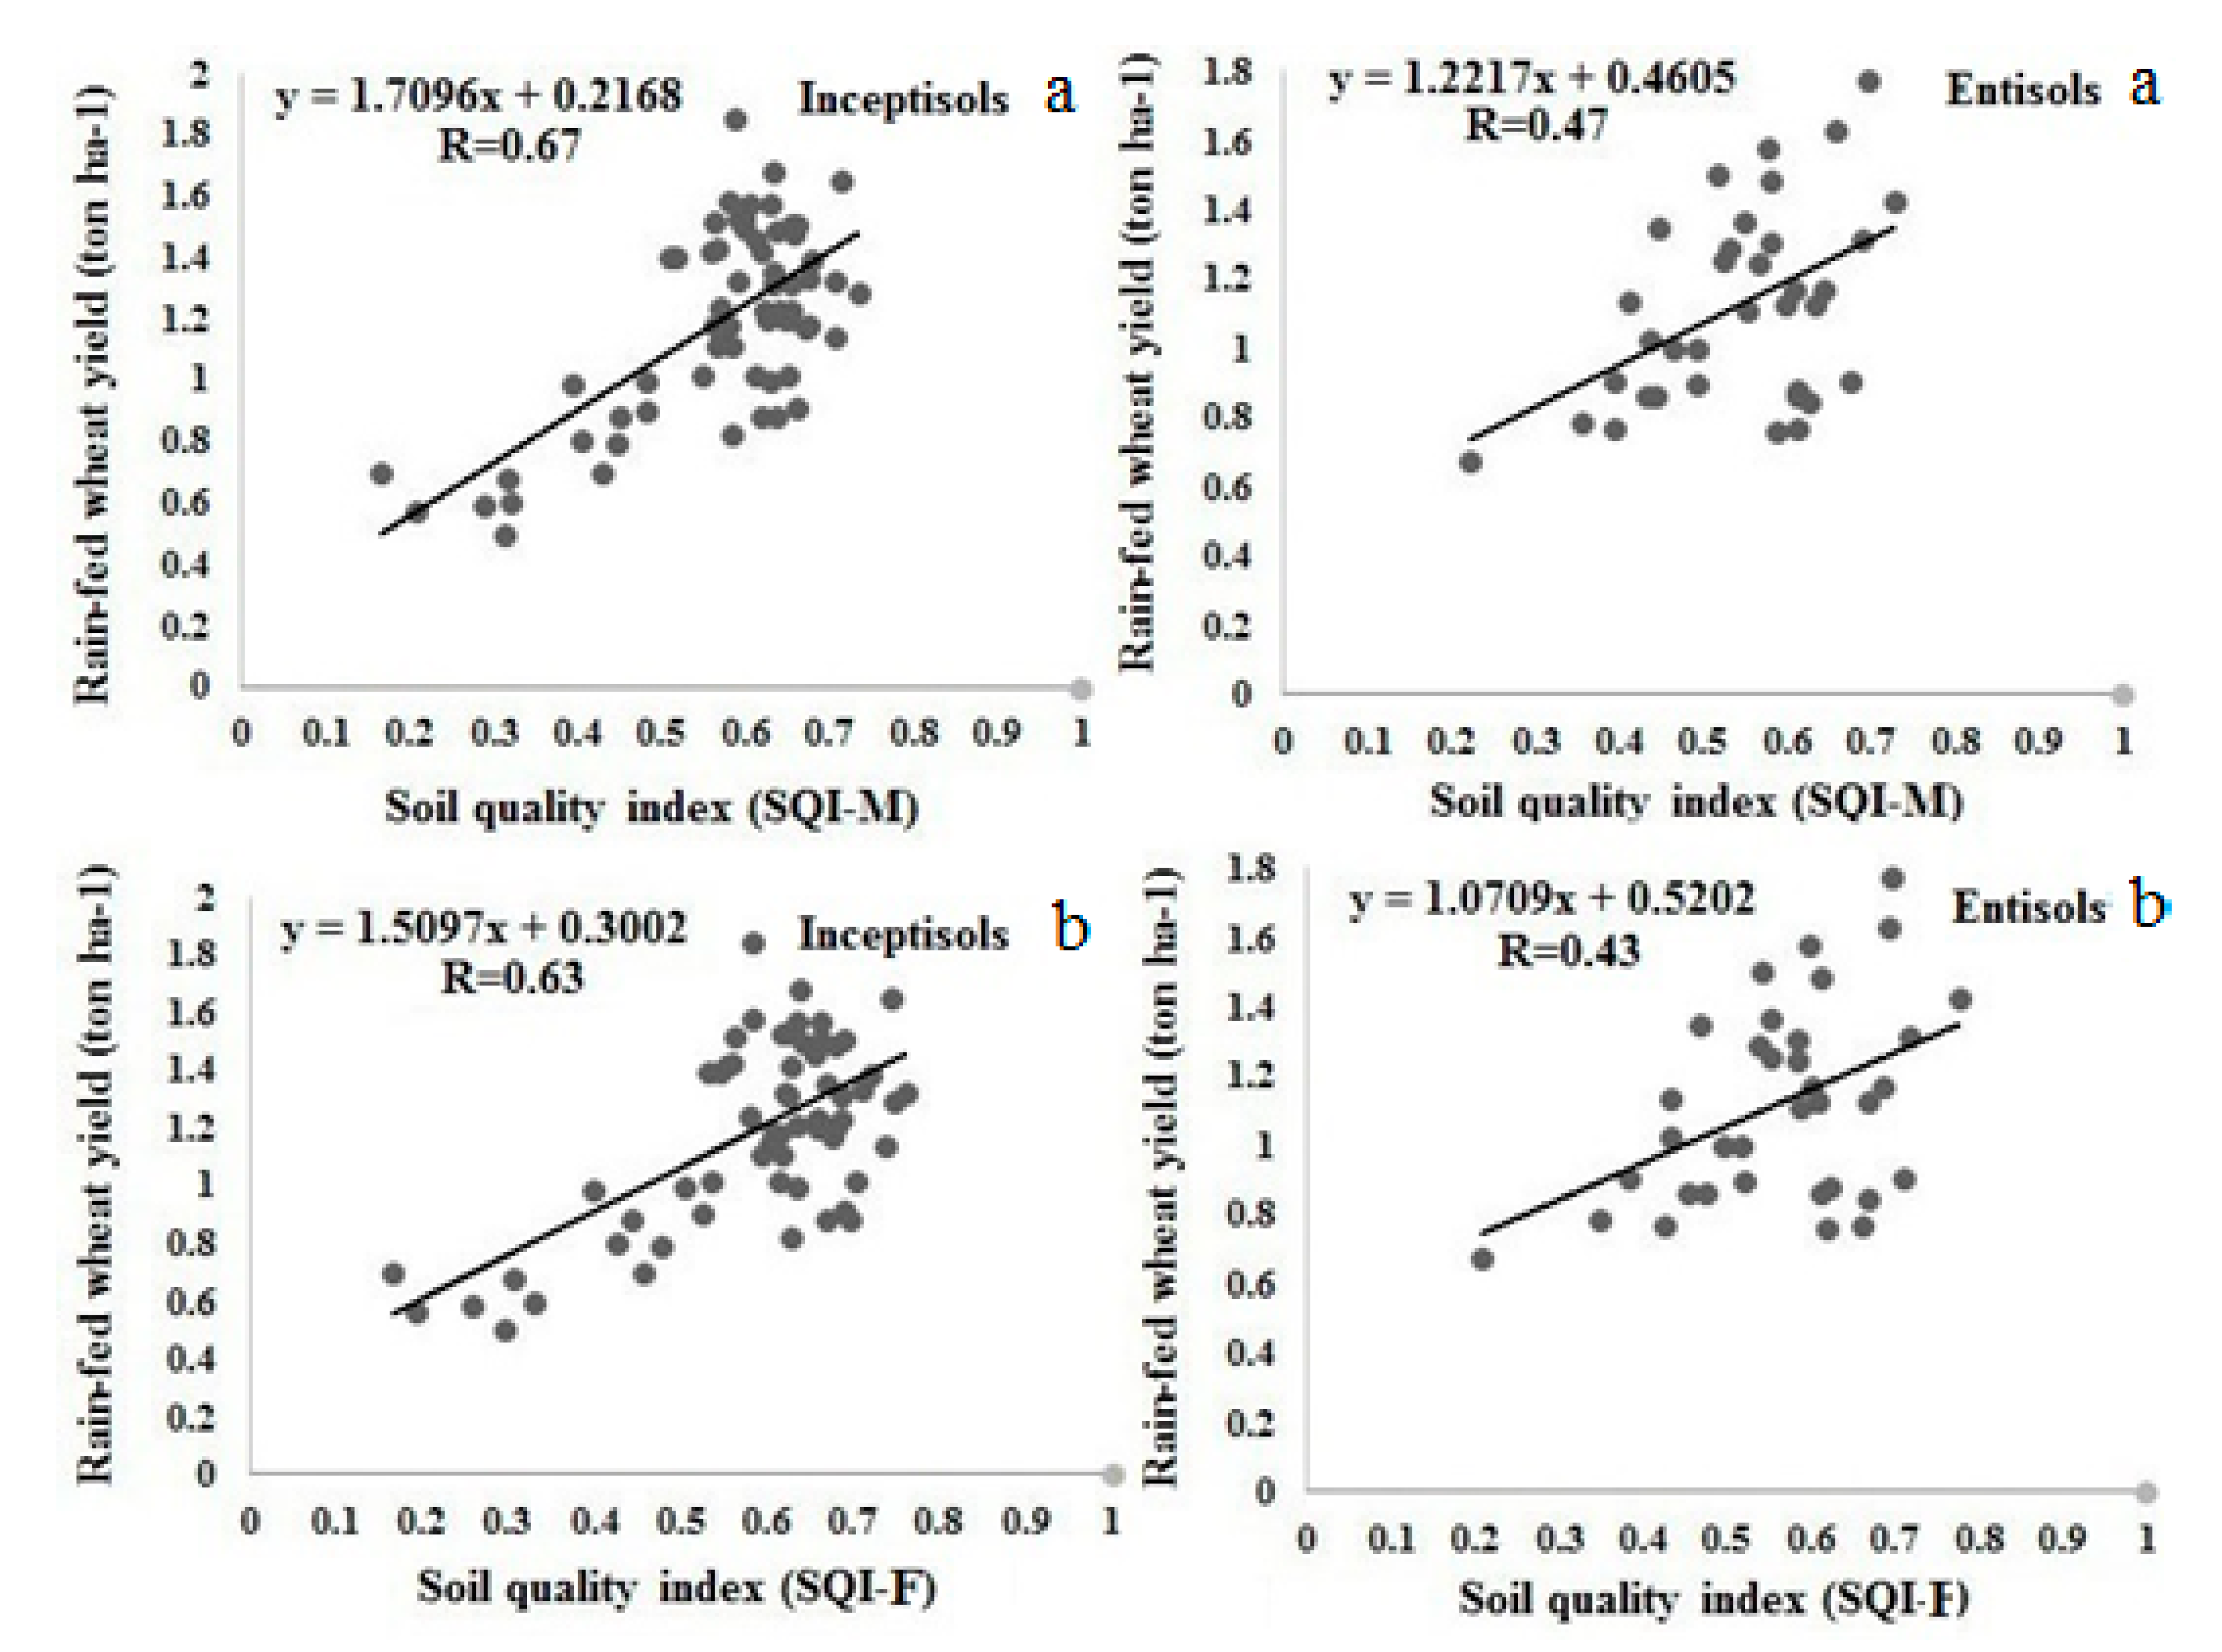
3.6. Validation of SQI

3.6.1. Different Weighting Methods

For validation of the SQIs, the relations between both rainfed wheat yield and SQIs were examined. The rainfed winter wheat yield showed a significant correlation with SQIw-M and SQIw-F for the total data set. It also showed that the MLR weighting technique was slightly more accurate (r = 0.62) than the FA (r = 0.58) as a weighting method (Figure 4).

3.6.2. Different Soil Orders

There is a significant correlation with the rainfed winter wheat yield and SQIw-F and SQIw-M for both Entisols and Inceptisols. The MLR weighting technique in Entisols had slightly higher accuracy (r = 0.47) than the FA weighting technique (r = 0.43) (Figure 5) and the MLR weighting method was also more accurate for Inceptisols (r = 0.67) than the FA weighting method (r = 0.63) (Figure 5). The values for two SQIs (SQIw-M and SQIw-F) and rainfed wheat yield were lower for Entisols than for Inceptisols; however, these values were not significantly different (Table 6).

4. Discussion

4.1. The Minimum Data Set (MDS)

Eighteen physical, chemical and biological soil properties (as total data set) were measured. Then, an MDS was established to assess soil quality for rainfed wheat growth across soil orders at the regional scale. The MDS selection procedure has been commonly suggested by other researchers to assess soil quality [27,57,63]. The temporal and financial resources for soil sampling and analysis can be reduced by using the MDS method. However, in comparison to the total data set, some soil quality information is lost. The selected six soil properties (clay, sand, CEC, SMR, AP, and AK) used in SQIs formed with the MDS method are similar to the findings of the other studies [5,6,26,27,51,52,54].

4.2. Evaluation of Approaches to Weighting SQIs

The results of the current study showed that the MDS soil indicators (clay, sand, CEC, SMR, AP, and AK) and rainfed wheat yield had higher significant correlations with the calculated soil quality index using the MLR weighting method (SQIw-M) than with the soil quality index calculated using the FA weighting method (SQIw-F) (Table 3, Figure 3 and Figure 5). Therefore, the MLR weighting technique is more accurate than the FA weighting technique and should be used for future soil quality evaluations for rainfed wheat in western Iran. Cheng et al. [6] indicated that SQIs calculated using the MLR weighting method (SQIw-M) had a significantly higher correlation with orange yield (R2 = 0.43) compared to the FA weighting method SQIw-F (R2 = 0.35). Similar results were also reported in Northeast and Central China by Chen et al. [28] when studying a soybean production system.

4.3. Soil Quality Indicators and Suggestions for Soil Quality Management

In the study region, the mean AK contents in both Entisols and Inceptisols (122.79 and 131.48 mg kg−1, respectively) (Table 7), were smaller than the critical amount of soil AK content (200 mg kg−1) needed for rainfed wheat based on the soil nutrient classification criteria of the Soil and Water Research Institute of Iran [64,65,66]. The potassium status of different soil orders (Inceptisols and Entisols) depends on the parent material, texture, mineralogy, and management practices [67]. Traditionally in the study region, application of K fertilizer is not a common practice of farmers. Consequently, it is recommended that K fertilizer is used in the studied area, particularly in fields where AK contents are less than the critical limit. It should be noted that based on the critical amount of soil AK content (200 mg kg−1), response probability to potash fertilizer consumption is lower than 50%. In contrast, the mean AP contents in Entisols and Inceptisols were 12.32 and 13.59 mg kg−1, respectively, which were more than the moderate critical amount of soil AP content (7 mg kg−1) needed for rainfed wheat based on the categorization criteria of soil nutrients of the Soil and Water Research Institute of Iran [64,65,66]. In this study, AP content was more than the critical amount due to annual P fertilizer being commonly applied in rainfed wheat fields.
The mean micro nutrients contents (AFe, AZn, ACu, and AMn) for Entisols (3.30, 0.23, 0.46, and 1.11 mg kg−1, respectively), and Inceptisols (3.59, 0.30, 0.41, and 1.10 mg kg−1, respectively), were lower than the critical amounts (7.5, 1, 0.5, and 10 mg kg−1, respectively), needed for rainfed wheat in Iran (Table 7) [64,65]. Moreover, the mean SOC contents for Entisols and Inceptisols were 0.14 and 0.16%, respectively, which were lower than the critical amount of soil SOC (1%) needed for rainfed wheat in Iran.
In this study, the soil textures were sandy clay loam, loam, sandy loam, and clay loam; and sand content ranged between 35.20 to 75.68%. The variability of sand percentage affects the capability of soil tillage, subsequently affecting wheat growth and yield. Most of the studied rainfed wheat was found on soils underlain by granite and granodiorite, which have coarse textures; therefore, soils derived from these rocks also have a coarse texture. Soil texture is a permanent soil property, which controls the retention and uptake of soil water, nutrients, and oxygen. Coarse texture means a higher percentage of sand as compared to silt or clay, therefore such soils have greater aeration and poor water retention which is not suitable for rainfed wheat sites.
In general, as SOC serves as food in the soil, instead of pure fertilizers an application of organic fertilizer can lead to an increase in nutrients, accumulation of SOC, and can amend soil texture.

4.4. Links between Soil Orders and SQIs

The mean SQI values showed higher quality for Inceptisols than for Entisols; however, this difference was not statistically significant (Table 7). The mean values of rainfed winter wheat yield were also greater for Inceptisols than Entisols due to slope and erodibility differences between these soil types. Nevertheless, this difference between the soil types was not statistically significant (Table 7). Entisols were characterized as younger, less developed and shallower soils than Inceptisols. Entisols were mostly located on the hill geomorphology units, which are more susceptible to soil erosion and soil quality degradation due to steeper slopes. In comparison, Inceptisols orders were located on the lower slopes (piedmont plain and plateau geomorphology units), which could influence many soil processes that are important for soil formation (Figure 1). In several studies, it has been demonstrated that slope has a marked influence on soil quality [25,68,69]. This result demonstrates the impact of soil type on the soil quality of the study region. Many studies have noted that soil type has a significant impact on soil quality [7,70,71]. Biswas et al. [5] showed that a SQI in cropping systems (rice-rice) in South Asia was greatest for Inceptisols (0.66 to 0.89), then Entisols (0.23 to 0.76), and was lowest for Alfisols (0.37 to 0.60) as the Alfisols were highly weathered, while Inceptisols/Entisols were relatively younger in nature. In contrast, Santos-Frances et al. [15] showed that Alfisols, Inceptisols, and Entisols had a high, medium, and low soil quality index, respectively, in a semi-arid ecosystem of Spain. Alfisols-covered flat surfaces (plateaus), were not very stony, and were thick.
Results also showed that the areas of the soil order Entisol had lower proportions of high soil quality grades (Grades I and II) (Table 6). Conversely, grades with low soil quality (Grades IV and V) were more abundant in this soil order compared to those of Inceptisols. The soil quality of Entisols was significantly restricted by high slopes and erodibility; it therefore had low overall quality. In the study area, the lower SQI value for Entisols was due to its intrinsic properties, high slopes, and erosion potential. Moreover, this soil type generally has lower development and did not have sufficient quantities of macro-and micro-nutrients (Table 7). This characteristic was a main reason for these soils mostly being classified as low-quality soil [15]. Consequently, for Entisols management practices including application of organic matter, chemical fertilizers and soil amendments could increase wheat yield [72,73].
The main factors affecting soil quality include climate, topography (geomorphological unit), soil type, plant species, and agricultural management practices like irrigation, fertilization, and tillage. Apart from soil type and topography, the factors influencing soil quality are similar amongst all the sampling sites. Therefore, the variation of soil types and topography could explain the majority of soil quality variability in this area and soil type must be considered for maintaining and increasing soil quality and yield sustainability in the wheat cropping systems for semi-arid Iran.

5. Conclusions

This study indicated that the MLR weighting technique is superior compared to the FA weighting technique with regard to its accuracy. Accordingly, it is suggested that MLR weighting be used for future soil quality evaluations in this region. The soil quality indicators retained in the MDS included AK, clay, CEC, AP, SMR, and sand. The study region’s soil quality is mostly poor and moderate; therefore, more attempts should be made to apply organic inputs like farm yard manure, compost or green manure and potassium (K) fertilizer in rainfed wheat fields. Generally, the soils of the Inceptisol order exhibited greater soil quality and rainfed wheat yield than soils of the Entisol order. For the Entisol order, the low SQIs especially depend on chemical, physical, and biological soil properties. Consequently, the improvement of soil properties with sustainable management and agricultural practices is necessary to enhance the SQI in the soils of the study area to increase wheat yield. Therefore, soil type must be taken into account for assessing soil quality and implementing appropriate practices. However, it is recommended for future studies to consider other driving factors such as soil quality, cost, work efficiency, occupational safety, and environmental load. Furthermore, it is suggested that in future studies soil moisture should be measured as one of the important soil quality indicators due to its effect on the ability of crops to effectively absorb nutrients from fertilizers.

Author Contributions

Conceptualization—K.N., R.T.-M.; methodology—K.N., R.T.-M., and E.H.; software—K.N., R.T.-M., and M.Z.; analysis—K.N., R.T.-M., E.H., and R.K.; investigation—K.N., R.T.-M., and A.M.; data curation—K.N., E.H., and A.M.; writing—original draft preparation—K.N., R.T.-M., R.K., and M.Z.; visualization—K.N., R.T.-M., E.H., and A.M.; Writing—review & editing—K.N., R.T.-M., A.M., R.K., and M.Z.; administration—A.M. All authors have read and agreed to the published version of the manuscript.

Funding

The University of Kurdistan funded this research.

Acknowledgments

Taghizadeh-Mehrjardi has been supported by the Alexander von Humboldt Foundation, Germany, under the grant number: Ref 3.4-1164573-IRN-GFHERMES-P. Furthermore, Mosavi contributed to this research under the Hungarian-Mexican bilateral Scientific and Technological project (2019-2.1.11-TÉT-2019-00007), and also the EFOP-3.6.2-16-2017-00016 project in the framework of the New Szechenyi Plan.

Conflicts of Interest

The authors declare no conflict of interest.

References

  1. Chaghazardi, H.R.; Jahansouz, M.R.; Ahmadi, A.; Gorji, M. Effects of tillage management on productivity of wheat and chickpea under cold, rainfed conditions in western Iran. Soil Tillage Res. 2016, 162, 26–33. [Google Scholar] [CrossRef]
  2. Song, Y.; Linderholm, H.W.; Wang, C.; Tian, J.; Huo, Z.; Gao, P.; Song, Y.; Guo, A. The influence of excess precipitation on winter wheat under climate change in China from 1961 to 2017. Sci. Total Environ. 2019, 690, 189–196. [Google Scholar] [CrossRef] [PubMed]
  3. Wang, L.; Li, Q.; Coulter, J.A.; Xie, J.; Luo, Z.; Zhang, R.; Deng, X.; Li, L. Winter wheat yield and water use efficiency response to organic fertilization in northern China: A meta-analysis. Agric. Water Manag. 2020, 229, 105934. [Google Scholar] [CrossRef]
  4. Houshyar, E.; Esmailpour, M. The impacts of tillage, fertilizer and residue managements on the soil properties and wheat production in a semi-arid region of Iran. J. Saudi Soc. Agric. Sci. 2020, 19, 225–232. [Google Scholar] [CrossRef]
  5. Biswas, S.; Hazra, G.C.; Purakayastha, T.; Saha, N.; Mitran, T.; Roy, S.S.; Basak, N.; Mandal, B. Establishment of critical limits of indicators and indices of soil quality in rice-rice cropping systems under different soil orders. Geoderma 2017, 292, 34–48. [Google Scholar] [CrossRef]
  6. Nosratabadi, K.; Szell, B.; Beszedes, F.; Imre, S.; Ardabili, S. Comparative Analysis of ANN-ICA and ANN-GWO for Crop Yield Prediction. In Proceedings of the RIVF International Conference on Computing and Communication Technologies (RIVF), Ho Chi Minh, Vietnam, 6–7 April 2020; pp. 1–5. [Google Scholar] [CrossRef]
  7. De Pascale, S.; Maggio, A.; Orsini, F.; Barbieri, G. Cultivar, soil type, nitrogen source and irrigation regime as qualitydeterminants of organically grown tomatoes. Sci. Hortic. 2016, 199, 88–94. [Google Scholar] [CrossRef]
  8. Merrill, S.D.; Liebig, M.; Tanaka, D.L.; Krupinsky, J.M.; Hanson, J.D. Comparison of soil quality and productivity at two sites differing in profile structure and topsoil properties. Agric. Ecosyst. Environ. 2013, 179, 53–61. [Google Scholar] [CrossRef]
  9. Andrews, S.S.; Karlen, D.L.; Cambardella, C.A. The Soil Management Assessment Framework. Soil Sci. Soc. Am. J. 2004, 68, 1945–1962. [Google Scholar] [CrossRef]
  10. Obade, V.D.P.; Lal, R. A standardized soil quality index for diverse field conditions. Sci. Total Environ. 2016, 541, 424–434. [Google Scholar] [CrossRef]
  11. Griffiths, B.S.; Ball, B.C.; Daniell, T.J.; Hallett, P.D.; Neilson, R.; Wheatley, R.E.; Osler, G.; Bohanec, M. Integrating soil quality changes to arable agricultural systems following organicmatter addition, or adoption of a ley-arable rotation. Appl. Soil Ecol. 2010, 46, 43–53. [Google Scholar] [CrossRef]
  12. Wang, X.; Gong, Z. Assessment and analysis of soil quality changes after eleven years of reclamation in subtropical China. Geoderma 1998, 81, 339–355. [Google Scholar] [CrossRef]
  13. Andrews, S.S.; Karlen, D.; Mitchell, J. A comparison of soil quality indexing methods for vegetable production systems in Northern California. Agric. Ecosyst. Environ. 2002, 90, 25–45. [Google Scholar] [CrossRef]
  14. Levi, N.; Karnieli, A.; Paz-Kagan, T. Using reflectance spectroscopy for detecting land-use effects on soil quality in drylands. Soil Tillage Res. 2020, 199, 104571. [Google Scholar] [CrossRef]
  15. Santos-Francés, F.; Martínez-Graña, A.; Ávila-Zarza, C.; Criado, M.; Sánchez, Y. Comparison of methods for evaluating soil quality of semiarid ecosystem and evaluation of the effects of physico-chemical properties and factor soil erodibility (Northern Plateau, Spain). Geoderma 2019, 354, 113872. [Google Scholar] [CrossRef]
  16. Turan, I.D.; Dengiz, O.; Özkan, B. Spatial assessment and mapping of soil quality index for desertification in the semi-arid terrestrial ecosystem using MCDM in interval type-2 fuzzy environment. Comput. Electron. Agric. 2019, 164, 104933. [Google Scholar] [CrossRef]
  17. Nabiollahi, K.; Eskandari, S.; Taghizadeh-Mehrjardi, R.; Kerry, R.; Triantafilis, J. Assessing soil organic carbon stocks under land-use change scenarios using random forest models. Carbon Manag. 2019, 10, 63–77. [Google Scholar] [CrossRef]
  18. Calero, J.; Aranda, V.; Montejo-Ráez, A.; Martín-García, J.M. A new soil quality index based on morpho-pedological indicators as a site-specific web service applied to olive groves in the Province of Jaen (South Spain). Comput. Electron. Agric. 2018, 146, 66–76. [Google Scholar] [CrossRef]
  19. Obade, V.D.P. Integrating management information with soil quality dynamics to monitor agricultural productivity. Sci. Total Environ. 2019, 651, 2036–2043. [Google Scholar] [CrossRef]
  20. Gura, I.; Mnkeni, P. Crop rotation and residue management effects under no till on the soil quality of a Haplic Cambisol in Alice, Eastern Cape, South Africa. Geoderma 2019, 337, 927–934. [Google Scholar] [CrossRef]
  21. Juhos, K.; Szabo, S.; Ladanyi, M. Explore the influence of soil quality on crop yield using statistically-derived pedological indicators. Ecol. Ind. 2016, 63, 366–373. [Google Scholar] [CrossRef]
  22. Nabiollahi, K.; Taghizadeh-Mehrjardi, R.; Kerry, R.; Moradian, S. Assessment of soil quality indices for salt-affected agricultural land in Kurdistan Province, Iran. Ecol. Indic. 2017, 83, 482–494. [Google Scholar] [CrossRef]
  23. Yu, P.; Liu, S.; Zhang, L.; Li, Q.; Zhou, D. Selecting the minimum data set and quantitative soil quality indexing of alkaline soils under different land uses in northeastern China. Sci. Total Environ. 2018, 616, 564–571. [Google Scholar] [CrossRef] [PubMed]
  24. Guo, L.; Sun, Z.; Ouyang, Z.; Han, D.; Li, F. A comparison of soil quality evaluation methods for Fluvisol along the lower Yellow River. Catena 2017, 152, 135–143. [Google Scholar] [CrossRef]
  25. Nabiollahi, K.; Golmohamadi, F.; Taghizadeh-Mehrjardi, R.; Kerry, R.; Davari, M. Assessing the effects of slope gradient and land use change on soil quality degradation through digital mapping of soil quality indices and soil loss rate. Geoderma 2018, 318, 16–28. [Google Scholar] [CrossRef]
  26. Sione, S.M.J.; Wilson, M.G.; Lado, M.; González, A.P. Evaluation of soil degradation produced by rice crop systems in a Vertisol, using a soil quality index. Catena 2017, 150, 79–86. [Google Scholar] [CrossRef]
  27. Zhang, Y.; Luo, W.; Li, Z.; Liu, M.; Xu, C.; Zhang, R.; Luo, W. Effects of vegetation restoration on soil quality in degraded karst landscapes of southwest China. Sci. Total Environ. 2019, 650, 2657–2665. [Google Scholar] [CrossRef]
  28. Chen, Y.-D.; Wang, H.-Y.; Zhou, J.M.; Xing, L.; Zhu, B.-S.; Zhao, Y.; Chen, X.-Q. Minimum Data Set for Assessing Soil Quality in Farmland of Northeast China. Pedosphere 2013, 23, 564–576. [Google Scholar] [CrossRef]
  29. Warkentin, B.P. The changing concept of soil quality. J. Soil Water Conserv. 1995, 50, 226–228. [Google Scholar]
  30. Lopes, A.A.D.C.; De Sousa, D.M.G.; Chaer, G.M.; Junior, F.B.D.R.; Goedert, W.J.; Mendes, I.D.C. Interpretation of Microbial Soil Indicators as a Function of Crop Yield and Organic Carbon. Soil Sci. Soc. Am. J. 2013, 77, 461–472. [Google Scholar] [CrossRef] [Green Version]
  31. Govaerts, B.; Sayre, K.D.; Deckers, J. A minimum data set for soil quality assessment of wheat and maize cropping in the highlands of Mexico. Soil Tillage Res. 2006, 87, 163–174. [Google Scholar] [CrossRef]
  32. Caspi, T.; Estrada, L.; Dowling, A.V.; Su, E.; Leshchinskiy, M.; Cavalcanti, A.R.; Crane, E.J.; Robins, C.R.; Meyer, W.M. Carbon and nitrogen in the topsoils of Inceptisols and Mollisols under native sage scrub and non-native grasslands in southern California. Geoderma Reg. 2018, 14. [Google Scholar] [CrossRef]
  33. Davari, M.; Gholami, L.; Nabiollahi, K.; Homaee, M.; Jafari, H.J. Deforestation and cultivation of sparse forest impacts on soil quality (case study: West Iran, Baneh). Soil Tillage Res. 2020, 198, 104504. [Google Scholar] [CrossRef]
  34. United States Department of Agriculture. Soil Survey Staff. In Keys to Soil Taxonomy, 12th ed.; United States Department of Agriculture: Washington, DC, USA, 2014. [Google Scholar]
  35. FAO. World Reference Base for Soil Resources; World Soil Resources 106; Food and Agriculture Organization of the United Nation, FAO: Rome, Italy, 2014. [Google Scholar]
  36. Nelson, D.W.; Sommers, L.E. Total Carbon, Organic Carbon, and Organic Matter. In Methods of Soil Analysis, Part 2—Chemical and Microbiological Properties; Page, A.L., Miller, R.H., Keeney, D.R., Eds.; ASA-SSSA: Madison, WI, USA, 1982; pp. 539–594. [Google Scholar]
  37. Grossman, R.B.; Reinsch, T.G. 2.1 Bulk Density and Linear Extensibility. In Methods of Soil Analysis: Part 4 Physical Methods; Dick, A.W., Ed.; Soil Science Society of America Book Series: Madison, WI, USA, 2002; pp. 201–228. [Google Scholar]
  38. Danielson, R.H.; Suterland, P.L. Porosity. In Methods of Soil Analysis. Part 1. Physical and Mineralogical Methods, 2nd ed.; Klute, A., Ed.; Agronomy Monograph; ASA and SSSA: Madison, WI, USA, 1986; Volume 9, pp. 443–460. [Google Scholar]
  39. McLean, E.O. Soil pH and lime requirement. In Methods of Soil Analysis, Part 2. Chemical and Microbiological Properties, 2nd ed.; Page, A.L., Miller, R.H., Keeney, D.R., Eds.; ASA-SSSA: Madison, WI, USA, 1982; Volume 9, pp. 199–224. [Google Scholar]
  40. Rhoades, J.D. Soluble salts. In Methods of Soil Analysis, Part II, 2nd ed.; Page, A.L., Ed.; ASA-SSSA: Madison, WI, USA, 2016; Volume 9, pp. 167–179. [Google Scholar]
  41. Kemper, W.D.; Rosenau, R.C. Aggregate Stability and Size Distribution. In Methods of Soil Analysis. Part I: Physical Analysis; Klute, A., Ed.; ASA-SSSA: Madison, WI, USA, 1986; pp. 425–442. [Google Scholar]
  42. Sumner, M.E.; Miller, W.P. Cation exchange capacity and exchange coefficients. In Methods of Soil Analysis. Part 3. Chemical Methods; Soil Science Society of America Inc.: Madison, WI, USA, 1996; pp. 1201–1229. [Google Scholar]
  43. Sparks, D.L.; Page, A.L.; Helmke, P.A.; Leoppert, R.H.; Soltanpour, P.N.; Tabatabai, M.A.; Johnston, G.T.; Summer, M.E. Methods of soil analysis. In Soil Science Society of American Journal; Book Series No. 5; ASA and SSSA: Madison, WI, USA, 1996. [Google Scholar]
  44. Gee, G.W.; Bauder, J.W. Particle Size Analysis. In Methods of Soil Analysis: Part 1. Agronomy; Klute, A., Ed.; Handbook No 9; American Society of Agronomy and Soil Science Society of America: Madison, WI, USA, 1986; pp. 383–411. [Google Scholar]
  45. Alef, K.; Nannipieri, P. Methods in Applied Soil Microbiology and Biochemistry; Academic Press: London, UK, 1995. [Google Scholar]
  46. Vance, E.D.; Brookes, P.C.; Jenkinson, D.S. An extraction method for measuring soil microbial biomass carbon. Soil Biol. Biochem. 1987, 19, 703–707. [Google Scholar] [CrossRef]
  47. Carter, M.R.; Gregorich, E.G. Soil Sampling and Methods of Analysis; Canadian Society of Soil Science; CRC Press: Boca Raton, FL, USA, 2008. [Google Scholar]
  48. Brown, J.G.; Lilleland, O. Rapid determination of potassium and sodium in plant materials and soil extracts by flame photometry. Am. Soc. Hortic. Sci. 1998, 48, 341–346. [Google Scholar]
  49. Lindsay, W.L.; Norvell, W.A. Development of a DTPA Soil Test for Zinc, Iron, Manganese, and Copper. Soil Sci. Soc. Am. J. 1978, 42, 421–428. [Google Scholar] [CrossRef]
  50. Jahany, M.; Rezapour, S. Assessment of the quality indices of soils irrigated with treated wastewater in a calcareous semi-arid environment. Ecol. Indic. 2020, 109, 105800. [Google Scholar] [CrossRef]
  51. Li, P.; Zhang, T.; Wang, X.; Yu, D. Development of biological soil quality indicator system for subtropical China. Soil Tillage Res. 2013, 126, 112–118. [Google Scholar] [CrossRef]
  52. Nabiollahi, K.; Taghizadeh-Mehrjardi, R.; Eskandari, S. Assessing and monitoring the soil quality of forested and agricultural areas using soil-quality indices and digital soil-mapping in a semi-arid environment. Arch. Agron. Soil Sci. 2017, 64, 696–707. [Google Scholar] [CrossRef]
  53. Rodrigo-Comino, J.; Keshavarzi, A.; Bagherzadeh, A.; Brevik, E. The use of multivariate statistical analysis and soil quality indices as tools to be included in regional management plans. A case study from the Mashhad Plain, Iran. Cuad. Investig. Geogr. 2019, 45, 687. [Google Scholar] [CrossRef] [Green Version]
  54. Raiesi, F.; Kabiri, V. Identification of soil quality indicators for assessing the effect of different tillage practices through a soil quality index in a semi-arid environment. Ecol. Indic. 2016, 71, 198–207. [Google Scholar] [CrossRef]
  55. Masto, R.E.; Chhonkar, P.K.; Purakayastha, T.J.; Patra, A.K.; Singh, D. Soil quality indices for evaluation of long-term land use and soil management practices in semi-arid sub-tropical India. Land Degrad. Dev. 2008, 19, 516–529. [Google Scholar] [CrossRef]
  56. Johnson, R.A.; Wichern, D.W. Applied Multivariate Statistical Analysis, 3rd ed.; Prentice Hall International: Englewood Cliffs, NJ, USA, 1992. [Google Scholar]
  57. Rahmanipour, F.; Marzaioli, R.; Bahrami, H.A.; Fereidouni, Z.; Bandarabadi, S.R. Assessment of soil quality indices in agricultural lands of Qazvin Province, Iran. Ecol. Indic. 2014, 40, 19–26. [Google Scholar] [CrossRef]
  58. Doran, J.W.; Parkin, B.T. Defining and assessing soil quality. In Defining Soil Quality for a Sustainable Environment; Doran, J.W., Coleman, D.C., Bezdicek, D.F., Stewart, B.A., Eds.; Special Publication; Soil Science Society of America, Inc.: Madison, WI, USA, 1994; Volume 5, pp. 3–21. [Google Scholar]
  59. Karlen, D.L.; Parkin, T.B.; Eash, N.S. Use of soil quality indicators to evaluate conservation reserve program sites in Iowa. In Methods for Assessing Soil Quality; Doran, J.W., Jones, A.J., Eds.; SSSA: Madison, WI, USA, 1996; Volume 49, pp. 345–356. [Google Scholar]
  60. McBratney, A.; Santos, M.M.; Minasny, B. On digital soil mapping. Geoderma 2003, 117, 3–52. [Google Scholar] [CrossRef]
  61. Taghizadeh-Mehrjardi, R.; Toomanian, N.; Khavaninzadeh, A.R.; Jafari, A.; Triantafilis, J. Predicting and mapping of soil particle-size fractions with adaptive neuro-fuzzy inference and ant colony optimization in central Iran. Eur. J. Soil Sci. 2016, 67, 707–725. [Google Scholar] [CrossRef]
  62. SPSS. SPSS Version 17.0; SPSS Inc.: Chicago, IL, USA, 1999. [Google Scholar]
  63. Qi, Y.; Darilek, J.L.; Huang, B.; Zhao, Y.; Sun, W.; Gu, Z. Evaluating soil quality indices in an agricultural region of Jiangsu Province, China. Geoderma 2009, 149, 325–334. [Google Scholar] [CrossRef]
  64. Moshiri, M.; Shahabi, A.A.; Keshavarzi, P.; Khogar, Z.; Feyzi Asl, F.; Tehrani, M.M.; Asadi Rahmani, H.; Samavat, S.; Gheibi, M.N.; Sedri, M.H.; et al. Guidelines for Integrated Soil Fertility and Plant Nutrition Management of Wheat; Soil and Water Research Institute Press: Tehran, Iran, 2013; p. 73. (In Persian) [Google Scholar]
  65. Malakouti, M.J.; Gheibi, M.N. Determine the Critical Level of Effective Nutrient Elements in the Soil, Plant and Fruit; Agricultural Education Press: Tehran, Iran, 2000; p. 92. (In Persian) [Google Scholar]
  66. Malakouti, M.J.; Shahabi, A.A.; Bazargan, K. Potassium in Agriculture; Sana Press: Tehran, Iran, 2005; p. 292. (In Persian) [Google Scholar]
  67. Zhan, A.; Zou, C.-Q.; Ye, Y.; Liu, Z.; Cui, Z.; Chen, X. Estimating on-farm wheat yield response to potassium and potassium uptake requirement in China. Field Crop. Res. 2016, 191, 13–19. [Google Scholar] [CrossRef]
  68. El Kateb, H.; Zhang, H.; Zhang, P.; Mosandl, R. Soil erosion and surface runoff on different vegetation covers and slope gradients: A field experiment in Southern Shaanxi Province, China. Catena 2013, 105, 1–10. [Google Scholar] [CrossRef]
  69. Paz-Kagan, T.; Ohana-Levi, N.; Herrmann, I.; Zaady, E.; Henkin, Z.; Karnieli, A. Grazing intensity effects on soil quality: A spatial analysis of a Mediterranean grassland. Catena 2016, 146, 100–110. [Google Scholar] [CrossRef]
  70. Changwony, K.; Alvarez, M.; Lanyasunya, T.; Dold, C.; Becker, M.; Südekum, K.-H. Biomass and quality changes of forages along land use and soil type gradients in the riparian zone of Lake Naivasha, Kenya. Ecol. Indic. 2015, 49, 169–177. [Google Scholar] [CrossRef]
  71. Stevenson, B.; McNeill, S.; Hewitt, A. Characterising soil quality clusters in relation to land use and soil order in New Zealand: An application of the phenoform concept. Geoderma 2015, 239, 135–142. [Google Scholar] [CrossRef]
  72. Al-Kaisi, M.M.; Yin, X.; Licht, M.A. Soil carbon and nitrogen changes as influenced by tillage and cropping systems in some Iowa soils. Agric. Ecosyst. Environ. 2005, 105, 635–647. [Google Scholar] [CrossRef]
  73. Şeker, C.; Özaytekin, H.H.; Negiş, H.; Gümüş, I.; Dedeoğlu, M.; Atmaca, E.; Karaca, Ü. Assessment of soil quality index for wheat and sugar beet cropping systems on an entisol in Central Anatolia. Environ. Monit. Assess. 2017, 189. [Google Scholar] [CrossRef] [PubMed]
Figure 1. Location map of the study area within Iran (a) and Kurdistan Province (b), physiography map (c), soil map with soil sampling locations (d), and elevation map (e).
Agriculture 10 00469 g001
Figure 2. Flowchart of methodology used in this study.
Agriculture 10 00469 g002
Figure 3. Soil quality grade distribution SQIs using two weighting methods (SQIw-M and SQIw-F). The root mean square error (RMSE), and R2 values achieved 0.04 and 0.71 (SQIw-M), and 0.05 and 0.70 (SQIw-F), respectively.
Agriculture 10 00469 g003
Figure 4. Linear relationship between SQIs calculated using two weighting methods (SQIw-M and SQIw-F) and rainfed wheat yield for all soil samples.
Agriculture 10 00469 g004
Figure 5. Linear relationship between calculated SQIs using two weighting methods (a: SQIw-M; b: SQIw-F) and rainfed wheat yield for two soil orders.
Agriculture 10 00469 g005
Table 1. Standard scoring functions (SSF) and soil properties.
Soil PropertyLUFT aReference
Clay10.7437.52MO[27,28]
Sand35.2075.68LE[28]
CEC6.2529.00MO[22,57]
AP6.5021.40MO[5,25]
AK71.50187.50MO[6,24]
SMR75.7205.00MO[54,56]
a FT: function type; MO: “more is better”; LE: “less is better”. L means lower values and U means upper values. CEC: cation exchange capacity; SMR: soil microbial respiration; AK: available potassium; AP: available phosphorus.
Table 2. Descriptive statistics for soil properties and rainfed wheat yield.
UnitNumberMeanMinimumMaximumStandard DeviationCoefficient of Variation
pH 1008.097.608.920.313.84
Sand%10048.635.275.67.4815.38
Silt%10028.16.440.86.0121.34
Clay%10023.110.737.55.3823.25
SP%1000.520.410.590.048.15
CCE%10014.941.2530.258.8959.61
OC%1000.150.060.520.0962.33
TN%1000.0270.010.100.0169.92
ESP%1002.051.115.720.8240.30
ECdS m−11000.170.100.300.0527.98
CECCmolc kg−110019.666.2529.004.7724.29
MWDMm1002.400.555.101.0342.97
APmg kg−110013.146.5021.403.3025.17
AKmg kg−1100128.671.5187.525.4219.76
AFemg kg−11003.490.099.652.4871.08
AZnmg kg−11000.2790.020.630.1453.56
ACumg kg−11000.4330.041.260.2456.05
AMnmg kg−11001.100.102.120.5046.02
SMRmg CO2 gday−1100137.2575.70205.0033.6224.50
BDg cm−31001.231.101.600.108.41
Yieldton ha−11001.160.501.850.3125.71
Electrical conductivity (EC); soil microbial respiration (SMR); available potassium (AK); available phosphorus (AP); cation exchange capacity (CEC); soil acidity (pH); organic carbon (OC); bulk density (BD); exchangeable sodium percentage (ESP); mean weight diameter (MWD); total Nitrogen (TN); soil porosity (SP); calcium carbonate equivalent (CCE); available Fe (AFe); available Zn (AZn); available Cu (ACu); available Mn (AMn).
Table 3. Pearson’s correlation coefficients for soil properties between soil quality indicators (SQIs), and yield.
Soil IndicatorYieldSQIw-MSQIw-FSoil IndicatorYieldSQIw-MSQIw-F
pH−0.105−0.13−0.10TN0.50 **0.57 **0.50 **
Sand−0.33 **−0.50 **−0.42 **AP0.34 **0.64 **0.58 **
Clay0.42 **0.59 **0.50 **AK0.44 **0.67 **0.64 **
ESP−0.54 **0.40 **−0.33 **AZn−0.03−0.06−0.03
CEC0.46 **0.59 **0.53 **ACu−0.11−0.13−0.11
MWD0.48 **0.73 **0.66 **AMn0.28 **0.32 **0.28 **
Silt0.0720.53 **0.48 **SMR0.40 **0.70 **0.68 **
SP0.1680.100.07AFe0.120.130.11
BD−0.0710.080.06EC−0.003−0.0190.003
OC0.34 **0.25 **0.25 **CCE0.0270.070.02
** is significant at the 0.01 level.
Table 4. Results of principal component analysis (PCA) for soil properties.
PCs aPC1PC2PC3PC4PC5PC6
Eigenvalue1411.8709.458.120.39.74.2
Percent0.6370.1010.1020.0600.0500.040
Cumulative percent0.6370.7380.8400.9000.9500.980
Eigenvectors
Sand−0.0600.0580.882−0.372−0.250−0.112
Clay0.076−0.095−0.341−0.155−0.816−0.410
OC0.001−0.002−0.003−0.603−0.008−0.001
ESP0.004−0.010−0.026−0.036−0.0190.016
CEC0.034−0.063−0.282−0.8890.335−0.088
MWD0.0000.001−0.010−0.0290.1120.031
TN0.000−0.000−0.001−0.002−0.0030.001
AP0.044−0.058−0.070−0.201−0.3720.900
AK0.488−0.8550.1390.0680.083−0.018
AMn0.004−0.007−0.005−0.010−0.009−0.017
SMR0.8660.4990.027−0.0050.013−0.003
a Principal component (PC). Underlined PC loadings are considered highly weighted. Bold factor loadings selected as minimum data set (MDS).
Table 5. Weights values of each soil property in the MDS methods that were assigned using multiple linear regression (MLR) analysis and factor analysis (FA).
Soil IndicatorMultiple Regression AnalysisFactor Analysis
Beta bWeightCOM aWeight
Clay0.6930.2000.7930.217
Sand0.4590.1320.3640.100
CEC0.6150.1770.7150.196
AK0.6690.1930.6520.179
AP0.5660.1630.6290.172
SMR0.4650.1340.4950.136
a COM means communality of each soil property; b Beta means standardized regression coefficient.
Table 6. Classification and percentage of soil quality grades for two soil quality indices (SQIw-M and SQIw-F) in two soil orders.
IndexArea (%)GradI (Very High)II (High)III (Moderate)IV (Low)V (Very Low)
SQIw-M a>0.730.61–0.730.50–0.610.50–0.40<0.40
Total area 00.2523.5550.0611.0415.10
Entisols 0.008.4215.787.999.31
Inceptisols 0.2515.1334.283.055.79
SQIw-F b>700.63–0.700.52–0.630.52–0.41<0.41
Total area 1.0026.0348.0318.276.67
Entisols 0.006.1415.8514.424.57
Inceptisols 1.0019.8932.183.852.10
a and b: range of soil quality grades for SQIw-M and SQIw-F, respectively.
Table 7. Results of independent samples t-test for soil properties and SQIs.
EntisolsInceptisols
Soil IndicatorMeanMeanp = (T-test)
Clay22.6723.410.07
Sand49.2448.350.08
CEC19.2419.890.07
AP12.3213.590.03
AK122.79131.840.03
SMR129.72141.300.03
AZn0.230.300.04
AFe3.303.590.1
ACu0.460.410.1
AMn1.111.100.1
OC0.140.160.07
Soil quality indices
SQIw-M0.540.570.06
SQIw-F0.560.590.07
Yield1.121.200.06

