Characterization of Nutrient Disorders and Impacts on Chlorophyll and Anthocyanin Concentration of Brassica rapa var. Chinensis

 ,
,  ,
, 
Abstract
:1. Introduction
2. Materials and Methods
2.1. Plant Materials
2.2. Analysis of RCC, Chlorophyll, and Anthocyanin
2.3. Statistical Analysis
3. Results and Discussion
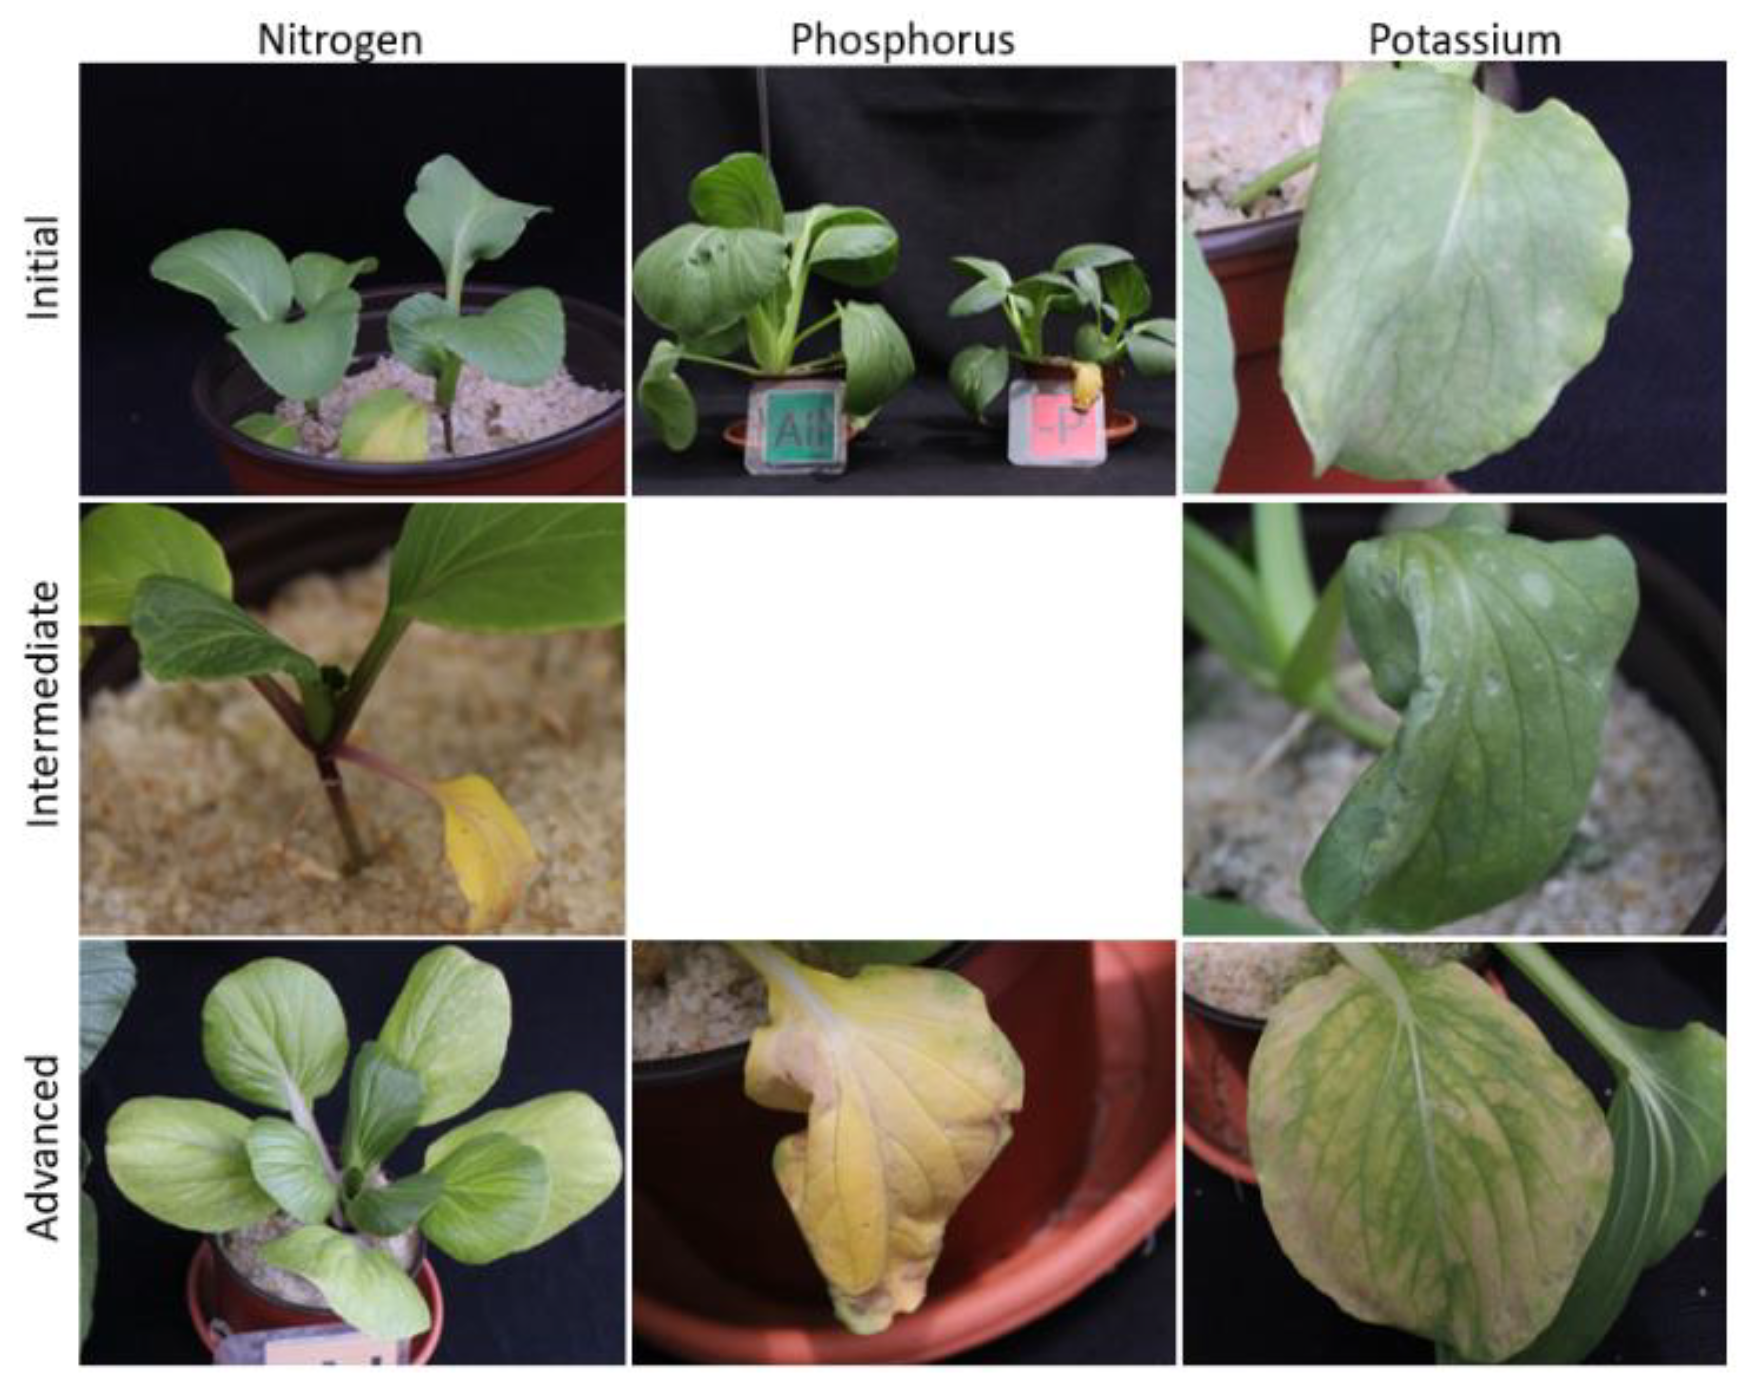
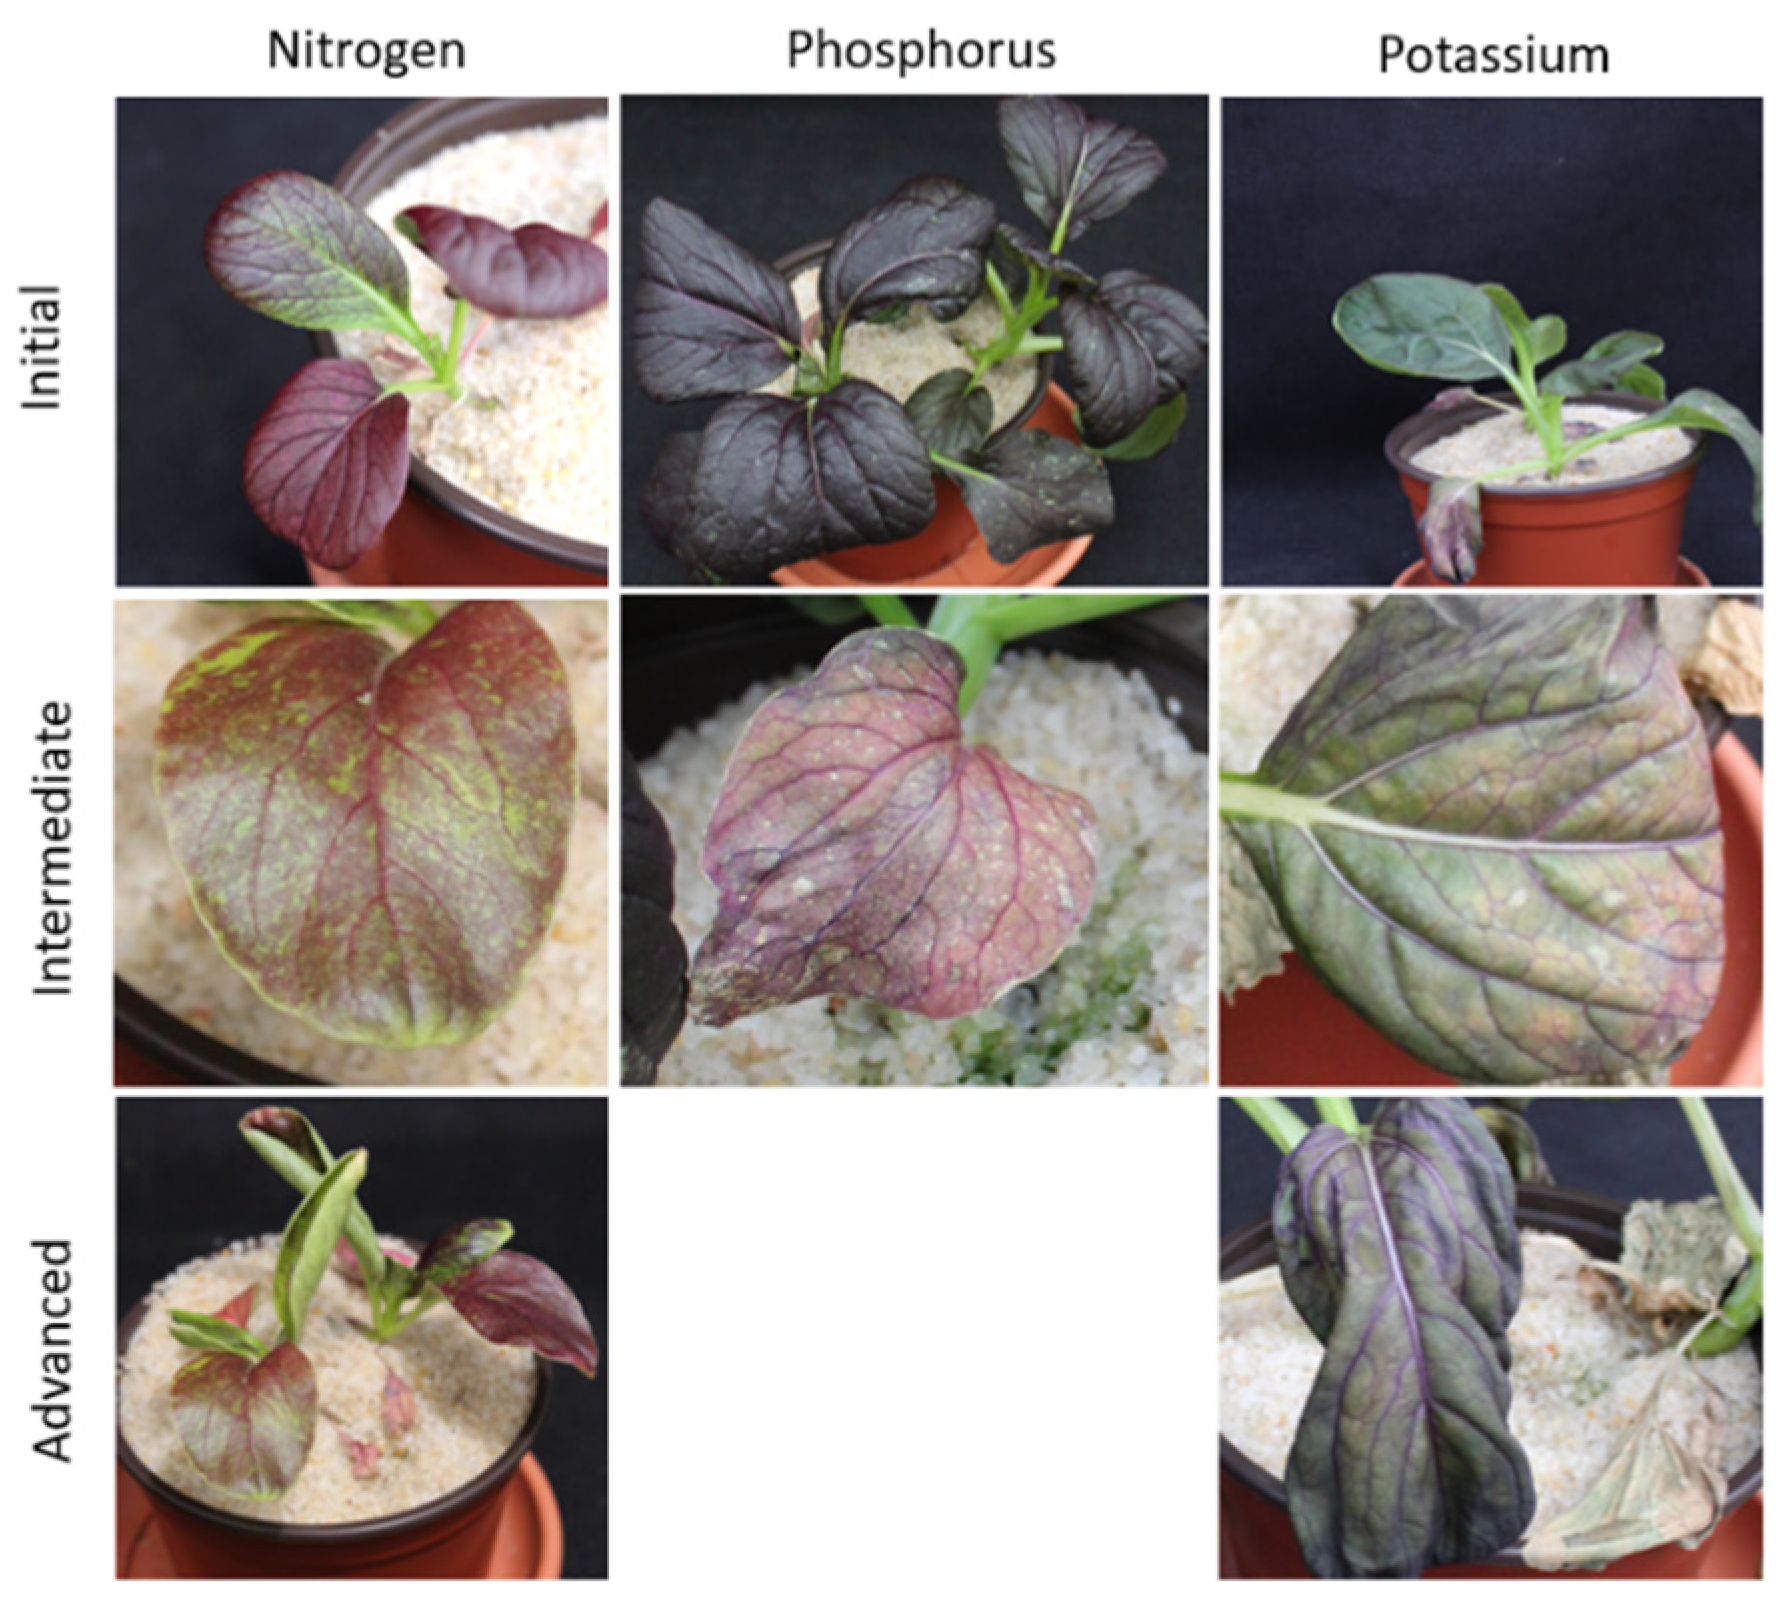
3.1. Macronutrients
3.1.1. Nitrogen (N)
3.1.2. Phosphorus (P)
3.1.3. Potassium (K)
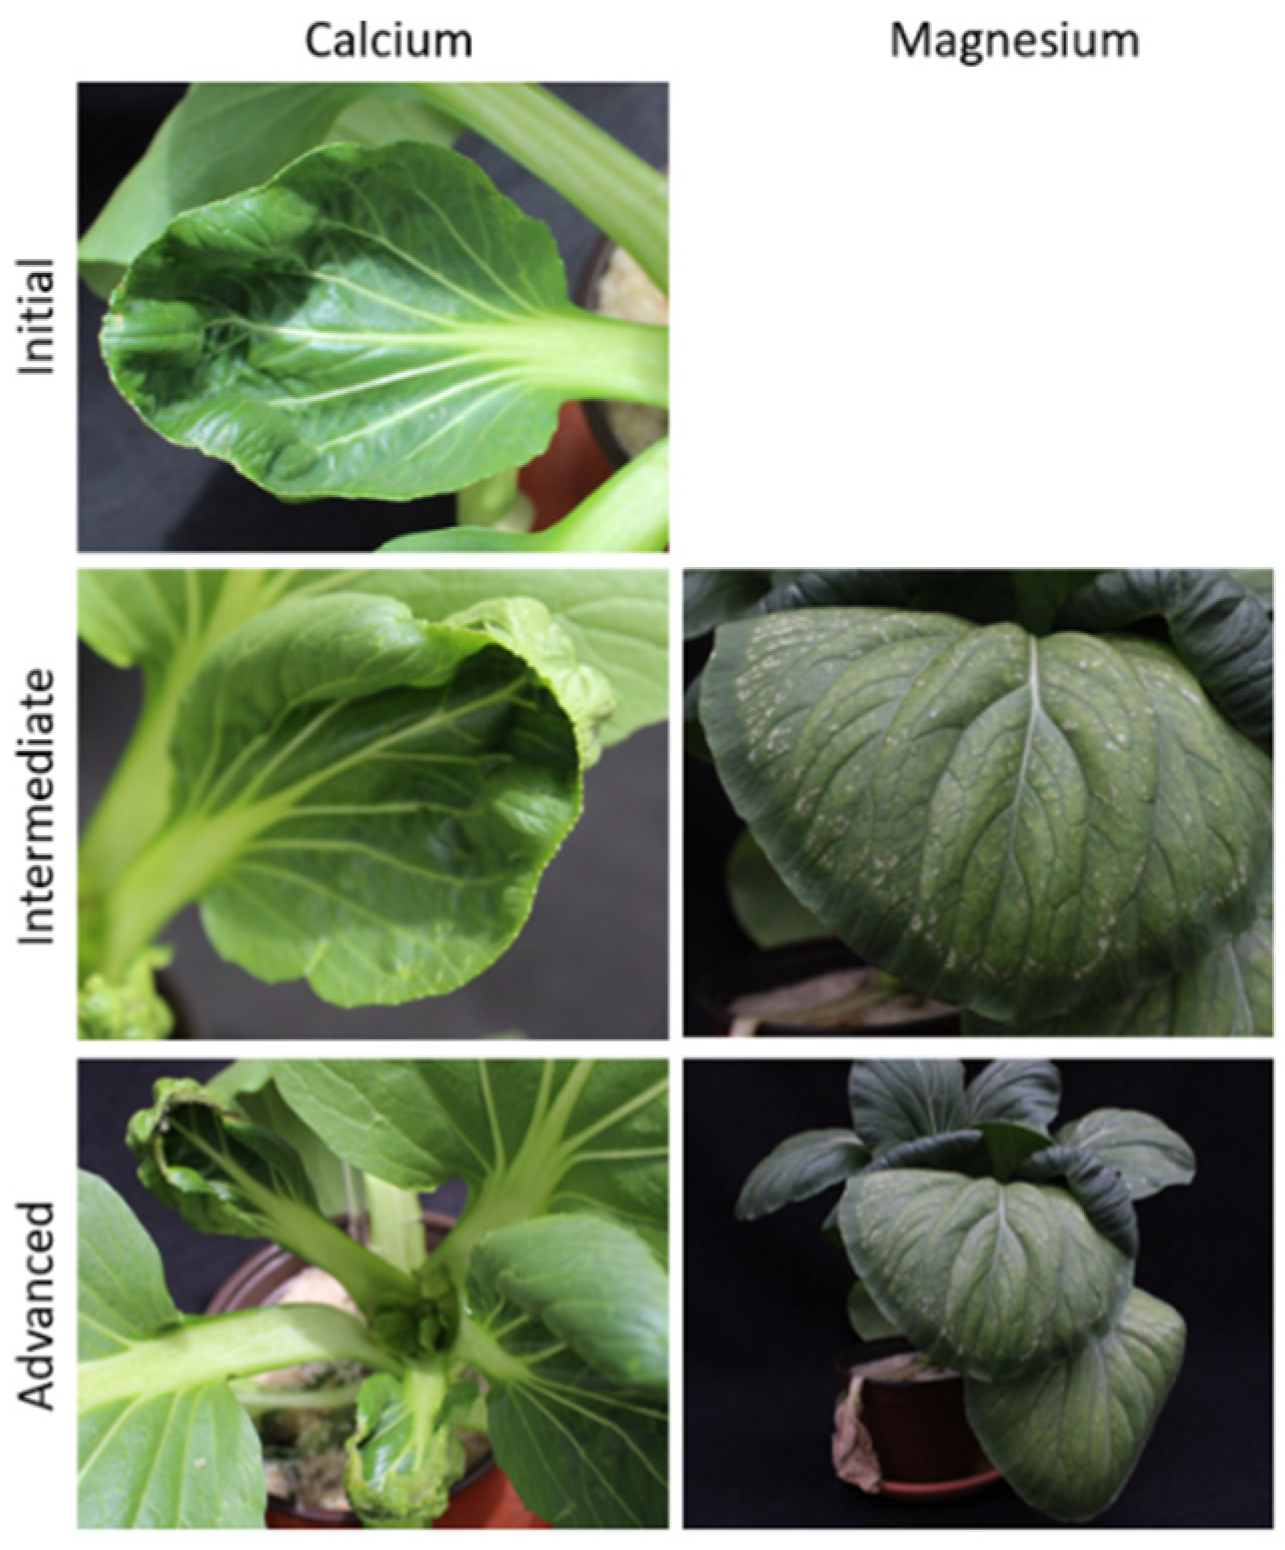
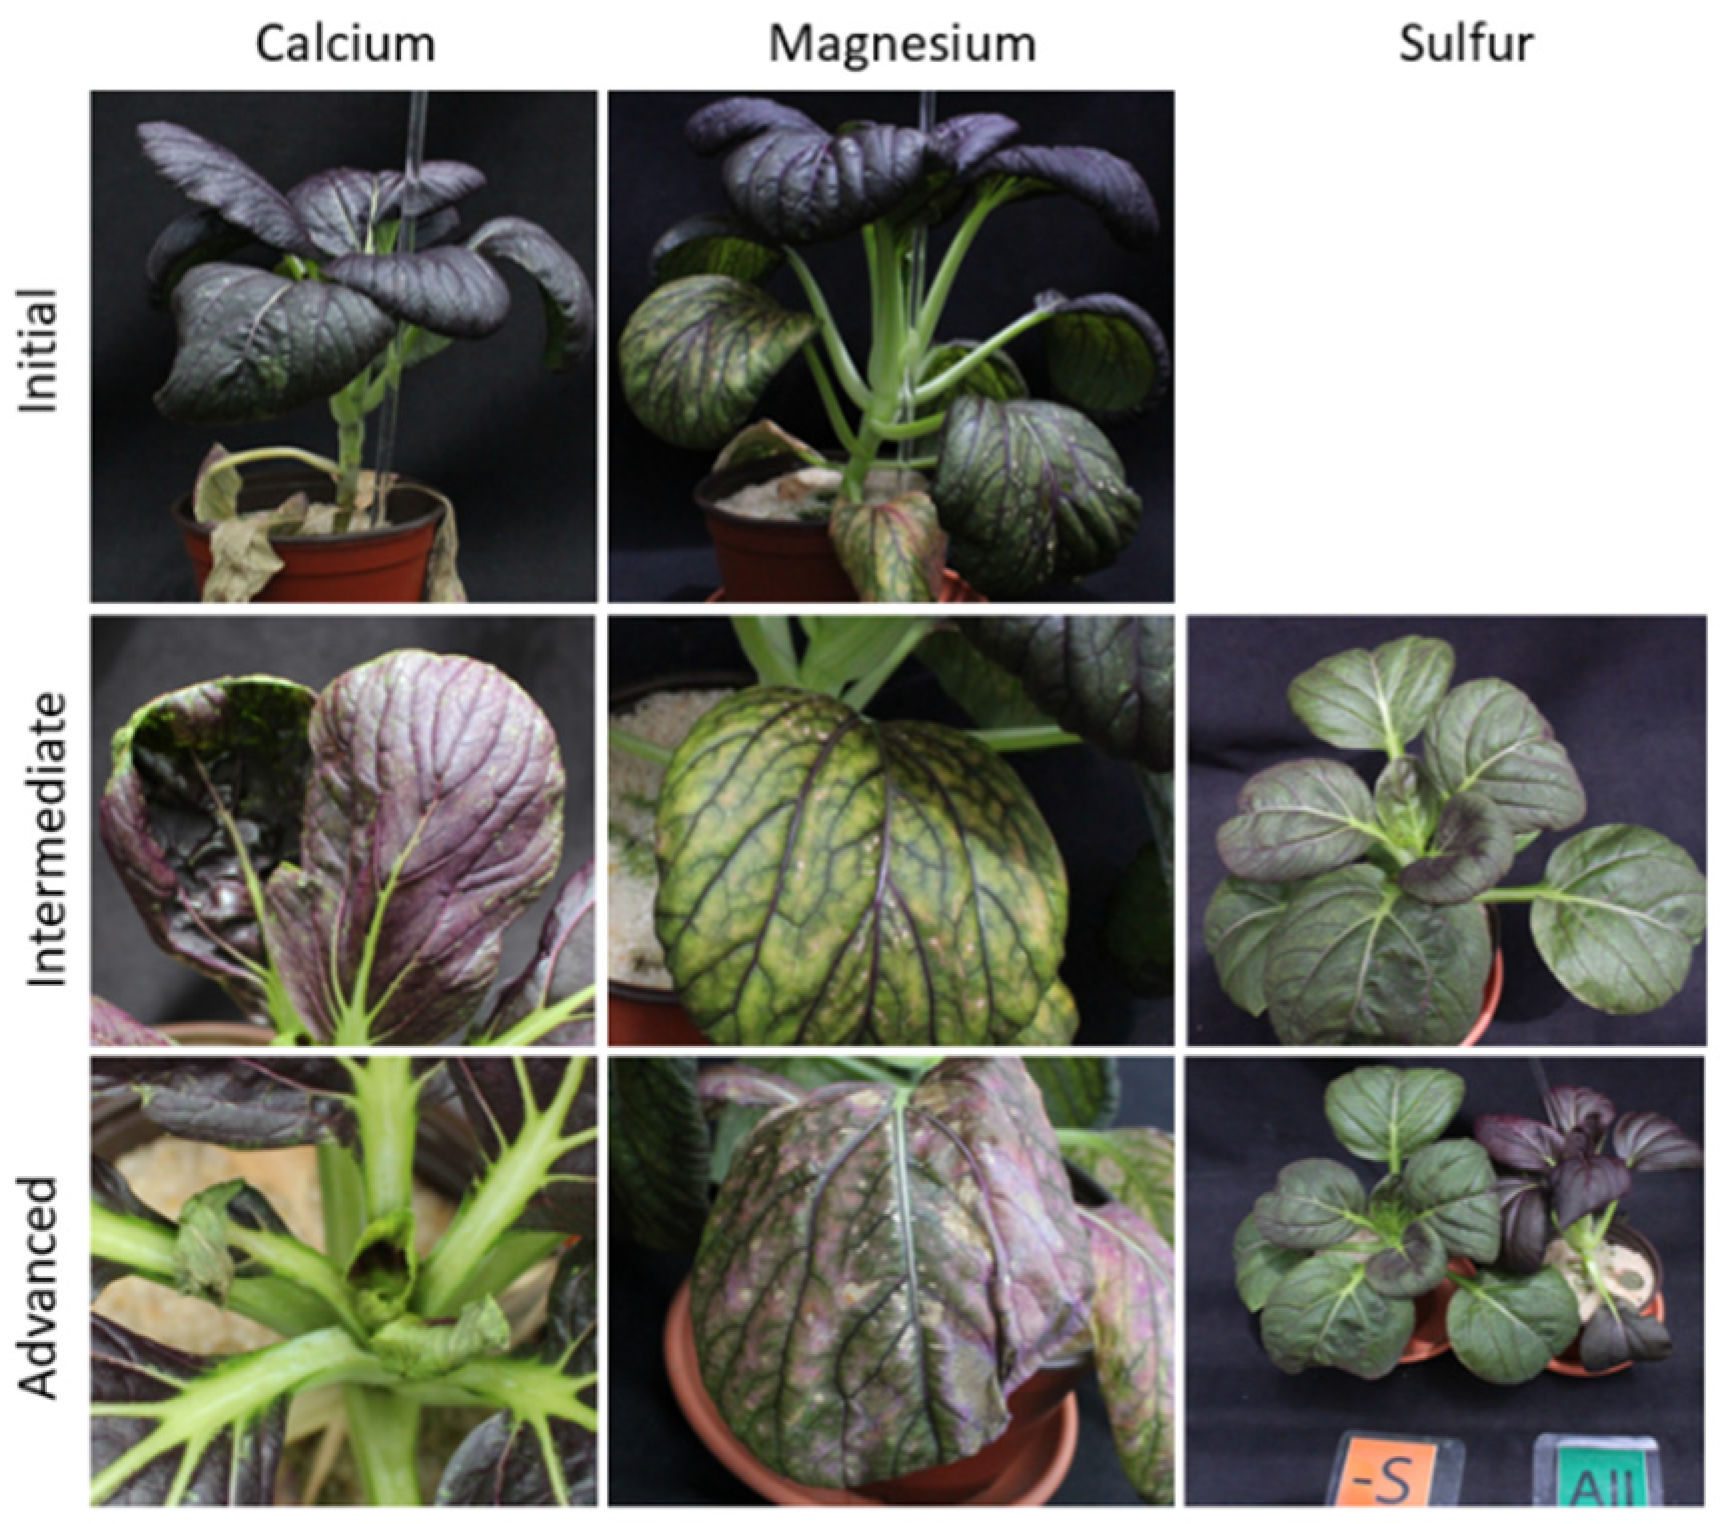
3.1.4. Calcium (Ca)
3.1.5. Magnesium (Mg)
3.1.6. Sulfur (S)
3.2. Micronutrients
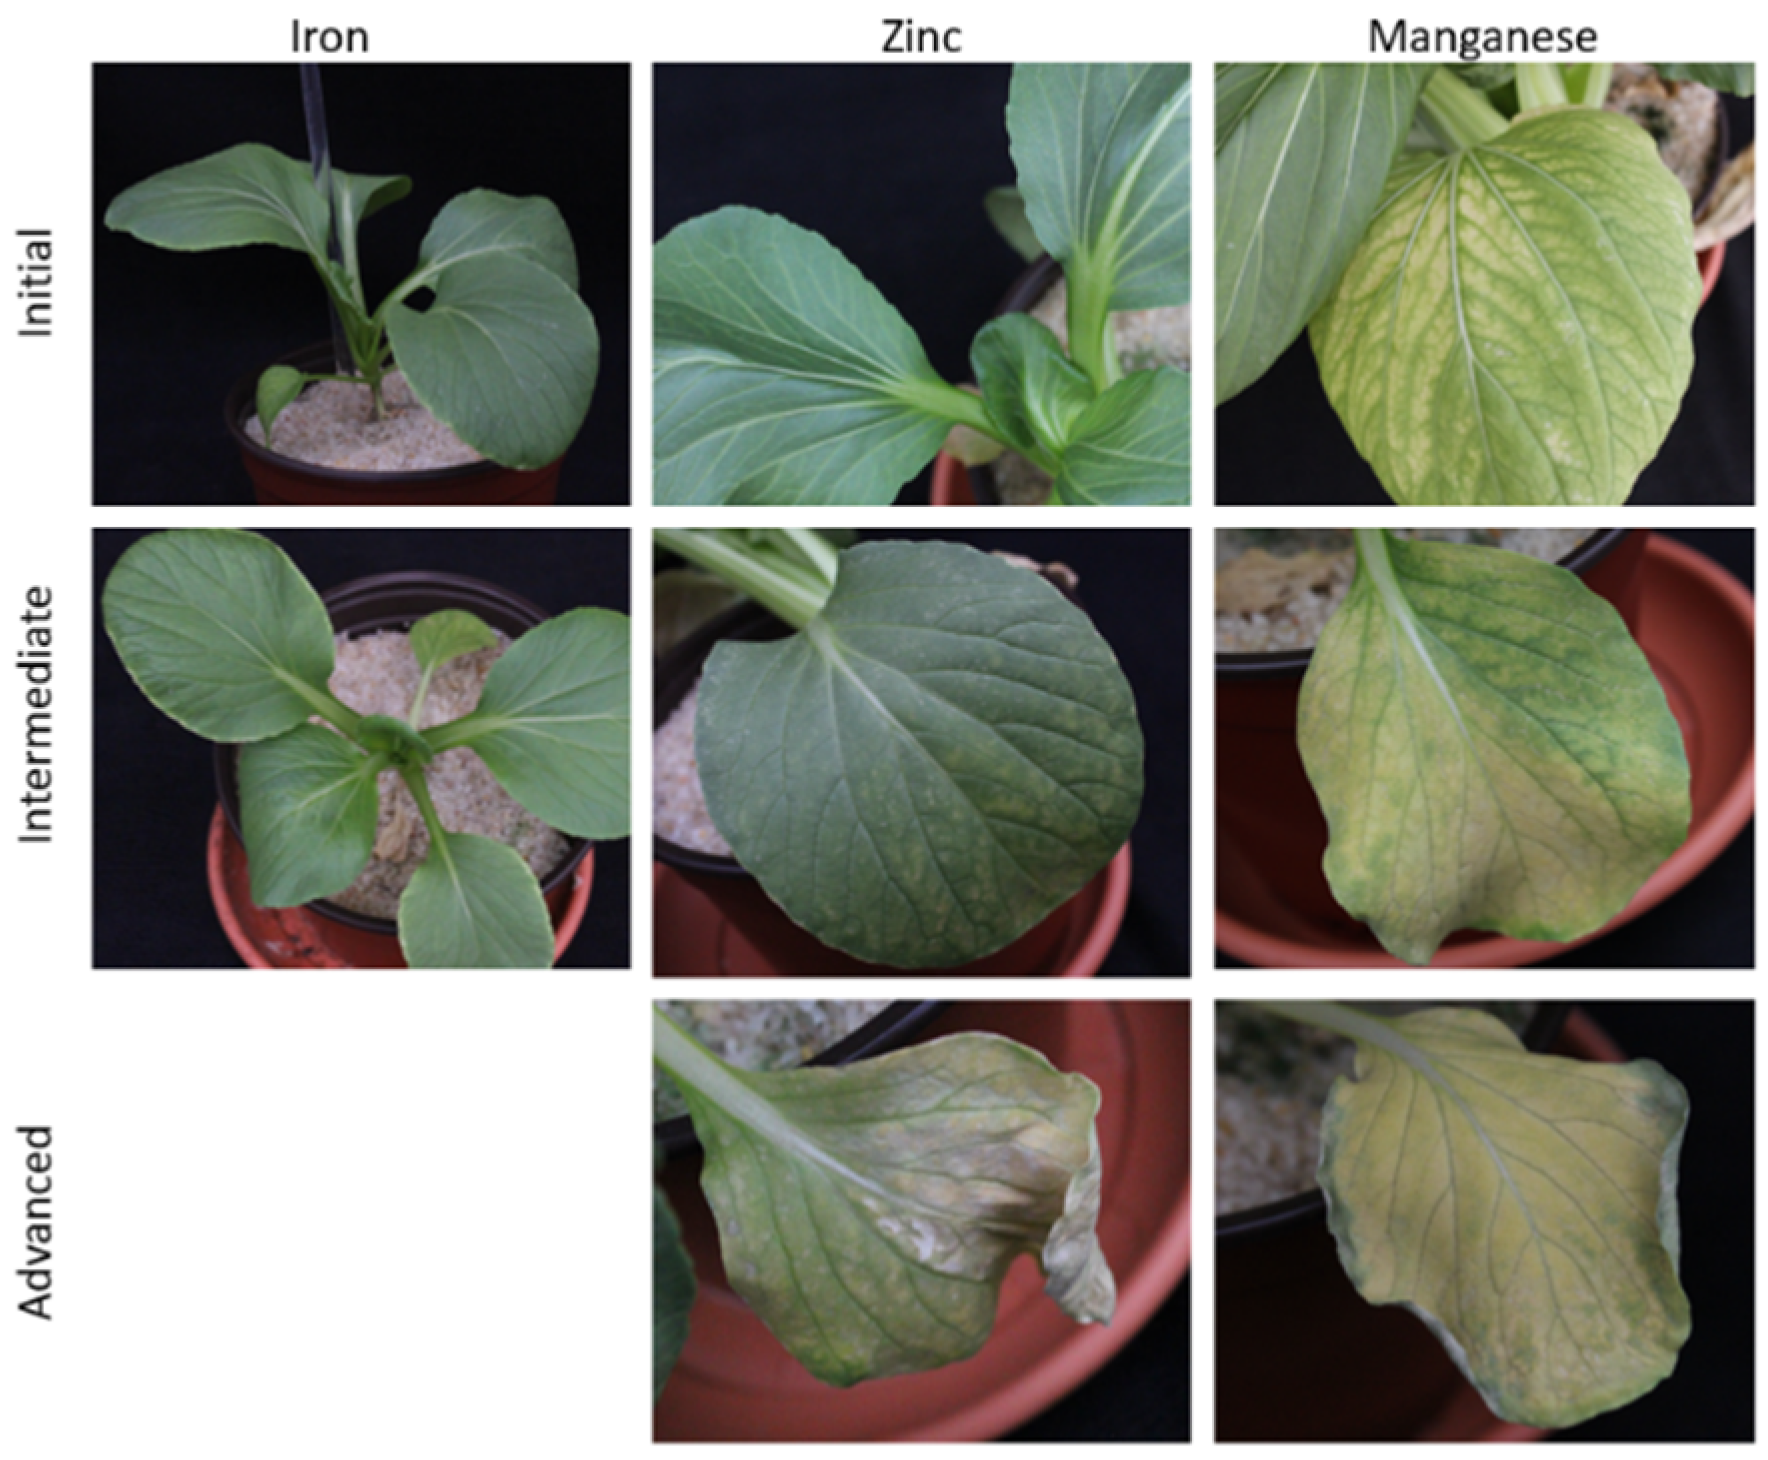
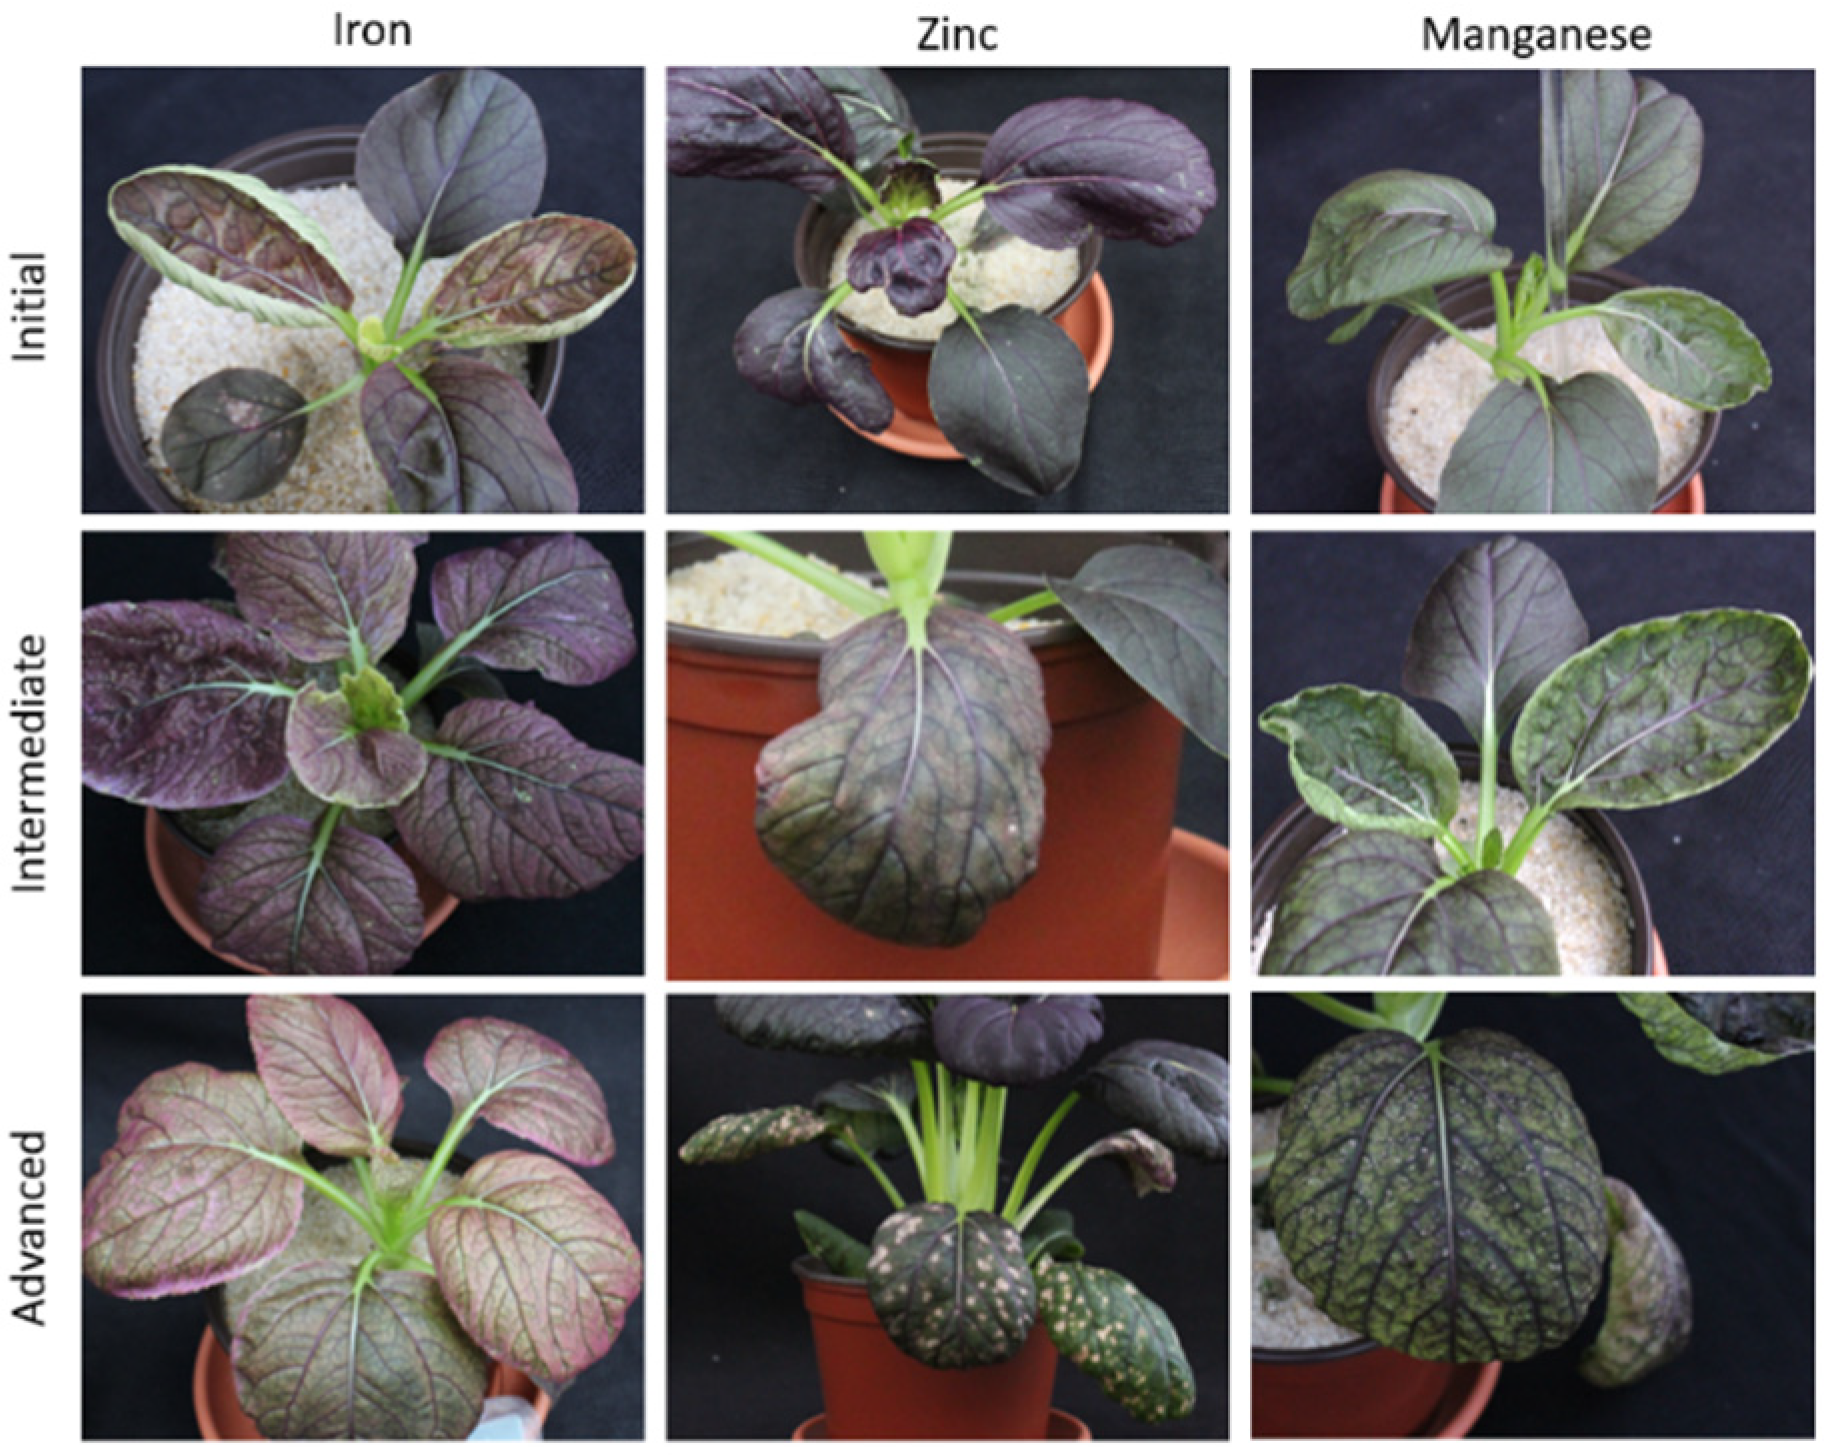
3.2.1. Iron (Fe)
3.2.2. Zinc (Zn)
3.2.3. Manganese (Mn)
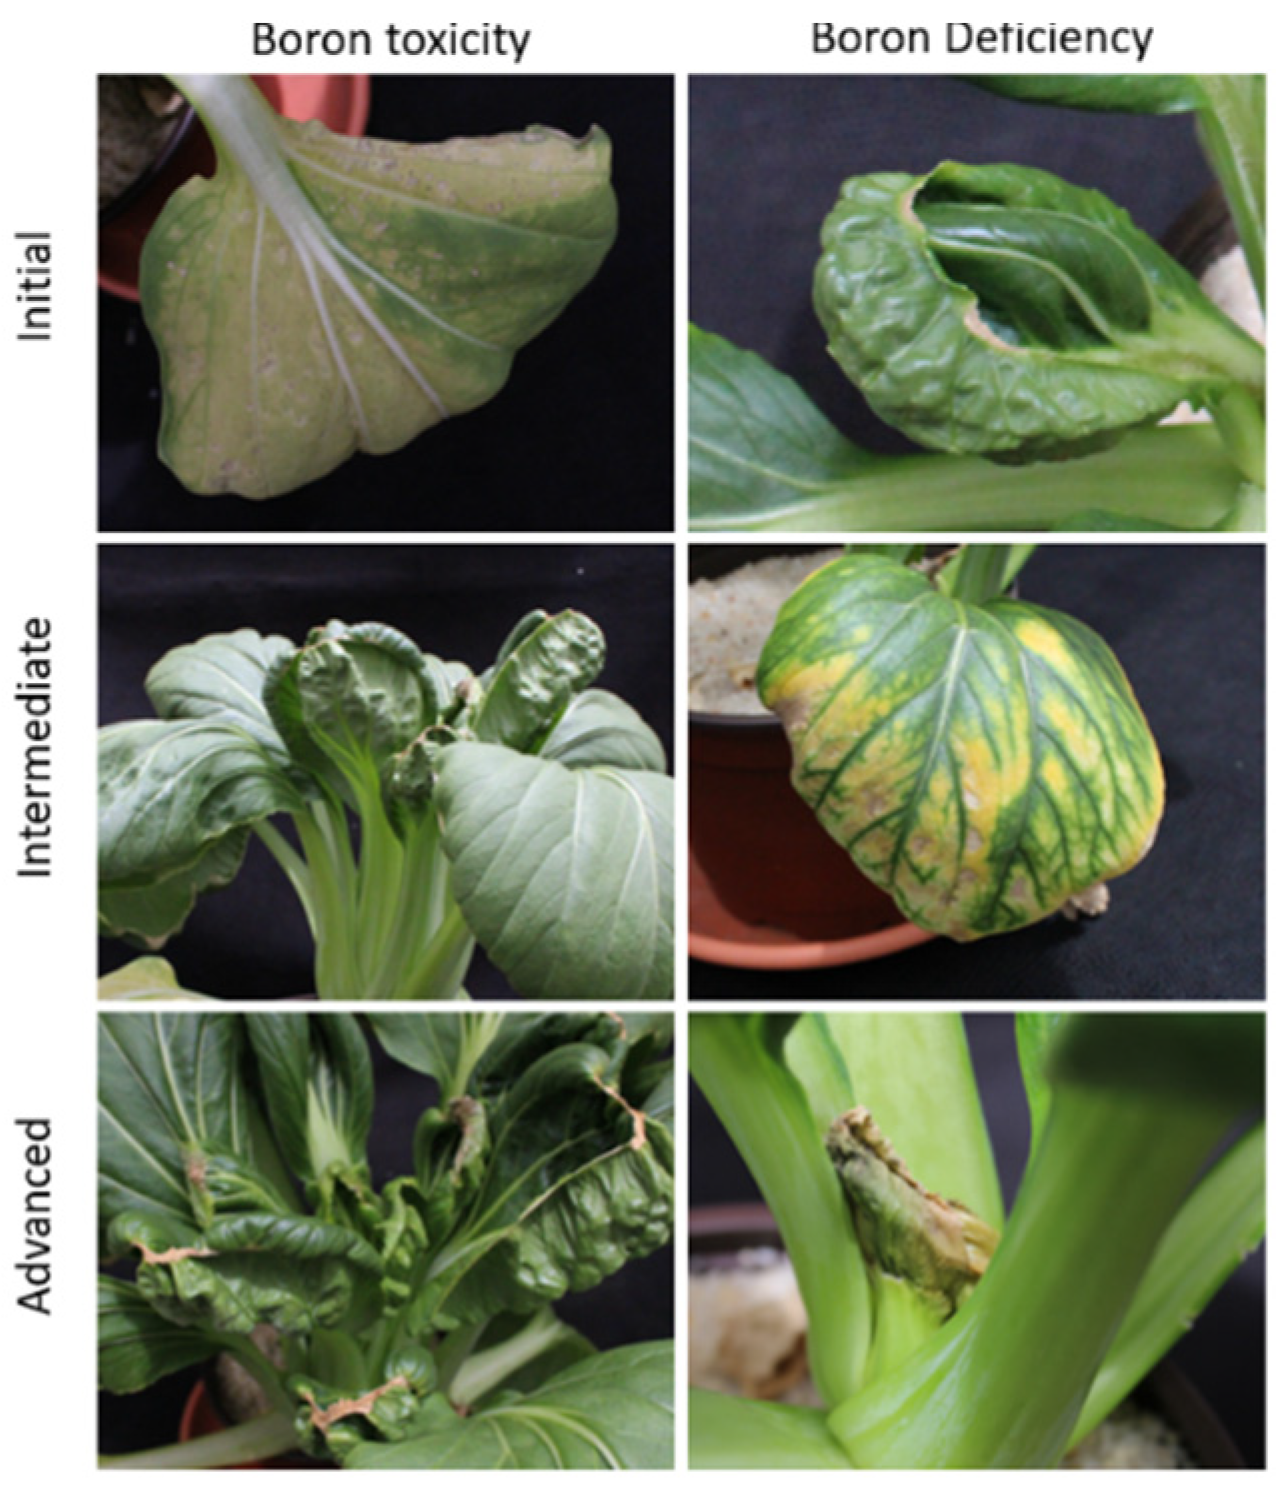
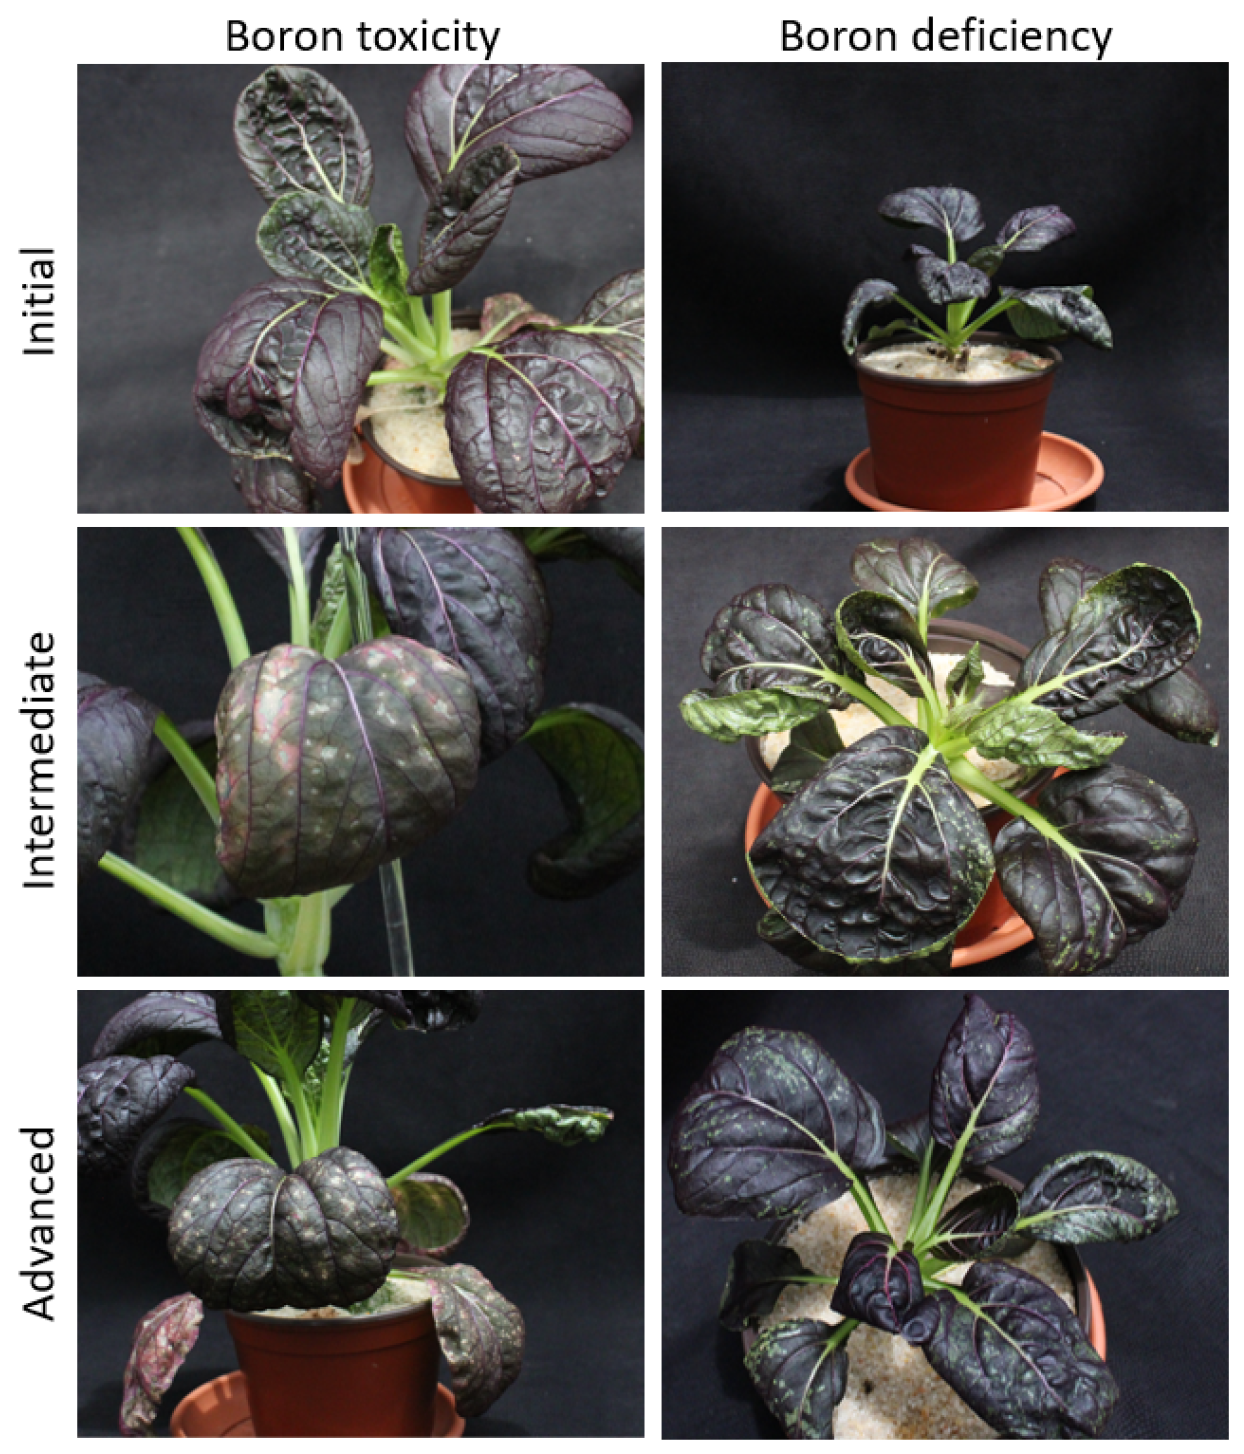
3.2.4. Boron (B)
3.2.5. Boron Toxicity
3.3. SPAD (RCC)
4. Conclusions
Supplementary Materials
Author Contributions
Funding
Acknowledgments
Conflicts of Interest
References
- Cockson, P.; Landis, H.; Smith, T.; Hicks, K.; Whipker, B.E. Characterization of nutrient disorders of Cannabis sativa. Appl. Sci. 2019, 9, 4432. [Google Scholar] [CrossRef] [Green Version]
- McCauley, A.; Jones, C.; Jacobsen, J. Plant nutrient functions and deficiency and toxicity symptoms. Nutr. Manag. Modul. 2009, 9, 1–16. [Google Scholar]
- Gómez-Campo, C. Morphology and Morpho-Taxonomy of the Tribe Brassiceae; Universidad Politecnica: Madrid, Spain, 1980; pp. 3–31. [Google Scholar]
- Hill, T.R. The effect of nitrogenous fertilizer and plant spacing on the yield of three Chinese vegetables—Kai lan, Tsoi sum and Pak choi. Sci. Hort. 1990, 45, 11–20. [Google Scholar] [CrossRef]
- Averbeke, W.V. Yield response of African leafy vegetables to nitrogen, phosphorus, and potassium: The case of Brassica rapa L. subsp. chinensis and Solanum retroflexum Dun. Water SA 2007, 33, 355–362. [Google Scholar] [CrossRef] [Green Version]
- Buer, C.S.; Imin, N.; Djordjevic, M.A. Flavonoids: New roles for old molecules. J. Integr. Plant Biol. 2010, 52, 98–111. [Google Scholar] [CrossRef] [PubMed]
- Henry, J.B.; Perkins-Veazie, P.; McCall, I.; Whipker, B.E. Restricted phosphorus fertilization increases the betacyanin concentration and red foliage coloration of alternanthera. J. Am. Soc. Hort. Sci. 2019, 144, 264–273. [Google Scholar] [CrossRef] [Green Version]
- He, J.; Giusti, M.M. Anthocyanins: Natural colorants with health-promoting properties. Ann. Rev. Food Sci. Technol. 2010, 1, 163–187. [Google Scholar] [CrossRef] [PubMed]
- Guo, N.; Wu, J.; Zheng, S.; Cheng, F.; Liu, B.; Liang, J.; Cui, Y.; Wang, X. Anthocyanin profile characterization and quantitative trait locus mapping in zicaitai (Brassica rapa L. ssp. Chinensis var. purpurea). Mol. Breed. 2015, 35, 113. [Google Scholar] [CrossRef]
- Zhao, X.; Nechols, J.R.; Williams, K.A.; Wang, W.; Carey, E.E. Comparison of phenolic acids in organically and conventionally grown pac choi (Brassica rapa L. Chinensis). J. Sci. Food Agric. 2009, 89, 940–946. [Google Scholar] [CrossRef]
- Deroles, S. Anthocyanin biosynthesis in plant cell cultures: A potential source of natural colourants. In Anthocyanins; Springer: New York, NY, USA, 2008; pp. 108–167. [Google Scholar]
- Passeri, V.; Koes, R.; Quattrocchio, F.M. New challenges for the design of high value plant products: Stabilization of anthocyanins in plant vacuoles. Front. Plant Sci. 2016, 7, 153. [Google Scholar] [CrossRef] [Green Version]
- Kalaji, H.M.; Dąbrowski, P.; Cetner, M.D.; Samborska, I.A.; Łukasik, I.; Brestic, M.; Zivcak, M.; Tomasz, H.; Mojski, J.; Kociel, H.; et al. A comparison between different chlorophyll content meters under nutrient deficiency conditions. J. Plant Nutr. 2017, 40, 1024–1034. [Google Scholar] [CrossRef]
- Demmig-Adams, B. Carotenoids and photoprotection in plants: A role for the xanthophyll zeaxanthin. Biochim. Biophys. Acta (BBA)-Bioenerg. 1990, 1020, 1–24. [Google Scholar] [CrossRef]
- Hlavinka, J.; Nauš, J.; Špundová, M. Anthocyanin contribution to chlorophyll meter readings and its correction. Photosynth Res. 2013, 118, 277–295. [Google Scholar] [CrossRef] [PubMed]
- Curran, P.J.; Dungan, J.L.; Gholz, H.L. Exploring the relationship between reflectance red edge and chlorophyll content in slash pine. Tree Physiol. 1990, 7, 33–48. [Google Scholar] [CrossRef] [PubMed]
- Li, Z.; Liu, H.; Zhang, Y. A review on chlorophyll meter application on nitrogen fertilizer recommendation. Plant Nutr. Fert. Sci. 2006, 1, 125–132. [Google Scholar]
- Bryson, G.M.; Mills, H.A. Plant Analysis Handbook IV; Micro-Macro Publishing: Athens, GA, USA, 2015; pp. 1–600. [Google Scholar]
- Barnes, J.; Whipker, B.; McCall, I.; Frantz, J. Nutrient disorders of ‘Evolution’ mealy-cup sage. HortTechnology 2012, 22, 502–508. [Google Scholar] [CrossRef] [Green Version]
- Lichtenthaler, H.K. Chlorophyll and carotenoids: Pigments of photosynthetic biomembranes. Methods Enzymol. 1987, 148, 350–382. [Google Scholar]
- Lee, J.; Rennaker, C.; Wrolstad, R.E. Correlation of two anthocyanin quantification methods: HPLC and spectrophotometric methods. Food Chem. 2008, 110, 782–786. [Google Scholar] [CrossRef]
- Lancien, M.; Ferrario-Méry, S.; Roux, Y.; Bismuth, E.; Masclaux, C.; Hirel, B.; Gadal, P.; Hodges, M. Simultaneous expression of NAD-dependent isocitrate dehydrogenase and other Krebs cycle genes after nitrate resupply to short-term nitrogen-starved tobacco. Plant Physiol. 1999, 120, 717–726. [Google Scholar] [CrossRef]
- Bhaskar, R.; Bondada, J.; Syvertsen, P. Leaf chlorophyll, net gas exchange and chloroplast ultrastructure in citrus leaves of different nitrogen status. Tree Physiol. 2003, 23, 553–559. [Google Scholar]
- Soubeyrand, E.; Basteau, C.; Hilbert, G.; van Leeuwen, C.; Delrot, S.; Gomès, E. Nitrogen supply affects anthocyanin biosynthetic and regulatory genes in grapevine cv. Cabernet-sauvignon berries. Phytochemistry 2014, 103, 38–49. [Google Scholar] [CrossRef] [PubMed]
- Sarker, B.; Karmoker, J. Effects of phosphorus deficiency on accumulation of biochemical compounds in lentil. Bangladesh J. Bot. 2011, 40, 23–27. [Google Scholar] [CrossRef]
- Desikan, R.; Cheung, M.K.; Bright, J.; Henson, D.; Hancock, J.T.; Neill, S.J. ABA, hydrogen peroxide and nitric oxide signalling in stomatal guard cells. J. Exper. Bot. 2004, 55, 205–212. [Google Scholar] [CrossRef] [PubMed] [Green Version]
- Besford, R.T. Effect of potassium nutrition on leaf protein concentrations and growth of young tomato plants. Plant Soil 1975, 42, 441–451. [Google Scholar] [CrossRef]
- Wang, Y.; Wu, W.H. Potassium transport and signaling in higher plants. Ann. Rev. Plant Biol. 2013, 64, 451–476. [Google Scholar] [CrossRef] [Green Version]
- Oosterhuis, D.M.; Bednarz, C.W. Physiological changes during the development of potassium deficiency in cotton. Plant nutrition for sustainable food production and environment. Dev. Plant Soil 1997, 78, 347–351. [Google Scholar]
- Delgado, R.; Martín, P.; Del Álamo, M.; González, M.R. Changes in the phenolic composition of grape berries during ripening in relation to vineyard nitrogen and potassium fertilization rates. J. Sci. Food Agric. 2004, 84, 623–630. [Google Scholar] [CrossRef]
- Marchiosi, R.; dos Santos, W.D.; Constantin, R.P.; de Lima, R.B.; Soares, A.R.; Finger-Teixeira, A.; Mota, T.R.; de Oliveira, D.M.; Foletto-Felipe, M.d.P.; Abrahão, J. Biosynthesis and metabolic actions of simple phenolic acids in plants. Phytochem. Rev. 2020, 19, 865–906. [Google Scholar] [CrossRef]
- Brand, J.J.; Becker, D.W. Evidence for direct roles of calcium in photosynthesis. J. Bioenerg. Biomembr. 1984, 16, 239–249. [Google Scholar] [CrossRef]
- Shaul, O. Magnesium transport and function in plants: The tip of the iceberg. Biometals 2002, 15, 307–321. [Google Scholar] [CrossRef]
- Gransee, A.; Führs, H. Magnesium mobility in soils as a challenge for soil and plant analysis, magnesium fertilization, and root uptake under adverse growth conditions. Plant Soil 2013, 368, 5–21. [Google Scholar] [CrossRef] [Green Version]
- Terry, N. Effects of sulfur on the photosynthesis of intact leaves and isolated chloroplasts of sugar beets. Plant Physiol. 1976, 57, 477–479. [Google Scholar] [CrossRef] [PubMed] [Green Version]
- Kaur, N.P.; Takkar, P.N.; Nayyar, V.K. Catalase, peroxidase, and chlorphyll relationships to yield and iron deficiency chlorosis in Cicer genotypes. J. Plant Nutr. 1984, 7, 1213–1220. [Google Scholar] [CrossRef]
- Shi, P.; Li, B.; Chen, H.; Song, C.; Meng, J.; Xi, Z.; Zhang, Z. Iron supply affects anthocyanin content and related gene expression in berries of Vitis vinifera cv. Cabernet Sauvignon. Molecules 2017, 22, 283. [Google Scholar] [CrossRef] [PubMed]
- Mousavi, S.R.; Shahsavari, M.; Rezaei, M. A general overview on manganese (Mn) importance for crops production. Australian J. Basic Appl. Sci. 2011, 5, 1799–1803. [Google Scholar]
- Singh, P.; Misra, A.; Srivastava, N. Influence of Mn deficiency on growth, chlorophyll content, physiology, and essential monoterpene oil(s) in genotypes of spearmint (Mentha spicata L.). Photosynthetica 2001, 39, 473–476. [Google Scholar] [CrossRef]
- Matoh, T. Boron in plant cell walls. Plant Soil 1997, 193, 59–70. [Google Scholar] [CrossRef]
- Hua, Y.; Feng, Y.; Zhou, T.; Xu, F. Genome-scale mRNA transcriptomic insights into the responses of oilseed rape (Brassica napus L.) to varying boron availabilities. Plant Soil 2017, 416, 205–225. [Google Scholar] [CrossRef]
- Nable, R.O.; Bañuelos, G.S.; Paull, J.G. Boron toxicity. Plant Soil 1997, 193, 181–198. [Google Scholar] [CrossRef]
- Moody, D.B.; Rathjen, A.J.; Cartwright, B.; Paull, J.G.; Lewis, J. Genetic diversity and geographical distribution of tolerance to high levels of soil boron. In Seventh International Wheat Genetics Symposium; Miller, T.E., Koebner, R.M.D., Eds.; Institute of Plant Science Research: Cambridge, UK, 1988; pp. 859–865. [Google Scholar]
- Debaeke, P.; Rouet, P.; Justes, E. Relationship between the normalized SPAD index and the nitrogen nutrition index: Application to durum wheat. J. Plant Nutr. 2006, 29, 75–92. [Google Scholar] [CrossRef]
- Loh, F.C.; Grabosky, J.C.; Bassuk, N.L. Using the SPAD 502 meter to assess chlorophyll and nitrogen content of benjamin fig and cottonwood leaves. HortTechnology 2002, 12, 682–686. [Google Scholar] [CrossRef] [Green Version]


© 2020 by the authors. Licensee MDPI, Basel, Switzerland. This article is an open access article distributed under the terms and conditions of the Creative Commons Attribution (CC BY) license (http://creativecommons.org/licenses/by/4.0/).
Share and Cite
Veazie, P.; Cockson, P.; Henry, J.; Perkins-Veazie, P.; Whipker, B. Characterization of Nutrient Disorders and Impacts on Chlorophyll and Anthocyanin Concentration of Brassica rapa var. Chinensis. Agriculture 2020, 10, 461. https://doi.org/10.3390/agriculture10100461
Veazie P, Cockson P, Henry J, Perkins-Veazie P, Whipker B. Characterization of Nutrient Disorders and Impacts on Chlorophyll and Anthocyanin Concentration of Brassica rapa var. Chinensis. Agriculture. 2020; 10(10):461. https://doi.org/10.3390/agriculture10100461
Chicago/Turabian StyleVeazie, Patrick, Paul Cockson, Josh Henry, Penelope Perkins-Veazie, and Brian Whipker. 2020. "Characterization of Nutrient Disorders and Impacts on Chlorophyll and Anthocyanin Concentration of Brassica rapa var. Chinensis" Agriculture 10, no. 10: 461. https://doi.org/10.3390/agriculture10100461