Neuroprotection after Hemorrhagic Stroke Depends on Cerebral Heme Oxygenase-1

 , and
, and 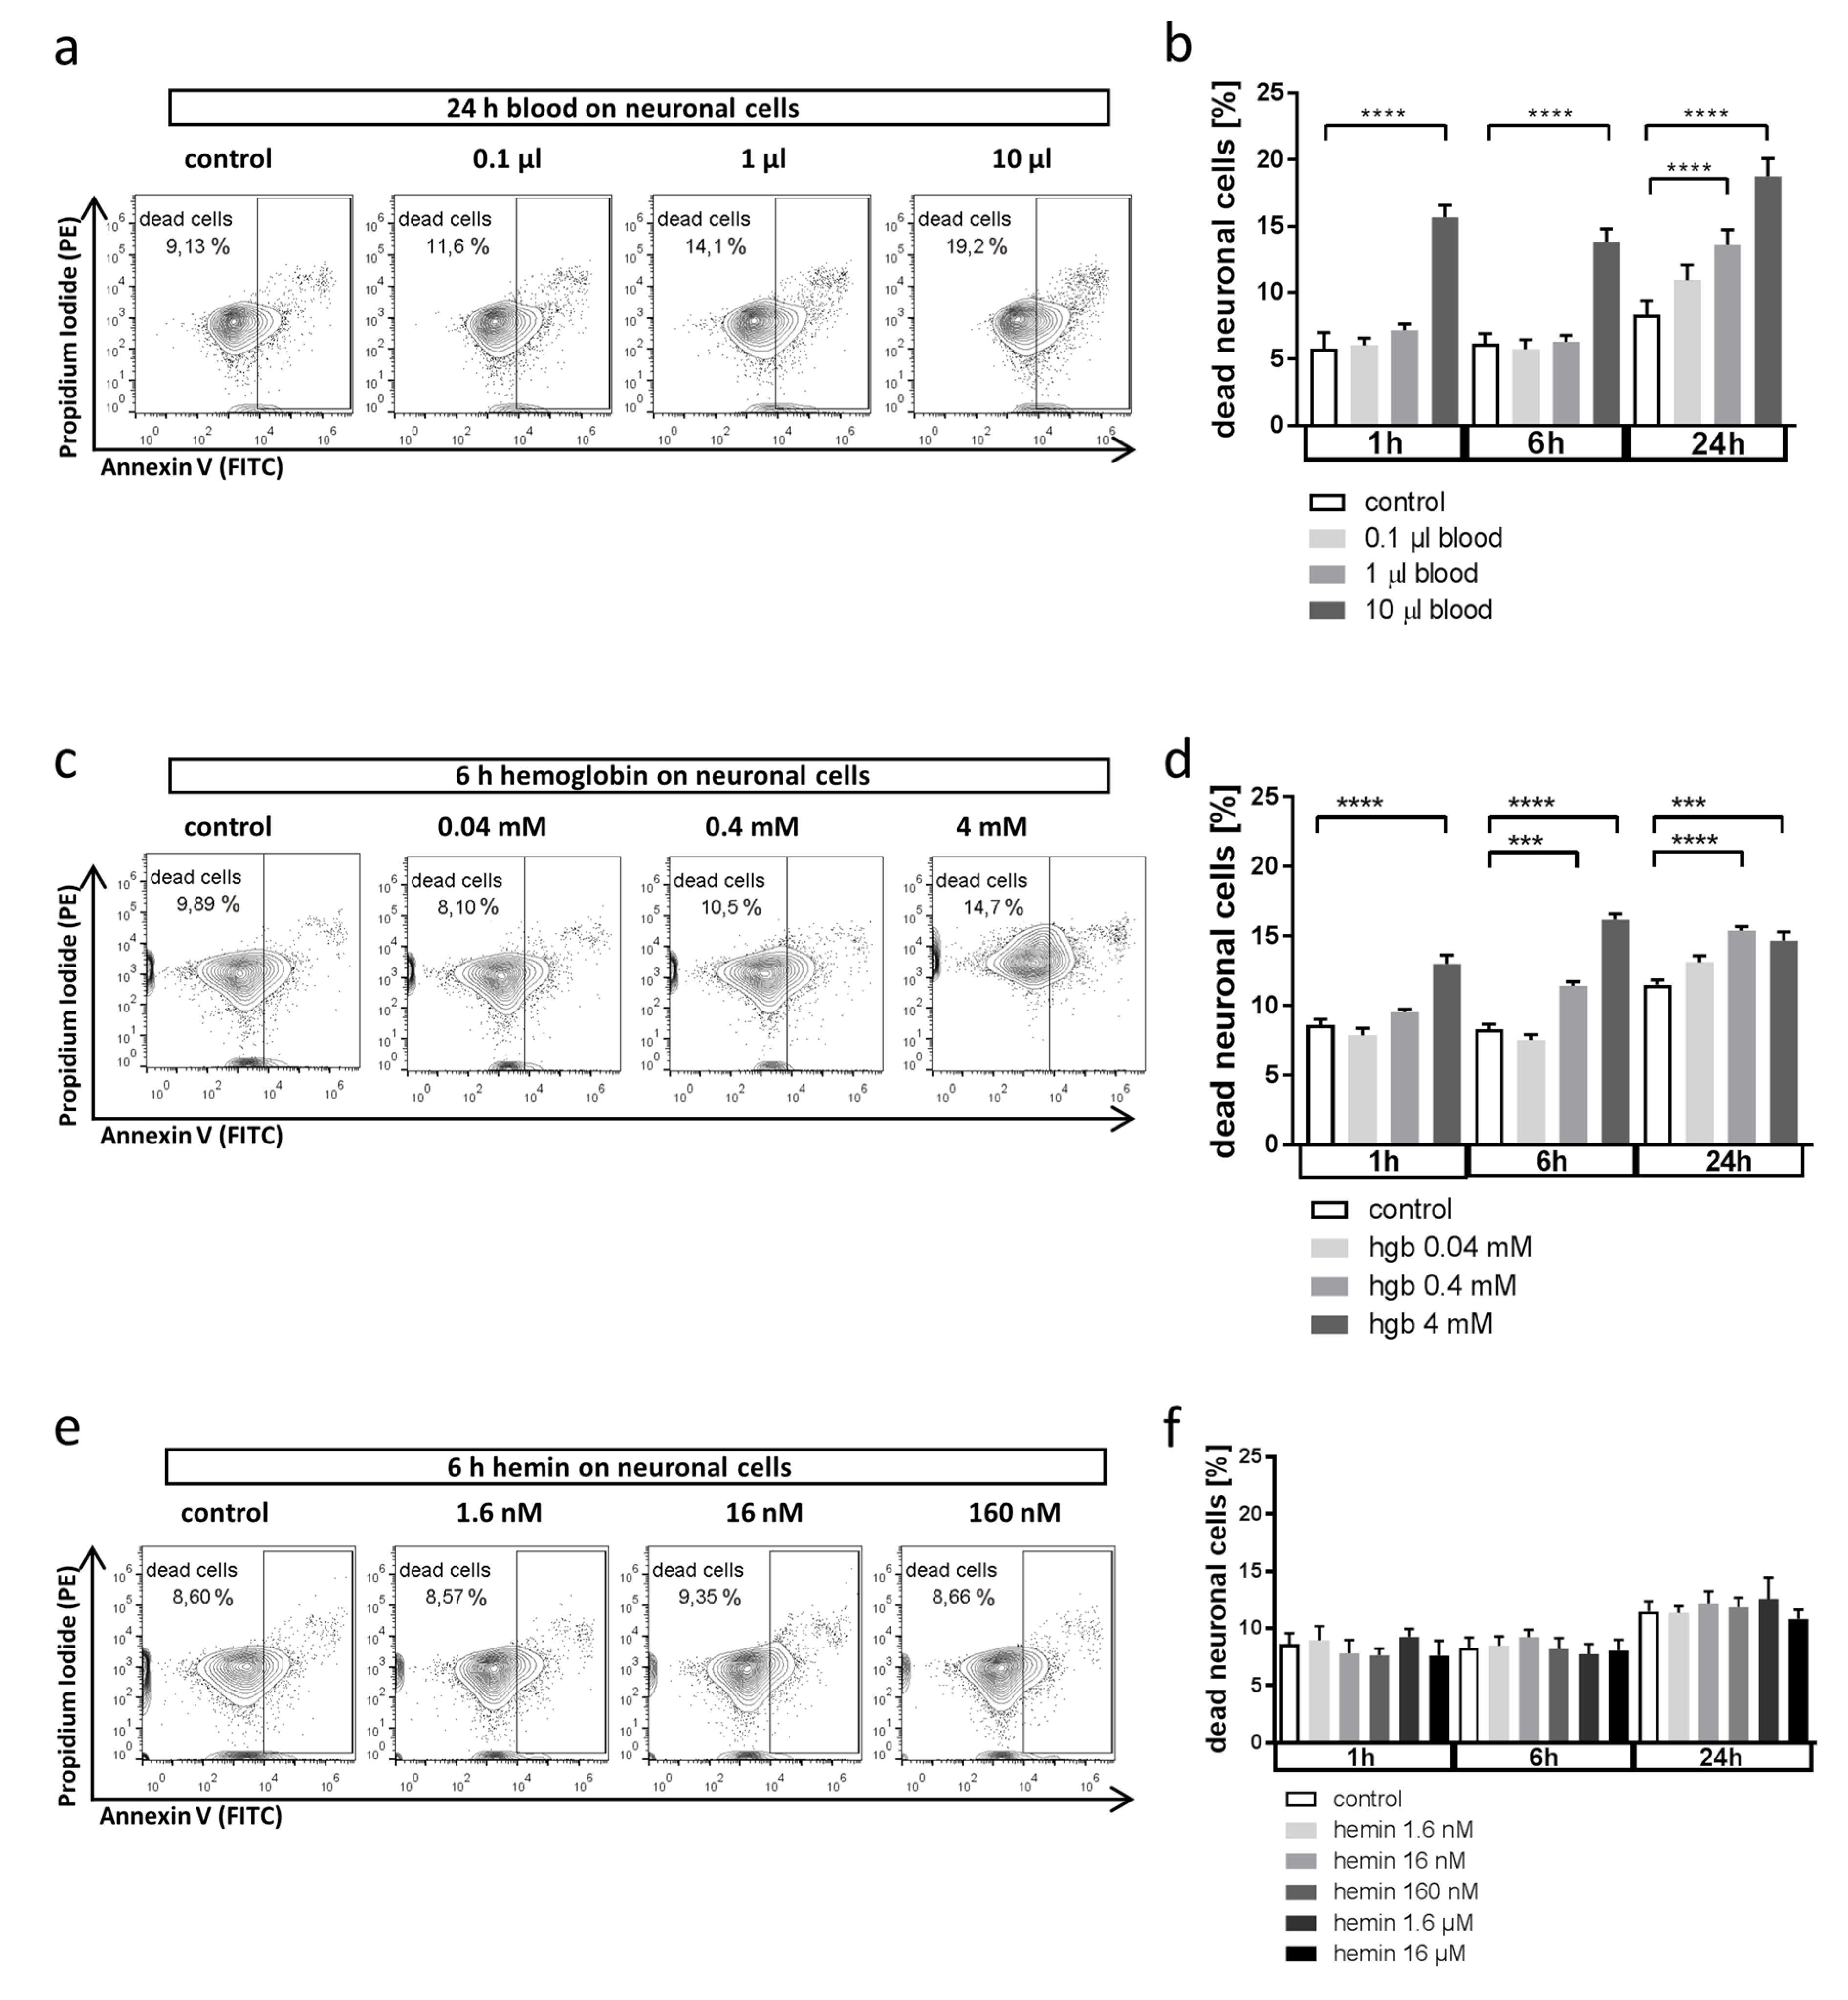
Abstract
:1. Introduction
2. Materials and Methods
2.1. Culture of Cell Lines and Primary Microglia
2.2. Cell Treatment
2.3. Annexin V/Propidium Iodide (PI) Staining and Flow Cytometry
2.4. Western Blot HO-1
2.5. Light Microscopy and Cell Quantification
2.6. Bead-Based Flow Cytometry of Cell Supernatants
2.7. Human Sample Collection and Analysis
- HMOX-1 (Accession Number: NM_002133)Forward: GTGATAGAAGAGGCCAAGACTGReverse: GAATCTTGCACTTTGTTGCTGG
- HMOX-2 (Accession Number: NM_002134)Forward: AAGAGAGGATCGTGGAGGAGReverse: CTTTGTCTTGTTCAGCAGCG
- BLVRA (Accession Number: NM_000712)Forward: AGCTTTCTCTTGTGTCTGCCReverse: ACATTCTCCAAGGACCCAGA
- RPL13A (Accession Number: NM_012423)Forward: CGCTGTGAAGGCATCAACATTTCReverse: GCTGTCACTGCCTGGTACTTC
2.8. Statistics
2.9. Study Approval
3. Results
3.1. Whole Blood and Hemoglobin, but Not Hemin, Induce Neuronal Cell Death in Vitro
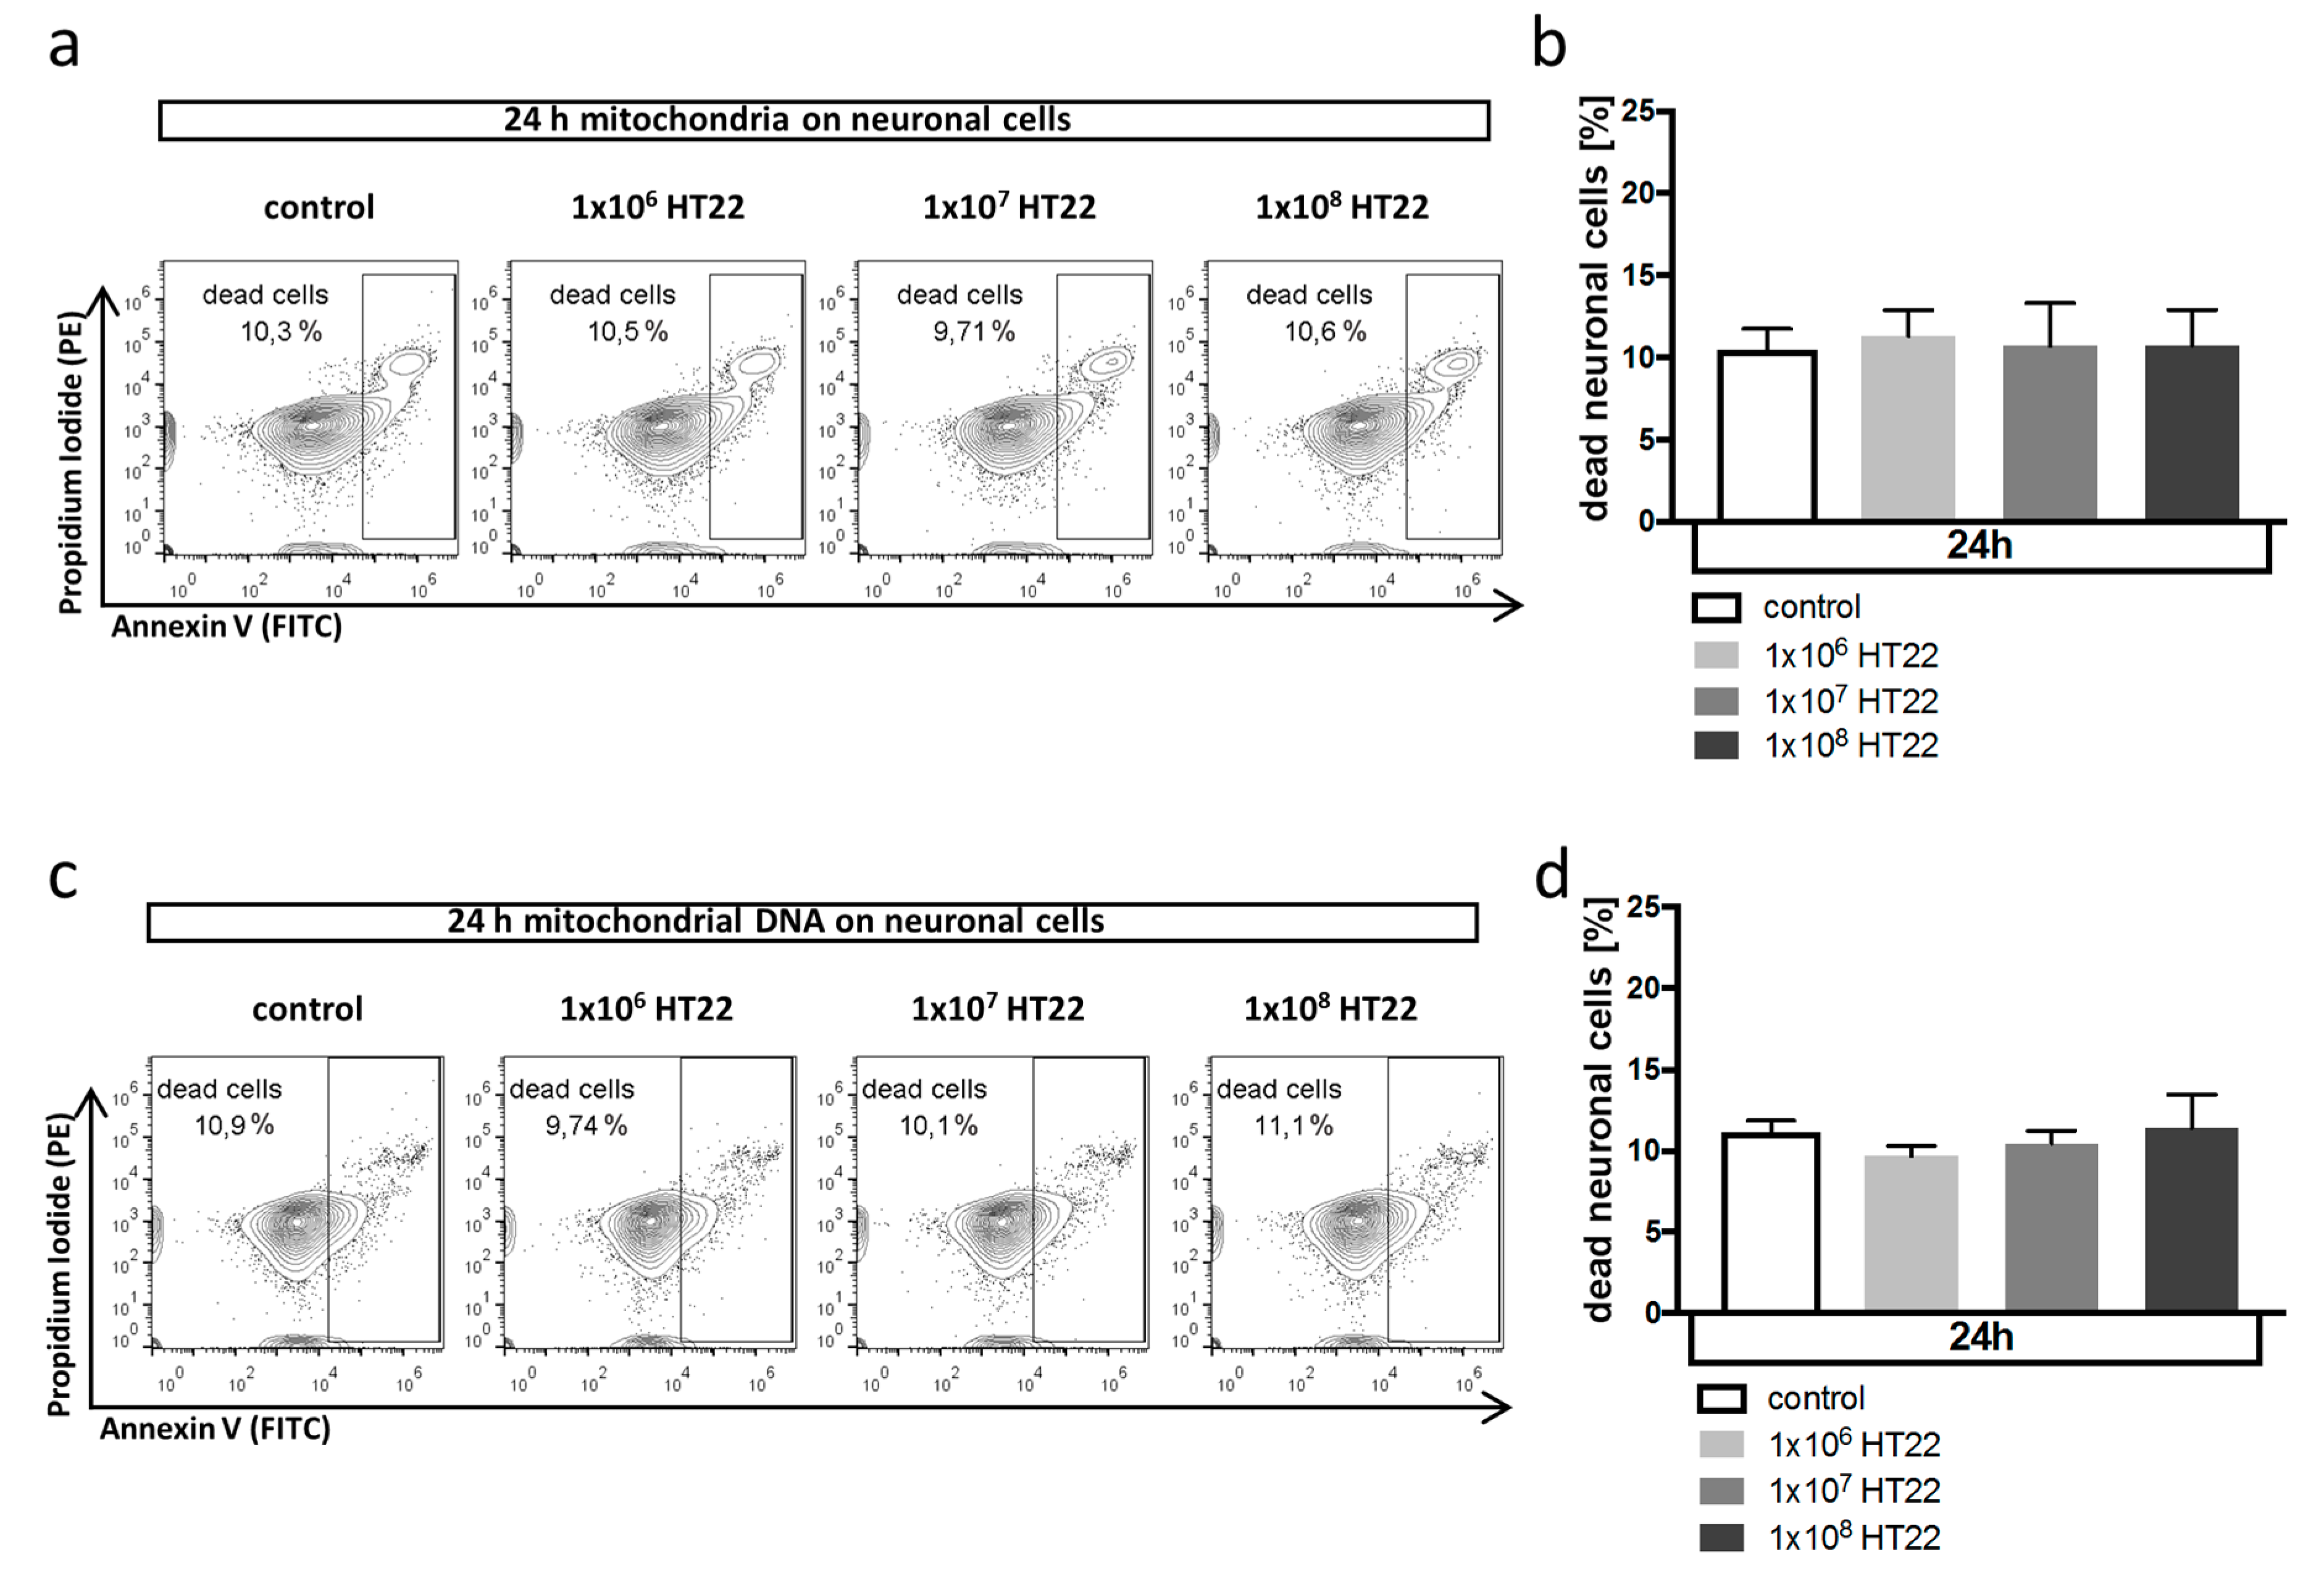
3.2. Neuronal Apoptosis Is Not Affected by Mitochondrial DAMPs
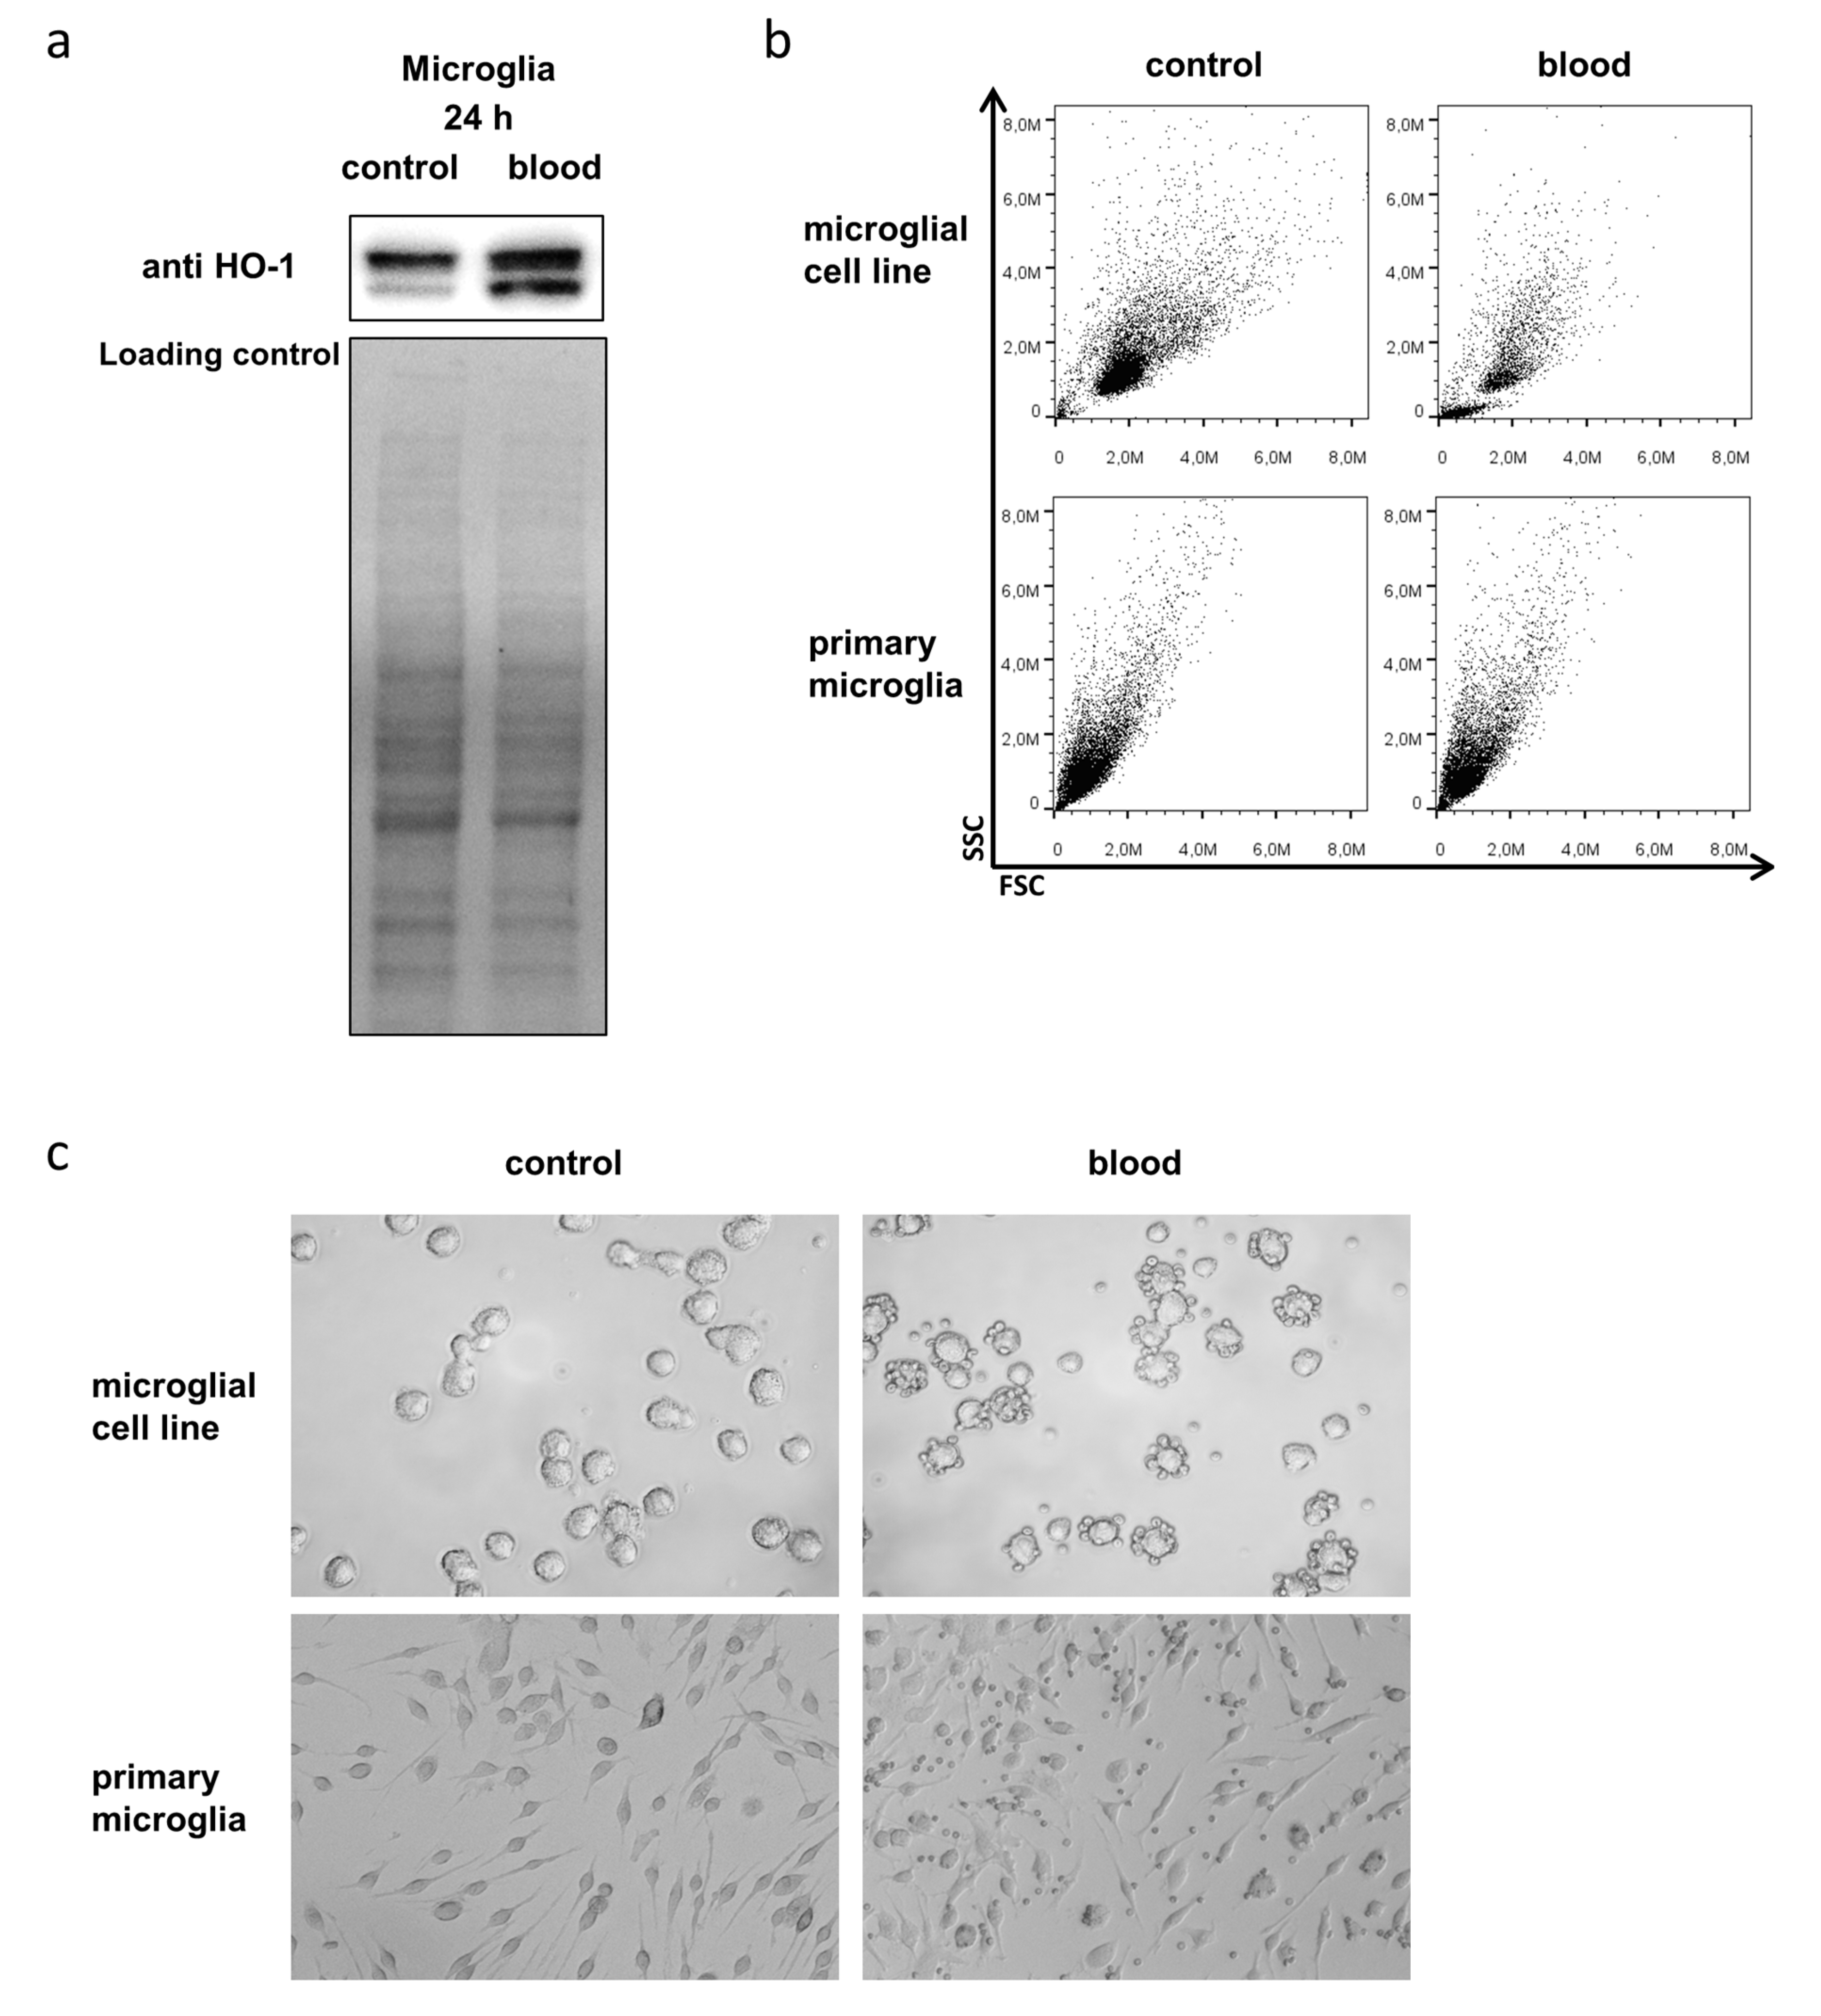
3.3. Microglia Express HO-1 in Response to Blood Exposure While Sustaining Viability
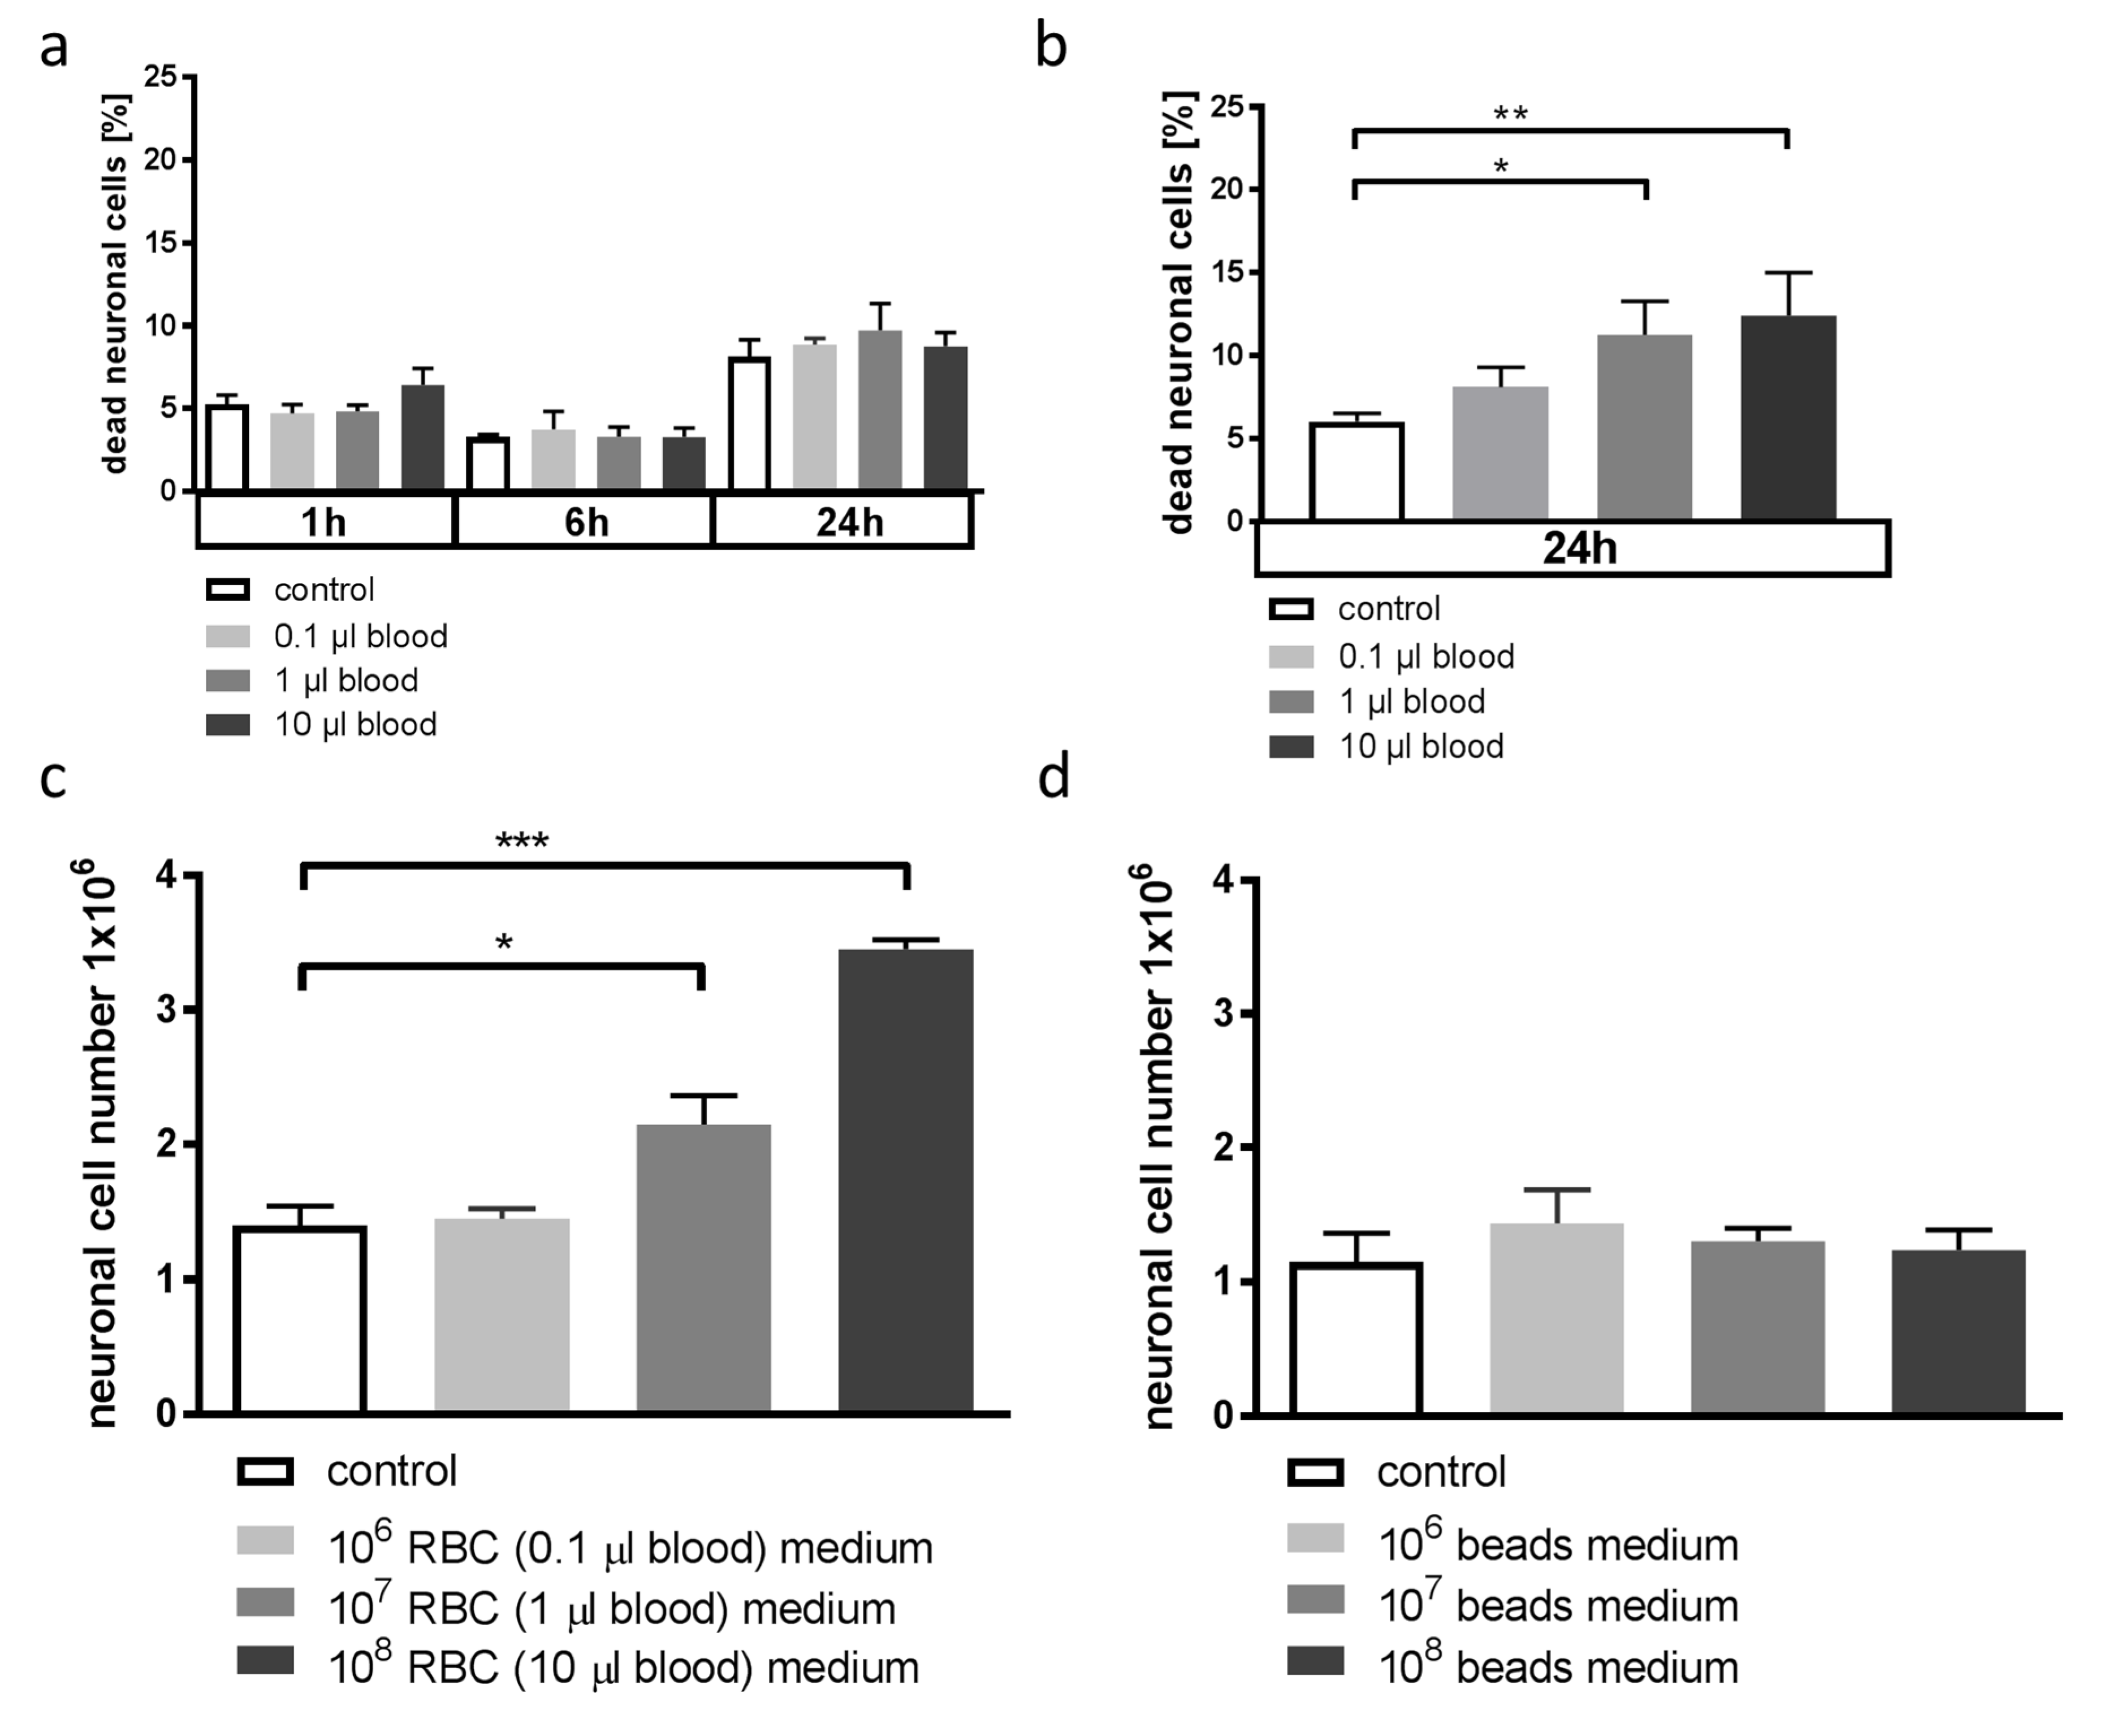
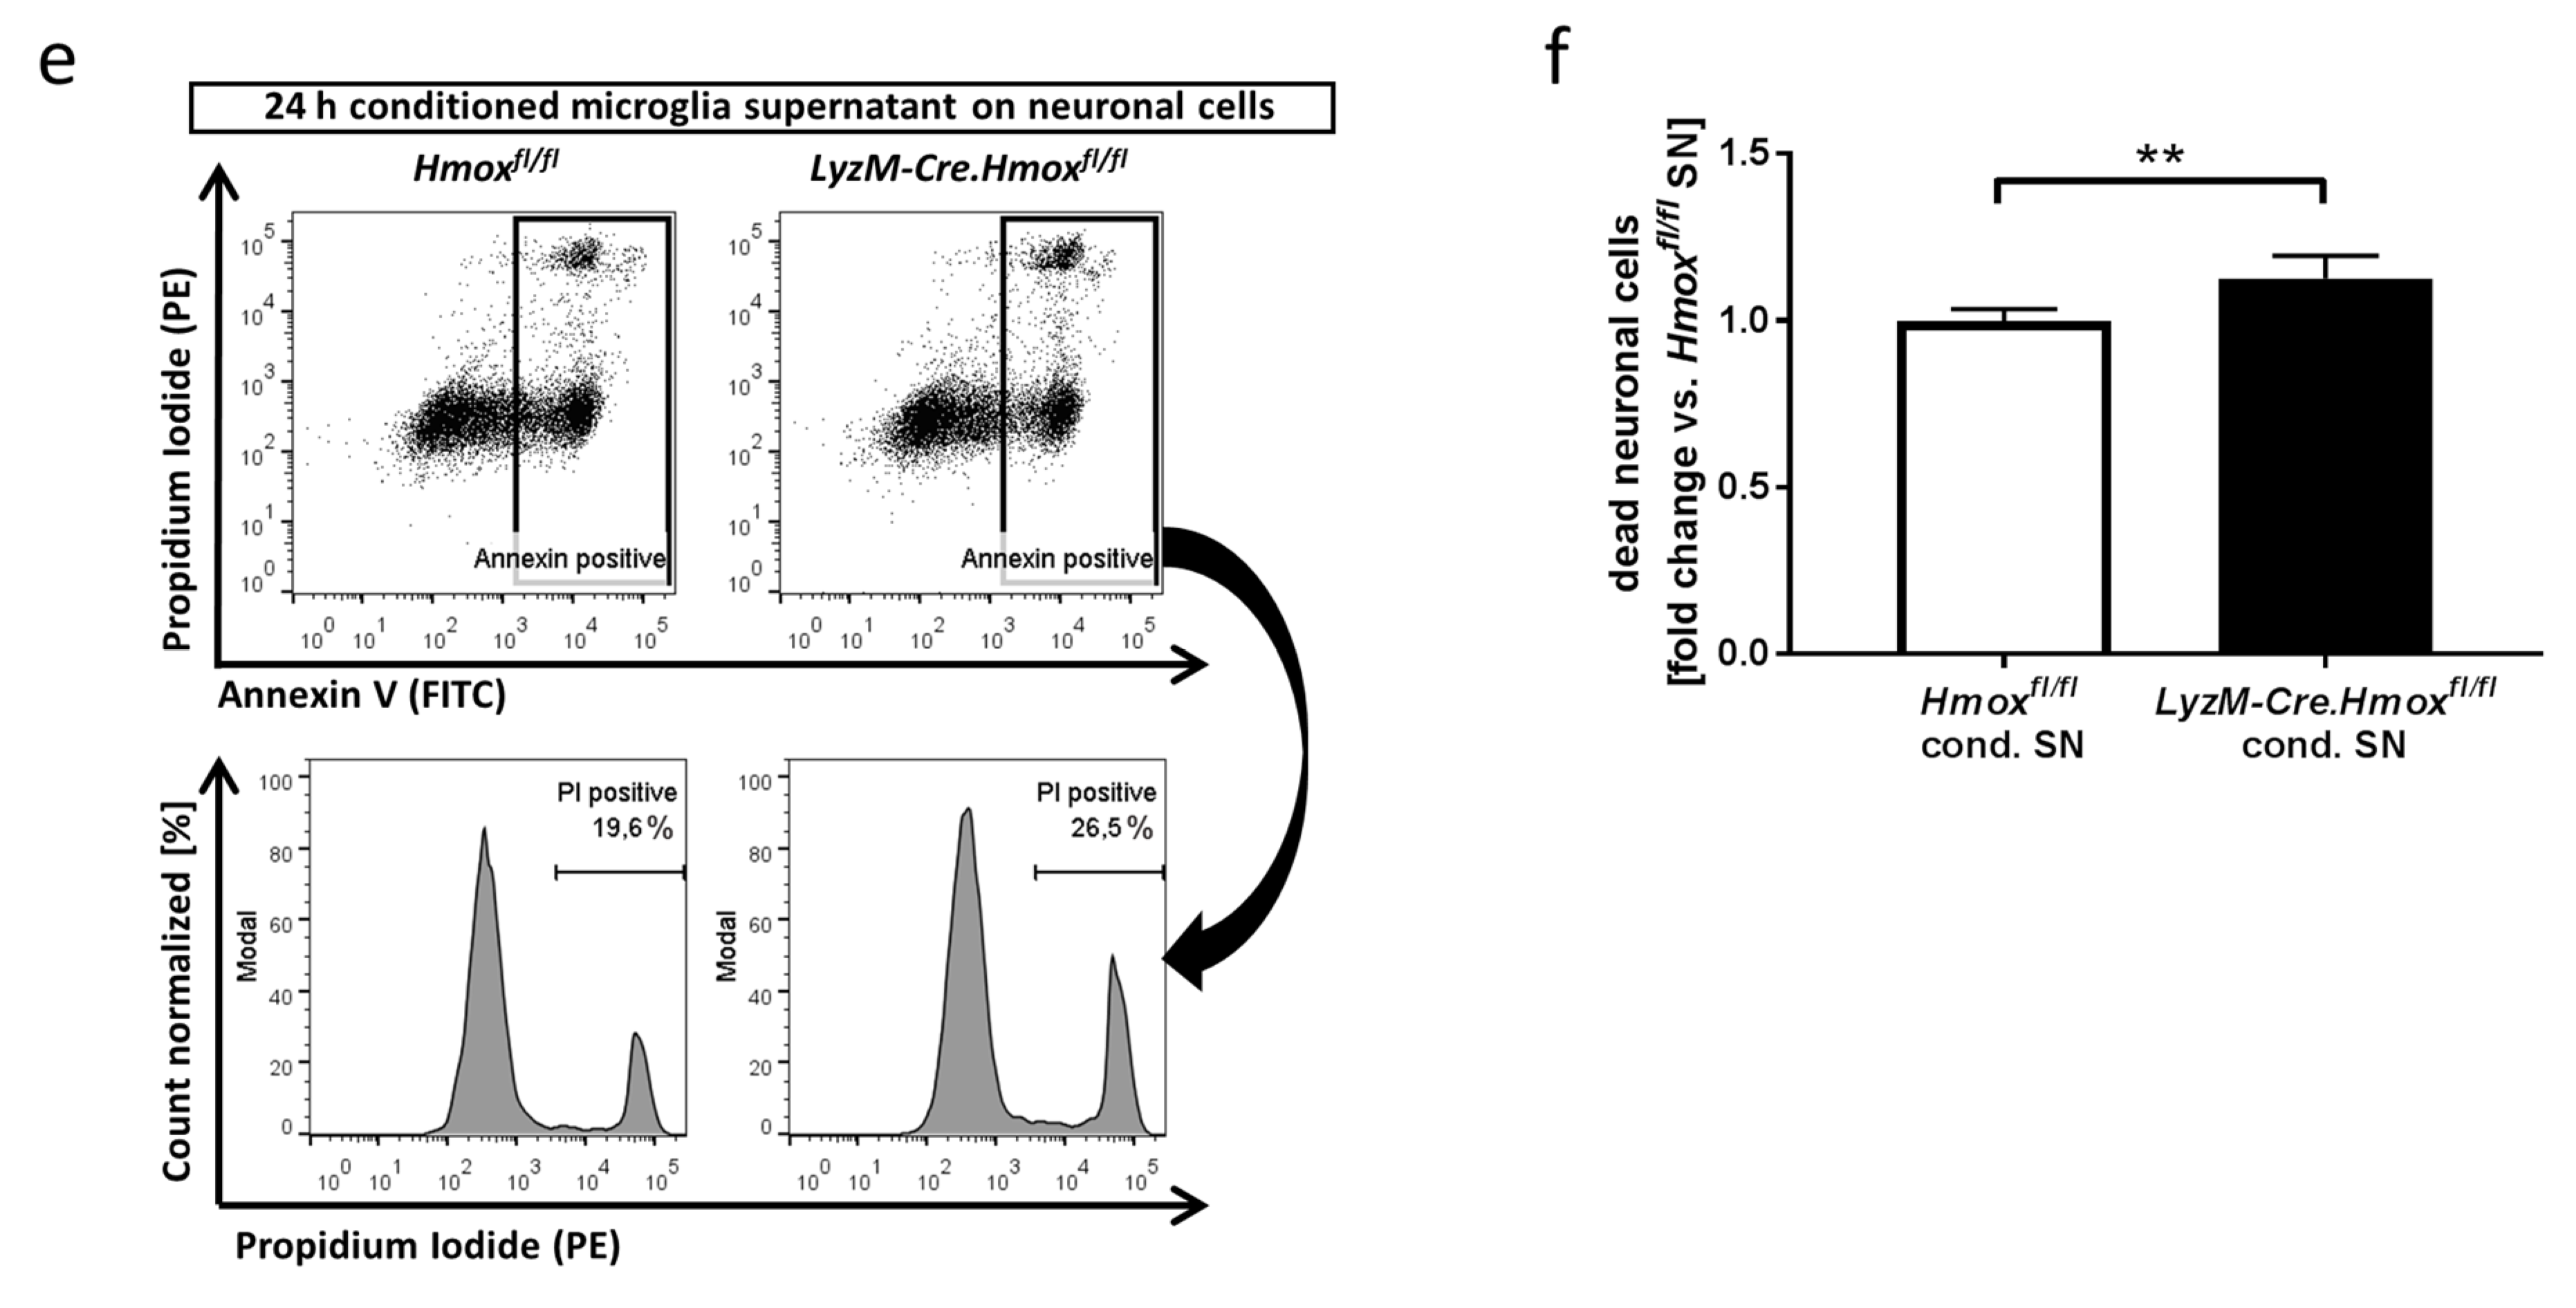
3.4. Blood-Conditioned Medium from Microglia Exerts Pro-Survival Signaling in Neuronal Cells
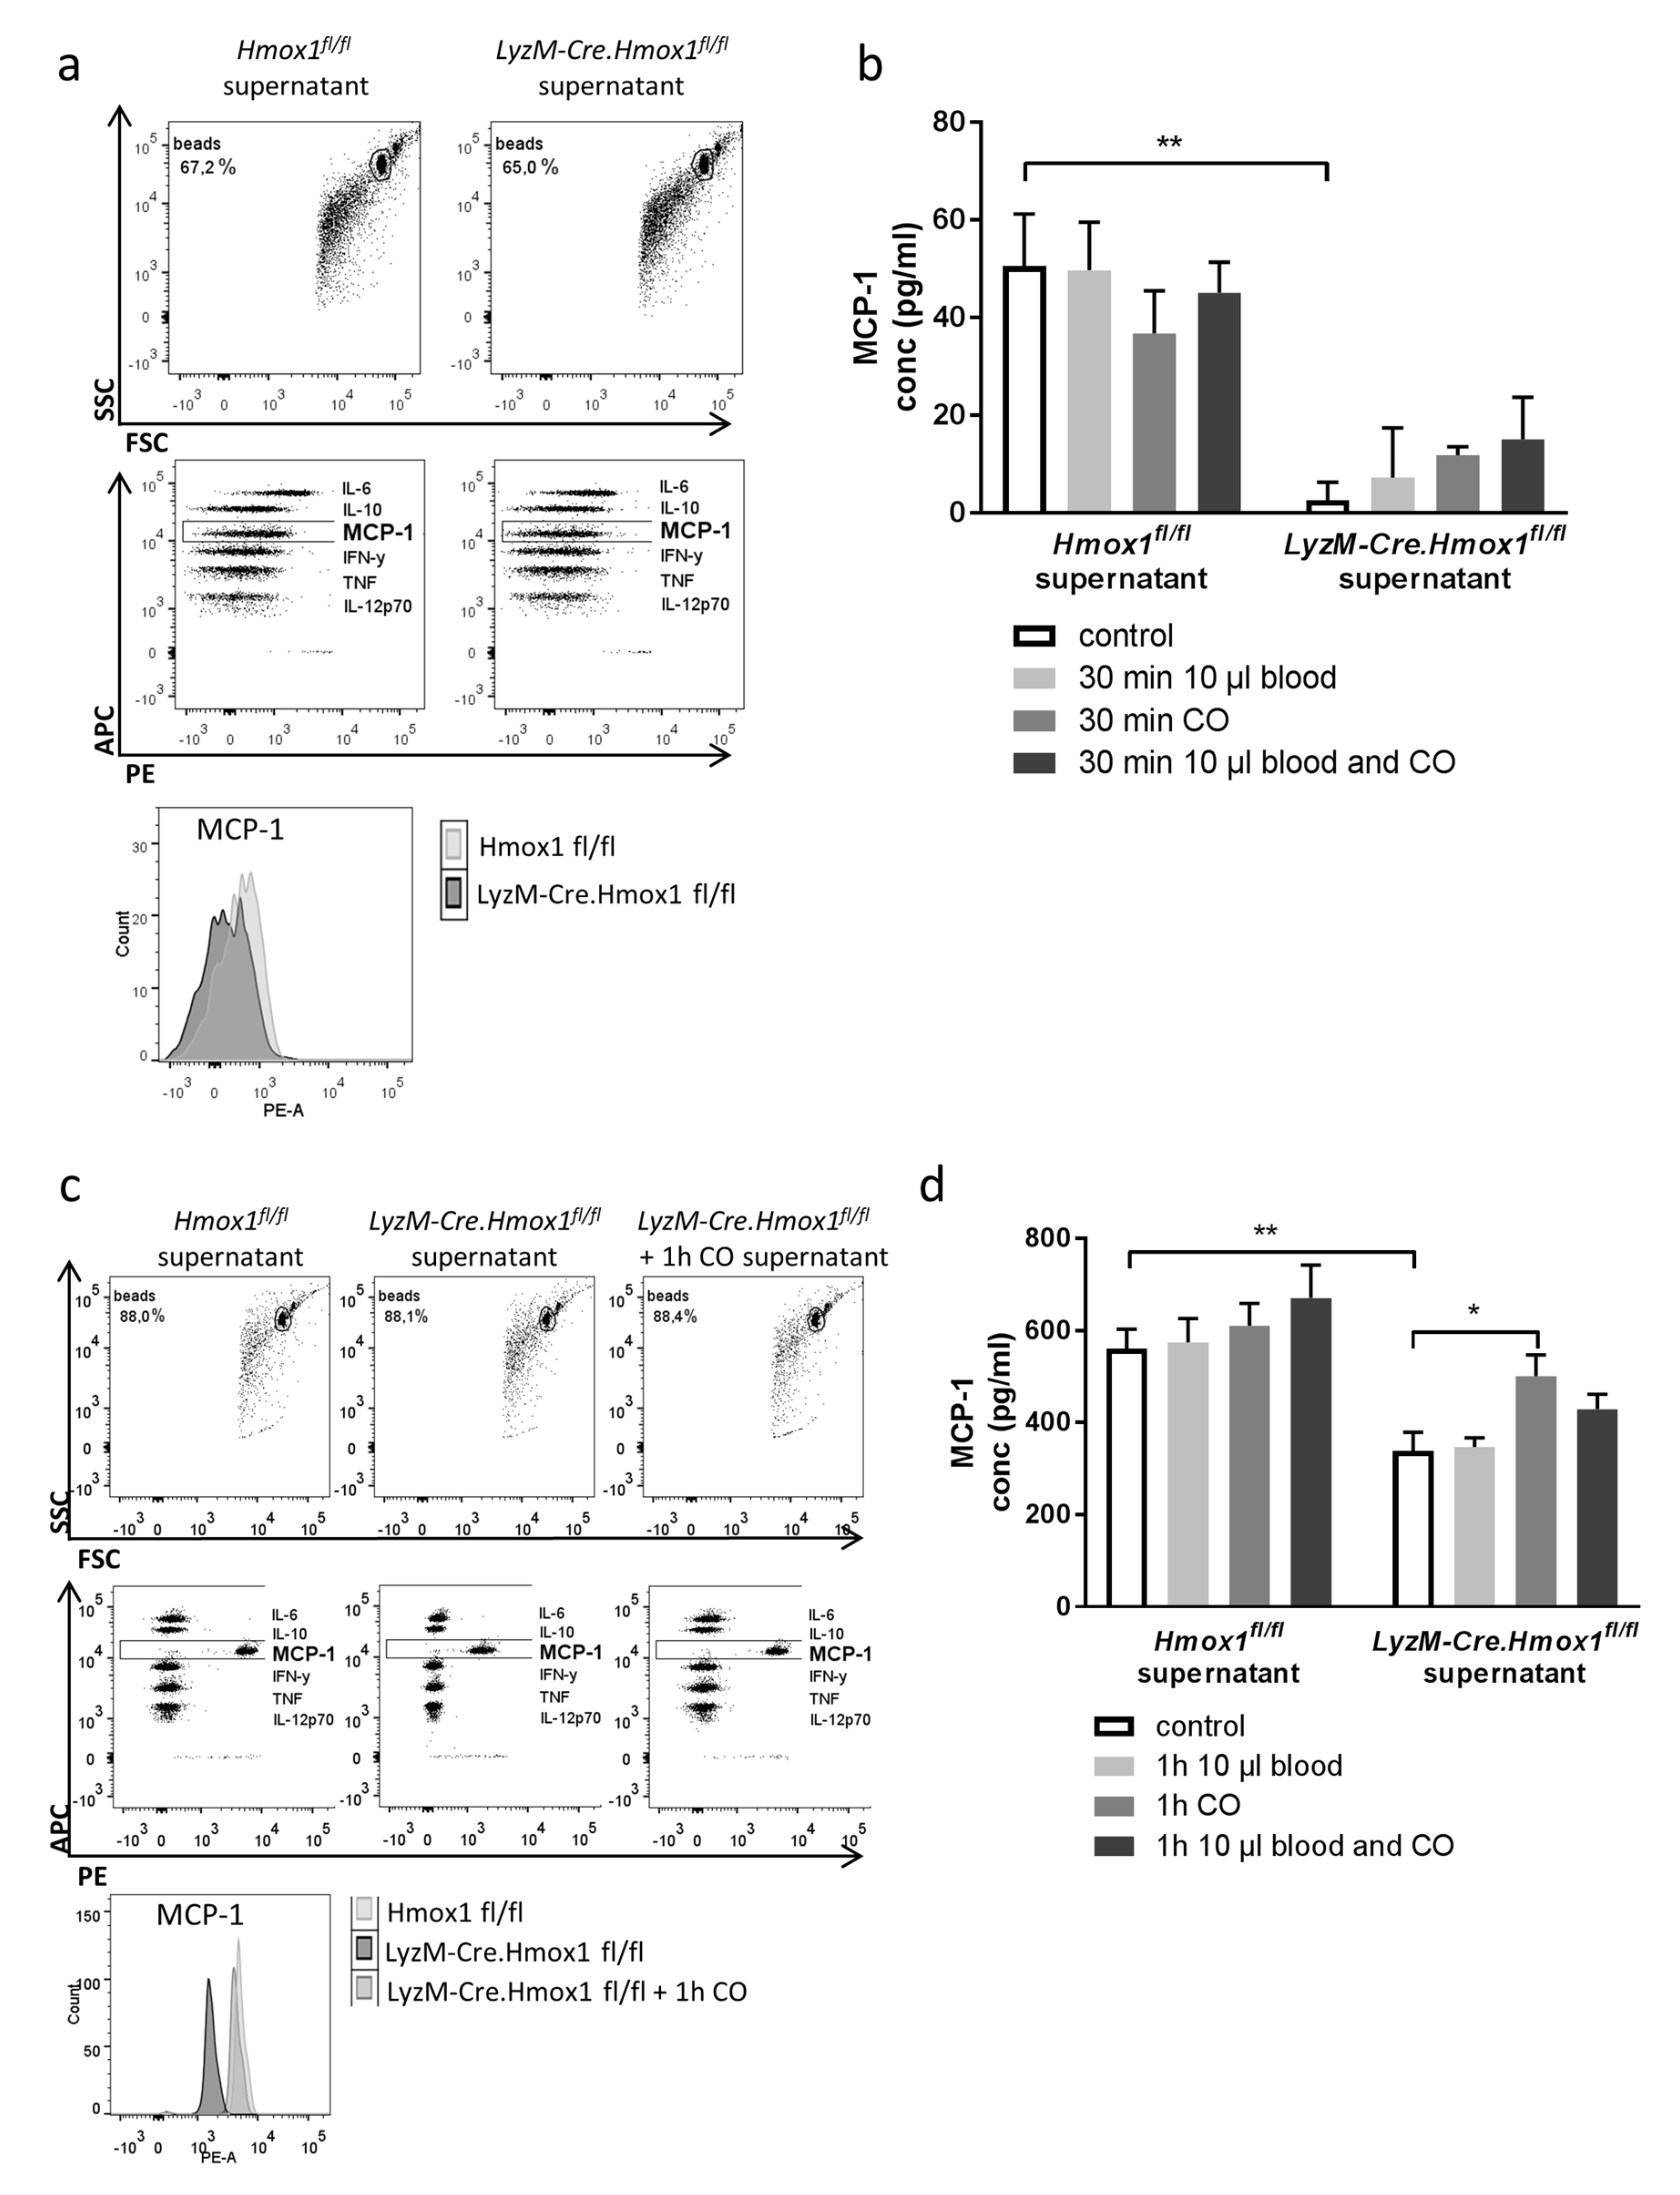
3.5. Blood Exposure Leads to a HO-1-Dependent Shift in the Microglial Cytokine Profile Influencing Neuronal Survival
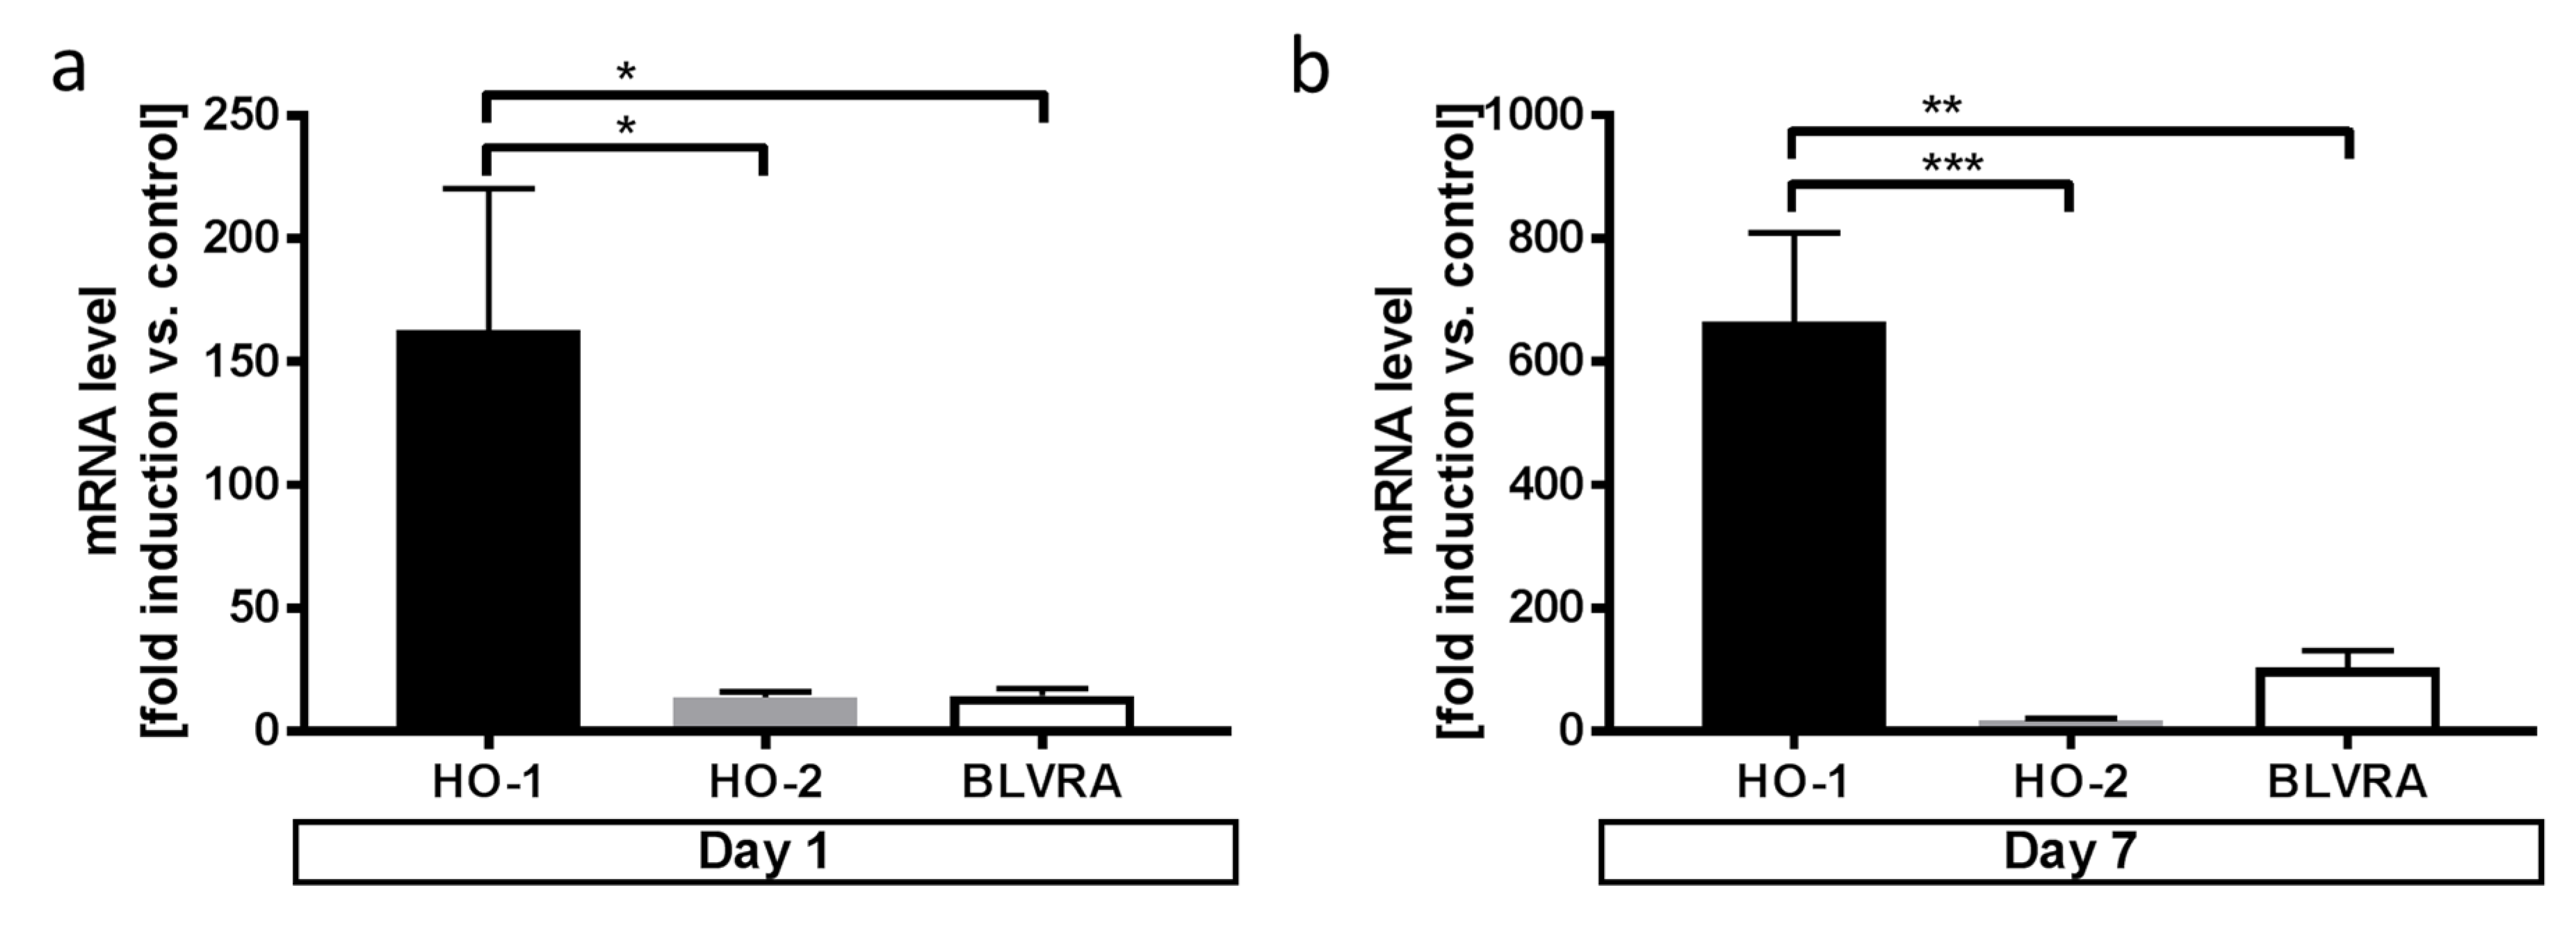
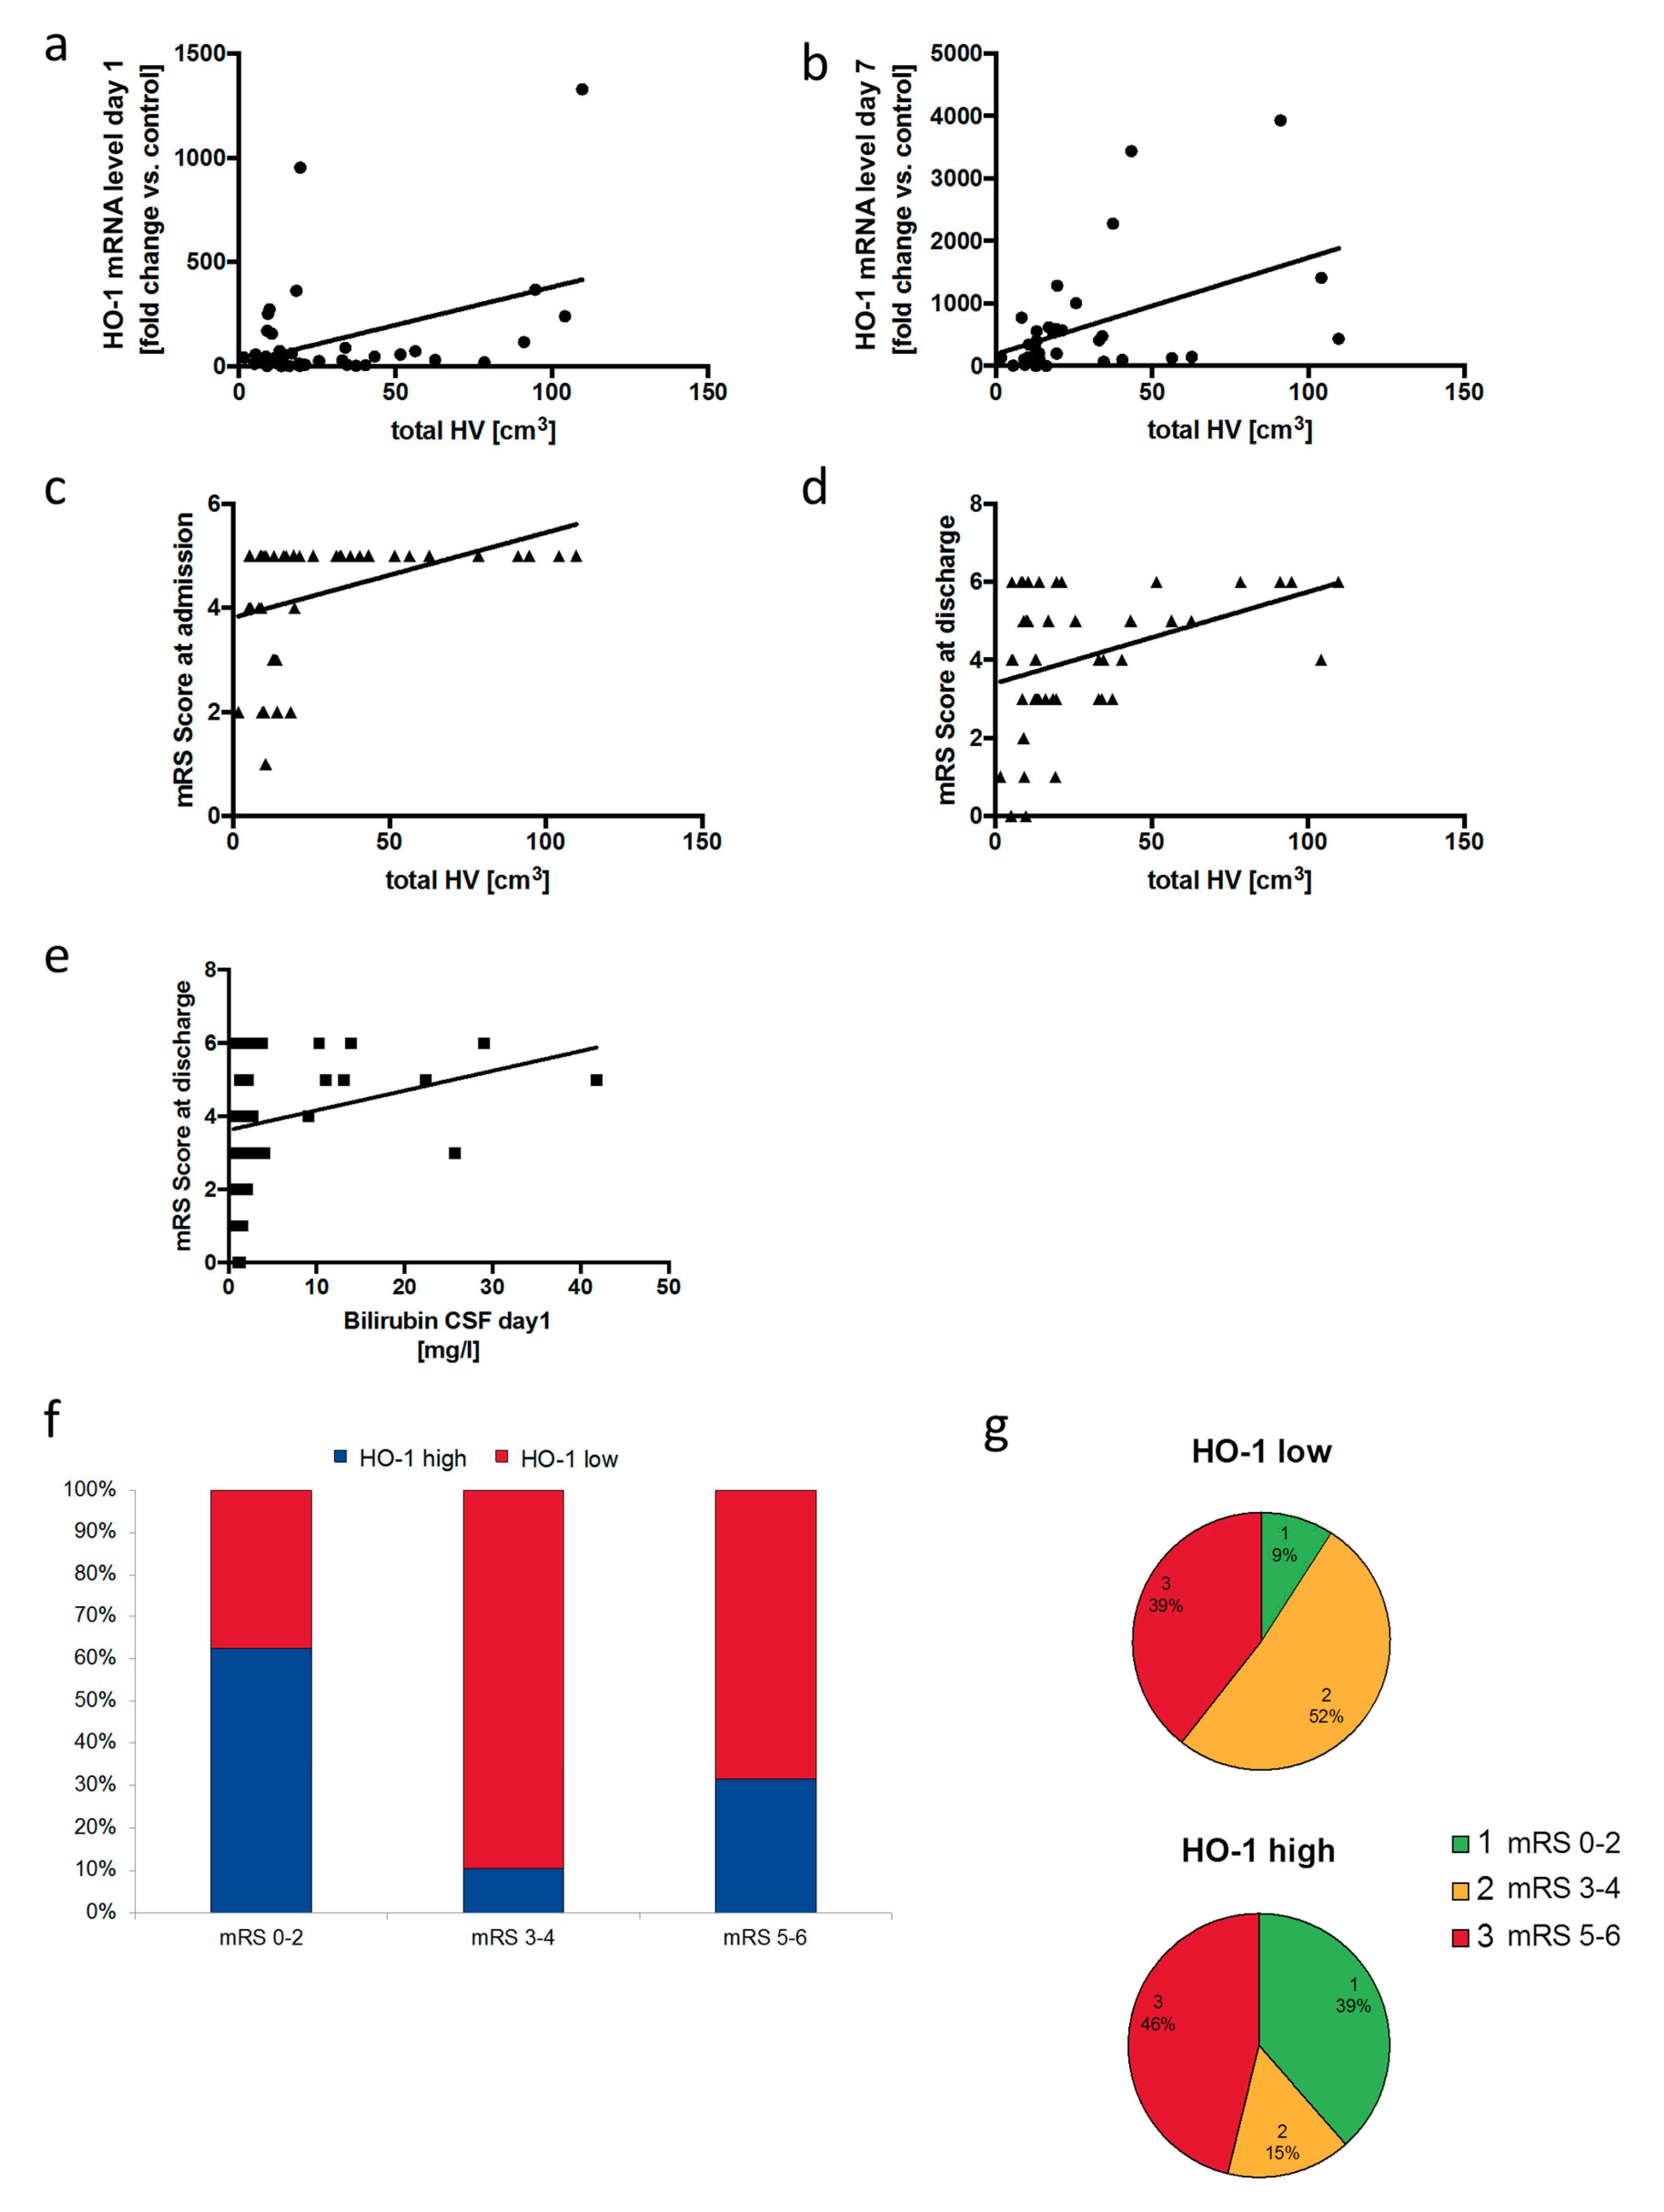
3.6. Neuronal Outcome in SAH Patients Correlates with Relative HO-1 Expression in the Cerebrospinal Fluid
4. Discussion
Author Contributions
Funding
Acknowledgments
Conflicts of Interest
References
- Al-Khindi, T.; Macdonald, R.L.; Schweizer, T.A. Cognitive and functional outcome after aneurysmal subarachnoid hemorrhage. Stroke J. Cereb. Circ. 2010, 41, e519–e536. [Google Scholar] [CrossRef] [PubMed]
- Nieuwkamp, D.J.; Setz, L.E.; Algra, A.; Linn, F.H.; de Rooij, N.K.; Rinkel, G.J. Changes in case fatality of aneurysmal subarachnoid haemorrhage over time, according to age, sex, and region: A meta-analysis. Lancet Neurol. 2009, 8, 635–642. [Google Scholar] [CrossRef]
- Hijdra, A.; Van Gijn, J.; Stefanko, S.; Van Dongen, K.J.; Vermeulen, M.; Van Crevel, H. Delayed cerebral ischemia after aneurysmal subarachnoid hemorrhage: Clinicoanatomic correlations. Neurology 1986, 36, 329–333. [Google Scholar] [CrossRef] [PubMed]
- Macdonald, R.L.; Higashida, R.T.; Keller, E.; Mayer, S.A.; Molyneux, A.; Raabe, A.; Vajkoczy, P.; Wanke, I.; Bach, D.; Frey, A.; et al. Clazosentan, an endothelin receptor antagonist, in patients with aneurysmal subarachnoid haemorrhage undergoing surgical clipping: A randomised, double-blind, placebo-controlled phase 3 trial (CONSCIOUS-2). Lancet Neurol. 2011, 10, 618–625. [Google Scholar] [CrossRef]
- Vinet, J.; Weering, H.R.; Heinrich, A.; Kalin, R.E.; Wegner, A.; Brouwer, N.; Heppner, F.L.; Rooijen, N.; Boddeke, H.W.; Biber, K. Neuroprotective function for ramified microglia in hippocampal excitotoxicity. J. Neuroinflammation 2012, 9, 27. [Google Scholar] [CrossRef] [PubMed]
- Boscia, F.; Esposito, C.L.; Di Crisci, A.; de Franciscis, V.; Annunziato, L.; Cerchia, L. GDNF selectively induces microglial activation and neuronal survival in CA1/CA3 hippocampal regions exposed to NMDA insult through Ret/ERK signalling. PLoS ONE 2009, 4, e6486. [Google Scholar] [CrossRef] [PubMed]
- Chen-Roetling, J.; Regan, R.F. Haptoglobin increases the vulnerability of CD163-expressing neurons to hemoglobin. J. Neurochem. 2016, 139, 586–595. [Google Scholar] [CrossRef] [Green Version]
- Jaremko, K.M.; Chen-Roetling, J.; Chen, L.; Regan, R.F. Accelerated hemolysis and neurotoxicity in neuron-glia-blood clot co-cultures. J. Neurochem. 2010, 114, 1063–1073. [Google Scholar] [CrossRef] [Green Version]
- Schallner, N.; Pandit, R.; LeBlanc, R., 3rd; Thomas, A.J.; Ogilvy, C.S.; Zuckerbraun, B.S.; Gallo, D.; Otterbein, L.E.; Hanafy, K.A. Microglia regulate blood clearance in subarachnoid hemorrhage by heme oxygenase-1. J. Clin. Investig. 2015, 125, 2609–2625. [Google Scholar] [CrossRef]
- Otterbein, L.E.; Kolls, J.K.; Mantell, L.L.; Cook, J.L.; Alam, J.; Choi, A.M. Exogenous administration of heme oxygenase-1 by gene transfer provides protection against hyperoxia-induced lung injury. J. Clin. Investig. 1999, 103, 1047–1054. [Google Scholar] [CrossRef] [Green Version]
- Clark, J.E.; Foresti, R.; Sarathchandra, P.; Kaur, H.; Green, C.J.; Motterlini, R. Heme oxygenase-1-derived bilirubin ameliorates postischemic myocardial dysfunction. Am. J. Physiol. Heart Circ. Physiol. 2000, 278, H643–H651. [Google Scholar] [CrossRef] [PubMed] [Green Version]
- Zhang, F.; Wang, S.; Zhang, M.; Weng, Z.; Li, P.; Gan, Y.; Zhang, L.; Cao, G.; Gao, Y.; Leak, R.K.; et al. Pharmacological induction of heme oxygenase-1 by a triterpenoid protects neurons against ischemic injury. Stroke J. Cereb. Circ. 2012, 43, 1390–1397. [Google Scholar] [CrossRef] [PubMed]
- Kuroki, M.; Kanamaru, K.; Suzuki, H.; Waga, S.; Semba, R. Effect of vasospasm on heme oxygenases in a rat model of subarachnoid hemorrhage. Stroke J. Cereb. Circ. 1998, 29, 683–688. [Google Scholar] [CrossRef] [PubMed]
- Matz, P.; Turner, C.; Weinstein, P.R.; Massa, S.M.; Panter, S.S.; Sharp, F.R. Heme-oxygenase-1 induction in glia throughout rat brain following experimental subarachnoid hemorrhage. Brain Res. 1996, 713, 211–222. [Google Scholar] [CrossRef]
- Sutherland, B.A.; Rahman, R.M.; Clarkson, A.N.; Shaw, O.M.; Nair, S.M.; Appleton, I. Cerebral heme oxygenase 1 and 2 spatial distribution is modulated following injury from hypoxia-ischemia and middle cerebral artery occlusion in rats. Neurosci. Res. 2009, 65, 326–334. [Google Scholar] [CrossRef]
- Zeynalov, E.; Dore, S. Low doses of carbon monoxide protect against experimental focal brain ischemia. Neurotox. Res. 2009, 15, 133–137. [Google Scholar] [CrossRef]
- Smith, A.; Wu, A.H.; Lynch, K.L.; Ko, N.; Grenache, D.G. Multi-wavelength spectrophotometric analysis for detection of xanthochromia in cerebrospinal fluid and accuracy for the diagnosis of subarachnoid hemorrhage. Clin. Chim. Acta Int. J. Clin. Chem. 2013, 424, 231–236. [Google Scholar] [CrossRef]
- Banks, J.L.; Marotta, C.A. Outcomes validity and reliability of the modified Rankin scale: Implications for stroke clinical trials: A literature review and synthesis. Stroke J. Cereb. Circ. 2007, 38, 1091–1096. [Google Scholar] [CrossRef]
- Wu, J.; Hua, Y.; Keep, R.F.; Nakamura, T.; Hoff, J.T.; Xi, G. Iron and iron-handling proteins in the brain after intracerebral hemorrhage. Stroke J. Cereb. Circ. 2003, 34, 2964–2969. [Google Scholar] [CrossRef]
- Chen-Roetling, J.; Li, Z.; Chen, M.; Awe, O.O.; Regan, R.F. Heme oxygenase activity and hemoglobin neurotoxicity are attenuated by inhibitors of the MEK/ERK pathway. Neuropharmacology 2009, 56, 922–928. [Google Scholar] [CrossRef] [Green Version]
- Xi, G.; Hua, Y.; Bhasin, R.R.; Ennis, S.R.; Keep, R.F.; Hoff, J.T. Mechanisms of edema formation after intracerebral hemorrhage: Effects of extravasated red blood cells on blood flow and blood-brain barrier integrity. Stroke J. Cereb. Circ. 2001, 32, 2932–2938. [Google Scholar] [CrossRef] [PubMed]
- Larsen, R.; Gouveia, Z.; Soares, M.P.; Gozzelino, R. Heme cytotoxicity and the pathogenesis of immune-mediated inflammatory diseases. Front. Pharmacol. 2012, 3, 77. [Google Scholar] [CrossRef] [PubMed]
- Ye, F.; Li, X.; Liu, Y.; Chang, W.; Liu, W.; Yuan, J.; Chen, J. Hemin provides protection against lead neurotoxicity through heme oxygenase 1/carbon monoxide activation. J. Appl. Toxicol. 2018, 38, 1353–1364. [Google Scholar] [CrossRef] [PubMed]
- Zhang, Q.; Raoof, M.; Chen, Y.; Sumi, Y.; Sursal, T.; Junger, W.; Brohi, K.; Itagaki, K.; Hauser, C.J. Circulating mitochondrial DAMPs cause inflammatory responses to injury. Nature 2010, 464, 104–107. [Google Scholar] [CrossRef] [PubMed] [Green Version]
- Lu, Y.; Zhang, X.S.; Zhang, Z.H.; Zhou, X.M.; Gao, Y.Y.; Liu, G.J.; Wang, H.; Wu, L.Y.; Li, W.; Hang, C.H. Peroxiredoxin 2 activates microglia by interacting with Toll-like receptor 4 after subarachnoid hemorrhage. J. Neuroinflamm. 2018, 15, 87. [Google Scholar] [CrossRef] [PubMed]
- Festoff, B.W.; Sajja, R.K.; van Dreden, P.; Cucullo, L. HMGB1 and thrombin mediate the blood-brain barrier dysfunction acting as biomarkers of neuroinflammation and progression to neurodegeneration in Alzheimer’s disease. J. Neuroinflamm. 2016, 13, 194. [Google Scholar] [CrossRef] [PubMed]
- Saleem, S.; Zhuang, H.; Biswal, S.; Christen, Y.; Dore, S. Ginkgo biloba extract neuroprotective action is dependent on heme oxygenase 1 in ischemic reperfusion brain injury. Stroke J. Cereb. Circ. 2008, 39, 3389–3396. [Google Scholar] [CrossRef]
- Motterlini, R.; Sawle, P.; Hammad, J.; Mann, B.E.; Johnson, T.R.; Green, C.J.; Foresti, R. Vasorelaxing effects and inhibition of nitric oxide in macrophages by new iron-containing carbon monoxide-releasing molecules (CO-RMs). Pharmacol. Res. Off. J. Ital. Pharmacol. Soc. 2013, 68, 108–117. [Google Scholar] [CrossRef] [Green Version]
- Turner, C.P.; Panter, S.S.; Sharp, F.R. Anti-oxidants prevent focal rat brain injury as assessed by induction of heat shock proteins (HSP70, HO-1/HSP32, HSP47) following subarachnoid injections of lysed blood. Brain Res. Mol. Brain Res. 1999, 65, 87–102. [Google Scholar] [CrossRef]
- Hinojosa, A.E.; Garcia-Bueno, B.; Leza, J.C.; Madrigal, J.L. CCL2/MCP-1 modulation of microglial activation and proliferation. J. Neuroinflamm. 2011, 8, 77. [Google Scholar] [CrossRef]
- Yang, G.; Meng, Y.; Li, W.; Yong, Y.; Fan, Z.; Ding, H.; Wei, Y.; Luo, J.; Ke, Z.J. Neuronal MCP-1 mediates microglia recruitment and neurodegeneration induced by the mild impairment of oxidative metabolism. Brain Pathol. 2011, 21, 279–297. [Google Scholar] [CrossRef] [PubMed]
- Hanafy, K.A. The role of microglia and the TLR4 pathway in neuronal apoptosis and vasospasm after subarachnoid hemorrhage. J. Neuroinflamm. 2013, 10, 83. [Google Scholar] [CrossRef] [PubMed]
- Otterbein, L.E.; Foresti, R.; Motterlini, R. Heme Oxygenase-1 and Carbon Monoxide in the Heart: The Balancing Act Between Danger Signaling and Pro-Survival. Circ. Res. 2016, 118, 1940–1959. [Google Scholar] [CrossRef] [PubMed]
- Wilson, J.L.; Bouillaud, F.; Almeida, A.S.; Vieira, H.L.; Ouidja, M.O.; Dubois-Rande, J.L.; Foresti, R.; Motterlini, R. Carbon monoxide reverses the metabolic adaptation of microglia cells to an inflammatory stimulus. Free Radic. Biol. Med. 2017, 104, 311–323. [Google Scholar] [CrossRef]
- Rincon, F.; Rossenwasser, R.H.; Dumont, A. The epidemiology of admissions of nontraumatic subarachnoid hemorrhage in the United States. Neurosurgery 2013, 73, 217–222. [Google Scholar] [CrossRef]
- Macdonald, R.L. Delayed neurological deterioration after subarachnoid haemorrhage. Nat. Rev. Neurol. 2014, 10, 44–58. [Google Scholar] [CrossRef]
- Macdonald, R.L.; Kassell, N.F.; Mayer, S.; Ruefenacht, D.; Schmiedek, P.; Weidauer, S.; Frey, A.; Roux, S.; Pasqualin, A. Clazosentan to overcome neurological ischemia and infarction occurring after subarachnoid hemorrhage (CONSCIOUS-1): Randomized, double-blind, placebo-controlled phase 2 dose-finding trial. Stroke J. Cereb. Circ. 2008, 39, 3015–3021. [Google Scholar] [CrossRef]
- Witsch, J.; Frey, H.P.; Patel, S.; Park, S.; Lahiri, S.; Schmidt, J.M.; Agarwal, S.; Falo, M.C.; Velazquez, A.; Jaja, B.; et al. Prognostication of long-term outcomes after subarachnoid hemorrhage: The FRESH score. Ann. Neurol. 2016, 80, 46–58. [Google Scholar] [CrossRef]
- Chaudhry, S.R.; Guresir, A.; Stoffel-Wagner, B.; Fimmers, R.; Kinfe, T.M.; Dietrich, D.; Lamprecht, A.; Vatter, H.; Guresir, E.; Muhammad, S. Systemic high-mobility group box-1: A novel predictive biomarker for cerebral vasospasm in aneurysmal subarachnoid hemorrhage. Crit. Care Med. 2018, 46, e1023–e1028. [Google Scholar] [CrossRef]


© 2019 by the authors. Licensee MDPI, Basel, Switzerland. This article is an open access article distributed under the terms and conditions of the Creative Commons Attribution (CC BY) license (http://creativecommons.org/licenses/by/4.0/).
Share and Cite
Kaiser, S.; Frase, S.; Selzner, L.; Lieberum, J.-L.; Wollborn, J.; Niesen, W.-D.; Foit, N.A.; Heiland, D.H.; Schallner, N. Neuroprotection after Hemorrhagic Stroke Depends on Cerebral Heme Oxygenase-1. Antioxidants 2019, 8, 496. https://doi.org/10.3390/antiox8100496
Kaiser S, Frase S, Selzner L, Lieberum J-L, Wollborn J, Niesen W-D, Foit NA, Heiland DH, Schallner N. Neuroprotection after Hemorrhagic Stroke Depends on Cerebral Heme Oxygenase-1. Antioxidants. 2019; 8(10):496. https://doi.org/10.3390/antiox8100496
Chicago/Turabian StyleKaiser, Sandra, Sibylle Frase, Lisa Selzner, Judith-Lisa Lieberum, Jakob Wollborn, Wolf-Dirk Niesen, Niels Alexander Foit, Dieter Henrik Heiland, and Nils Schallner. 2019. "Neuroprotection after Hemorrhagic Stroke Depends on Cerebral Heme Oxygenase-1" Antioxidants 8, no. 10: 496. https://doi.org/10.3390/antiox8100496