

Comparative Transcriptomics Reveal Metabolic Rather than Genetic Control of Divergent Antioxidant Metabolism in the Primary Root Elongation Zone of Water-Stressed Cotton and Maize

Abstract
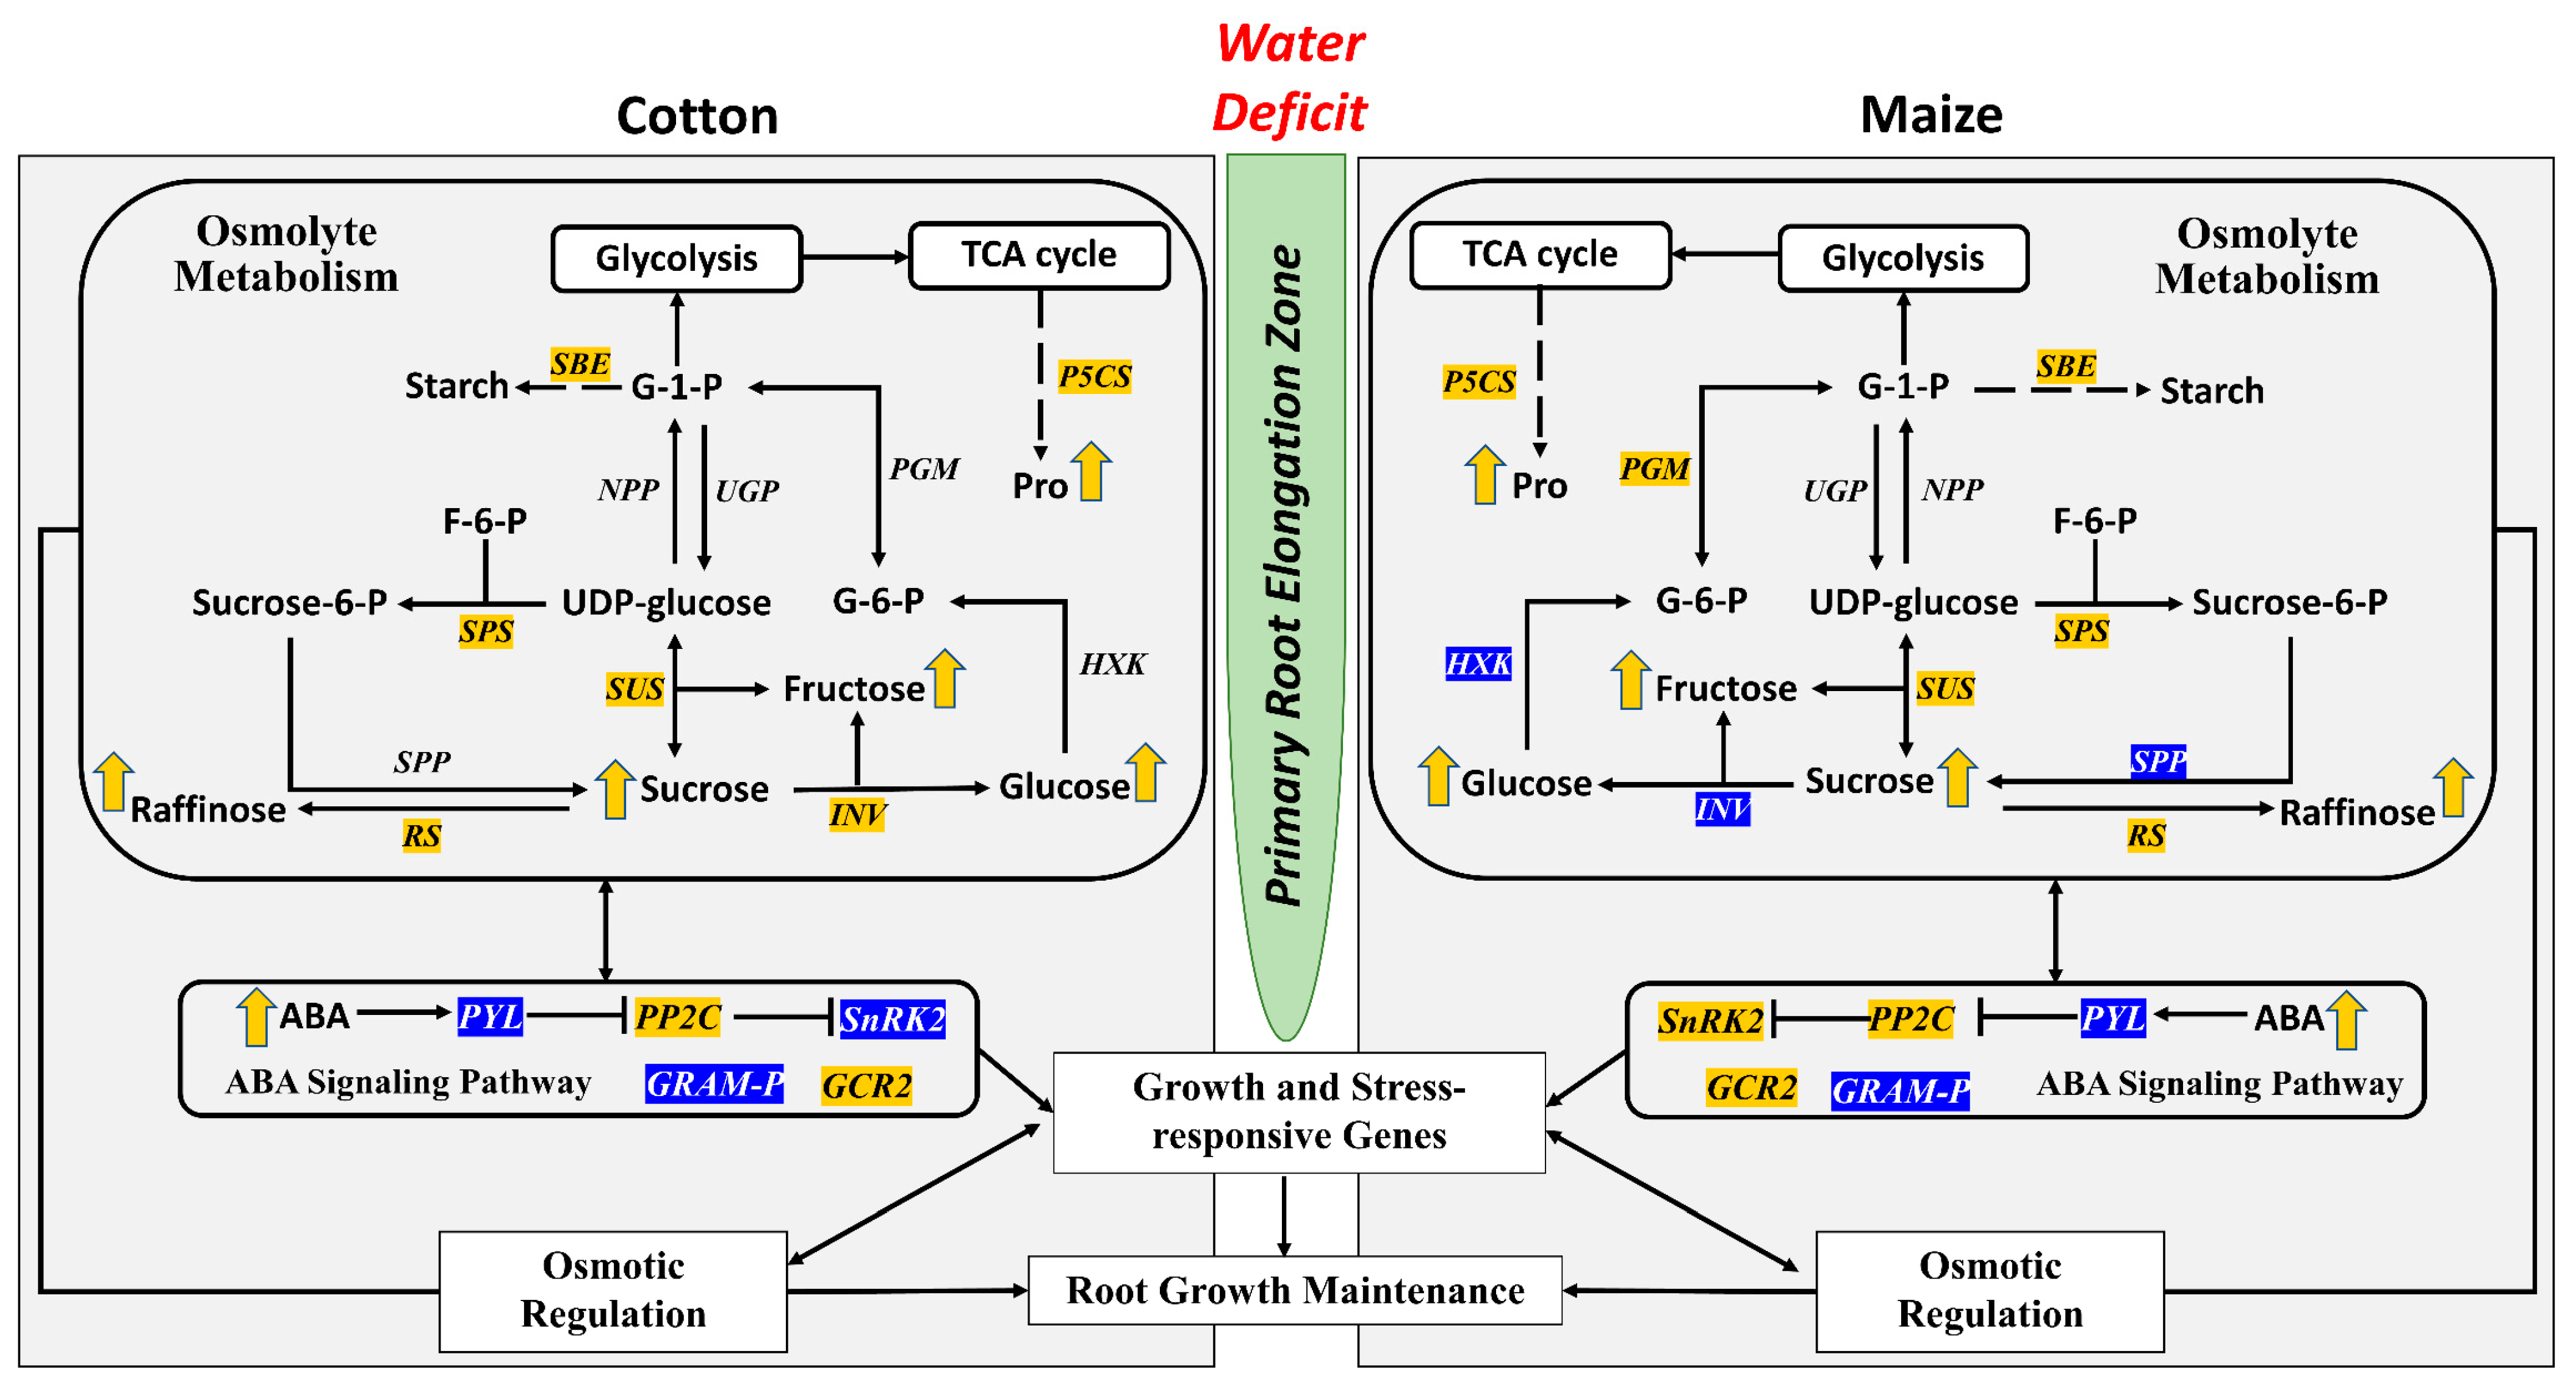
:1. Introduction
2. Materials and Methods
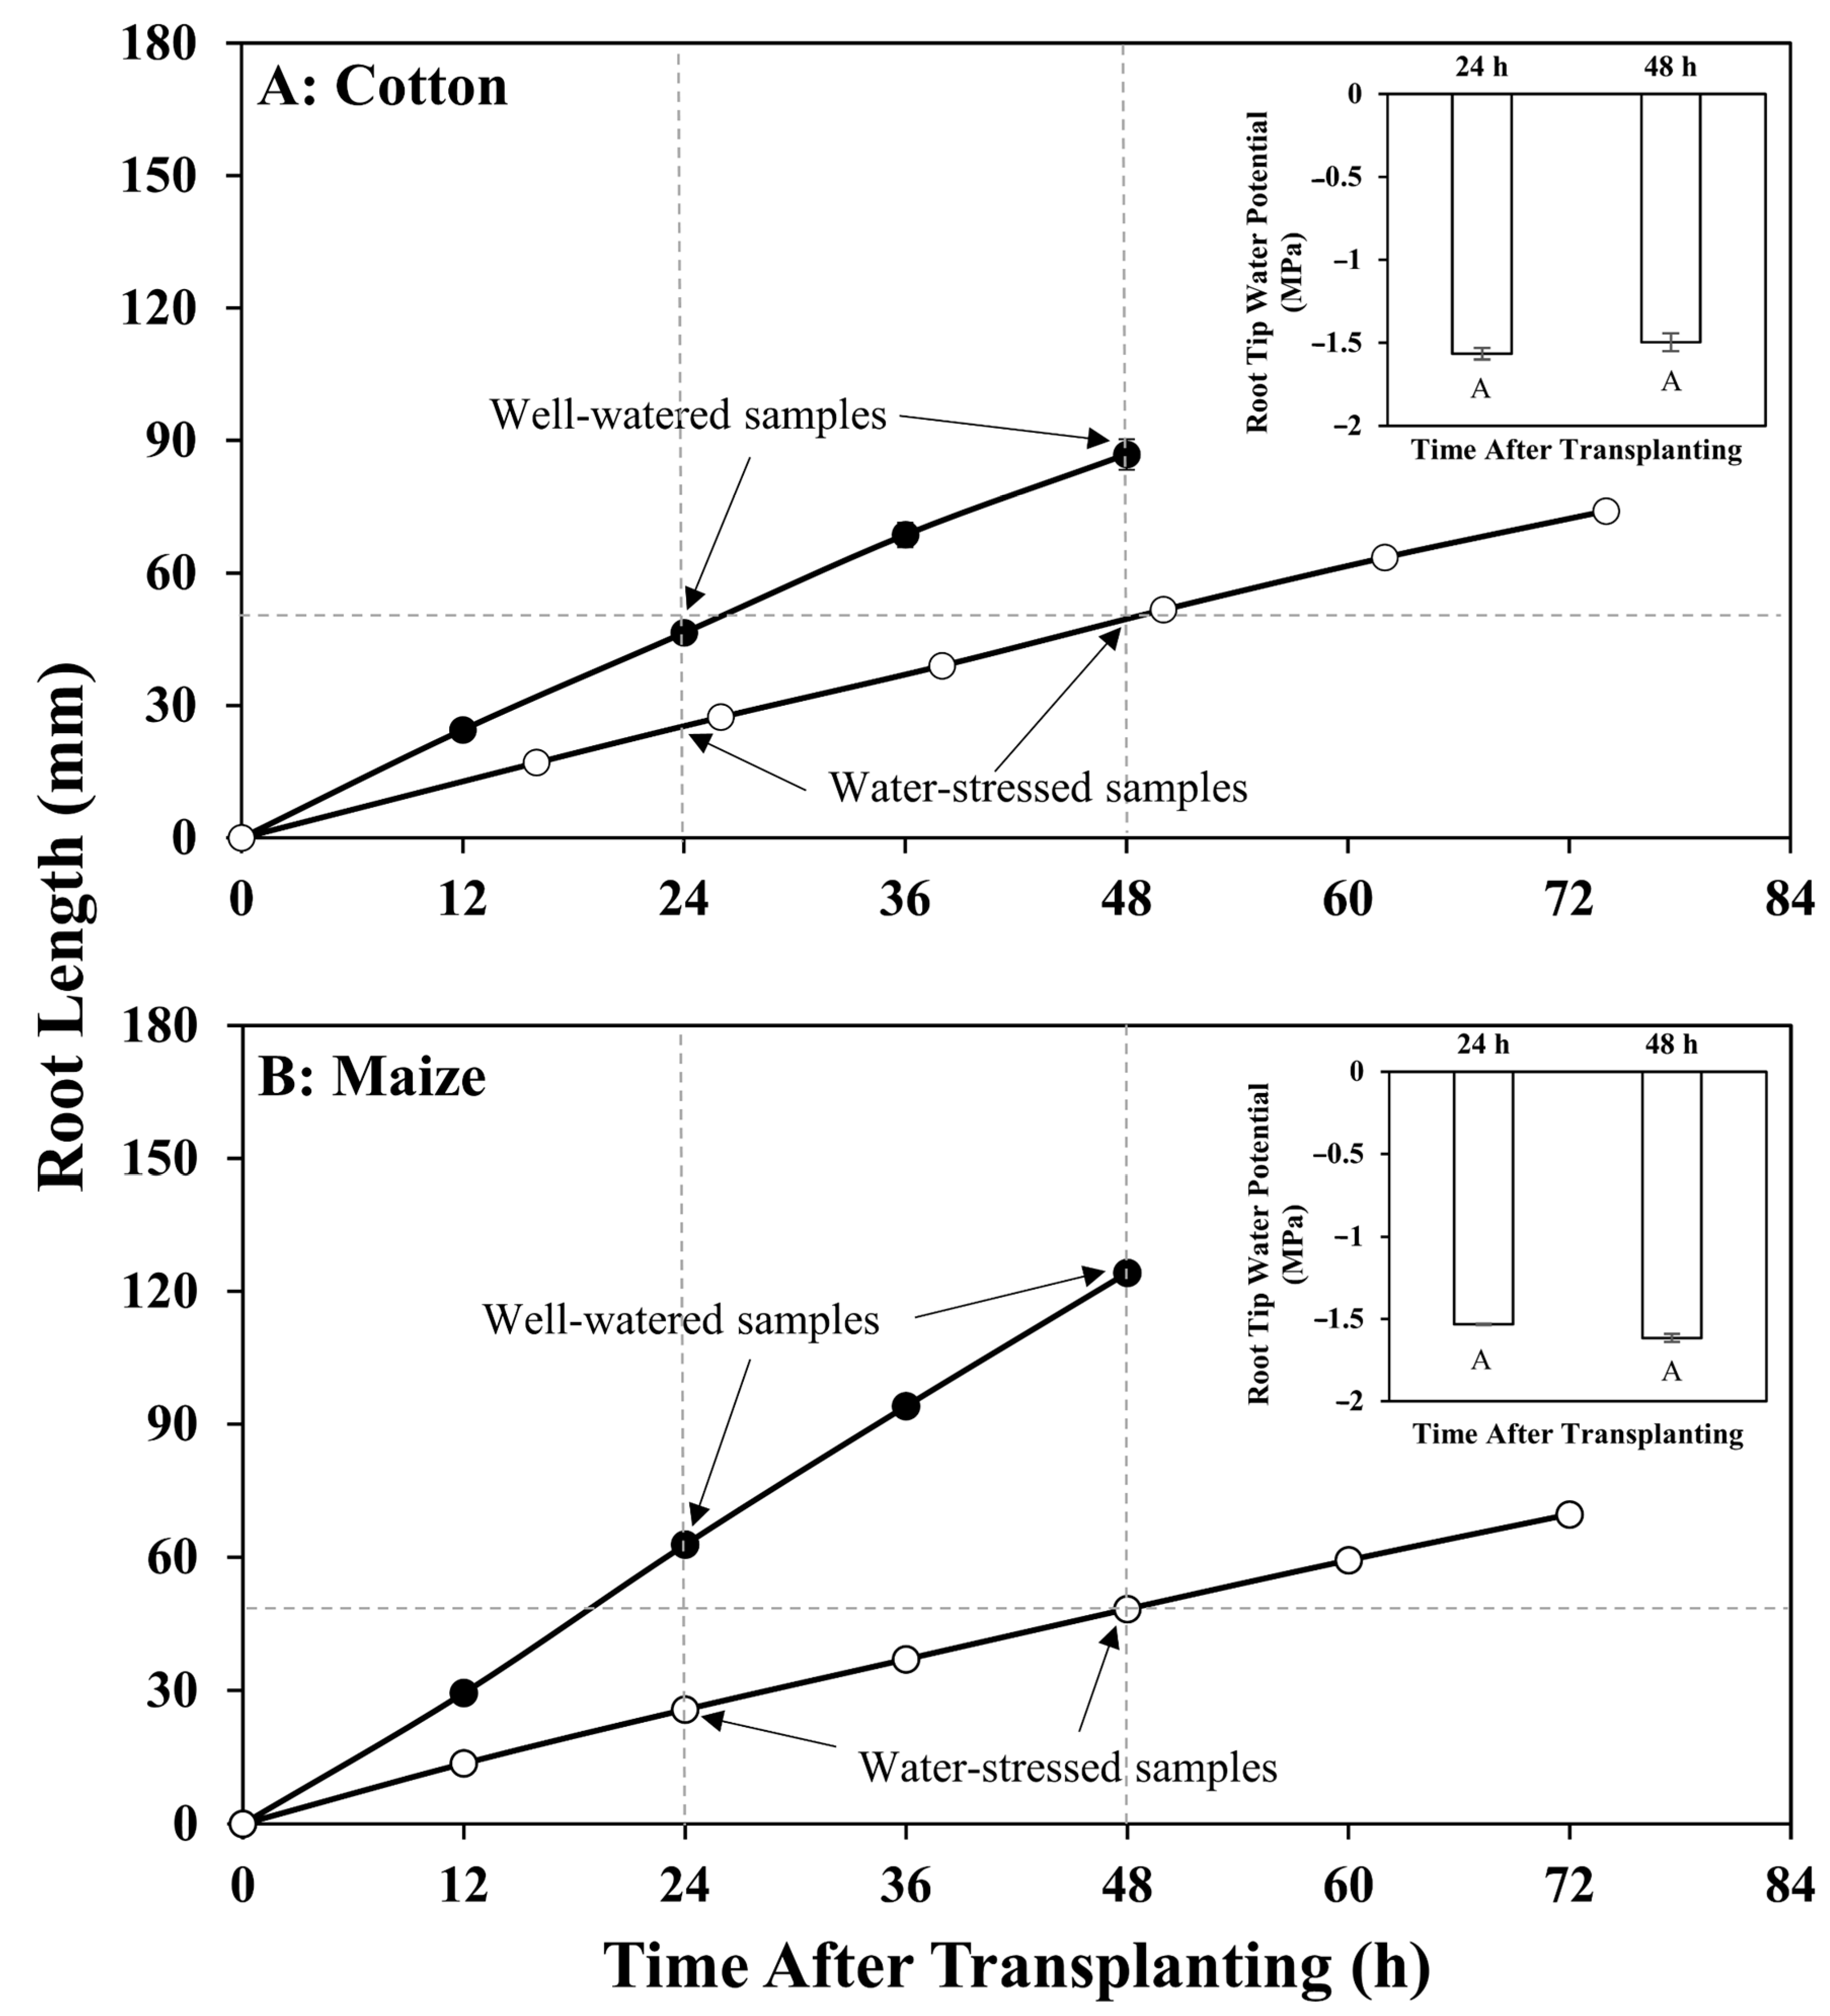
2.1. Plant Materials and Growth Conditions
2.2. RNA Extraction and Library Construction
2.3. RNA-seq and Differentially Accumulated Transcripts
2.4. GO Term and KEGG Pathway Analyses
2.5. Ortholog Analysis
2.6. Statistical Analysis
3. Results and Discussion
3.1. Overview of Differentially Accumulated Transcripts
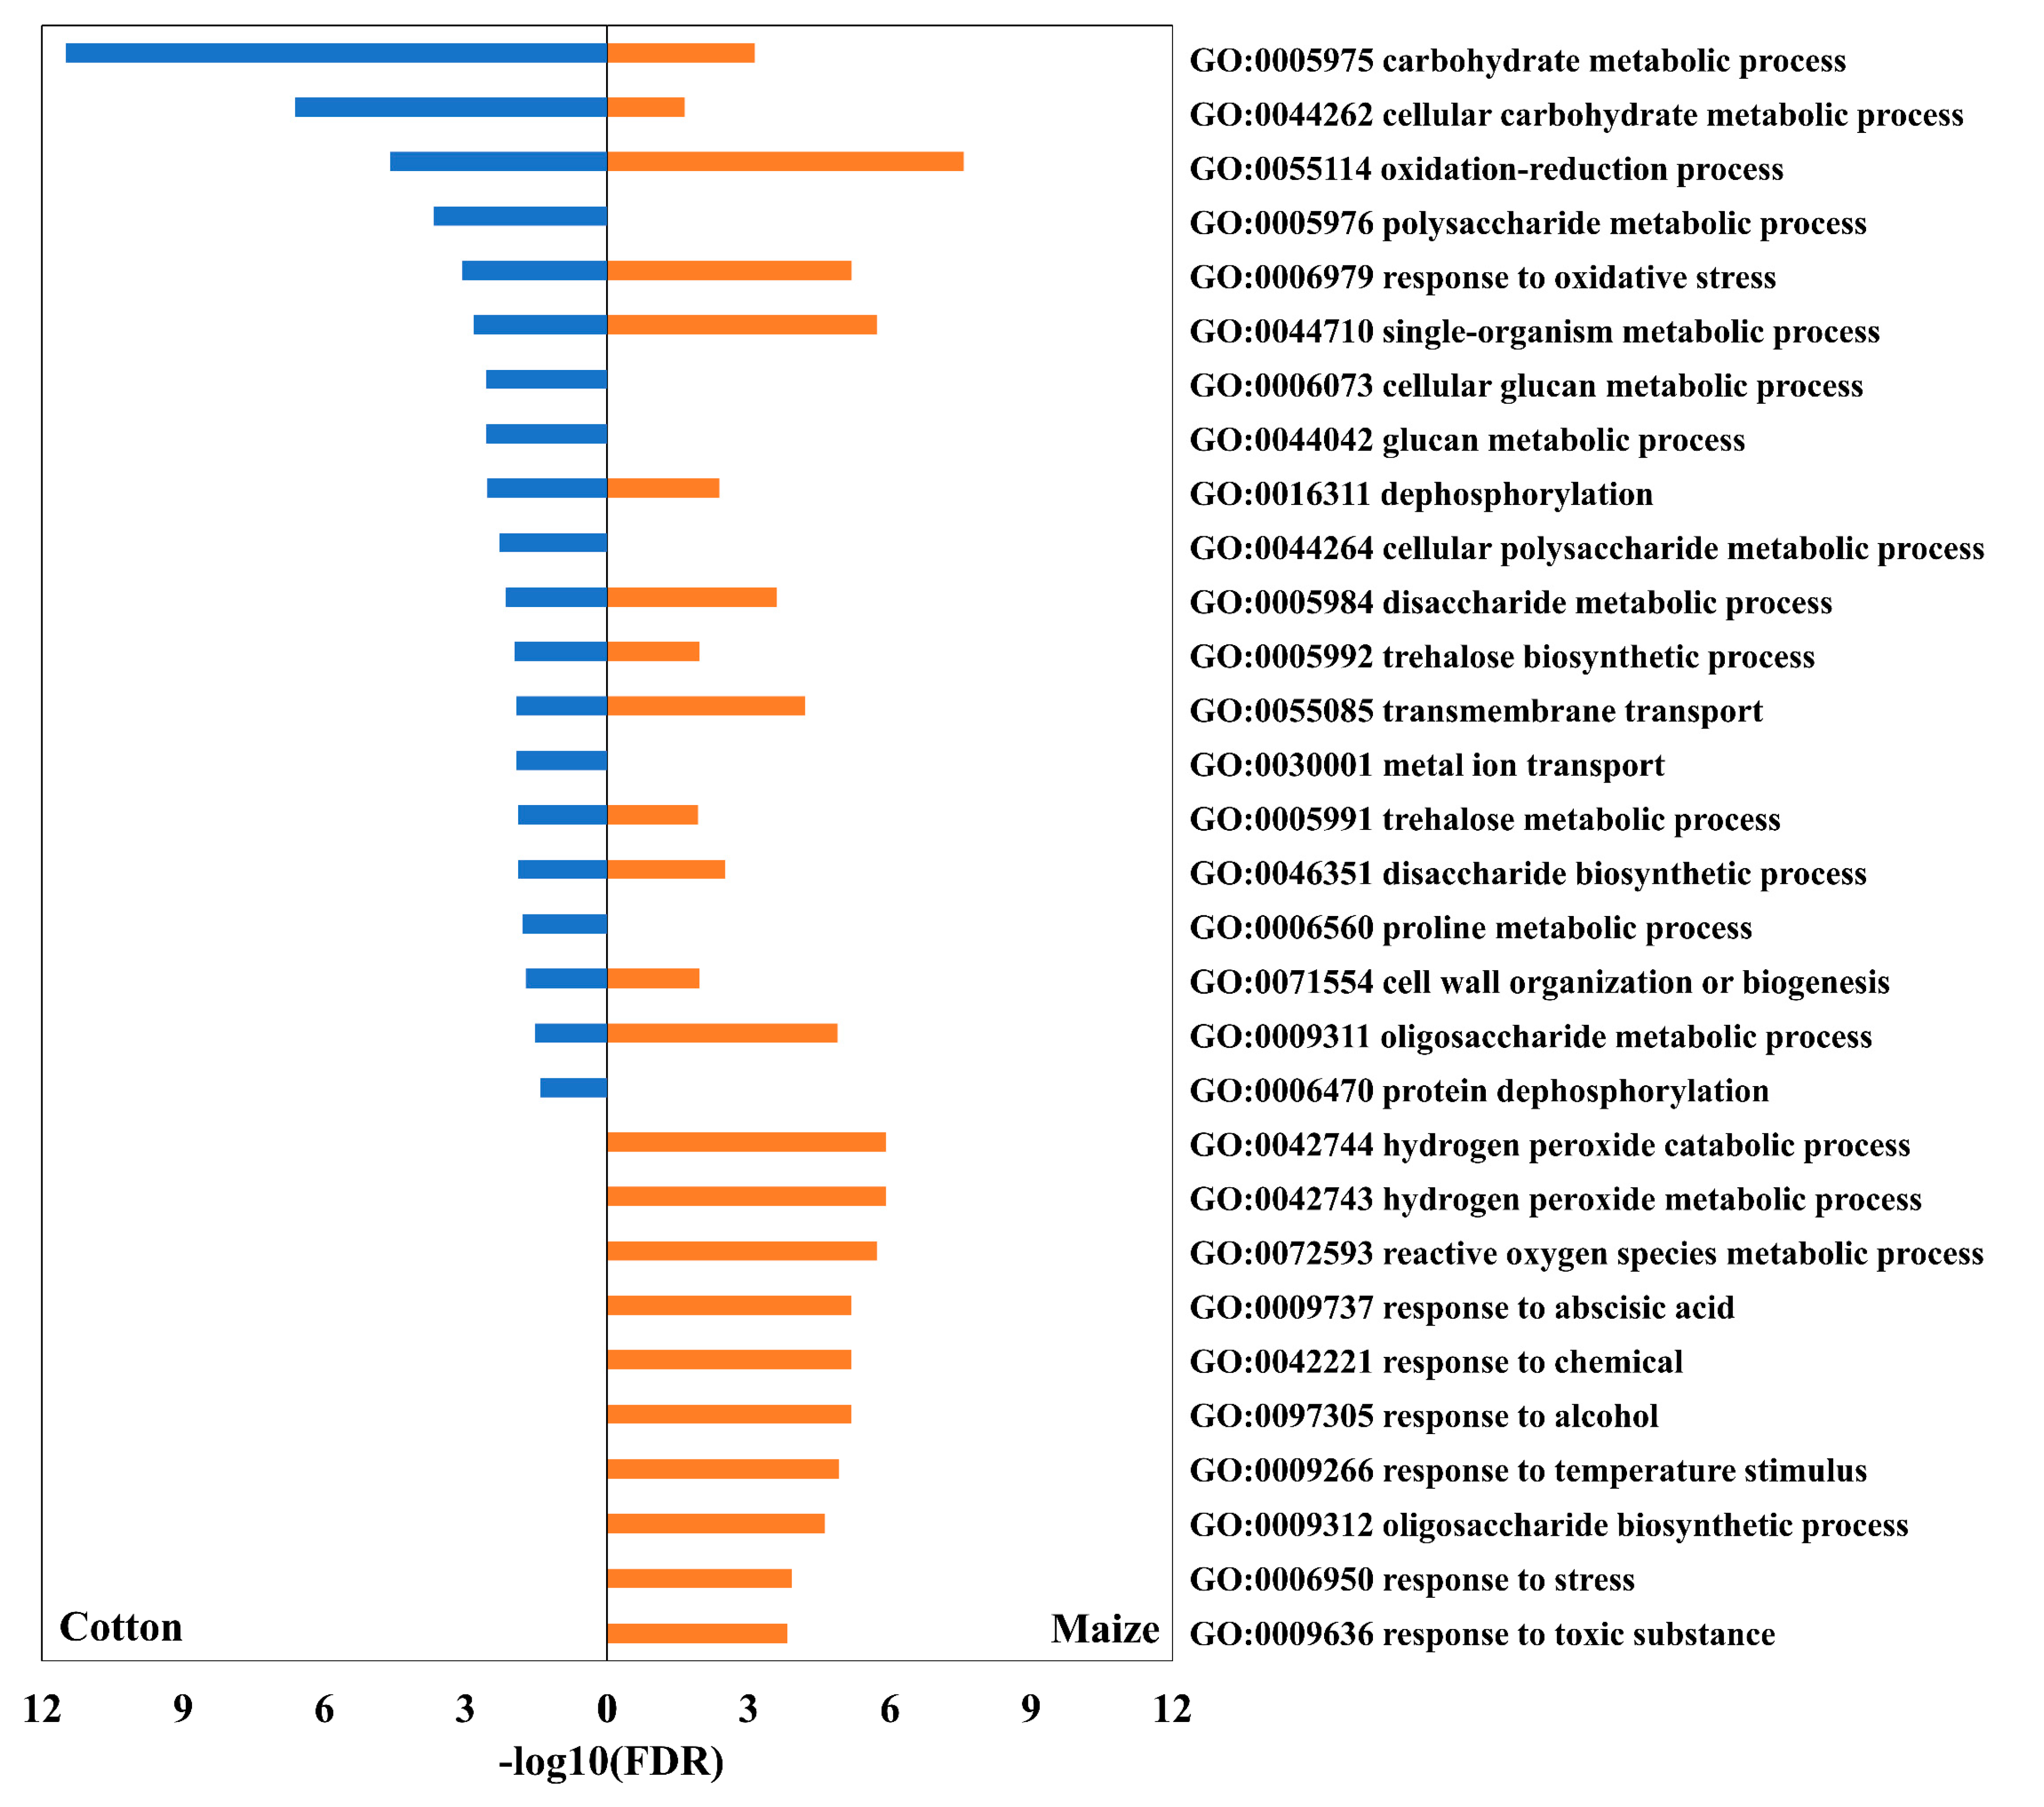
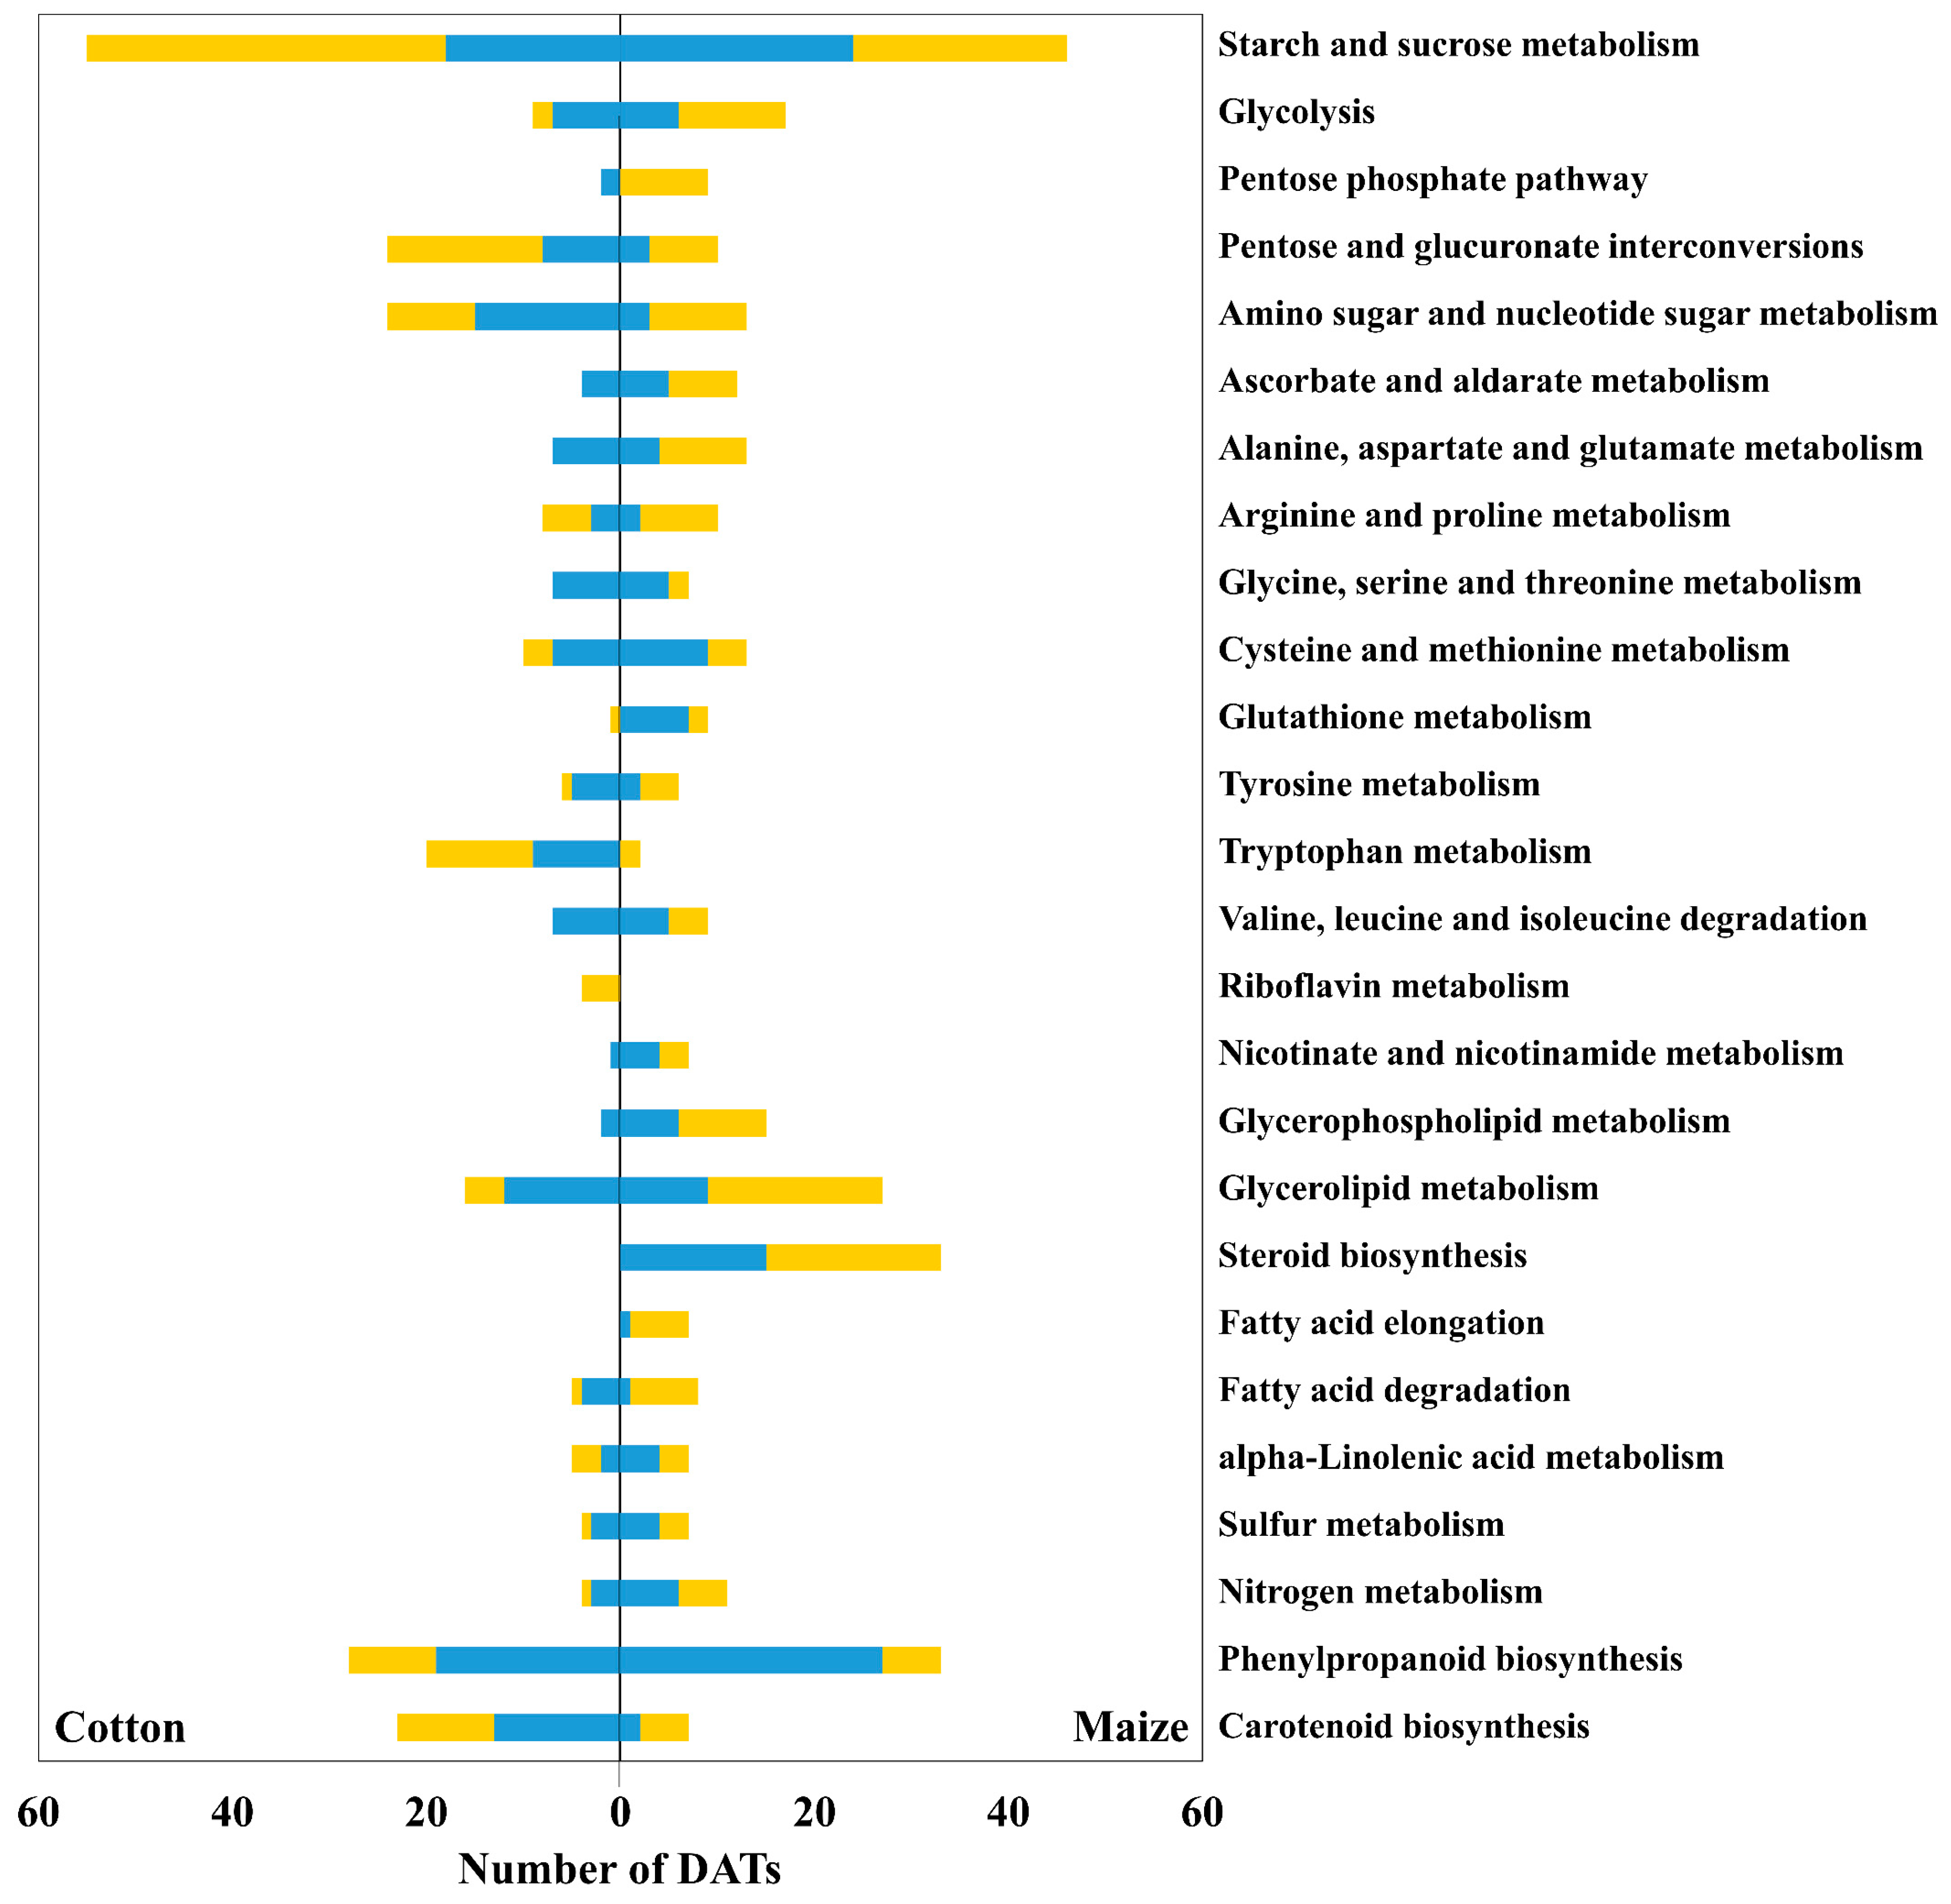
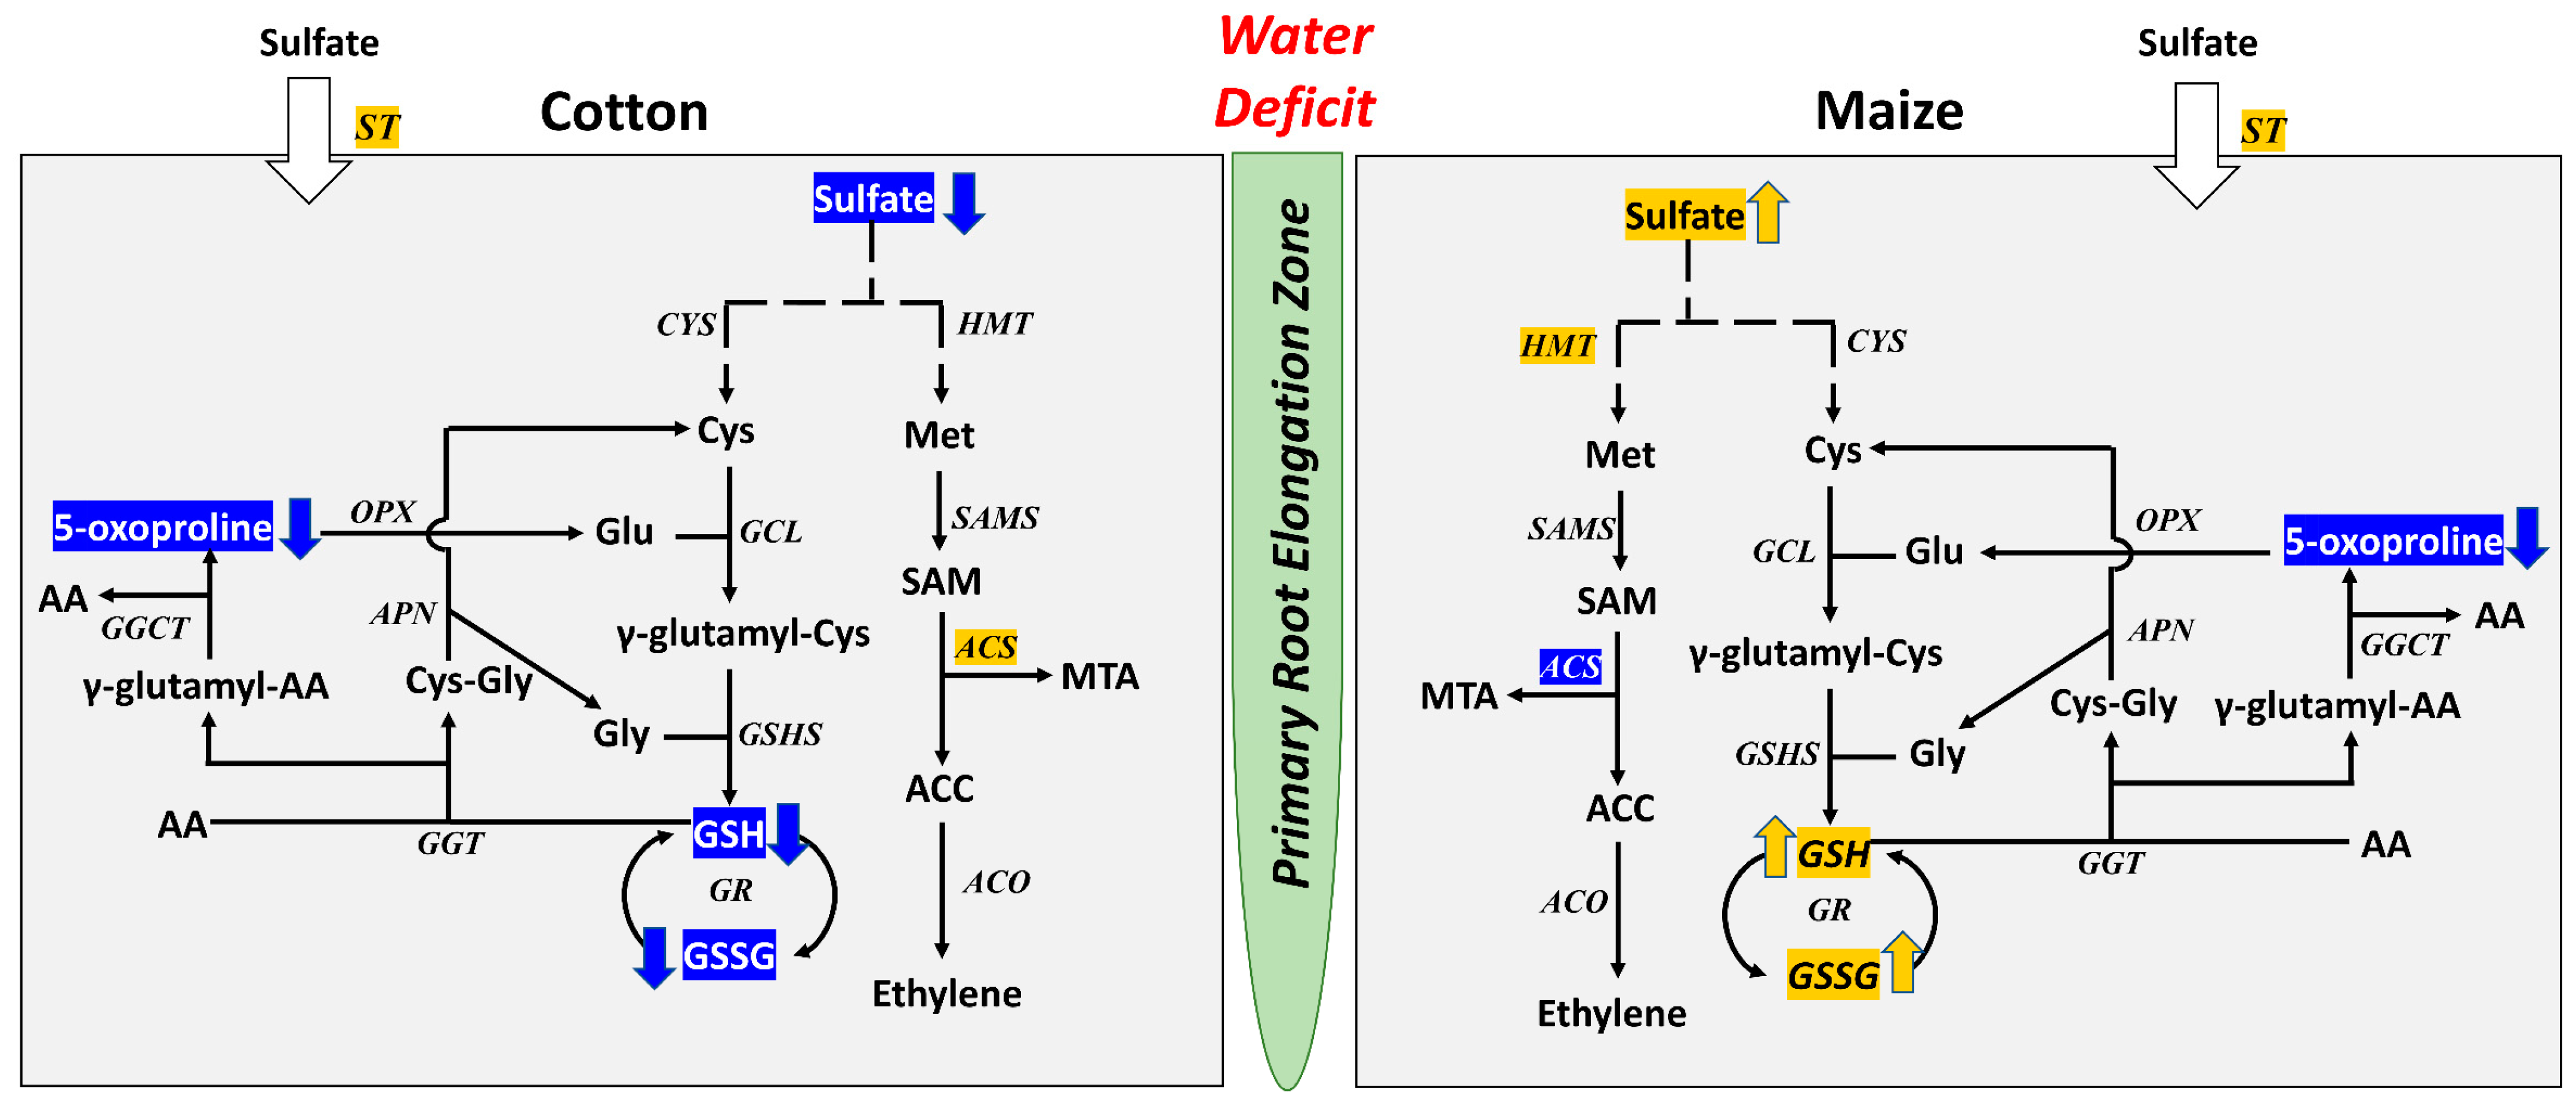
3.2. Antioxidative and Sulfur Metabolism
3.3. Ortholog Analysis
4. Conclusions
Supplementary Materials
Author Contributions
Funding
Institutional Review Board Statement
Informed Consent Statement
Data Availability Statement
Acknowledgments
Conflicts of Interest
References
- Boyer, J.S. Plant productivity and environment. Science 1982, 218, 443–448. [Google Scholar] [CrossRef]
- Tardieu, F.; Simonneau, T.; Muller, T. The physiological basis of drought tolerance in crop plants; a scenario-dependent probabilistic approach. Ann. Rev. Plant Biol. 2018, 69, 733–759. [Google Scholar] [CrossRef] [PubMed] [Green Version]
- Ober, E.S.; Sharp, R.E. Maintaining root growth in drying soil: A review of progress and gaps in understanding. In Plant Roots: The Hidden Half, 4th ed.; Eshel, A., Beekman, T., Eds.; CRC Press: New York, NY, USA, 2013; Chapter 35; pp. 1–11. [Google Scholar]
- Sharp, R.E.; Davies, W.J. Root growth and water uptake by maize plants in drying soil. J. Exp. Bot. 1985, 36, 1441–1456. [Google Scholar] [CrossRef]
- Sponchiado, B.N.; White, J.W.; Castillo, J.A.; Jones, P.G. Root growth of four common bean cultivars in relation to drought tolerance in environments with contrasting soil types. Exp. Agric. 1989, 25, 249–257. [Google Scholar] [CrossRef]
- Kirkegaard, J.A.; Lilley, J.M.; Howe, G.N.; Graham, J.M. Impact of subsoil water use on wheat yield. Aust. J. Agric. Res. 2007, 58, 303–315. [Google Scholar] [CrossRef]
- Sharp, R.E.; Silk, W.K.; Hsiao, T.C. Growth of the maize primary root at low water potentials. I. Spatial distribution of expansive growth. Plant Physiol. 1988, 87, 50–57. [Google Scholar] [CrossRef] [Green Version]
- van der Weele, C.M.; Spollen, W.G.; Sharp, R.E.; Baskin, T.I. Growth of Arabidopsis thaliana seedlings under water deficit by control of water potential in nutrient-agar media. J. Exp. Bot. 2000, 51, 1555–1562. [Google Scholar] [CrossRef] [PubMed] [Green Version]
- Yamaguchi, M.; Valliyodan, B.; Zhang, J.; LeNoble, M.E.; Yu, O.; Rogers, E.E.; Nguyen, H.T.; Sharp, R.E. Regulation of growth response to water stress in the soybean primary root. I. Proteomic analysis reveals region-specific regulation of phenylpropanoid metabolism and control of free iron in the elongation zone. Plant Cell Environ. 2010, 33, 223–243. [Google Scholar] [CrossRef]
- Yamaguchi, M.; Sharp, R.E. Complexity and coordination of root growth at low water potentials: Recent advances from transcriptomic and proteomic analyses. Plant Cell Environ. 2010, 33, 590–603. [Google Scholar] [CrossRef] [PubMed]
- Kang, J.; Voothuluru, P.; Hoyos-Miernyk, E.; Alexander, D.; Oliver, M.J.; Sharp, R.E. Antioxidant metabolism underlies different metabolic strategies for primary root growth maintenance under water stress in cotton and maize. Antioxidants 2022, 11, 820. [Google Scholar] [CrossRef] [PubMed]
- Leach, K.A.; Hejlek, L.G.; Hearne, L.B.; Nguyen, H.T.; Sharp, R.E.; Davis, G.L. Primary root elongation rate and abscisic acid levels of maize in response to water stress. Crop Sci. 2011, 51, 157–172. [Google Scholar] [CrossRef]
- Boyer, J.S.; Knipling, E.B. Isopiestic technique for measuring leaf water potentials with a thermocouple psychrometer. Proc. Natl. Acad. Sci. USA 1965, 54, 1044–1051. [Google Scholar] [PubMed] [Green Version]
- Saab, I.N.; Sharp, R.E.; Pritchard, J.; Voetberg, G.S. Increased endogenous abscisic acid maintains primary root growth and inhibits shoot growth of maize seedlings at low water potentials. Plant Physiol. 1990, 93, 1329–1336. [Google Scholar] [CrossRef] [Green Version]
- Pertea, M.; Kim, D.; Pertea, G.M.; Leek, J.T.; Salzberg, S.L. Transcript-level expression analysis of RNA-seq experiments with HISAT, StringTie and Ballgown. Nat. Protoc. 2016, 11, 1650. [Google Scholar] [CrossRef]
- Nelson, A.D.; Devisetty, U.K.; Palos, K.; Haug-Baltzell, A.K.; Lyons, E.; Beilstein, M.A. Evolinc: A tool for the identification and evolutionary comparison of long intergenic non-coding RNAs. Front. Genet. 2017, 8, 52. [Google Scholar] [CrossRef] [PubMed] [Green Version]
- Sen, S.; King, S.K.; McCubbin, T.; Greeley, L.A.; Mertz, R.A.; Becker, C.; Niehues, N.; Zeng, S.; Stemmle, J.A.; Peck, S.C.; et al. De novo transcriptome assembly from the nodal root growth zone of hydrated and water deficit-stressed maize inbred line FR697. Sci. Rep. 2023; submitted. [Google Scholar]
- Anders, S.; Pyl, P.T.; Huber, W. HTSeq—A Python framework to work with high-throughput sequencing data. Bioinformatics 2015, 31, 166–169. [Google Scholar] [CrossRef] [PubMed] [Green Version]
- Robinson, M.D.; McCarthy, D.J.; Smyth, G.K. edgeR: A Bioconductor package for differential expression analysis of digital gene expression data. Bioinformatics 2010, 26, 139–140. [Google Scholar] [CrossRef] [PubMed] [Green Version]
- Tian, T.; Liu, Y.; Yan, H.; You, Q.; Yi, X.; Du, Z.; Xu, W.; Su, Z. agriGO v2.0: A GO analysis toolkit for the agricultural community, 2017 update. Nucleic Acids Res. 2017, 45, W122–W129. [Google Scholar] [CrossRef] [Green Version]
- Kanehisa, M.; Furumichi, M.; Tanabe, M.; Sato, Y.; Morishima, K. KEGG: New perspectives on genomes, pathways, diseases and drugs. Nucleic Acids Res. 2017, 45, D353–D361. [Google Scholar] [CrossRef] [Green Version]
- Altenhoff, A.M.; Train, C.M.; Gilbert, K.J.; Mediratta, I.; Mendes de Farias, T.; Moi, D.; Nevers, Y.; Radoykova, H.S.; Rossier, V.; Vesztrocy, A.W.; et al. OMA orthology in 2021: Website overhaul, conserved isoforms, ancestral gene order and more. Nucleic Acids Res. 2021, 49, D373–D379. [Google Scholar] [CrossRef]
- Emms, D.M.; Kelly, S. OrthoFinder: Phylogenetic orthology inference for comparative genomics. Genome Biol. 2019, 20, 238. [Google Scholar] [CrossRef] [Green Version]
- Ackerson, R.C.; Krieg, D.R. Stomatal and nonstomatal regulation of water use in cotton, corn, and sorghum. Plant Physiol. 1977, 60, 850–853. [Google Scholar] [CrossRef] [Green Version]
- Rosenow, D.T.; Quisenberry, J.E.; Wendt, C.W.; Clark, L.E. Drought tolerant sorghum and cotton germplasm. Agric. Water Manag. 1983, 7, 207–222. [Google Scholar] [CrossRef]
- Zhu, J.-K. Abiotic stress signaling and responses in plants. Cell 2016, 167, 313–324. [Google Scholar] [CrossRef] [Green Version]
- Delauney, A.J.; Verma, D.P.S. Proline biosynthesis and osmoregulation in plants. Plant J. 1993, 4, 215–223. [Google Scholar] [CrossRef]
- Sharp, R.E.; Davies, W.J. Solute regulation and growth by roots and shoots of water-stressed maize plants. Planta 1979, 147, 43–49. [Google Scholar] [CrossRef] [PubMed]
- Westgate, M.E.; Boyer, J.S. Osmotic adjustment and the inhibition of leaf, root, stem and silk growth at low water potentials in maize. Planta 1985, 164, 540–549. [Google Scholar] [CrossRef]
- Sharp, R.E.; Hsiao, T.C.; Silk, W.K. Growth of the maize primary root at low water potentials. II. Role of growth and deposition of hexose and potassium in osmotic adjustment. Plant Physiol. 1990, 93, 1337–1346. [Google Scholar] [CrossRef]
- Gechev, T.; Petrov, V. Reactive oxygen species and abiotic stress in plants. Int. J. Mol. Sci. 2020, 21, 7433. [Google Scholar]
- Fujiyama, K.; Hino, T.; Nagano, S. Diverse reactions catalyzed by cytochrome P450 and biosynthesis of steroid hormone. Biophys. Physicobiol. 2022, 19, e190021. [Google Scholar] [CrossRef]
- von Wettstein-Knowles, P. Elongase and epicuticular wax biosynthesis. Physiol. Veg. 1982, 20, 797–809. [Google Scholar]
- Beaudoin, F.; Wu, X.; Li, F.; Haslam, R.P.; Markham, J.E.; Zheng, H.; Napier, J.A.; Kunst, L. Functional characterization of the Arabidopsis β-ketoacyl-coenzyme A reductase candidates of the fatty acid elongase. Plant Physiol. 2009, 150, 1174–1191. [Google Scholar] [CrossRef] [Green Version]
- Grünhofer, P.; Schreiber, L.; Kreszies, T. Suberin in monocotyledonous crop plants: Structure and function in response to abiotic stresses. In Rhizobiology: Molecular Physiology of Plant Roots. Signaling and Communication in Plants; Mukherjee, S., Baluška, F., Eds.; Springer: Cham, Switzerland, 2021; pp. 333–378. [Google Scholar]
- Yoshida, T.; Christmann, A.; Yamaguchi-Shinozaki, K.; Grill, E.; Fernie, A.R. Revisiting the basal role of ABA—Roles outside of stress. Trends Plant Sci. 2019, 24, 625–635. [Google Scholar] [CrossRef] [PubMed]
- Wang, L.; Liu, D. Functions and regulation of phosphate starvation-induced secreted acid phosphatases in higher plants. Plant Sci. 2018, 271, 108–116. [Google Scholar] [CrossRef] [PubMed]
- Singh, V.; Pallaghy, C.K.; Singh, D. Phosphorus nutrition and tolerance of cotton to water stress: I. Seed cotton yield and leaf morphology. Field Crops Res. 2006, 96, 191–198. [Google Scholar] [CrossRef]
- Jun, W.; Ping, L.; Zhiyong, L.; Zhansheng, W.; Yongshen, L.; Xinyuan, G. Dry matter accumulation and phosphorus efficiency response of cotton cultivars to phosphorus and drought. J. Plant Nutr. 2017, 40, 2349–2357. [Google Scholar] [CrossRef]
- Estévez, I.H.; Hernández, M.R. Plant glutathione S-transferases: An overview. Plant Gene 2020, 23, 100233. [Google Scholar] [CrossRef]
- Swamy, P.M.; Smith, B.N. Role of abscisic acid in plant stress tolerance. Curr. Sci. 1999, 76, 1220–1227. [Google Scholar]
- Sun, Y.; Pri-Tal, O.; Michaeli, D.; Mosquna, A. Evolution of abscisic acid signaling module and its perception. Front. Plant Sci. 2020, 11, 934. [Google Scholar]
- McAdam, S.; Sussmilch, F.C. The evolving role of abscisic acid in cell function and plant development over geological time. Semin. Cell Dev. Biol. 2021, 109, 39–45. [Google Scholar] [CrossRef]
- Dong, T.; Park, Y.; Hwang, I. Abscisic acid: Biosynthesis, inactivation, homoeostasis and signalling. Essays Biochem. 2015, 58, 29–48. [Google Scholar]
- Kang, J. Cotton and Maize Primary Root Growth Responses to Water Deficit: Comparative Physiological and Metabolic Analysis. Ph.D. Thesis, University of Missouri, Columbia, MO, USA, July 2019. [Google Scholar]
- Jung, C.; Nguyen, N.H.; Cheong, J.J. Transcriptional regulation of protein phosphatase 2C genes to modulate abscisic acid signaling. Int. J. Mol. Sci. 2020, 21, 9517. [Google Scholar] [CrossRef] [PubMed]
- Fuchs, S.; Grill, E.; Meskiene, I.; Schweighofer, A. Type 2C protein phosphatases in plants. FEBS J. 2013, 280, 681–693. [Google Scholar] [CrossRef]
- Saab, I.N.; Sharp, R.E.; Pritchard, J. Effect of inhibition of abscisic acid accumulation on the spatial distribution of elongation in the primary root and mesocotyl of maize at low water potentials. Plant Physiol. 1992, 99, 26–33. [Google Scholar] [CrossRef]
- Sharp, R.E.; Wu, Y.; Voetberg, G.S.; Saab, I.N.; LeNoble, M.E. Confirmation that abscisic acid accumulation is required for maize primary root elongation at low water potentials. J. Exp. Bot. 1994, 45, 1743–1751. [Google Scholar] [CrossRef]
- Li, X.; Chen, L.; Forde, B.G.; Davies, W.J. The biphasic root growth response to abscisic acid in Arabidopsis involves interaction with ethylene and auxin signalling pathways. Front. Plant Sci. 2017, 8, 1493. [Google Scholar] [CrossRef] [PubMed] [Green Version]
- Stein, O.; Granot, D. An overview of sucrose synthases in plants. Front. Plant Sci. 2019, 10, 95. [Google Scholar] [CrossRef] [Green Version]


Disclaimer/Publisher’s Note: The statements, opinions and data contained in all publications are solely those of the individual author(s) and contributor(s) and not of MDPI and/or the editor(s). MDPI and/or the editor(s) disclaim responsibility for any injury to people or property resulting from any ideas, methods, instructions or products referred to in the content. |
© 2023 by the authors. Licensee MDPI, Basel, Switzerland. This article is an open access article distributed under the terms and conditions of the Creative Commons Attribution (CC BY) license (https://creativecommons.org/licenses/by/4.0/).
Share and Cite
Kang, J.; Sen, S.; Oliver, M.J.; Sharp, R.E. Comparative Transcriptomics Reveal Metabolic Rather than Genetic Control of Divergent Antioxidant Metabolism in the Primary Root Elongation Zone of Water-Stressed Cotton and Maize. Antioxidants 2023, 12, 287. https://doi.org/10.3390/antiox12020287
Kang J, Sen S, Oliver MJ, Sharp RE. Comparative Transcriptomics Reveal Metabolic Rather than Genetic Control of Divergent Antioxidant Metabolism in the Primary Root Elongation Zone of Water-Stressed Cotton and Maize. Antioxidants. 2023; 12(2):287. https://doi.org/10.3390/antiox12020287
Chicago/Turabian StyleKang, Jian, Sidharth Sen, Melvin J. Oliver, and Robert E. Sharp. 2023. "Comparative Transcriptomics Reveal Metabolic Rather than Genetic Control of Divergent Antioxidant Metabolism in the Primary Root Elongation Zone of Water-Stressed Cotton and Maize" Antioxidants 12, no. 2: 287. https://doi.org/10.3390/antiox12020287