1. Introduction
Genetic selection for hyperprolific sows suffers from highly stressful conditions including increased milk production, limited nutrient intake, and increased oxidative stress [
1]. Studies have shown that reactive oxygen species (ROS) are increased in late pregnancy and lactation, and maternal oxidative stress may transmit to offspring [
2,
3]. Early-weaning piglets are met with continuing external stressors, including changing dietary habits, gut microbiota, and environmental factors, leading to intestinal oxidative injury and dysfunction [
4]. Intestinal oxidative injury commonly results in a low feeding efficiency and growth performance in piglets [
5]. Thus, the oxidative stress during the neonatal and weaning phases may continuously lead to a long-term negative effect on the growth performance, which can persist until adulthood [
6]. Previous studies have indicated that antioxidant protection and immune agents, achieved via nutrients, might be transferred from the mother to the newborn during pregnancy or via the maternal colostrum and milk supply [
7,
8]. Our previous studies have shown that maternal feed additives could affect the offspring’s intestinal function through regulation of signal pathways [
9]. Therefore, the redox status homeostasis of sows during late gestation and lactation would be of great significance for their reproductive performance and for offspring gut development.
Selenium (Se) is an indispensable trace element to sows and exists in nature in both inorganic and organic forms [
10]. Se is a metalloid that is incorporated into polypeptide chains as part of the selenocysteine to fulfil a biofunction. The proteins that contain selenocysteine in their poly-peptide chain are identified as selenoproteins [
11]. The major selenoprotein glutathione peroxidase (GSH-Px) enzyme is well known due to its role in the detoxification of hydrogen peroxide and lipid hydroperoxides inside the cellular membrane against ROS damage [
12]. The Se content in a sow’s blood continues to decrease as the pregnancy and lactation progresses [
13]. A Se deficiency during gestation leads to miscarriage, pre-eclampsia, preterm birth, and intrauterine growth retardation [
11]. Compared with inorganic forms of Se, selenium-enriched yeast (SeY) mainly consists of selenoamino acids (i.e., selenomethionine) and their analogues [
14]. As the organic form of Se, SeY is primarily used on account of the more efficient deposition in maternal tissues and transfer to offspring [
15,
16,
17]. Hence, it is crucial to supplement SeY during late gestation and lactation in sow diets for the redox status of sow and progeny.
Previous studies showed that when Se was supplied in an organic instead of inorganic form in a sow diet during gestation and lactation, it could improve the reproductive performance and the Se and redox status in the serum, milk, and offspring [
13,
18,
19]. However, other studies have reported that different dietary Se sources or levels when fed during gestation and lactation had no effect on the reproductive performance, including lactation feed intakes, parturition performance, and litter performances of sows [
15,
16,
20]. Our previous study also reported that increasing the SeY supply during late gestation did not affect the reproductive performance of sows [
21]. The studies that refer to the effect of SeY supplementation during late gestation and lactation on the reproductive performance of sows are inconsistent [
22]. Moreover, the effect of maternal SeY supplementation during late gestation and lactation on the sow’s reproductive performance, transfer of selenium and redox status, and gut microbiota community, as well as on the intestinal health of the offspring, has not been extensively studied. Therefore, we investigated the effect of maternal SeY supplementation during late pregnancy and lactation on the sow performance, transfer of redox status, and the intestinal expression of the nuclear factor erythroid2-related factor (Nrf2) and Kelch-like ECH-associated protein 1 (Keap1) pathway in the offspring. We hypothesized that maternal SeY supplementation during late gestation and lactation could improve the lactation performance, antioxidant capacities in sows and their offspring, and gut health through the Nrf2/Keap1 signal pathway. The current study was conducted to verify this hypothesis.
4. Discussion
Maternal nutrition is a predominant factor in regulating the redox status, immunity, and gut health of offspring piglets [
24]. Thus, this study evaluated the effect of maternal SeY supplementation during late gestation and lactation on sow performance, transfer of Se and antioxidant capacity, and gut microbiota community, as well as on the intestinal health of offspring. Consistent with our experimental hypothesis, the findings in the present study indicated that maternal SeY supplementation during late gestation and lactation improved the lactation performance, redox status, and Se level transfer, and that it altered the gut microbiota in sows. In addition, maternal SeY supplementation enhanced the small intestinal barrier function and microbiota community of the weaned offspring. The results of this study will offer a reference for the function of SeY in sows’ diet and maternal–offspring integration.
As previously mentioned, when supplemented with inorganic selenite (0 to 0.3 ppm), dietary Se ranged from 0.227 to 0.651 ppm [
25]. In our study, Se from basal ingredients alone provided 0.34 ppm for gestation diets and 0.37 ppm for lactation diets. These Se concentrations are greater than the NRC (2012) recommendation of 0.15 ppm, and the supplemental level frequently used in the feed industry is 0.30 ppm. In addition, many studies have indicated that maternal Se can transfer to the progeny through the placenta and milk [
16,
26,
27]. Also, Mahan et al. [
15] reported that the offspring of sows that were fed organic Se had a higher Se status both at birth and during weaning than those of sows that were fed inorganic Se. This was confirmed in the current study, where the maternal SeY intake increased the levels in the sows’ plasma and milk as well as those of the offsprings’ plasma. Consistent with a previous study, our results revealed that SeY was delivered from sow to piglet through the colostrum and milk.
Many previous studies have reported that a dietary Se source fed during late gestation and lactation had no effect on the reproductive performance of sows, including the number of pigs per litter, piglet birth weight, or litter gain from birth to weaning [
15,
16]. Our previous study also reported that increasing the Se supply during late gestation did not affect the reproductive performance of sows [
21]. In agreement with the above, the current study indicated that a short-term increase in maternal SeY supply during late gestation did not affect the reproductive performance of sows. Nevertheless, maternal SeY supplementation during late gestation and lactation significantly increased the final average weight during the first week and the mean ADG of offspring piglets during the first week of lactation. Another study also reported that organic Se improved the ADG of suckling piglets at the first week of lactation [
13]. Interestingly, we first found that the weaning-to-estrus interval was significantly shortened by SeY supplementation in sow diets. In general, 90–95% of the multiparity sows are predicted to exhibit estrus within a week after weaning. Moreover, the reduced estrus is identified as sufficient nutrient intake and body reserves [
28]. Thus, SeY supplementation during late gestation and lactation might promote nutrient absorption in sows, and further nutrient digestibility experiments are needed to verify this finding. Our study indicates that short-term, it did not promote intrauterine fetal growth; however, continuous supplement during lactation increased the lactating performance of sows, including the average weight and mean ADG of piglets during the first week.
ROS overproduction during parturition and lactation may lead to oxidative stress in both the maternal pig and offspring [
29]. Moreover, piglets suffer from serious oxidative stress during the newborn and weaned stages [
30]. To explore the effect of maternal SeY supplementation on the antioxidant capacity transfer in parturition and lactation, we analyzed the redox status in the plasma of sows and offsprings as well as in milk. Many previous studies have jointly reported that maternal dietary organic Se supplementation during late or entire gestation could both enhance the antioxidant capacities of sows and transfer this to their offspring [
13,
31,
32]. Similar to previous studies, our results showed that maternal SeY supplementation increased the levels of T-AOC, T-SOD, and GSH-Px, while it reduced the MDA content in the plasma and milk of sows and the plasma of their offspring. Our results verified that the maternal enhanced redox status brought about by SeY can transfer to the progeny through milk. In addition, the maternal enhanced redox status transfer was parallel with the increased Se content transfer from sows to offspring.
A previous study suggested that the immune system depends on a sufficient Se status to combat pathogens, viral invasions, and oxidative stress [
33]. It has been reported that inorganic Se supplementation in a sow diet obviously increased the blood IgA, IgG, and IgM concentrations of sows and their offspring [
34]. Li et al. [
35] reported that organic Se addition increased the IgA and IgG in the serum of gilts. In the current study, maternal SeY supplementation during late gestation and lactation also increased the concentrations of IgA in the sow and offspring plasma and the IgG in sow milk. Similarly, other reports have found that increasing the Se intake in sows and cows during late gestation improved the immunoglobulin transfer through maternal–offspring transmission [
36,
37]. Our previous study also showed that increasing the organic Se supply in sows’ diet led to higher levels of plasma IgA in sows and offspring, plasma IgG in offspring, and IgA as well as IgM in milk [
21]. These above results reflect that Se could enhance the passive transfer of antibodies through maternal–offspring transmission.
Furthermore, due to the antioxidant activity of selenoproteins, SeY has long been deemed to improve the intestinal barrier function through alleviating oxidative stress [
38]. Proper epithelial cells are held together by the apical junctional complex, which includes transmembrane TJ proteins (claudins and occludin) and the cytosolic scaffold proteins (ZO-1) [
39]. In addition, the epithelial monolayer is connected with another adheren junction, the E-cadherin-dependent barrier in the small intestine [
40]. The mucus layer, an enormous polymeric network of mucins, is the first line of defense preventing the invasion of potential pathogens, and it maintains homeostasis in the small intestine [
38]. Immunofluorescence analysis of MUC1 showed that maternal SeY supplementation increased the MUC1 secretion in the small intestine but did not affect the distribution in the intestinal epithelium of offspring piglets. In addition, the Western blot results showed that maternal SeY supplementation during late gestation and lactation also up-regulated the relative protein abundances of E-cadherin, ZO-1, occludin, and claudin-1 in the small intestine of weaned offspring piglets, suggesting that SeY can promote the development of intestinal barrier function in offspring piglets through mother–child interactions. Consistent with our results, Liu et al. [
14] reported that adding SeY effectively improved the distribution and abundance of tight-junction protein in the jejunum. The study suggested that increased SeY addition improved intestinal barrier functions through suppressing epithelial cell apoptosis that is induced by oxidative stress [
14]. Our results indicated that maternal SeY supplementation during late gestation and lactation improved the small intestinal chemical barrier and mechanical integrity of the offspring piglets.
It can be seen from previous studies that oxidative stress damages the intestinal barrier functions of the intestinal epithelial cells. Thus, whether the improved TJ protein abundance is related with the increased antioxidant capacity caused by maternal SeY supplementation was further explored. Nrf2 appears to contribute to redox homeostasis in intestinal epithelial cells [
41]. Therefore, the Nrf2/Keap1 oxidative pathway was selected in order to detect the above changes in the small intestinal TJ proteins in offspring piglets. Nrf2 is a primary antioxidant transcription factor and participates in regulating the synthesis of antioxidant enzymes (MnSOD and GSH-Px) [
42]. Under physiological conditions, Nrf2 is inhibited by Keap1 in the cytoplasm [
43]. To combat oxidative stress, the Keap1/Nrf2 dissociation prompts the phosphorylation of Nrf2 to translocate into the nucleus and activate the transcription of an antioxidant gene [
44]. Scientific evidence has proven that Nrf2-deficiency-induced oxidative stress and inflammation may indirectly impair the intestinal barrier function [
45,
46]. It has also been reported that SeY alleviated oxidative-stress-induced small intestinal mucosa disruption through elevating the Nrf2 expression in weaned pigs [
14]. Another study found that the SeY supplementation protected chickens against the ochratoxin A-induced oxidative stress through activating in the Nrf2/Keap1 pathway [
47]. The cell-cultured experiment also showed that selenomethionine alleviated oxidative stress that was induced by zearalenone via the Nrf2/Keap1 signaling pathway in IPEC-J2 cells [
48]. Based on our results, maternal SeY supplementation during late gestation and lactation significantly up-regulated the phosphorylated Nrf2 and down-regulated the Keap1 protein abundances in the small intestine of weaning offspring. The activation of the Nrf2/Keap1 pathway thereby improved the redox status in offspring, which is confirmed by the results of the serum antioxidant capacity indicators.
Nutritional components are also key factors affecting the structure and abundance of the gut community structure [
49]. To investigate the effects of SeY supplementation during late gestation and lactation on fecal microbiota proliferation in sows on day 1 and 21 of lactation, the microbiota compositions were analyzed using high-throughput 16S rRNA sequencing. Microbial diversity is considered to improve the stability of microbiota communities [
50]. In the present study, the PCA and PLS-DA results of the beta-diversity analysis showed that the microbial community structure between the CON and SeY groups presented significant separations, suggesting that maternal SeY supplementation altered the sows’ fecal microbial community when measured on day 1 and 21 of lactation. The intestine is the harbor of numerous microbial species, belonging predominantly to the phylum Firmicutes or Bacteroidetes [
51]. The present study also showed that Firmicutes and Bacteroidetes were the top two dominant phyla between the two groups. To identify the effect of dietary SeY supplement on the fecal differential bacteria in the sows on day 1 and 21 of lactation, the abundance difference and LEfSe analysis were united to analyze the differential bacterium. At the genus level, the STAMP results and LEfSe analysis together showed that dietary SeY addition increased the relative abundances of Lachnospiraceae, Prevotellaceae_UCG-001, Lachnospiraceae_NK4A136_group, and
Oscillospirales on day 1 of lactation.
Unclassified_f_Lachnospiraceae had been illustrated to be instrumental in producing butyrate and were associated with the inhibition of intestinal disorders [
52]. In addition, to our knowledge,
Lachnospiraceae_NK4A136_group may improve the intestinal barrier function of rats, comprises one of the main butyrate-producing bacteria, and has potentially beneficial effects on antioxidation [
53,
54].
Prevotellaceae_UCG-001 belongs to the Prevotellaceae family, which has been proposed to digest amino acids and enhance calorie extraction from resistant starches, oligosaccharides, and other indigested carbohydrates [
55]. In short,
unclassified_f_Lachnospiraceae,
Prevotellaceae _UCG-001, and
Lachnospiraceae_NK4A136_group were all known as SCFAs producing bacteria through indigestible carbohydrates metabolization [
56]. Thus, the increased SCFAs-producing bacterium might accelerate the SCFAs synthesis further to promote gut homeostasis of sows in the SeY group. Specifically, SCFAs-activated G-protein coupled receptor (GPCR) signaling has been reported to have essential roles in the colonic barrier function and anti-inflammatory and antioxidative effects in the intestine [
57].


 and
and 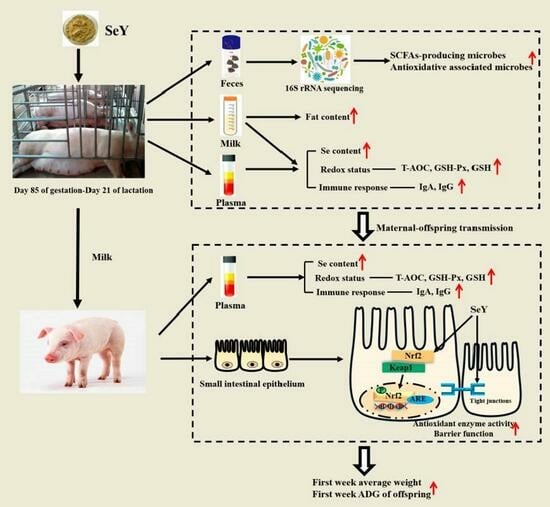


