
Intravitreal Injection of ZYAN1 Restored Autophagy and Alleviated Oxidative Stress in Degenerating Retina via the HIF-1α/BNIP3 Pathway
 and
and 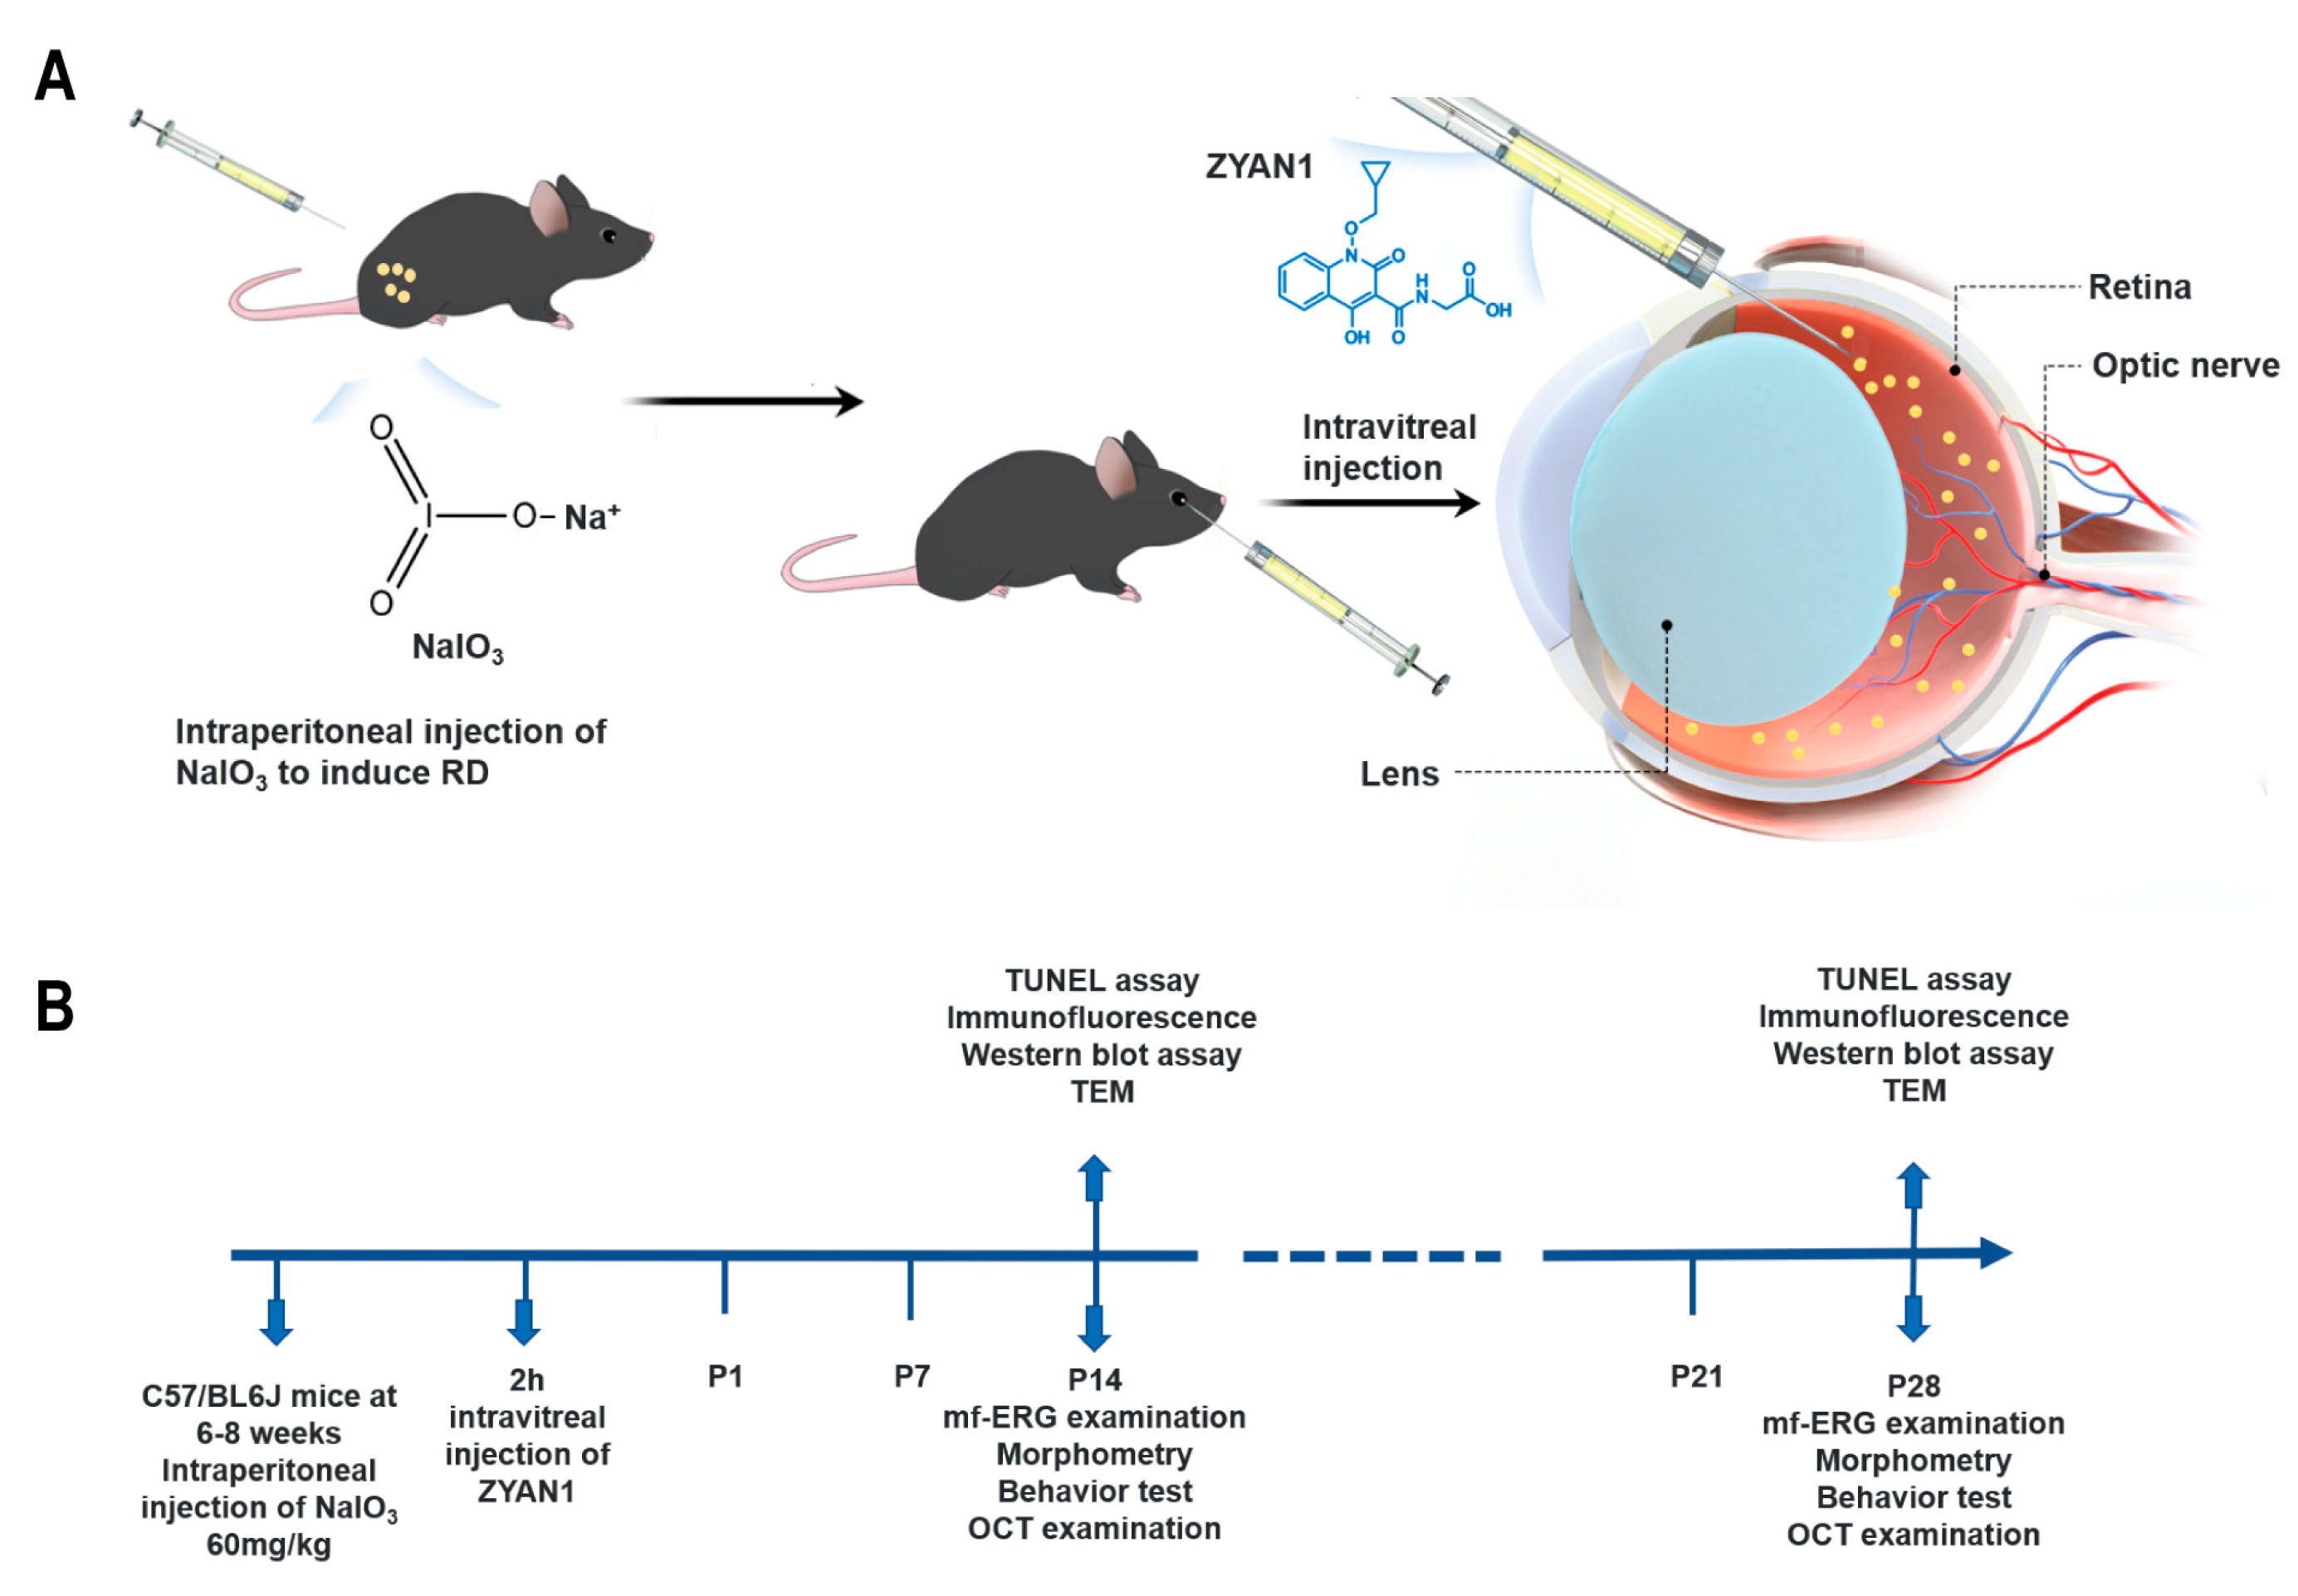
Abstract
:1. Introduction
2. Materials and Methods
2.1. Animals and Pharmacological Agents
2.2. Light/Dark Transition Behavior Test
2.3. Open-Field Behavior Test
2.4. Multifocal Electroretinography (mf-ERG) Examination
2.5. Optical Coherence Tomography (OCT) and Fundus Photography
2.6. Hematoxylin and Eosin (H&E) Staining
2.7. In Situ ROS Detection
2.8. Transmission Electron Microscope (TEM) Examination
2.9. Immunohistochemistry Assay
2.10. Terminal Deoxynucleotidyl Transferase Biotin-dUTP Nick End Labeling (TUNEL) Assay
2.11. Western Blot Assay
2.12. Statistical Analysis
3. Results
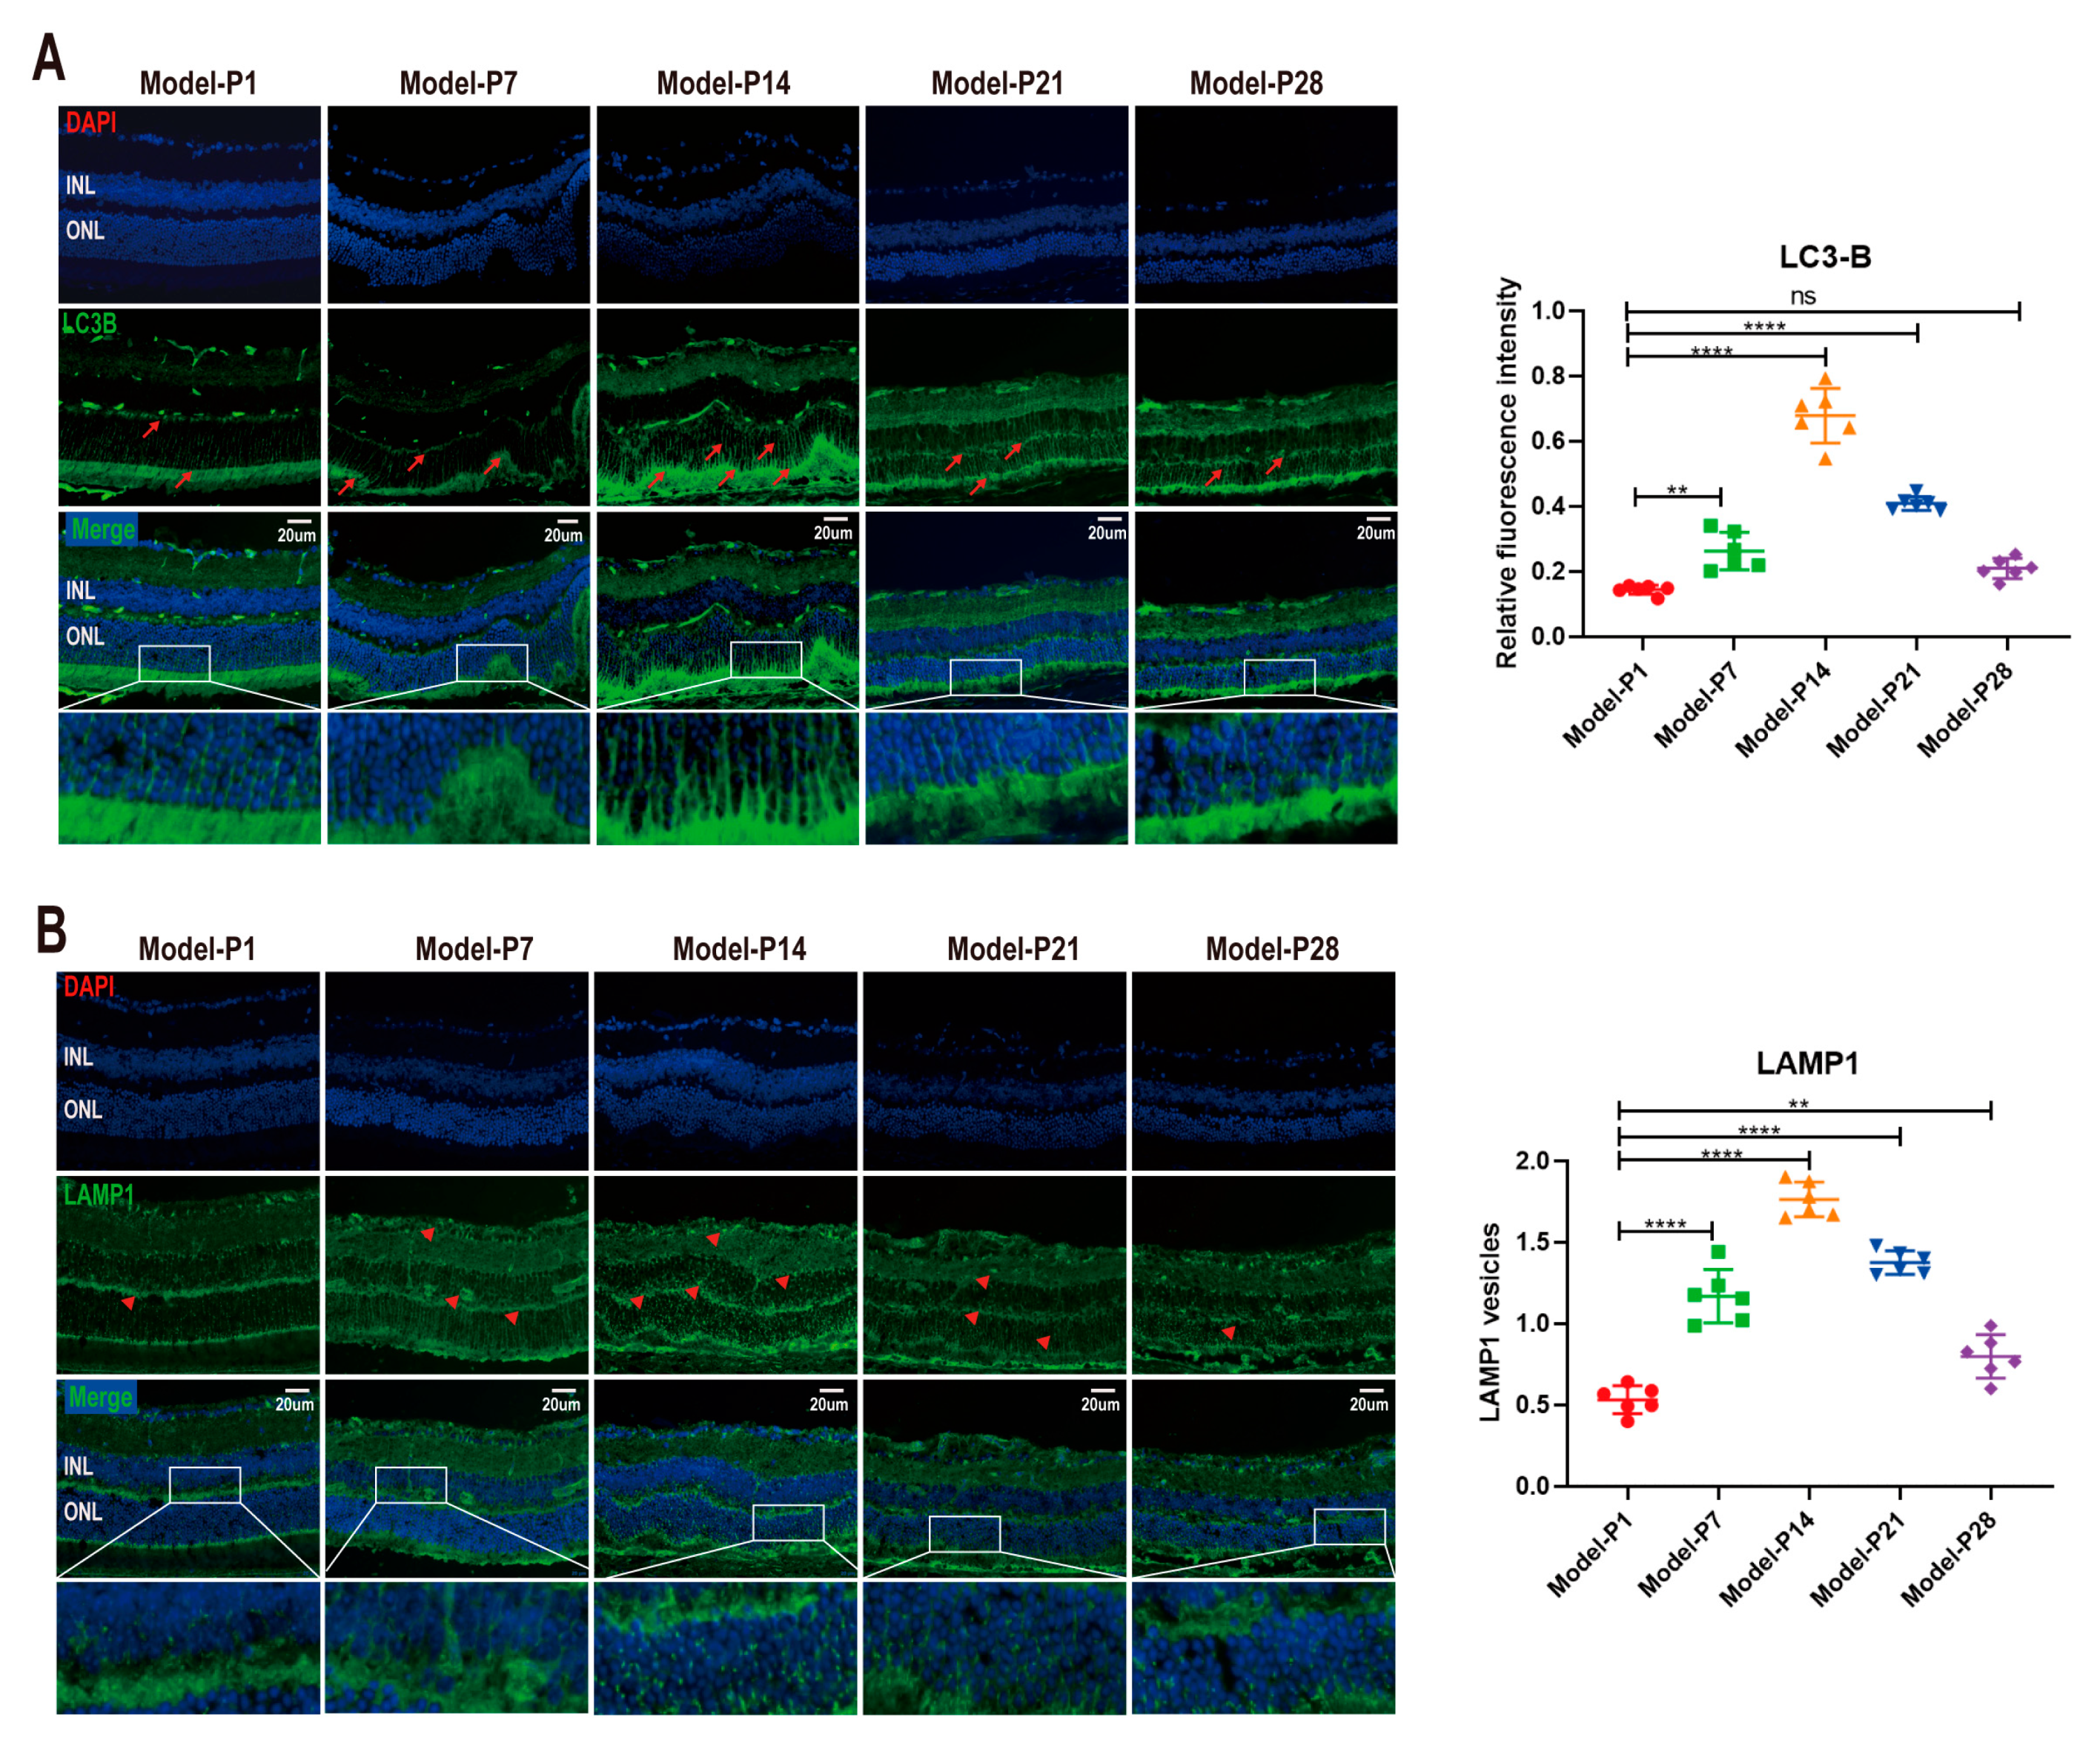
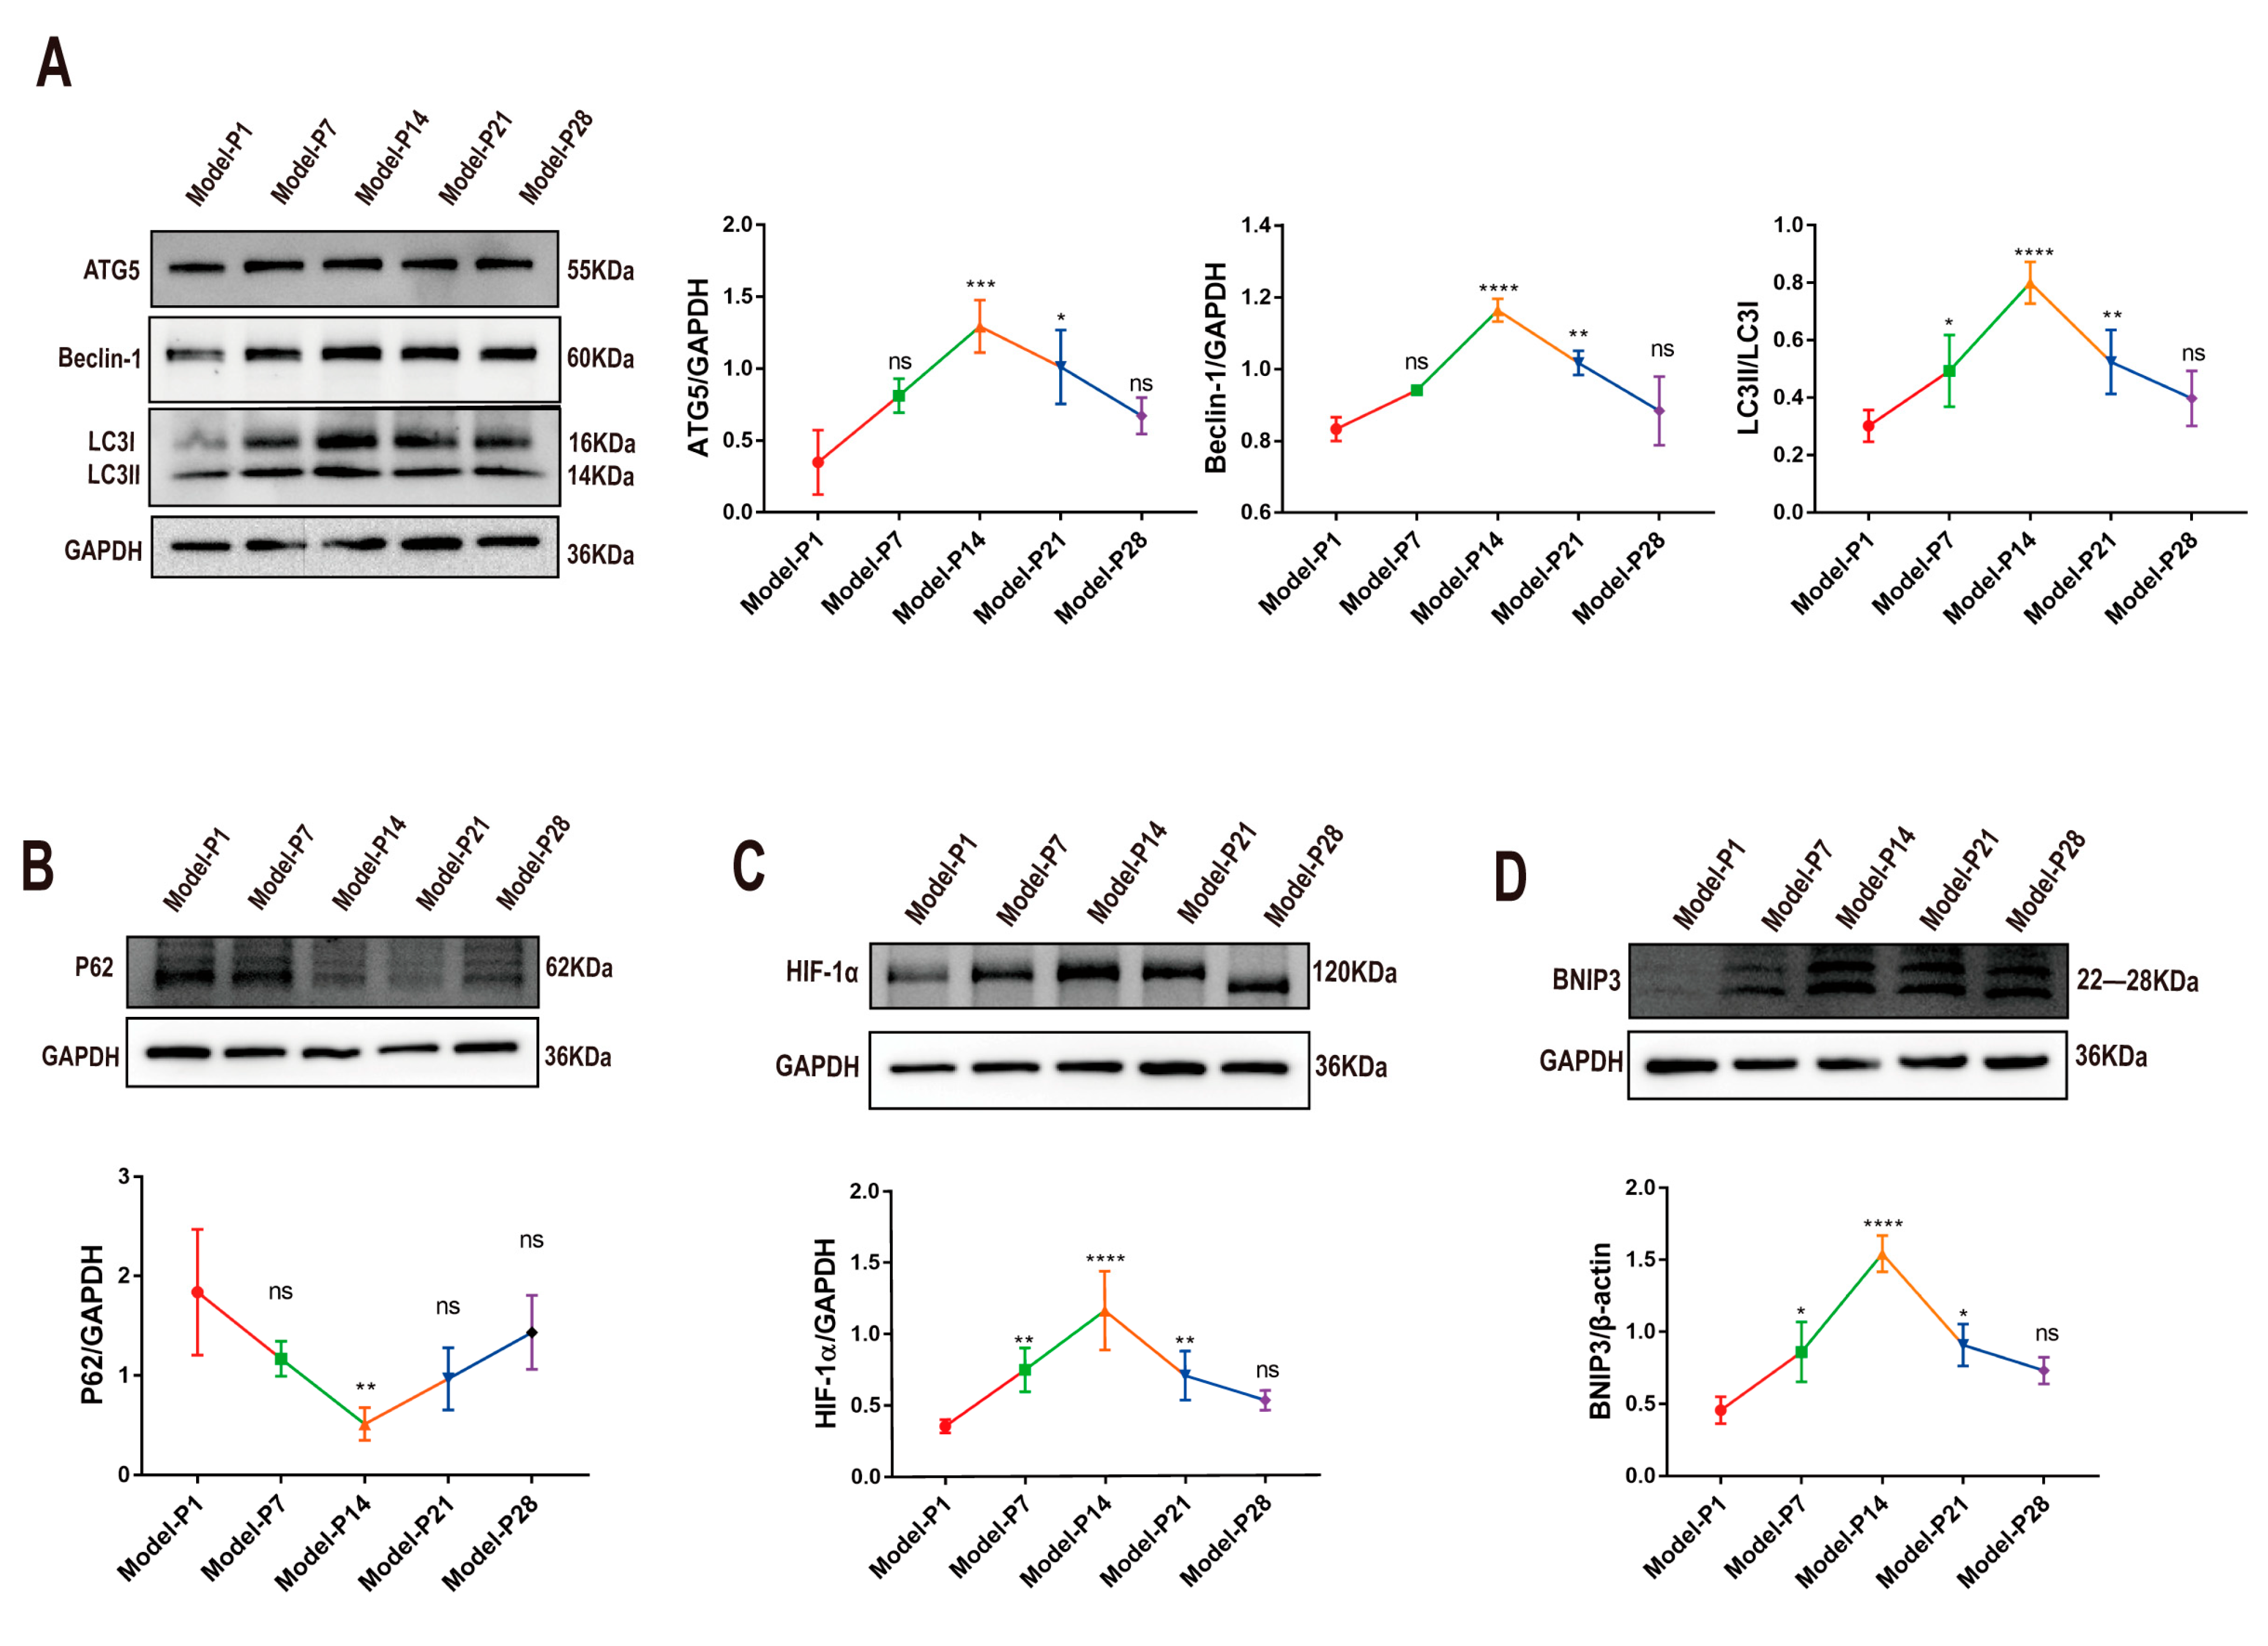
3.1. Altered Autophagy Status in RD Model
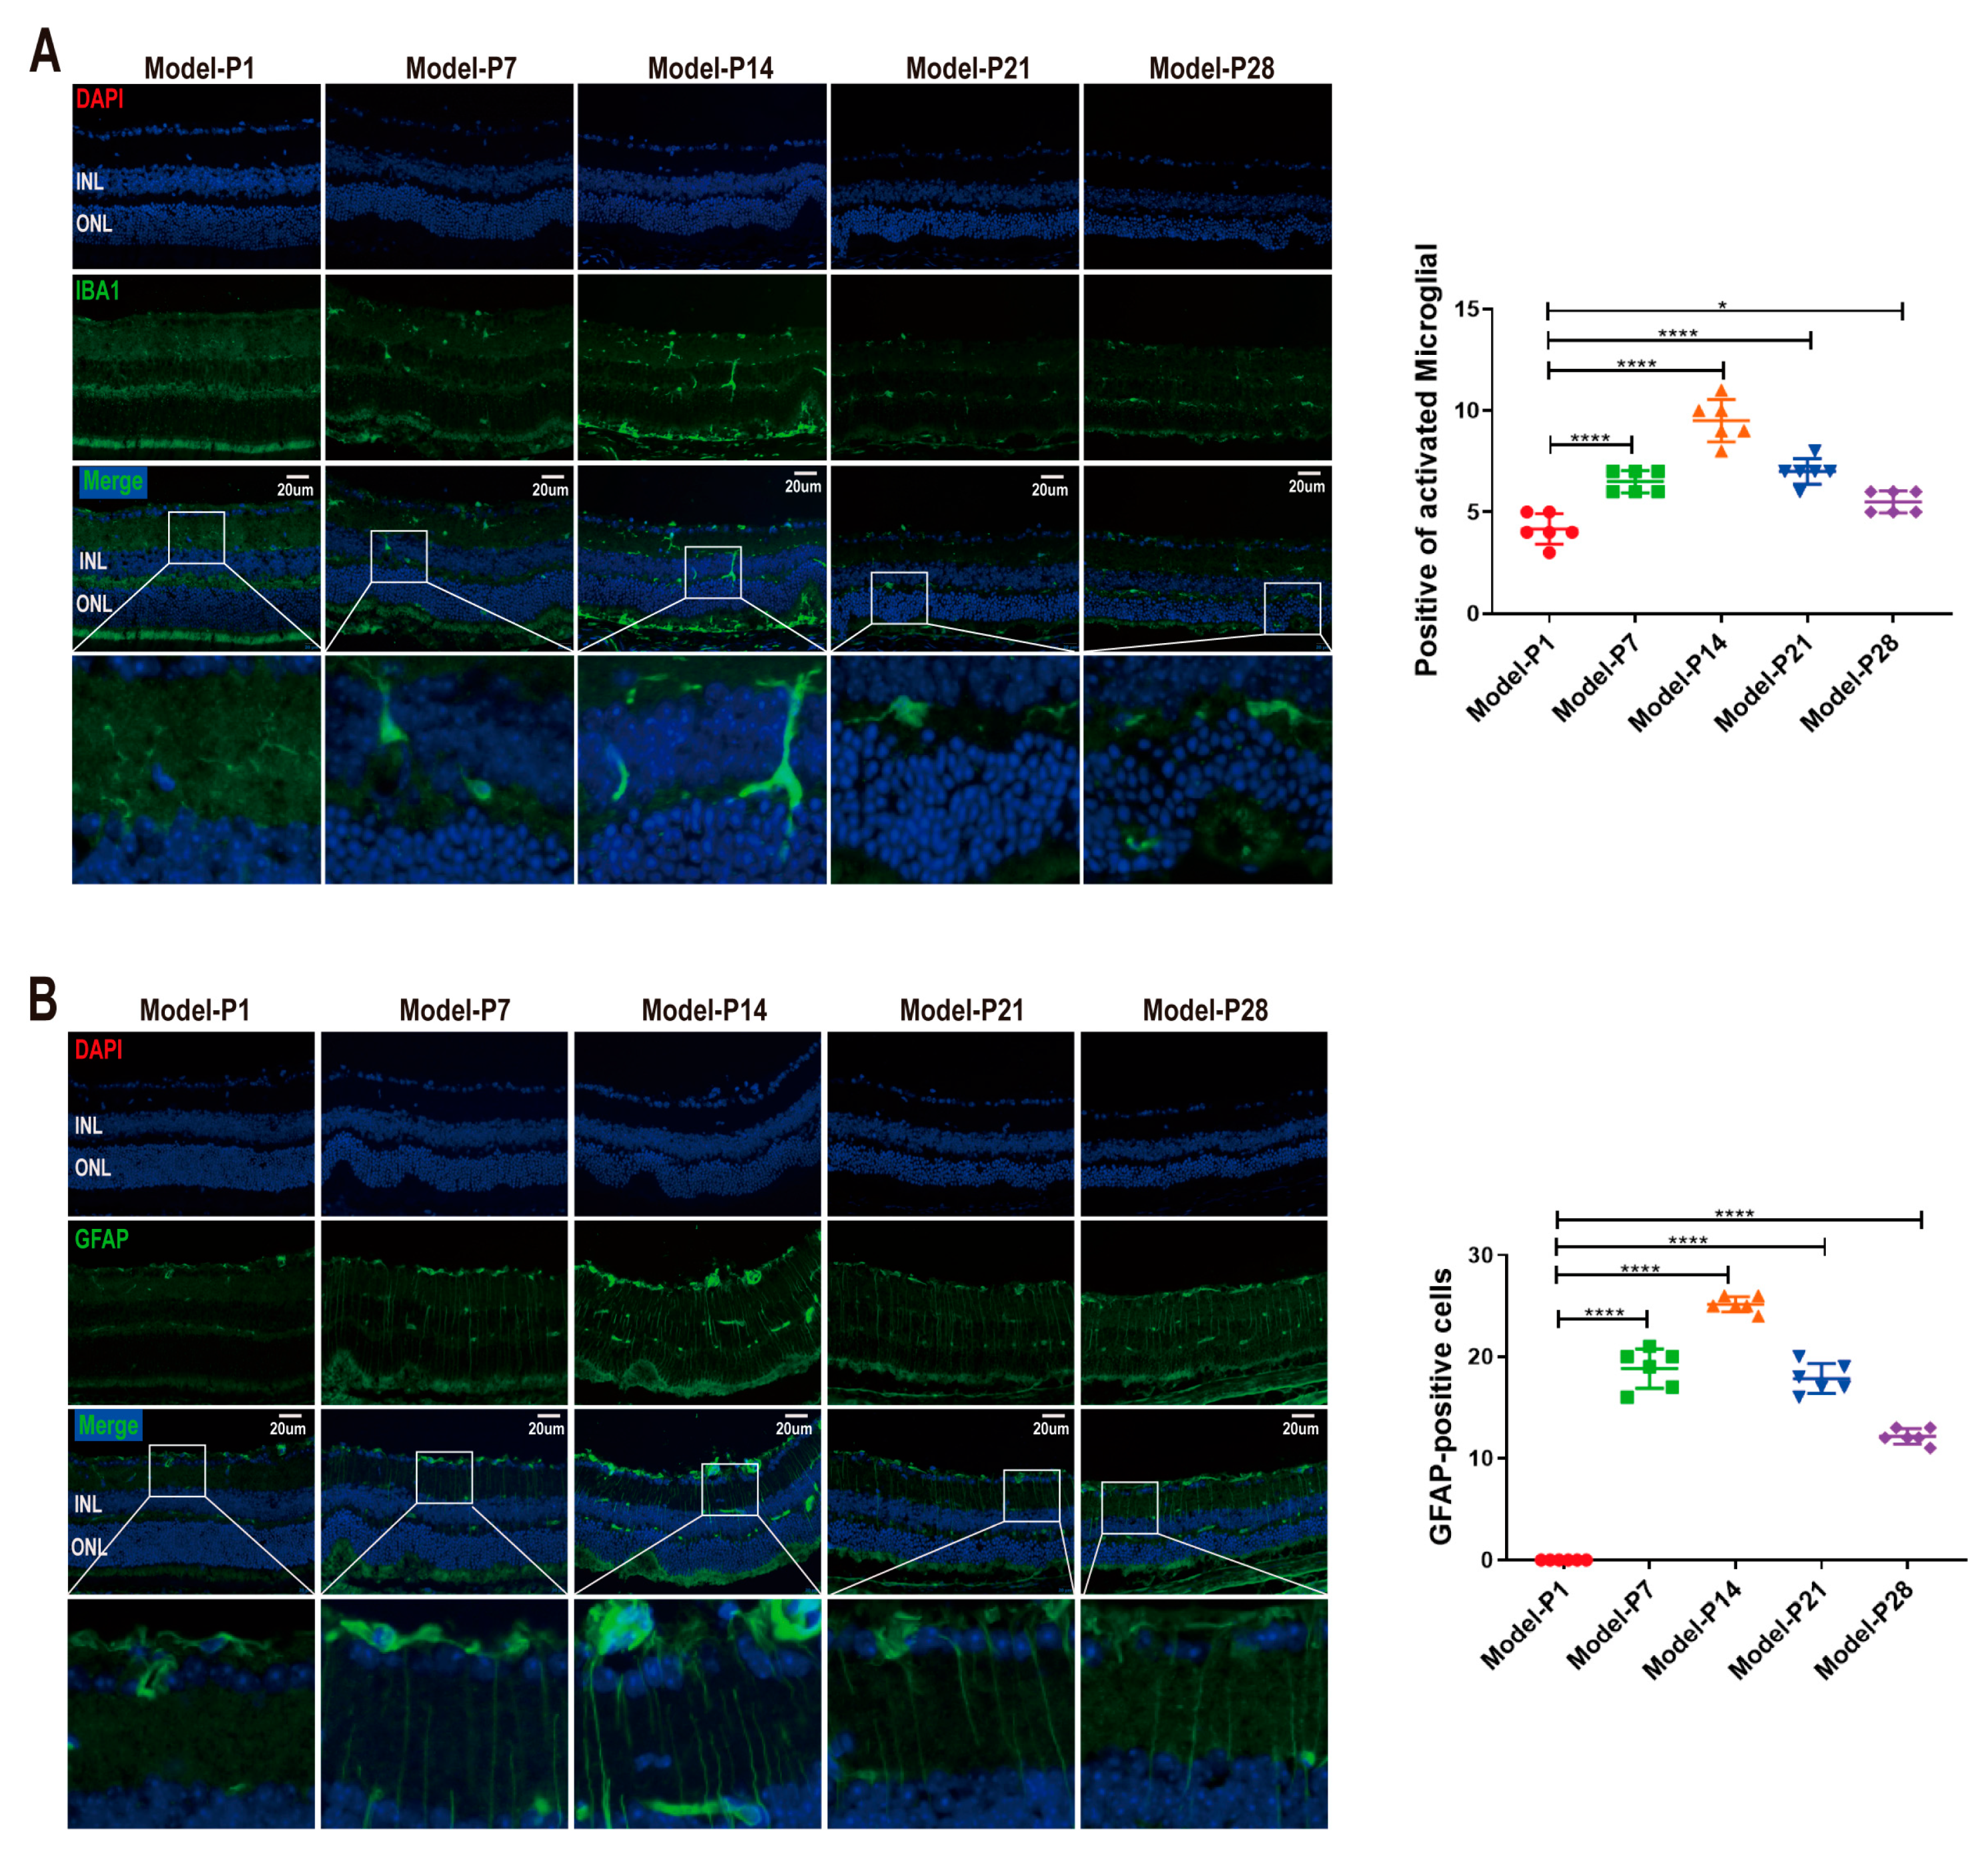
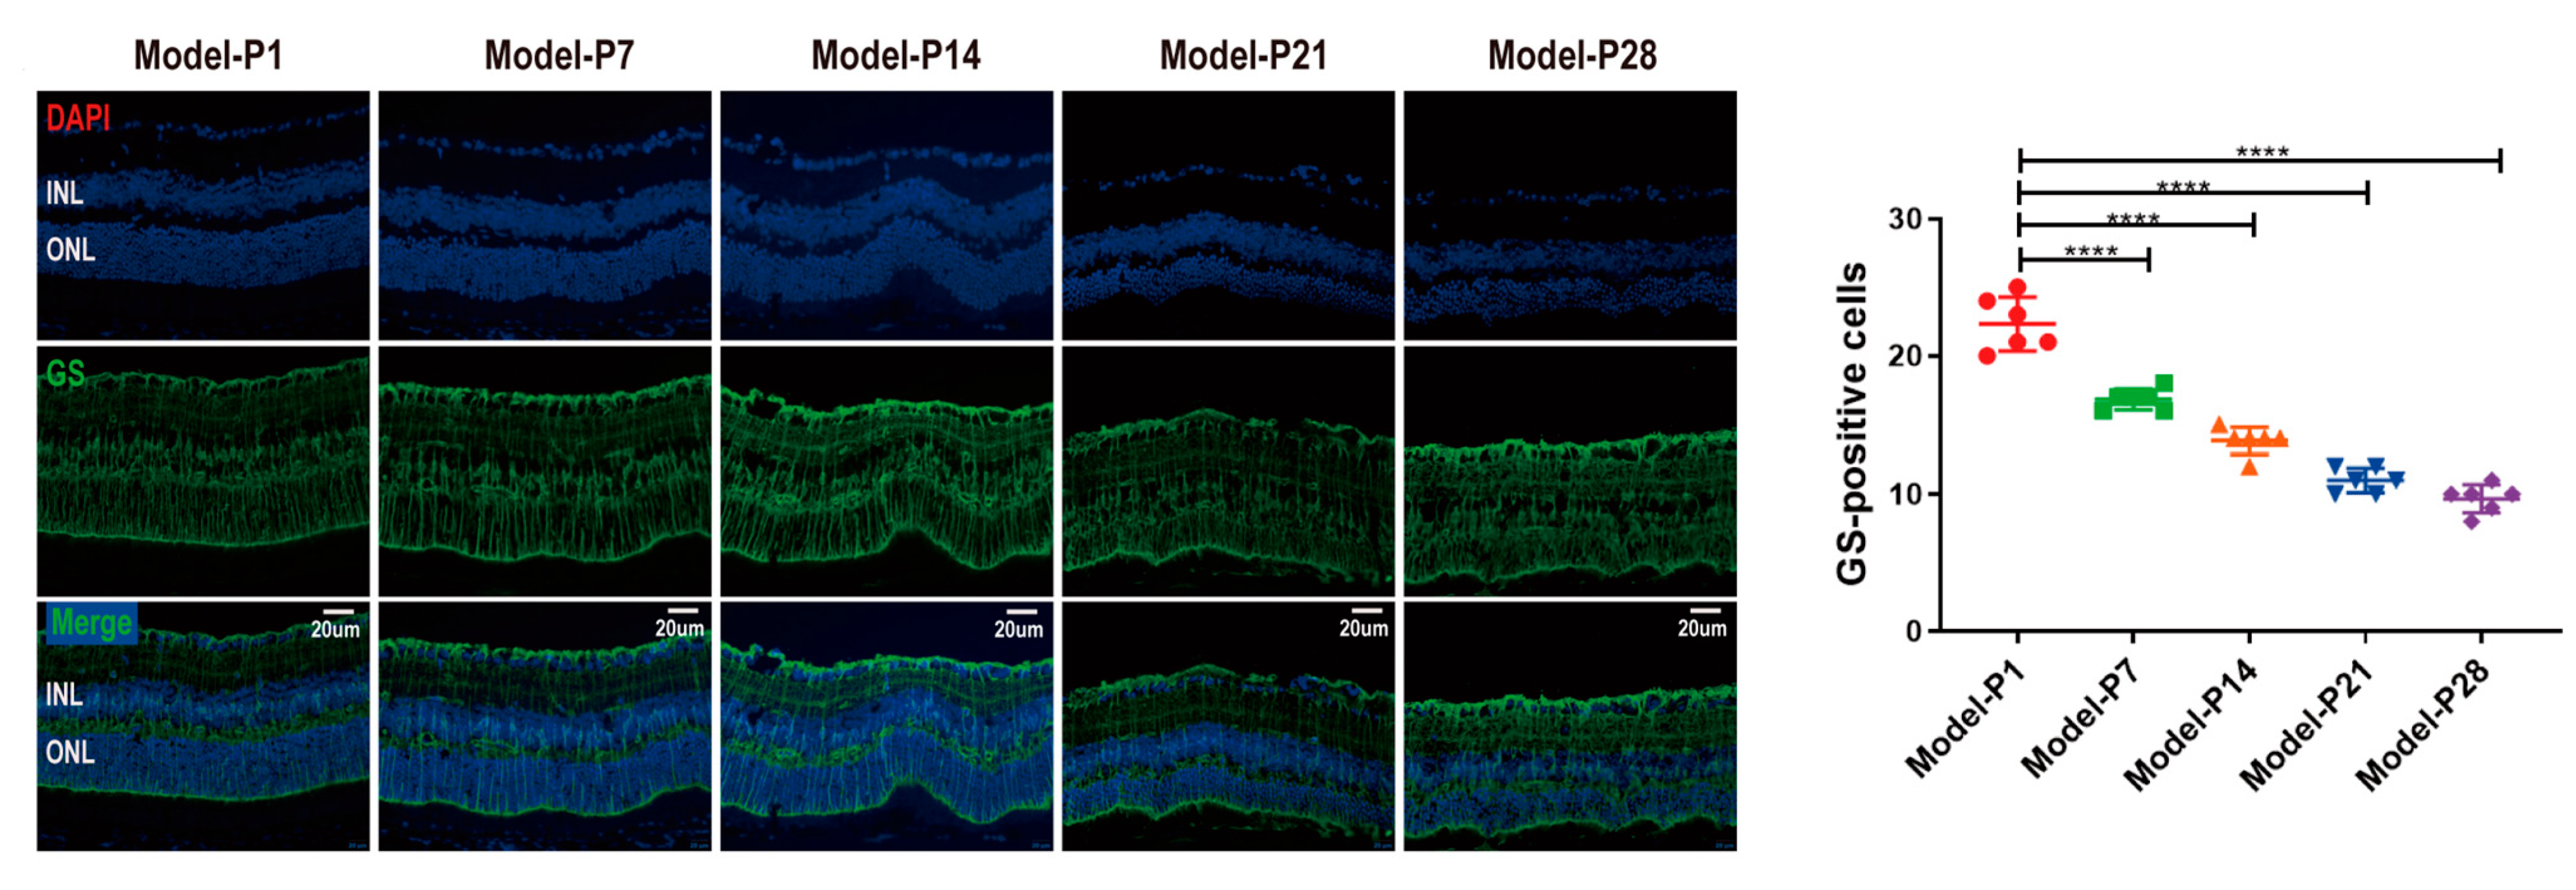
3.2. Neuroglia Activation and Gliosis Reaction in the Retinas of RD Model
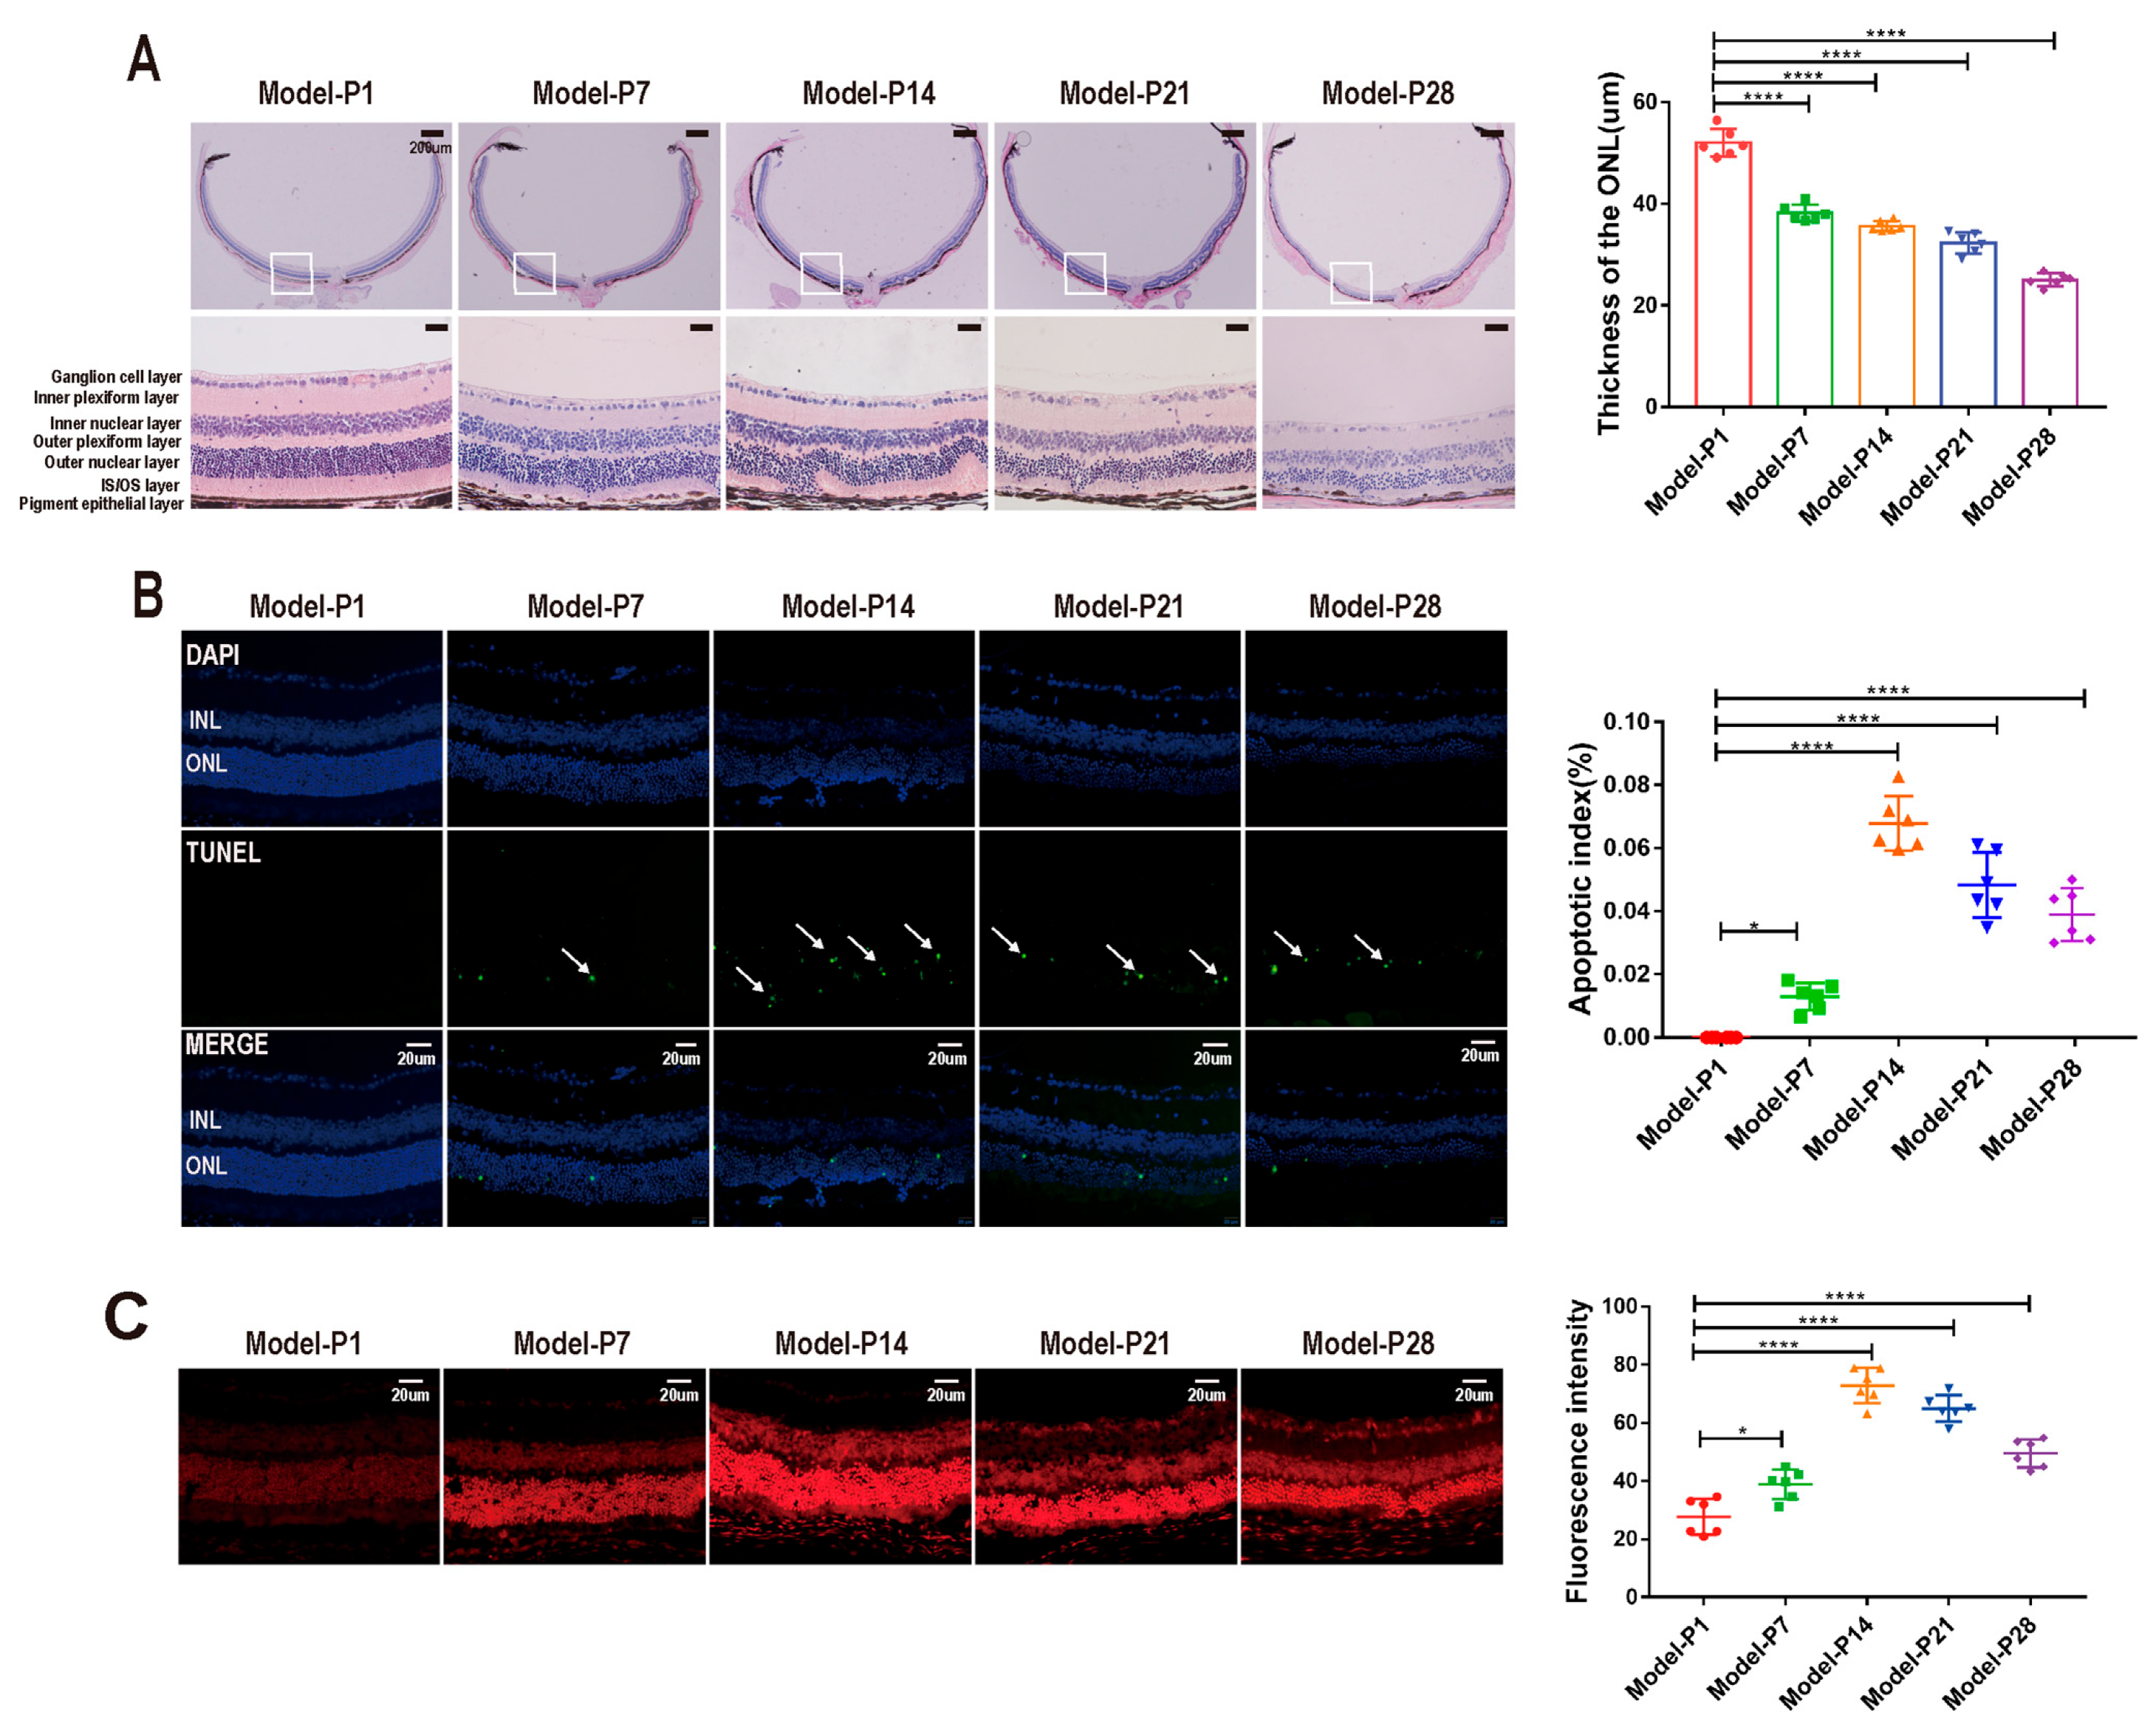
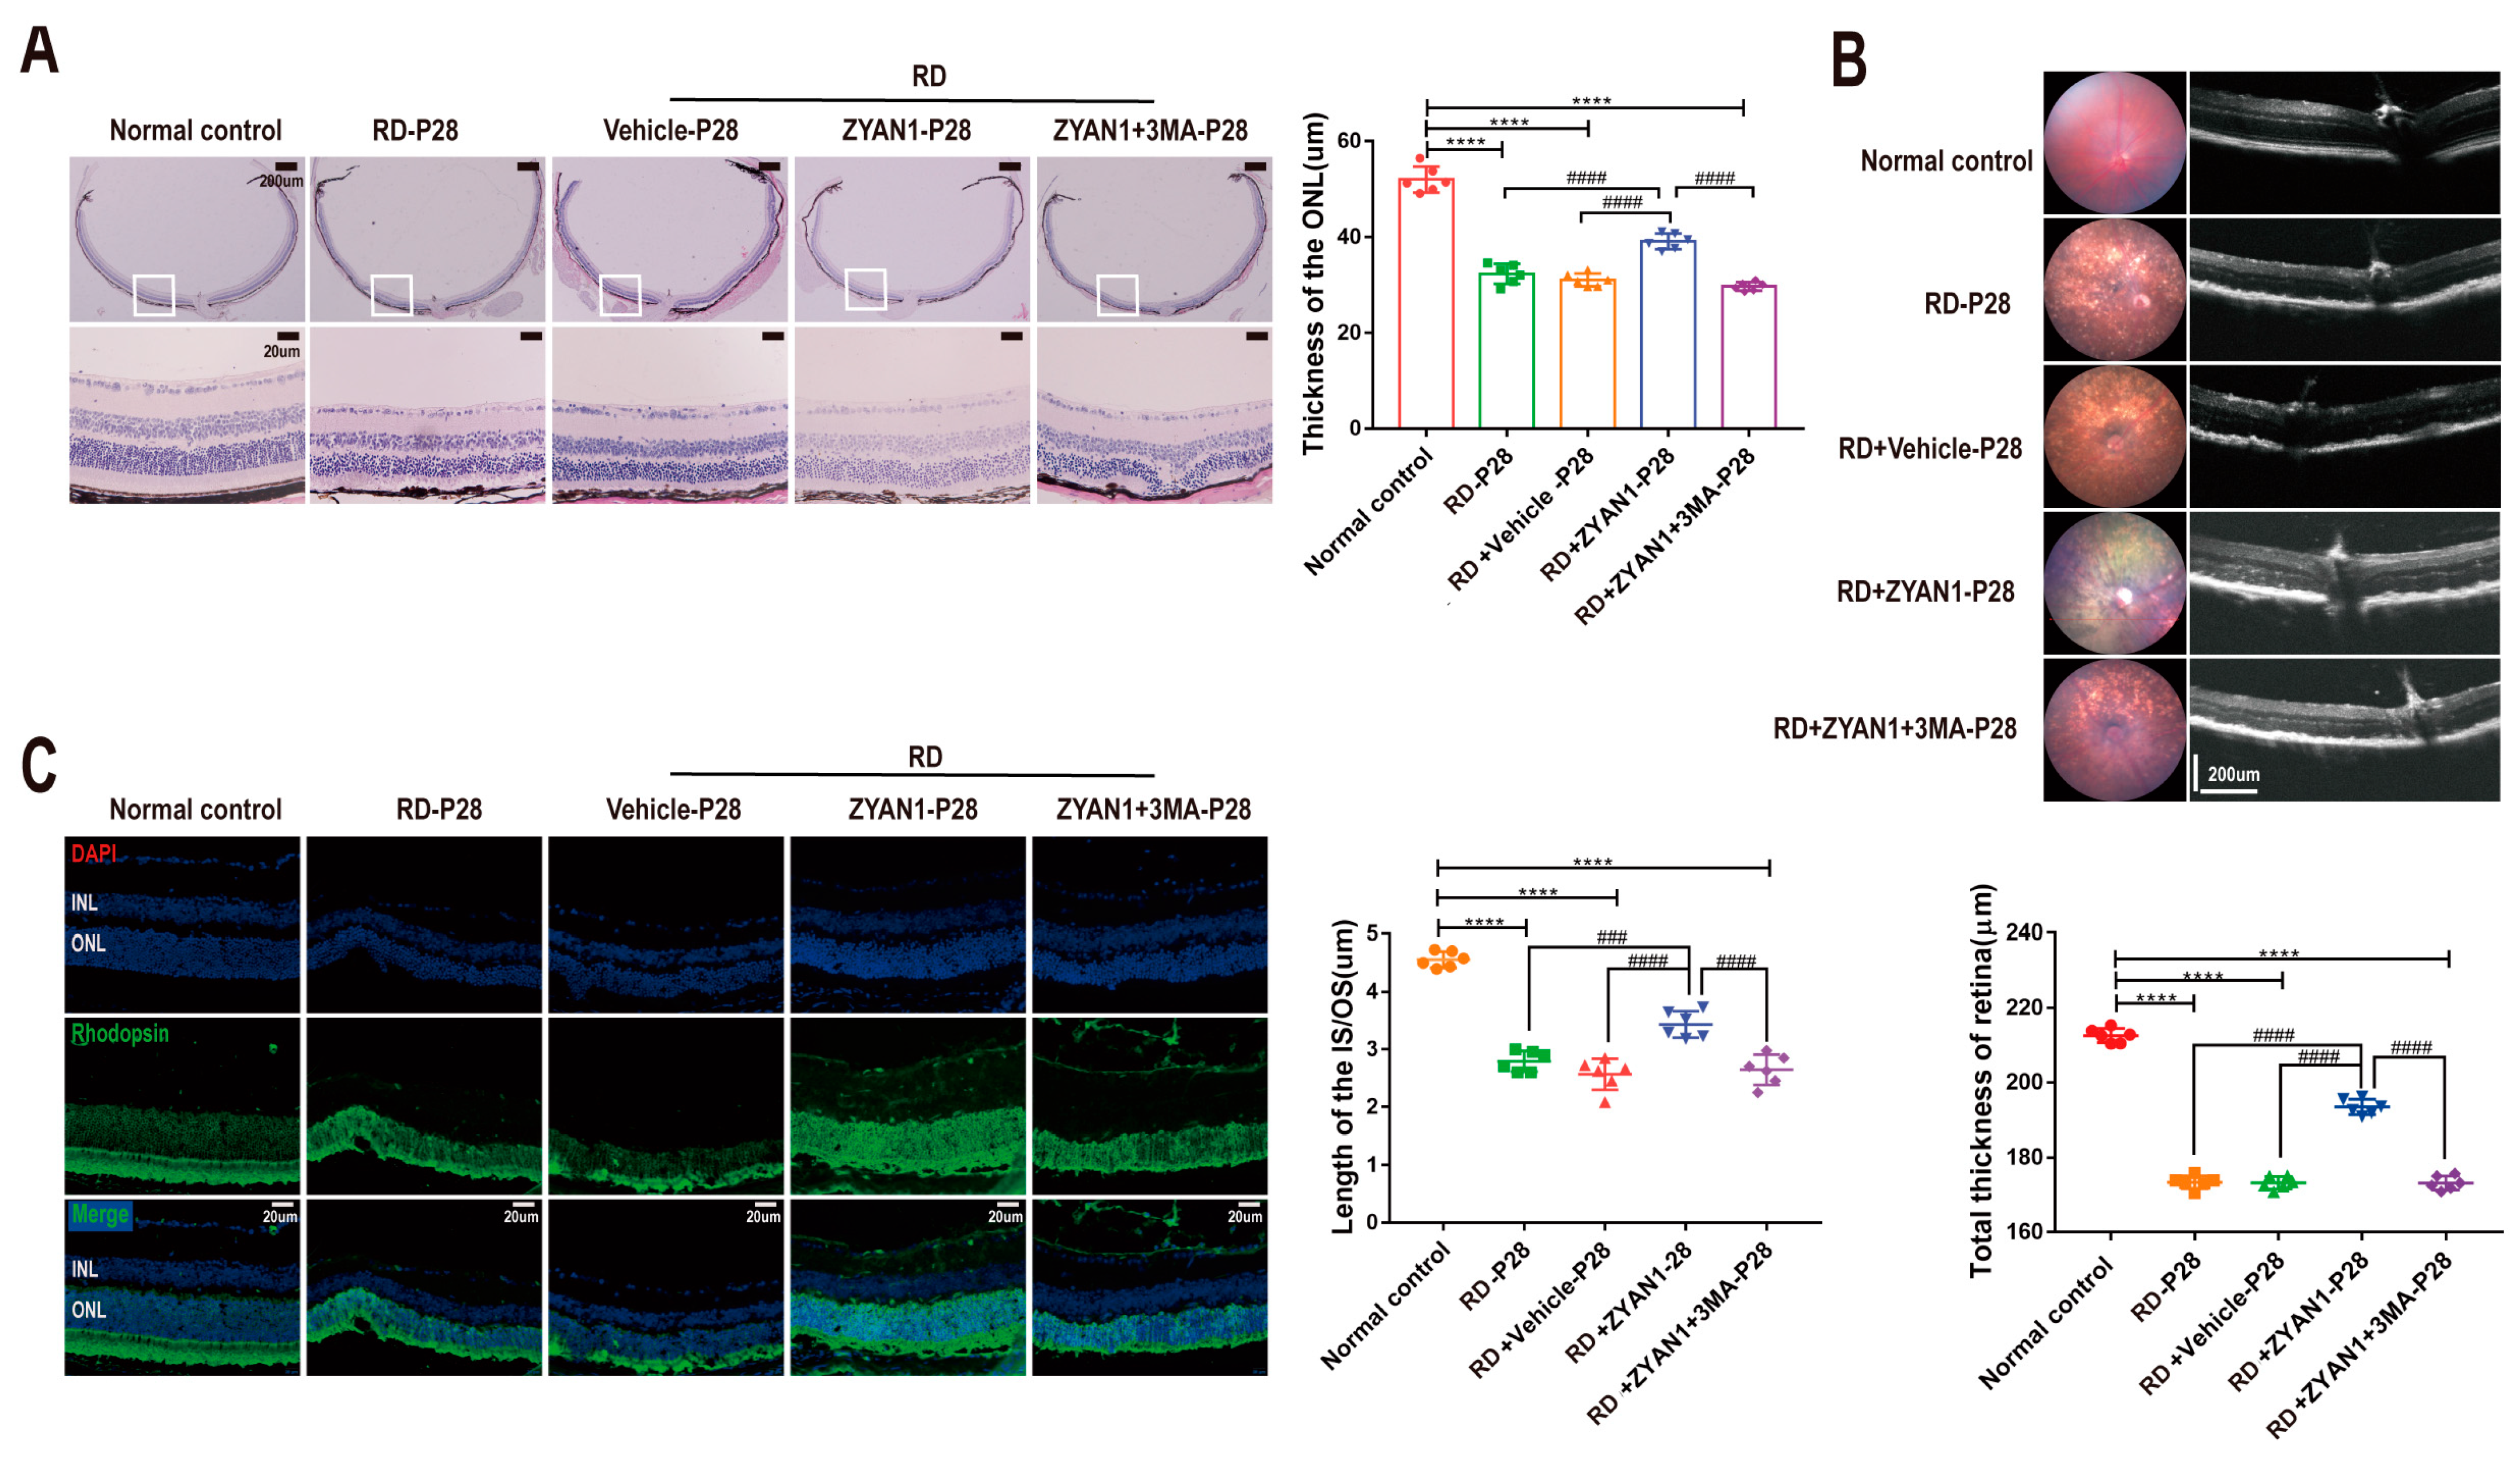
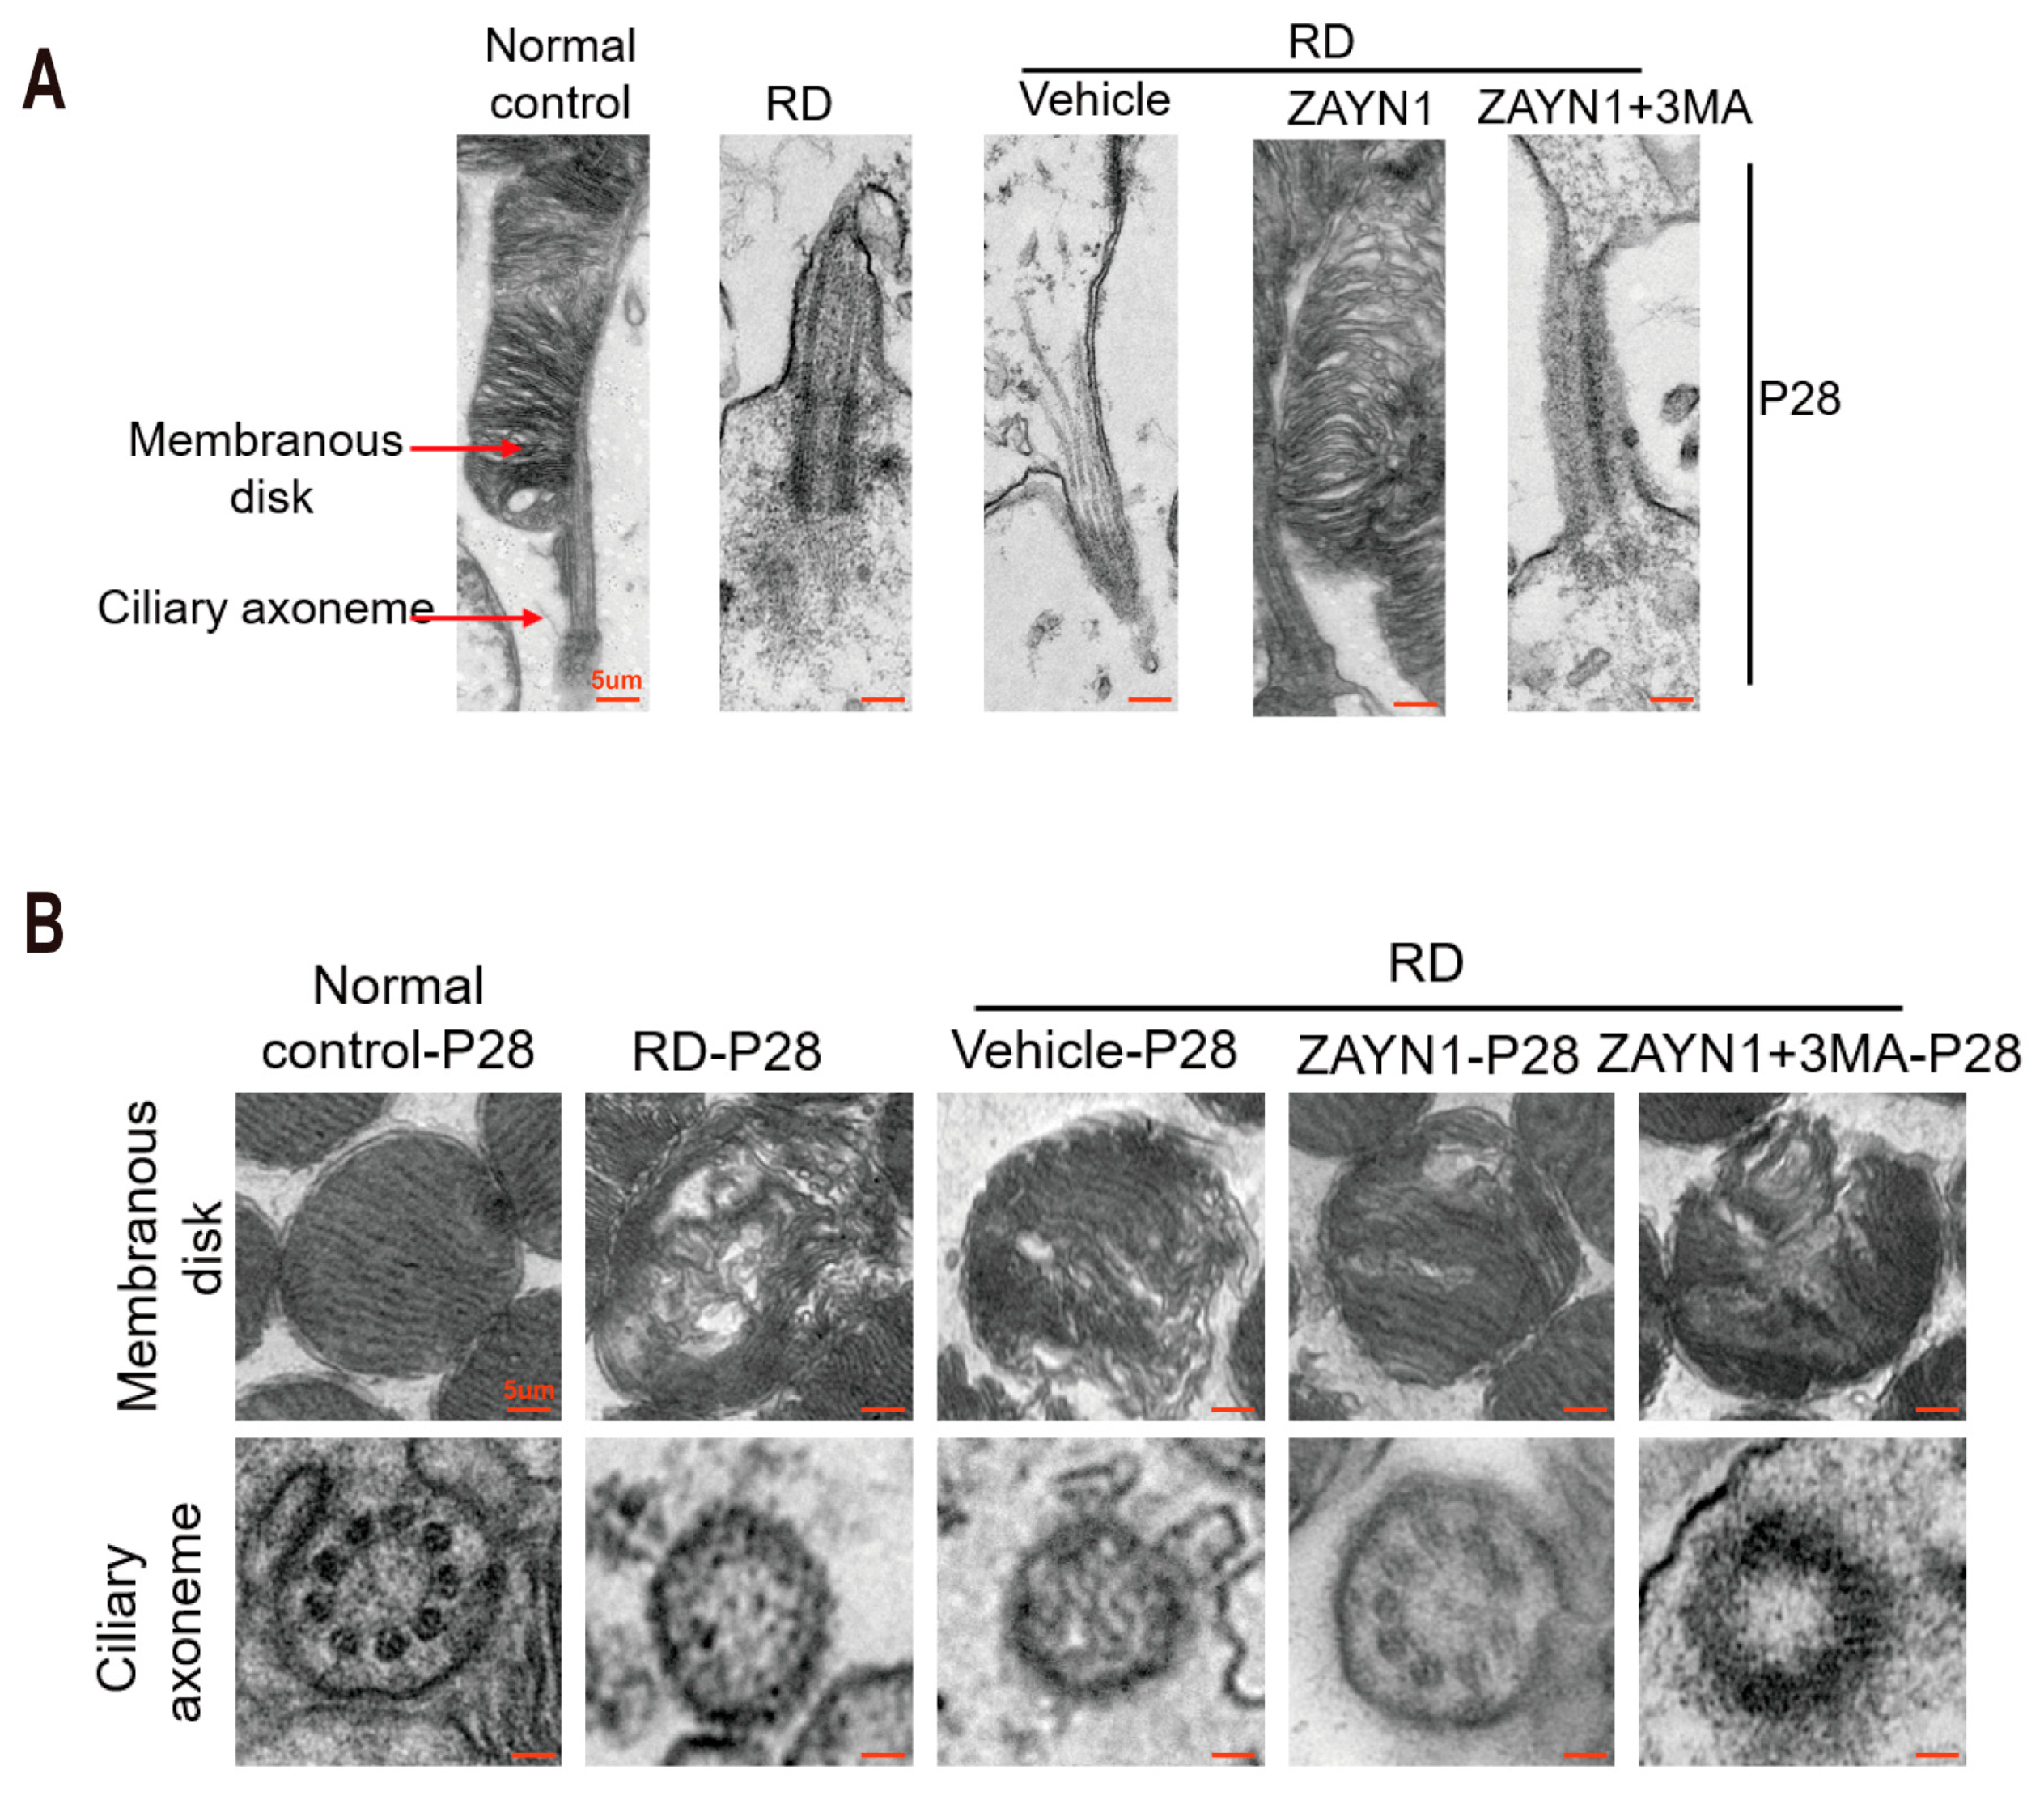
3.3. ZYAN1 Alleviated Retinal Photoreceptor Damage in RD Model
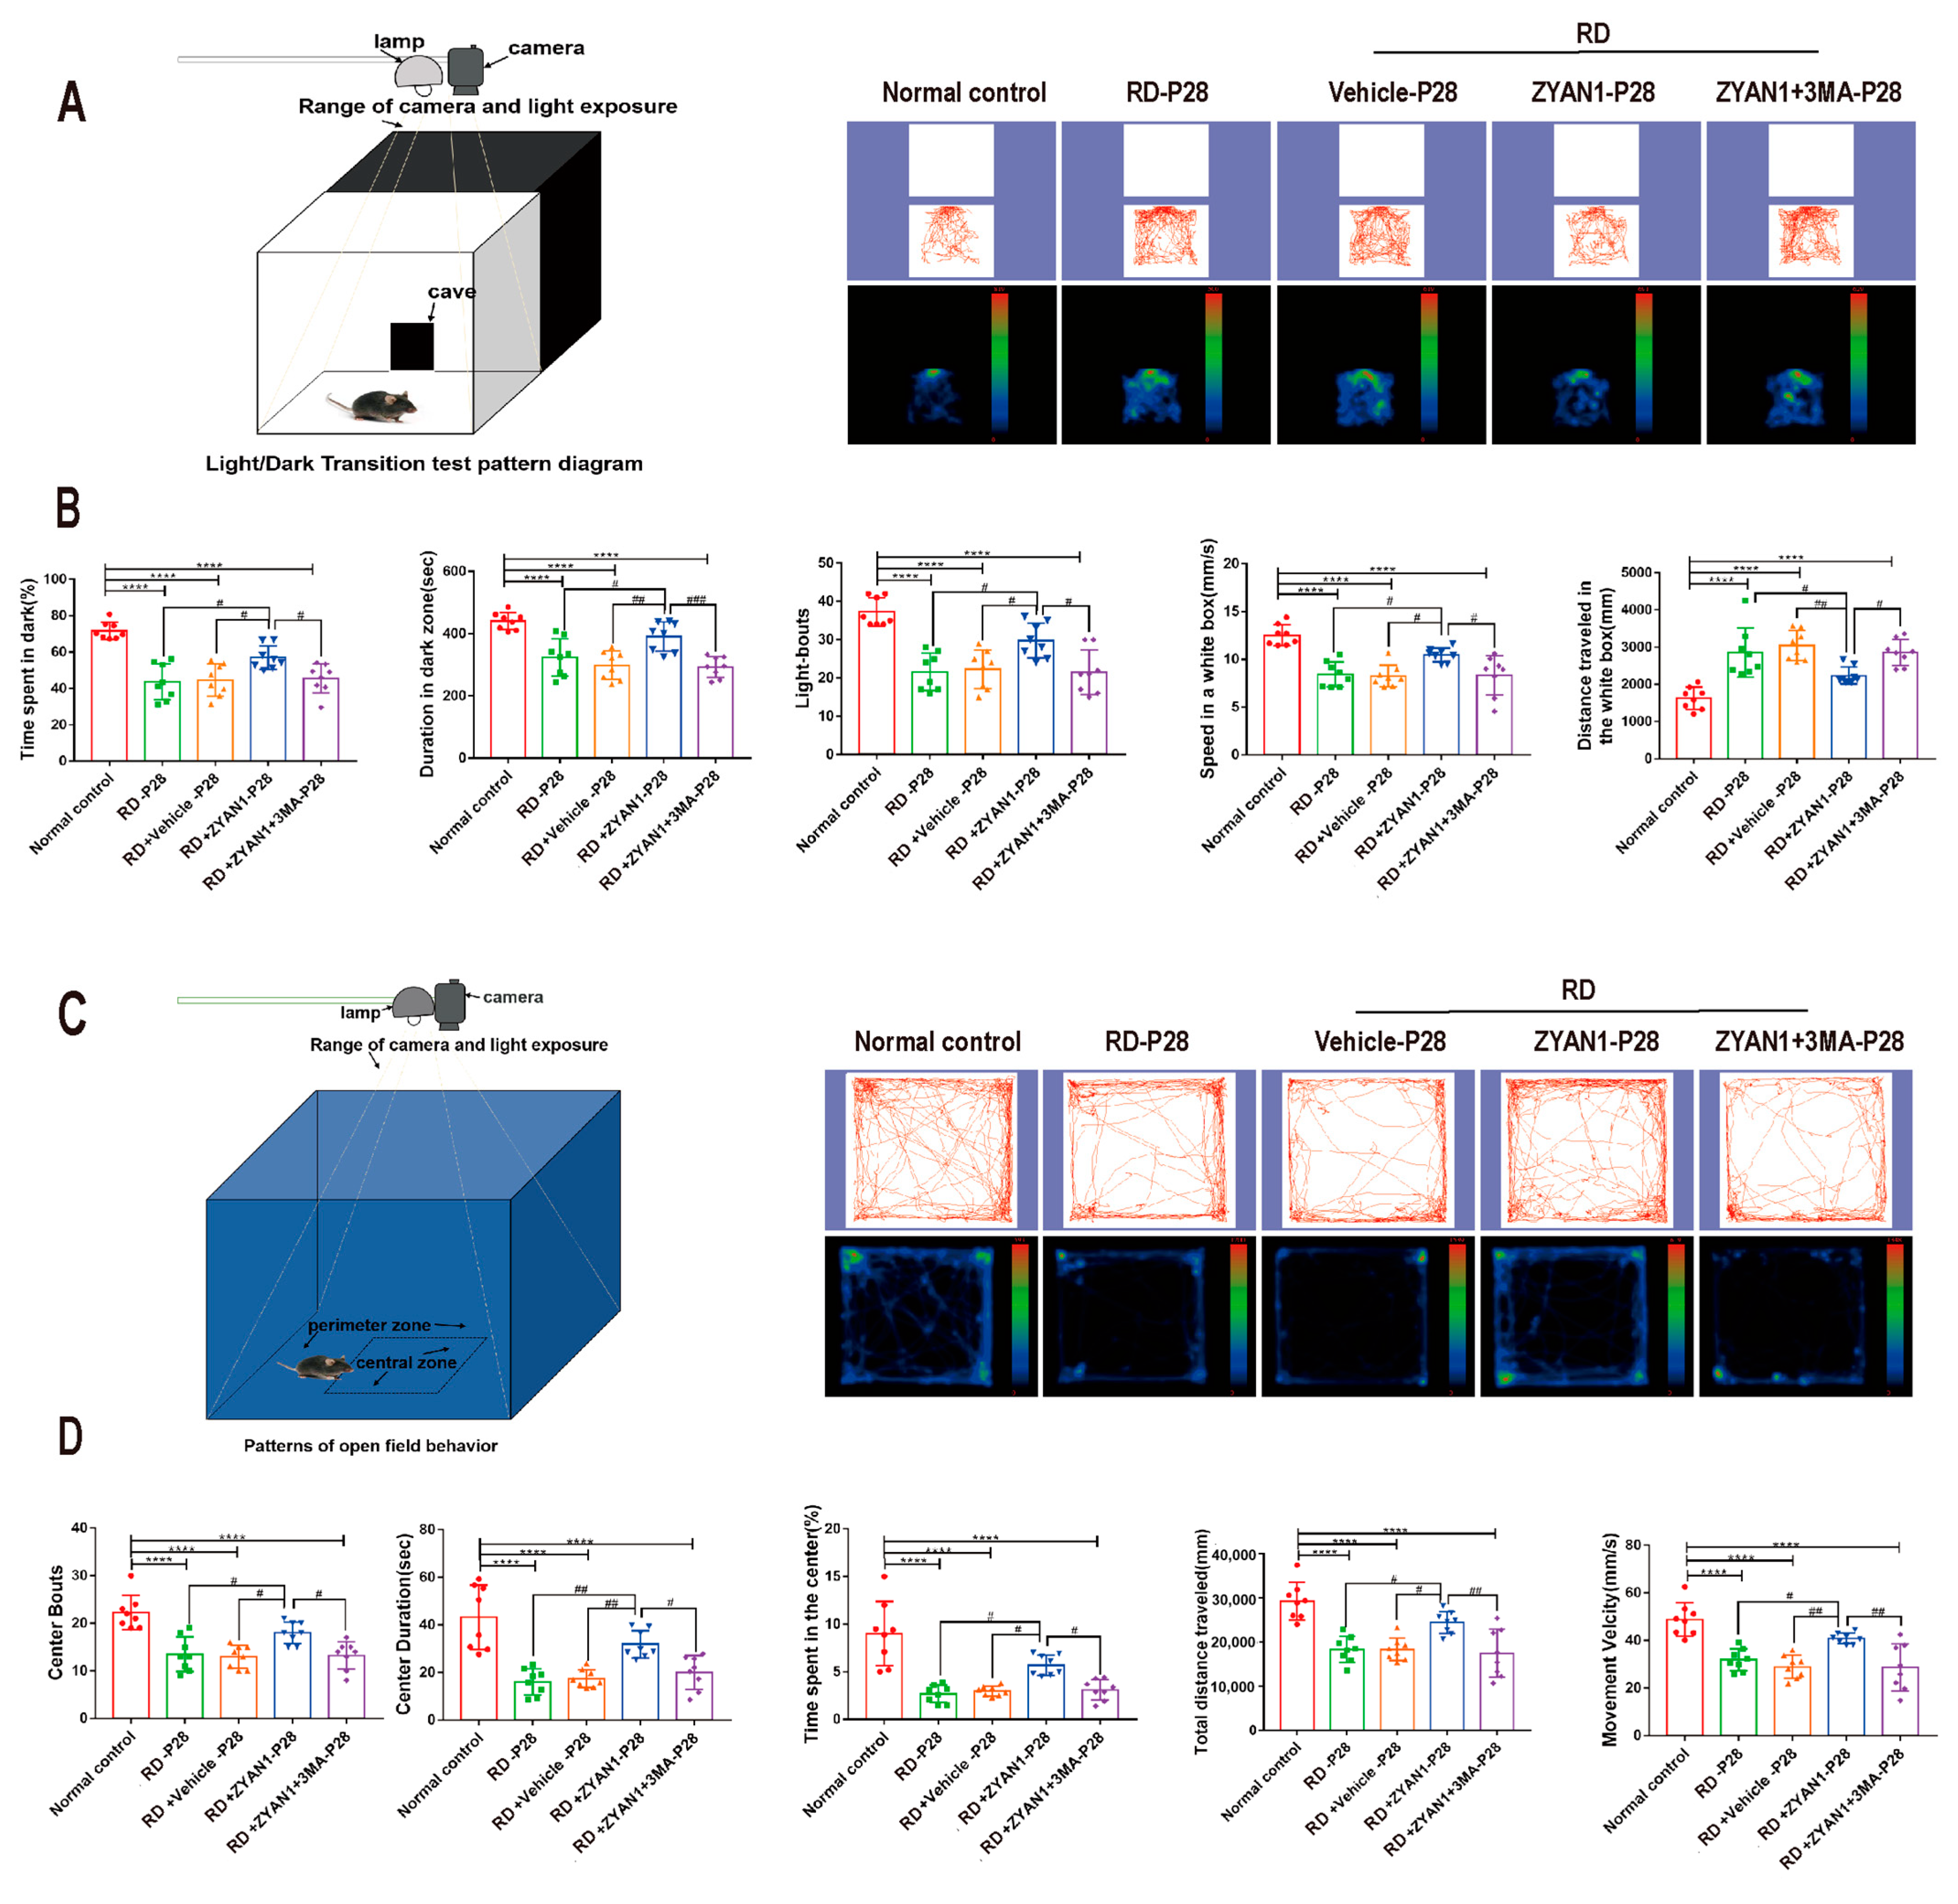
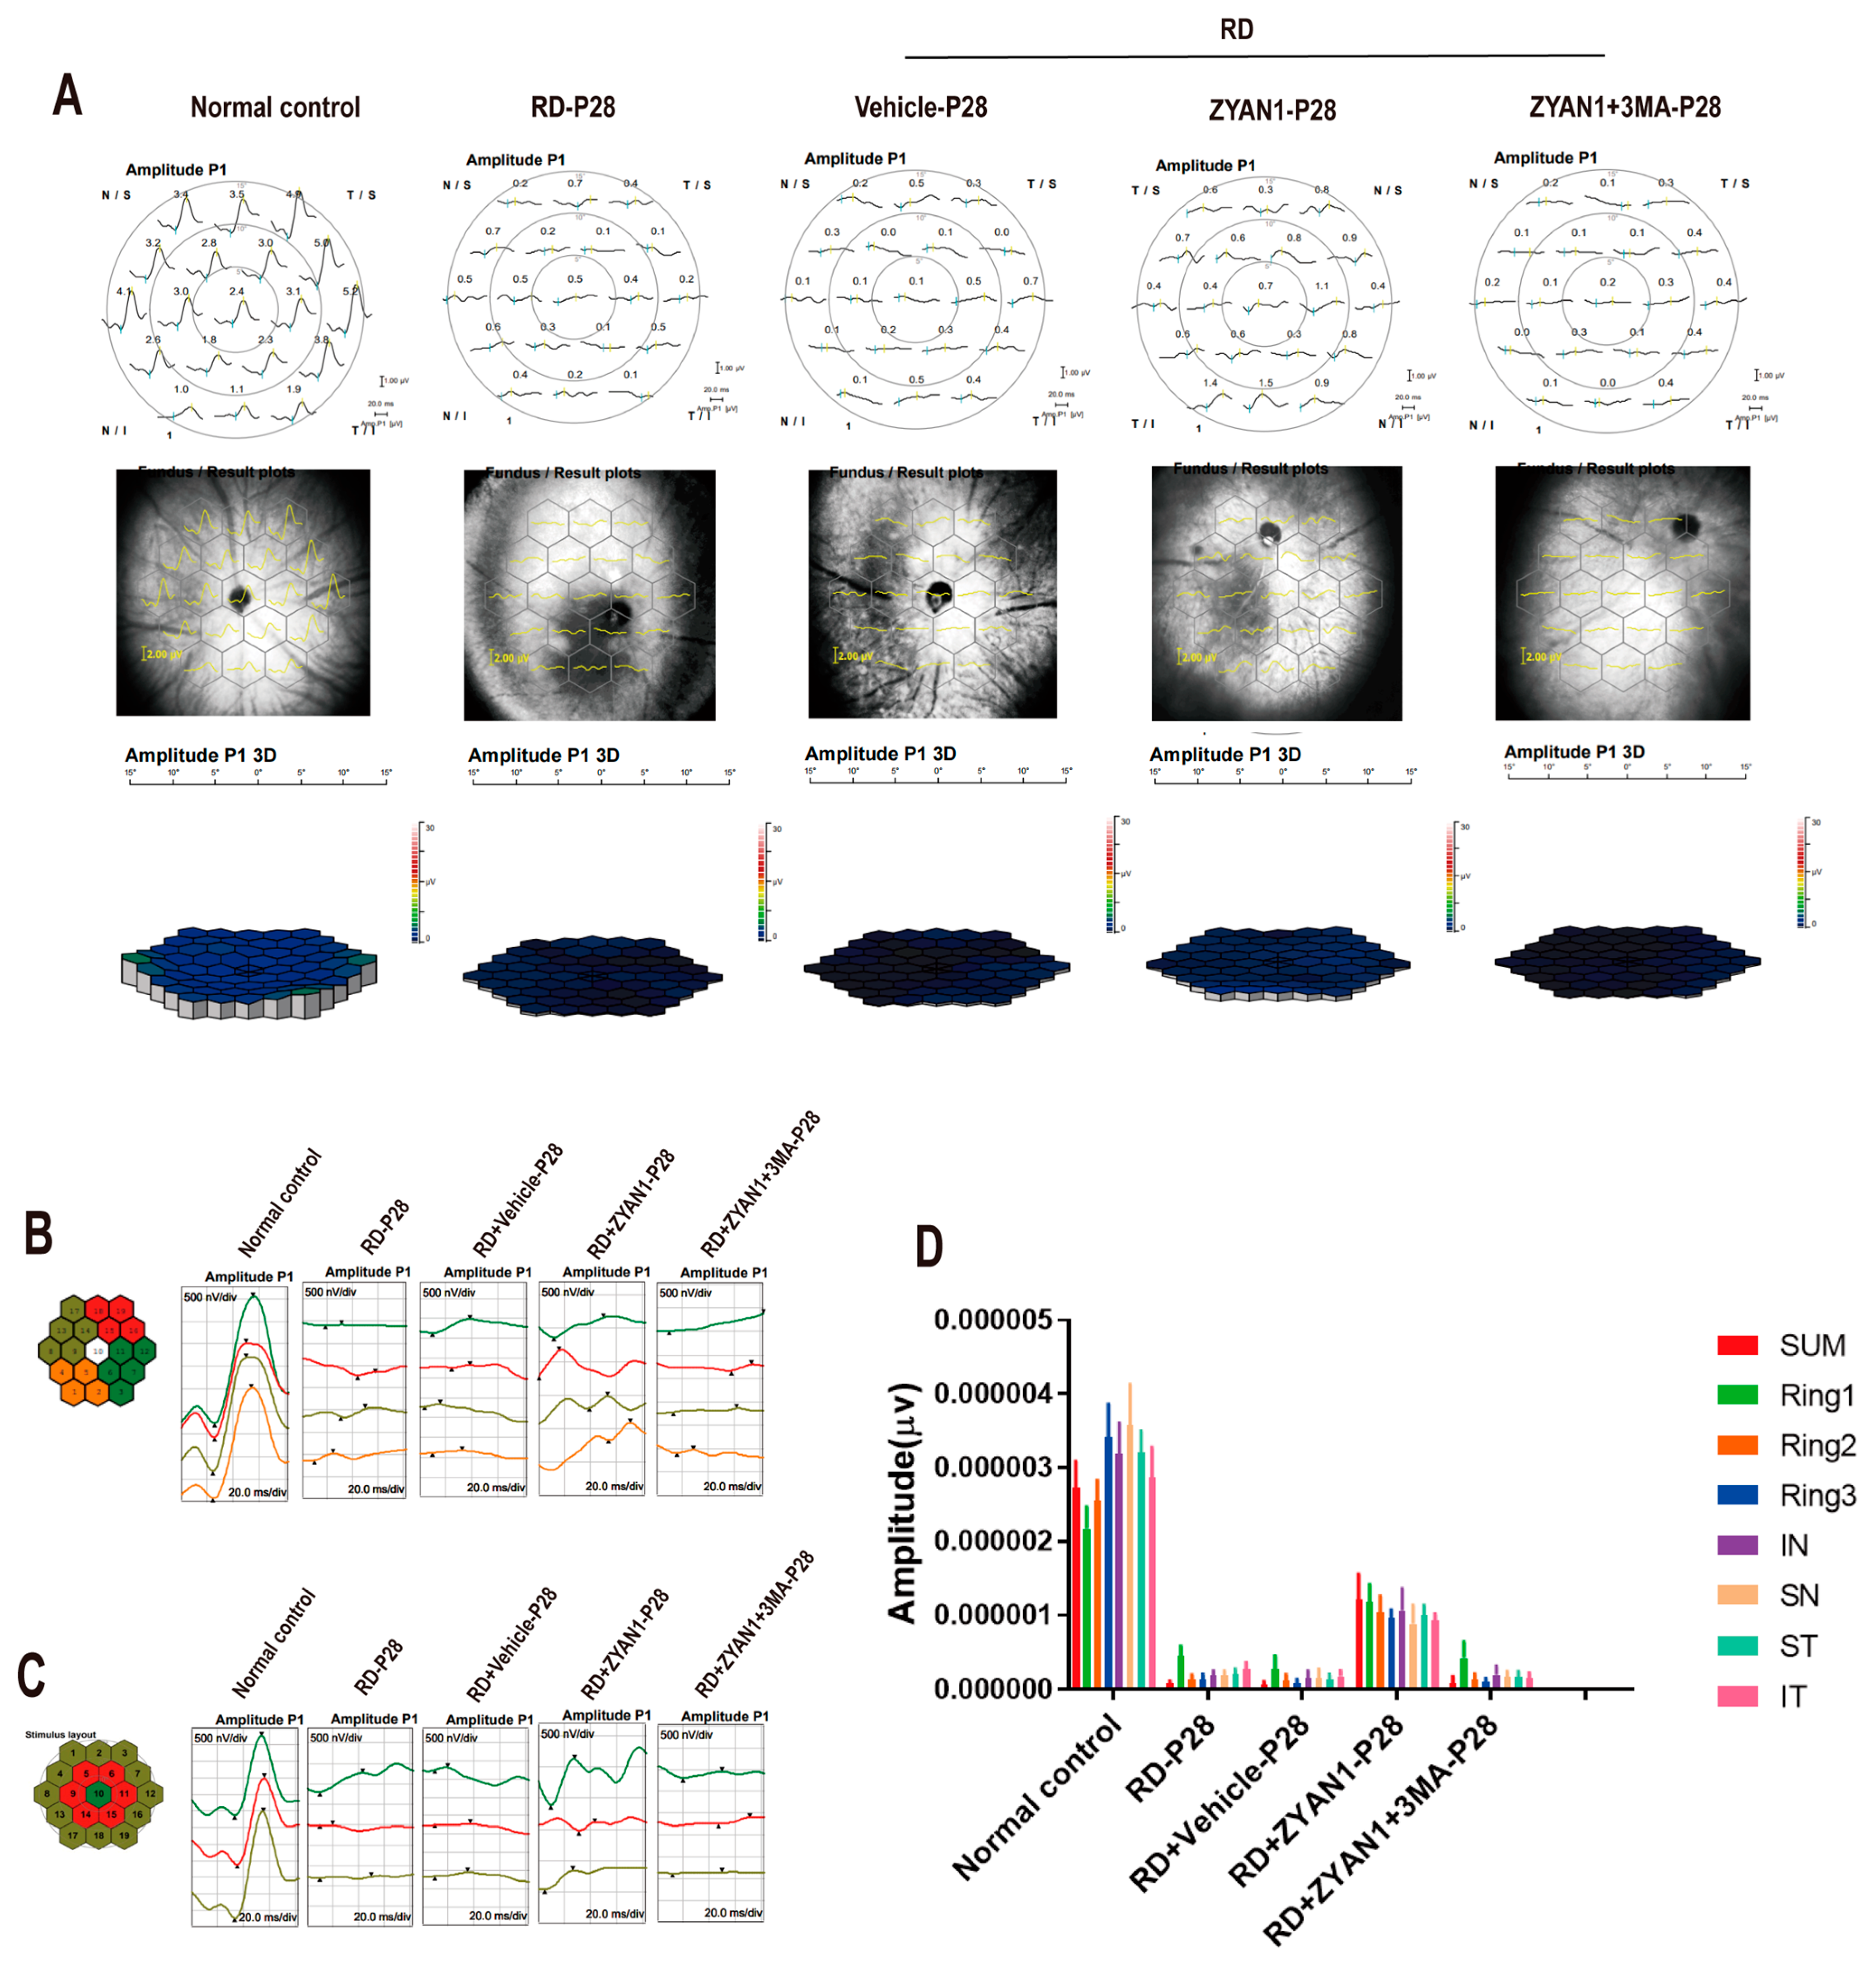
3.4. ZYAN1 Improved Visual Function and Behavioral Activity in RD Model
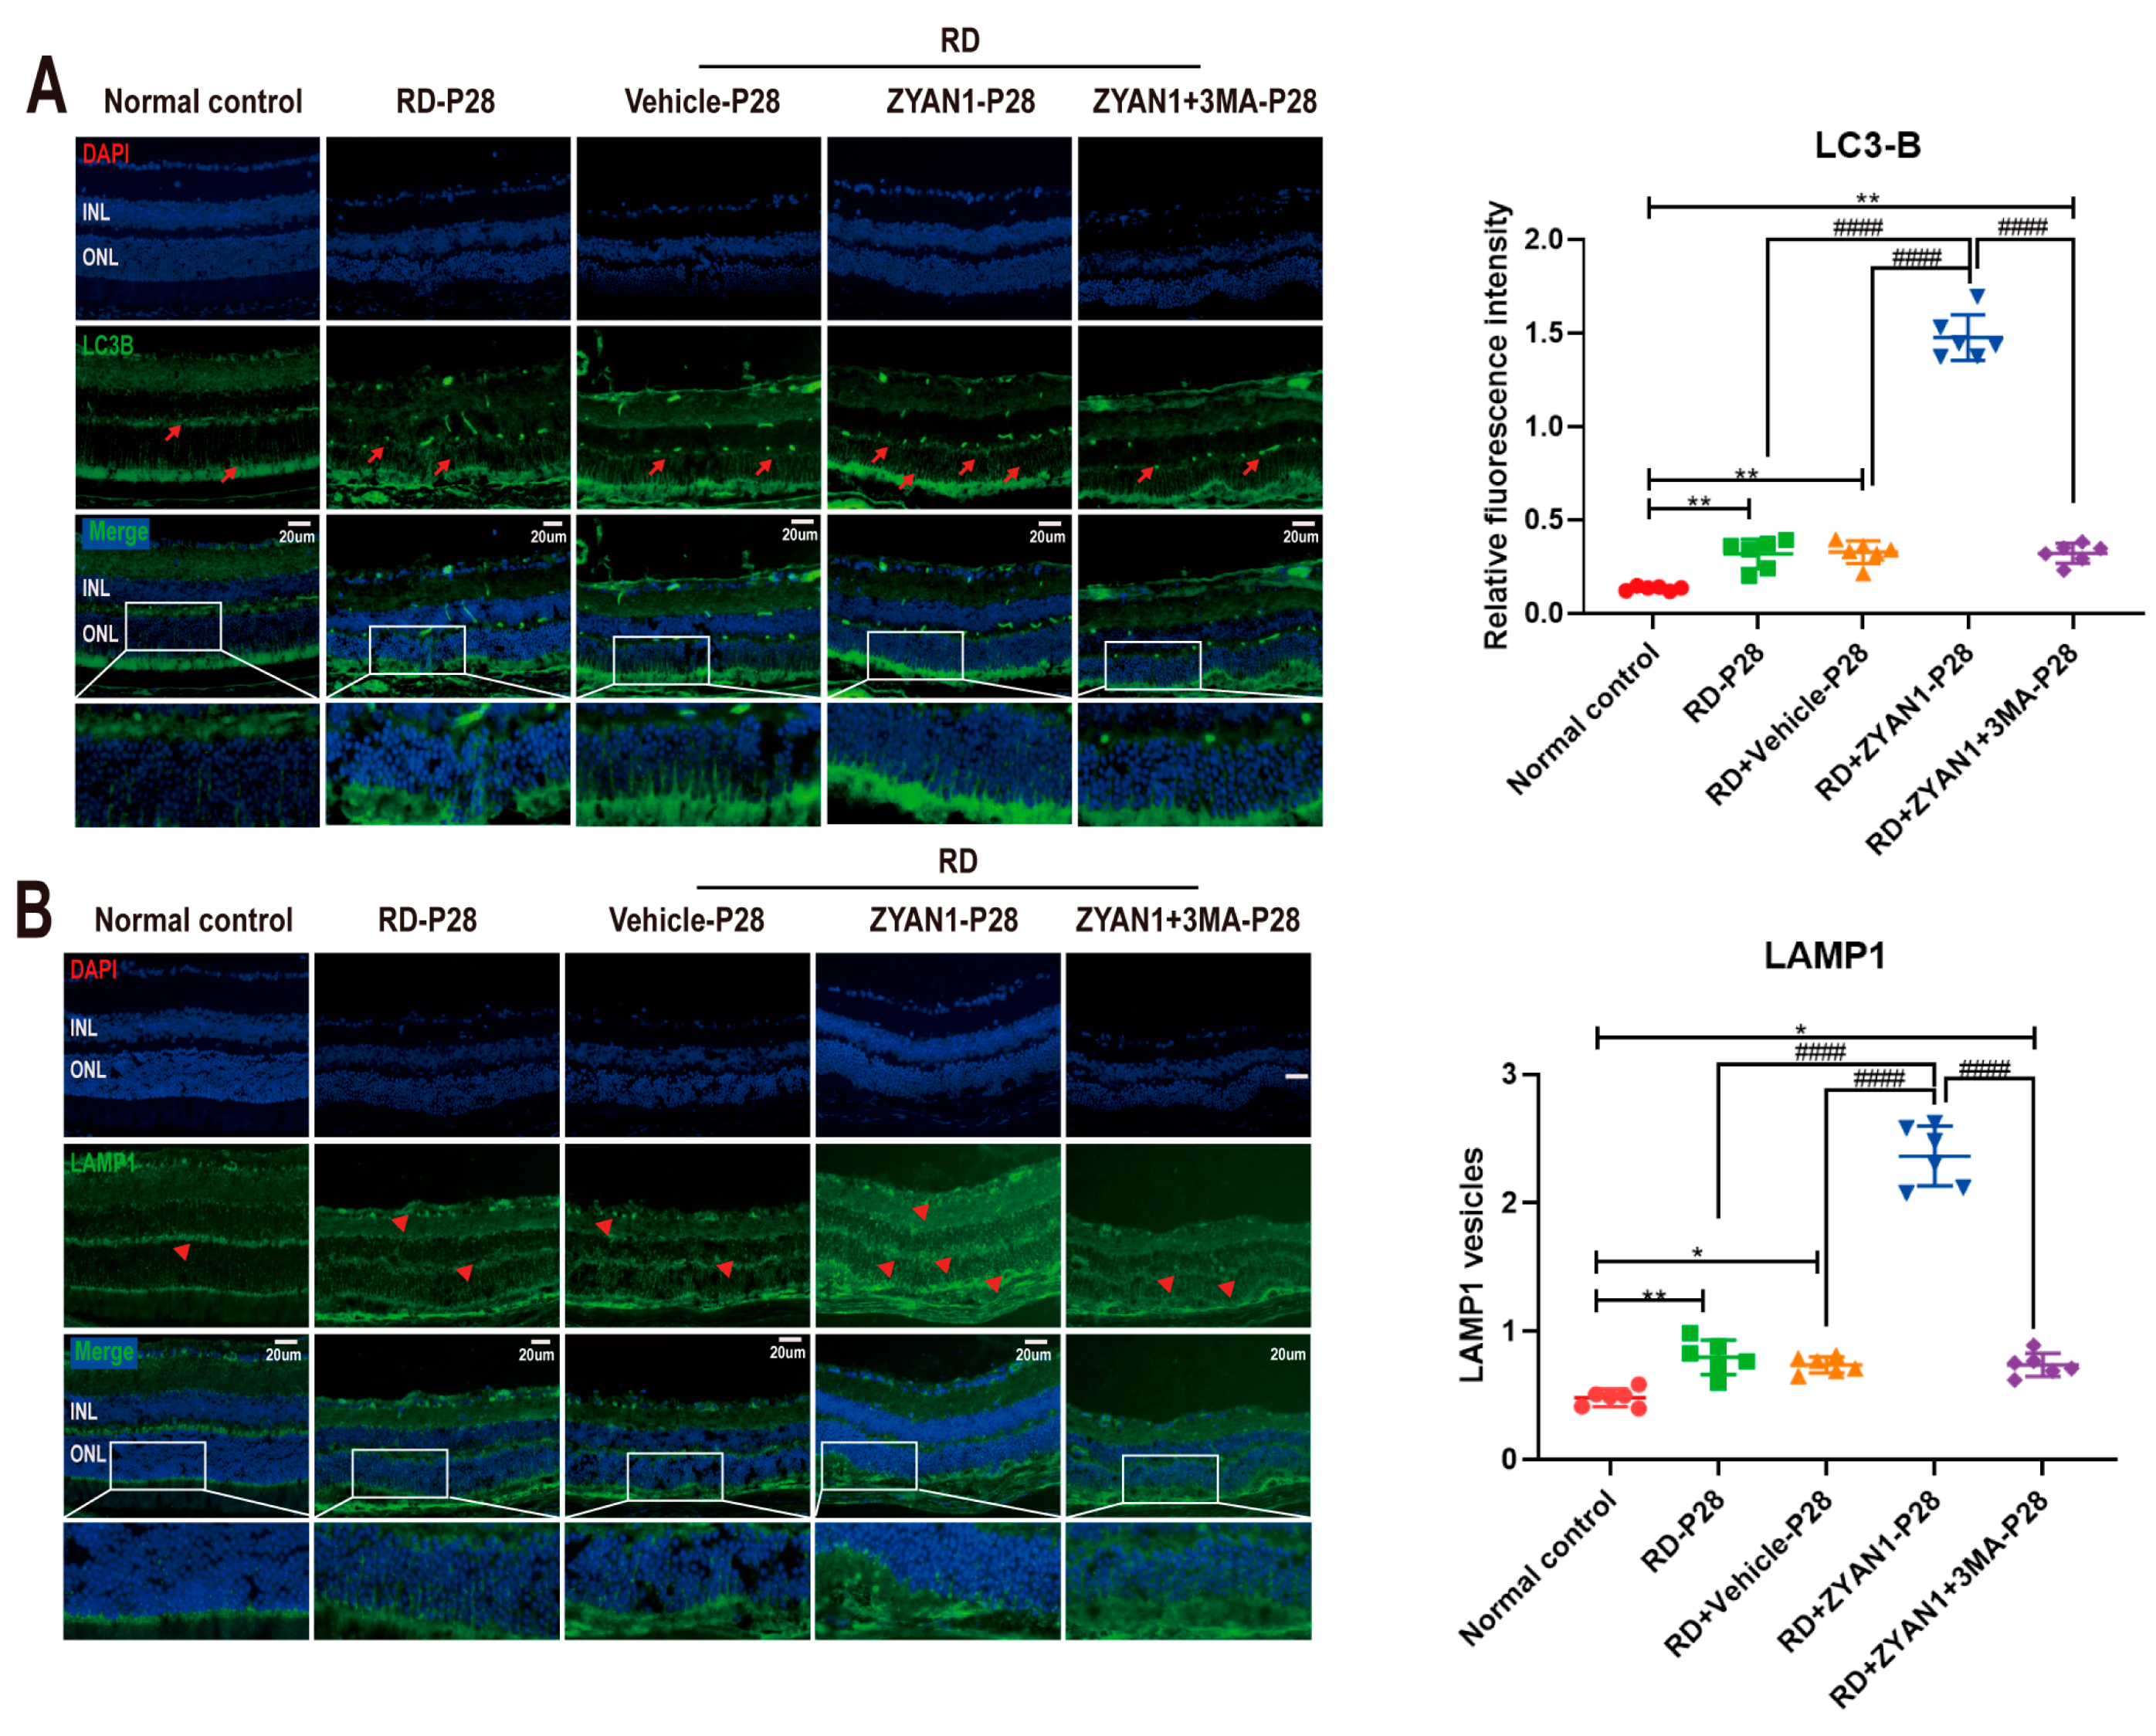
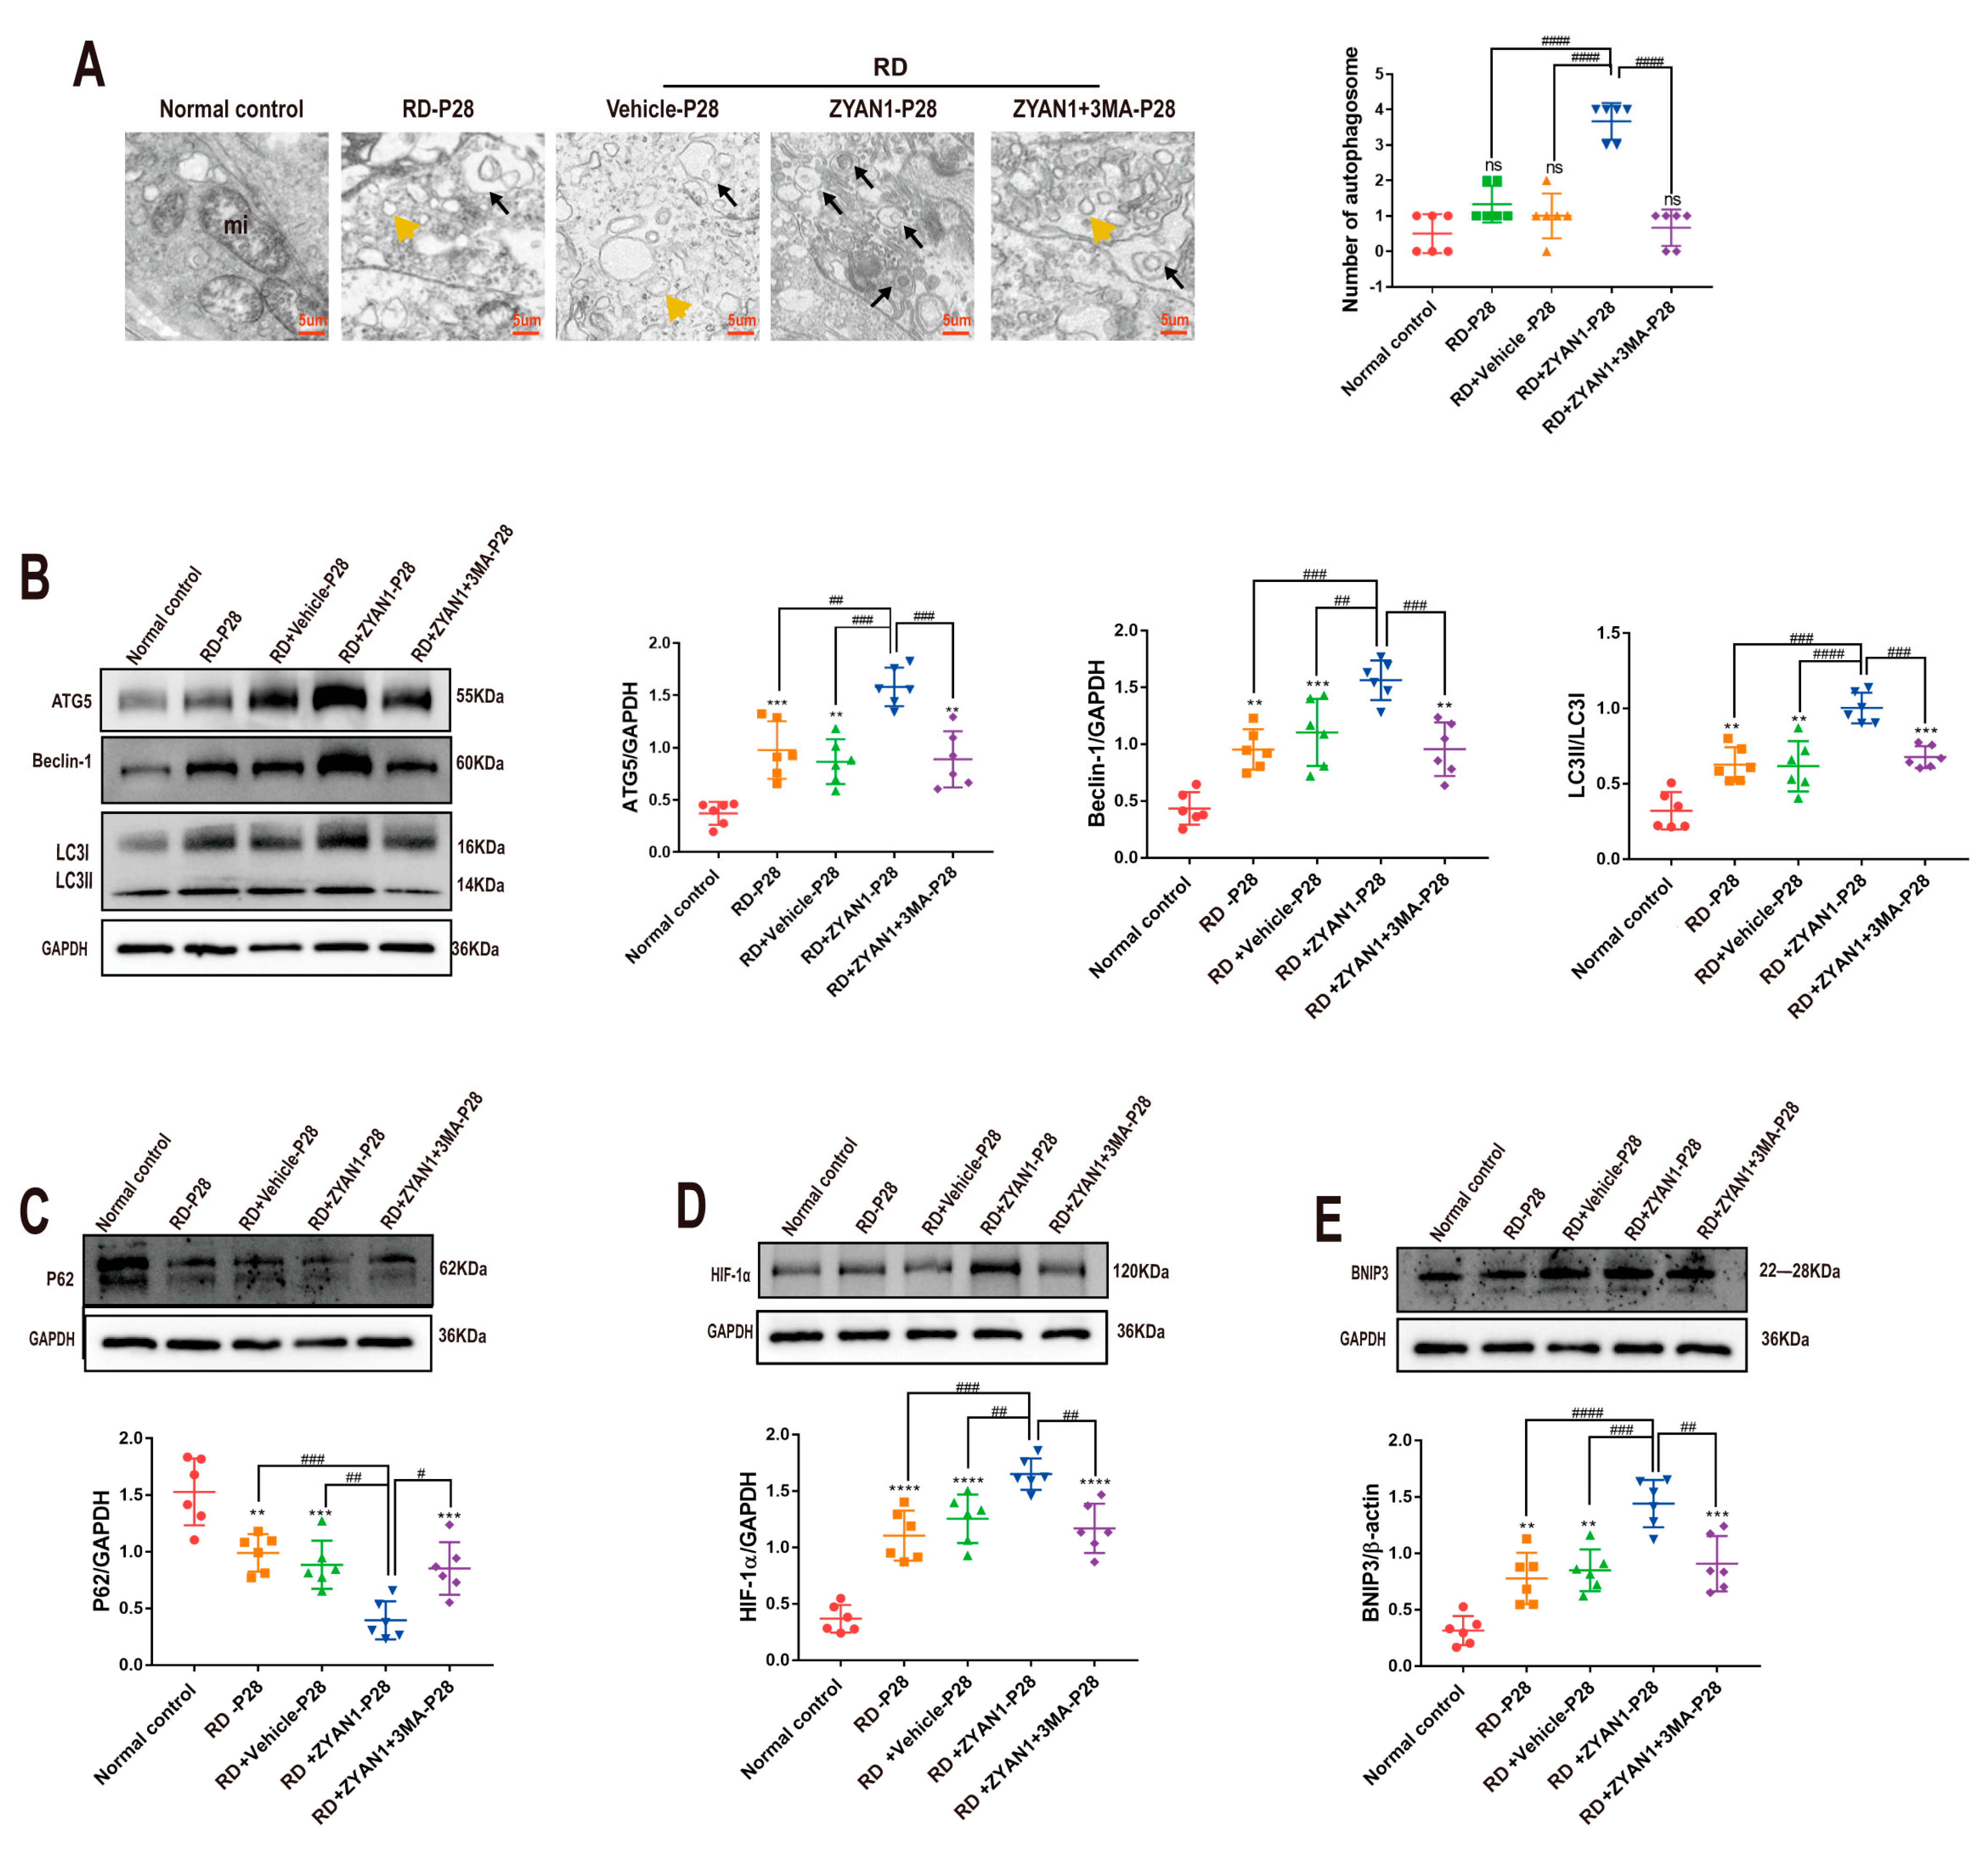
3.5. ZYAN1 Restored Retinal Autophagy in RD Model
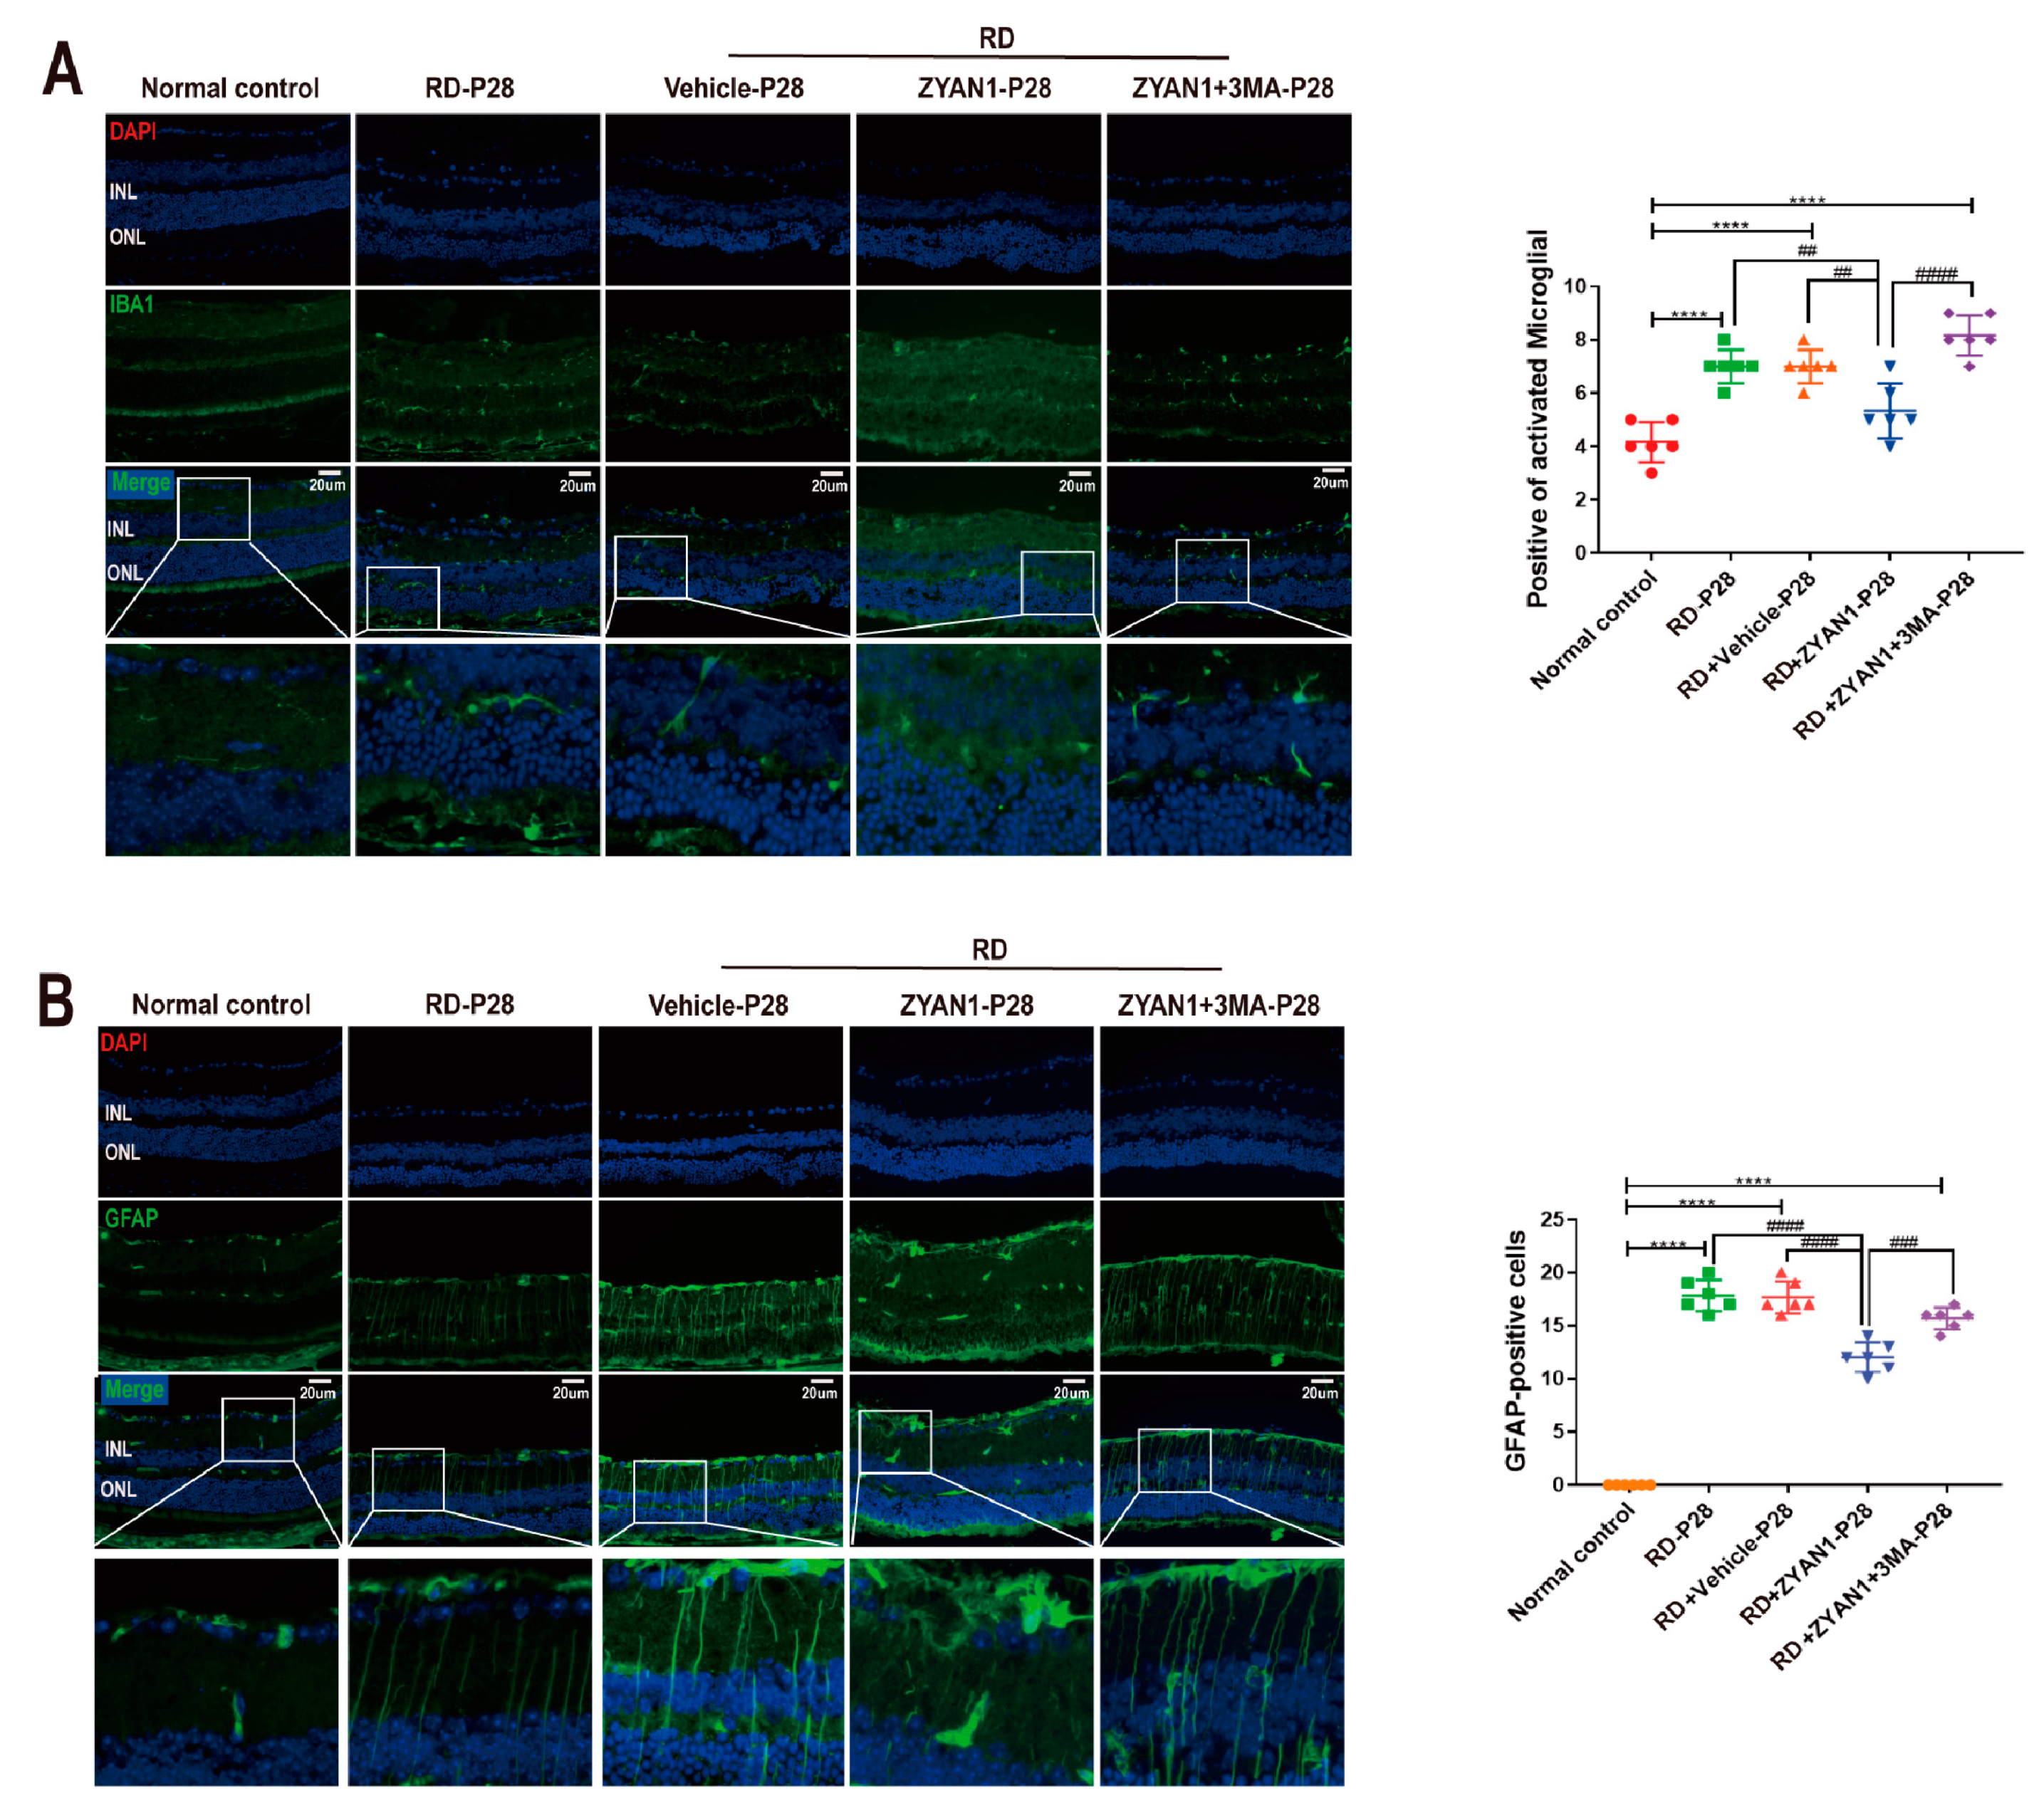
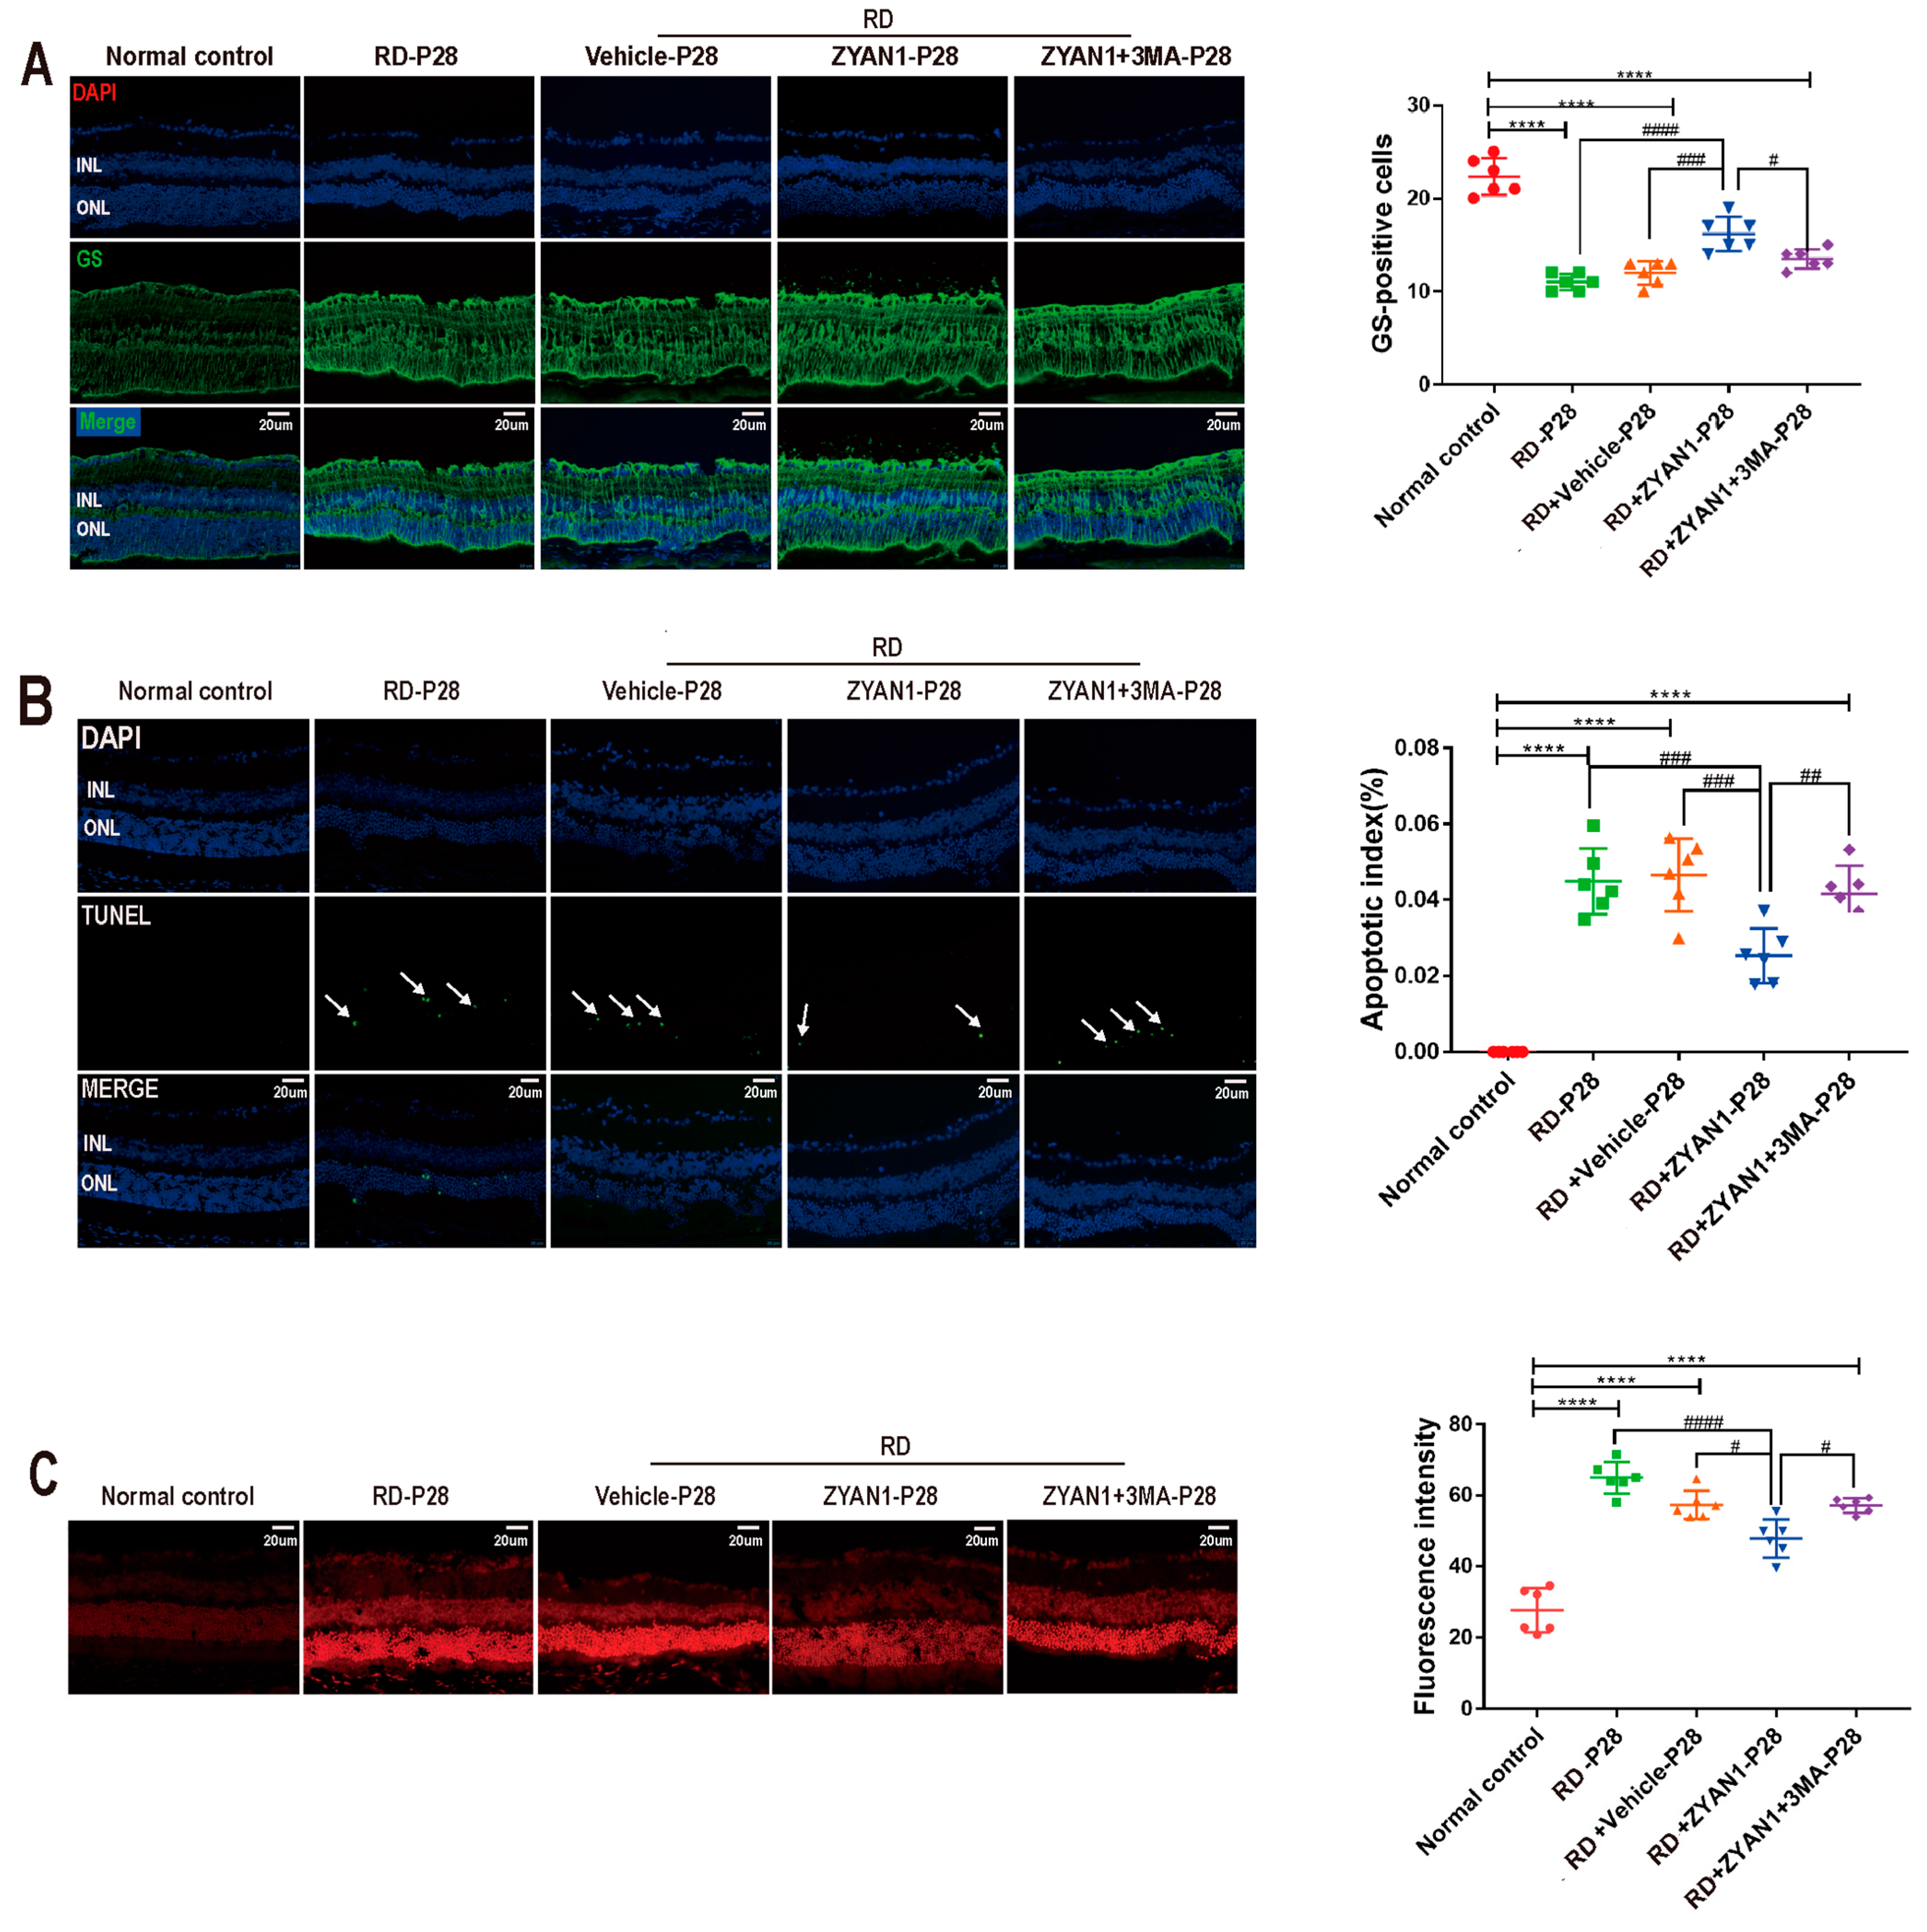
3.6. ZYAN1 Inhibited Neuroglia Activation and Alleviated Oxidative Stress
4. Discussion
5. Conclusions
Supplementary Materials
Author Contributions
Funding
Institutional Review Board Statement
Informed Consent Statement
Data Availability Statement
Conflicts of Interest
References
- Wu, X.; Yan, N.; Zhang, M. Retinal Degeneration: Molecular Mechanisms and Therapeutic Strategies. Curr. Med. Chem. 2022, 29, 6125–6140. [Google Scholar] [CrossRef] [PubMed]
- Masek, M.; Zang, J.; Mateos, J.M.; Garbelli, M.; Ziegler, U.; Neuhauss, S.C.F.; Bachmann-Gagescu, R. Studying the morphology, composition and function of the photoreceptor primary cilium in zebrafish. Methods Cell Biol. 2023, 175, 97–128. [Google Scholar] [PubMed]
- Santiago, C.P.; Keuthan, C.J.; Boye, S.L.; Boye, S.E.; Imam, A.A.; Ash, J.D. A Drug-Tunable Gene Therapy for Broad-Spectrum Protection against Retinal Degeneration. Mol. Ther. 2018, 26, 2407–2417. [Google Scholar] [CrossRef] [PubMed]
- Keenan, T.D.; Chew, E.Y. Association Between C-Reactive Protein and Age-Related Macular Degeneration: Les Liaisons Dangereuses. JAMA Ophthalmol. 2017, 135, 916–917. [Google Scholar] [CrossRef] [PubMed]
- Rullo, J.; Bae, S.; Far, P.M.; Hazimi, A.A.; Gupta, V.; Bal, M.; Hopman, W.M.; Irrcher, I.; Urton, T.; Bona, M.; et al. Measuring intraocular antibodies in eyes treated with anti-vascular endothelial growth factor. Can. J. Ophthalmol. 2020, 55, 263–271. [Google Scholar] [CrossRef] [PubMed]
- Lemasters, J.J. Selective mitochondrial autophagy, or mitophagy, as a targeted defense against oxidative stress, mitochondrial dysfunction, and aging. Rejuvenation Res. 2005, 8, 3–5. [Google Scholar] [CrossRef] [PubMed]
- Ferrington, D.A.; Sinha, D.; Kaarniranta, K. Defects in retinal pigment epithelial cell proteolysis and the pathology associated with age-related macular degeneration. Prog. Retin. Eye Res. 2016, 51, 69–89. [Google Scholar] [CrossRef] [PubMed]
- Lee, J.; Giordano, S.; Zhang, J. Autophagy, mitochondria and oxidative stress: Cross-talk and redox signalling. Biochem. J. 2012, 441, 523–540. [Google Scholar] [CrossRef]
- Rodríguez-Muela, N.; Koga, H.; García-Ledo, L.; de la Villa, P.; de la Rosa, E.J.; Cuervo, A.M.; Boya, P. Balance between autophagic pathways preserves retinal homeostasis. Aging Cell 2013, 12, 478–488. [Google Scholar] [CrossRef]
- Sun, T. Long noncoding RNAs act as regulators of autophagy in cancer. Pharmacol. Res. 2018, 129, 151–155. [Google Scholar] [CrossRef]
- Fleury, C.; Mignotte, B.; Vayssière, J.L. Mitochondrial reactive oxygen species in cell death signaling. Biochimie 2002, 84, 131–141. [Google Scholar] [CrossRef] [PubMed]
- Orrenius, S.; Nicotera, P.; Zhivotovsky, B. Cell death mechanisms and their implications in toxicology. Toxicol. Sci. Off. J. Soc. Toxicol. 2011, 119, 3–19. [Google Scholar] [CrossRef] [PubMed]
- Landshamer, S.; Hoehn, M.; Barth, N.; Duvezin-Caubet, S.; Schwake, G.; Tobaben, S.; Kazhdan, I.; Becattini, B.; Zahler, S.; Vollmar, A.; et al. Bid-induced release of AIF from mitochondria causes immediate neuronal cell death. Cell Death Differ. 2008, 15, 1553–1563. [Google Scholar] [CrossRef] [PubMed]
- Galluzzi, L.; Blomgren, K.; Kroemer, G. Mitochondrial membrane permeabilization in neuronal injury. Nat. Rev. Neurosci. 2009, 10, 481–494. [Google Scholar] [CrossRef] [PubMed]
- Neitemeier, S.; Dolga, A.M.; Honrath, B.; Karuppagounder, S.S.; Alim, I.; Ratan, R.R.; Culmsee, C. Inhibition of HIF-prolyl-4-hydroxylases prevents mitochondrial impairment and cell death in a model of neuronal oxytosis. Cell Death Dis. 2016, 7, e2214. [Google Scholar] [CrossRef] [PubMed]
- Chen, M.; Chen, Z.; Wang, Y.; Tan, Z.; Zhu, C.; Li, Y.; Han, Z.; Chen, L.; Gao, R.; Liu, L.; et al. Mitophagy receptor FUNDC1 regulates mitochondrial dynamics and mitophagy. Autophagy 2016, 12, 689–702. [Google Scholar] [CrossRef] [PubMed]
- Keeling, E.; Lotery, A.J.; Tumbarello, D.A.; Ratnayaka, J.A. Impaired Cargo Clearance in the Retinal Pigment Epithelium (RPE) Underlies Irreversible Blinding Diseases. Cells 2018, 7, 16. [Google Scholar] [CrossRef]
- Blasiak, J.; Pawlowska, E.; Szczepanska, J.; Kaarniranta, K. Interplay between Autophagy and the Ubiquitin-Proteasome System and Its Role in the Pathogenesis of Age-Related Macular Degeneration. Int. J. Mol. Sci. 2019, 20, 210. [Google Scholar] [CrossRef]
- Fletcher, E.L.; Jobling, A.I.; Vessey, K.A.; Luu, C.; Guymer, R.H.; Baird, P.N. Animal models of retinal disease. Prog. Mol. Biol. Transl. Sci. 2011, 100, 211–286. [Google Scholar]
- Markovets, A.M.; Saprunova, V.B.; Zhdankina, A.A.; Fursova, A.; Bakeeva, L.E.; Kolosova, N.G. Alterations of retinal pigment epithelium cause AMD-like retinopathy in senescence-accelerated OXYS rats. Aging 2011, 3, 44–54. [Google Scholar] [CrossRef]
- Zhao, C.; Yasumura, D.; Li, X.; Matthes, M.; Lloyd, M.; Nielsen, G.; Ahern, K.; Snyder, M.; Bok, D.; Dunaief, J.L.; et al. mTOR-mediated dedifferentiation of the retinal pigment epithelium initiates photoreceptor degeneration in mice. J. Clin. Investig. 2011, 121, 369–383. [Google Scholar] [CrossRef] [PubMed]
- Kolosova, N.G.; Muraleva, N.A.; Zhdankina, A.A.; Stefanova, N.A.; Fursova, A.Z.; Blagosklonny, M.V. Prevention of age-related macular degeneration-like retinopathy by rapamycin in rats. Am. J. Pathol. 2012, 181, 472–477. [Google Scholar] [CrossRef] [PubMed]
- Goda, N.; Kanai, M. Hypoxia-inducible factors and their roles in energy metabolism. Int. J. Hematol. 2012, 95, 457–463. [Google Scholar] [CrossRef] [PubMed]
- Ivan, M.; Haberberger, T.; Gervasi, D.C.; Michelson, K.S.; Günzler, V.; Kondo, K.; Yang, H.; Sorokina, I.; Conaway, R.C.; Conaway, J.W.; et al. Biochemical purification and pharmacological inhibition of a mammalian prolyl hydroxylase acting on hypoxia-inducible factor. Proc. Natl. Acad. Sci. USA 2002, 99, 13459–13464. [Google Scholar] [CrossRef] [PubMed]
- Majmundar, A.J.; Wong, W.J.; Simon, M.C. Hypoxia-inducible factors and the response to hypoxic stress. Mol. Cell 2010, 40, 294–309. [Google Scholar] [CrossRef] [PubMed]
- Niatsetskaya, Z.; Basso, M.; Speer, R.E.; McConoughey, S.J.; Coppola, G.; Ma, T.C.; Ratan, R.R. HIF prolyl hydroxylase inhibitors prevent neuronal death induced by mitochondrial toxins: Therapeutic implications for Huntington’s disease and Alzheimer’s disease. Antioxid. Redox Signal. 2010, 12, 435–443. [Google Scholar] [CrossRef] [PubMed]
- Schneider, C.; Krischke, G.; Keller, S.; Walkinshaw, G.; Arend, M.; Rascher, W.; Gassmann, M.; Trollmann, R. Short-term effects of pharmacologic HIF stabilization on vasoactive and cytotrophic factors in developing mouse brain. Brain Res. 2009, 1280, 43–51. [Google Scholar] [CrossRef]
- Reischl, S.; Li, L.; Walkinshaw, G.; Flippin, L.A.; Marti, H.H.; Kunze, R. Inhibition of HIF prolyl-4-hydroxylases by FG-4497 reduces brain tissue injury and edema formation during ischemic stroke. PLoS ONE 2014, 9, e84767. [Google Scholar] [CrossRef]
- Trollmann, R.; Richter, M.; Jung, S.; Walkinshaw, G.; Brackmann, F. Pharmacologic stabilization of hypoxia-inducible transcription factors protects developing mouse brain from hypoxia-induced apoptotic cell death. Neuroscience 2014, 278, 327–342. [Google Scholar] [CrossRef]
- Gong, H.; Rehman, J.; Tang, H.; Wary, K.; Mittal, M.; Chaturvedi, P.; Zhao, Y.Y.; Komarova, Y.A.; Vogel, S.M.; Malik, A.B. HIF2α signaling inhibits adherens junctional disruption in acute lung injury. J. Clin. Investig. 2015, 125, 652–664. [Google Scholar] [CrossRef]
- Baich, A.; Ziegler, M. The effect of sodium iodate and melanin on the formation of glyoxylate. Pigment. Cell Res. 1992, 5, 394–395. [Google Scholar] [CrossRef] [PubMed]
- Kiuchi, K.; Yoshizawa, K.; Shikata, N.; Moriguchi, K.; Tsubura, A. Morphologic characteristics of retinal degeneration induced by sodium iodate in mice. Curr. Eye Res. 2002, 25, 373–379. [Google Scholar] [CrossRef] [PubMed]
- Moriguchi, M.; Nakamura, S.; Inoue, Y.; Nishinaka, A.; Nakamura, M.; Shimazawa, M.; Hara, H. Irreversible Photoreceptors and RPE Cells Damage by Intravenous Sodium Iodate in Mice Is Related to Macrophage Accumulation. Invest. Ophthalmol. Vis. Sci. 2018, 59, 3476–3487. [Google Scholar] [CrossRef] [PubMed]
- Franco, L.M.; Zulliger, R.; Wolf-Schnurrbusch, U.E.; Katagiri, Y.; Kaplan, H.J.; Wolf, S.; Enzmann, V. Decreased visual function after patchy loss of retinal pigment epithelium induced by low-dose sodium iodate. Investig. Ophthalmol. Vis. Sci. 2009, 50, 4004–4010. [Google Scholar] [CrossRef] [PubMed]
- Redfern, W.S.; Storey, S.; Tse, K.; Hussain, Q.; Maung, K.P.; Valentin, J.P.; Ahmed, G.; Bigley, A.; Heathcote, D.; McKay, J.S. Evaluation of a convenient method of assessing rodent visual function in safety pharmacology studies: Effects of sodium iodate on visual acuity and retinal morphology in albino and pigmented rats and mice. J. Pharmacol. Toxicol. Methods 2011, 63, 102–114. [Google Scholar] [CrossRef] [PubMed]
- Schroeder, M.; Kjellström, U.; Lövestam-Adrian, M. Electrophysiological evaluation and 18-month follow-up of two regimens with aflibercept for neovascular age-related macular degeneration. Doc. Ophthalmol. 2022, 144, 99–115. [Google Scholar] [CrossRef] [PubMed]
- Holm, K.; Schroeder, M.; Lövestam Adrian, M. Peripheral retinal function assessed with 30-Hz flicker seems to improve after treatment with Lucentis in patients with diabetic macular oedema. Doc. Ophthalmol. 2015, 131, 43–51. [Google Scholar] [CrossRef]
- Schaaf, M.B.; Keulers, T.G.; Vooijs, M.A.; Rouschop, K.M. LC3/GABARAP family proteins: Autophagy-(un)related functions. FASEB J. Off. Publ. Fed. Am. Soc. Exp. Biol. 2016, 30, 3961–3978. [Google Scholar] [CrossRef]
- Bjørkøy, G.; Lamark, T.; Brech, A.; Outzen, H.; Perander, M.; Overvatn, A.; Stenmark, H.; Johansen, T. p62/SQSTM1 forms protein aggregates degraded by autophagy and has a protective effect on huntingtin-induced cell death. J. Cell Biol. 2005, 171, 603–614. [Google Scholar] [CrossRef]
- Wirawan, E.; Lippens, S.; Vanden Berghe, T.; Romagnoli, A.; Fimia, G.M.; Piacentini, M.; Vandenabeele, P. Beclin1: A role in membrane dynamics and beyond. Autophagy 2012, 8, 6–17. [Google Scholar] [CrossRef]
- Beatty, S.; Koh, H.; Phil, M.; Henson, D.; Boulton, M. The role of oxidative stress in the pathogenesis of age-related macular degeneration. Surv. Ophthalmol. 2000, 45, 115–134. [Google Scholar] [CrossRef] [PubMed]
- Mitter, S.K.; Rao, H.V.; Qi, X.; Cai, J.; Sugrue, A.; Dunn, W.A., Jr.; Grant, M.B.; Boulton, M.E. Autophagy in the retina: A potential role in age-related macular degeneration. Adv. Exp. Med. Biol. 2012, 723, 83–90. [Google Scholar] [PubMed]
- Rullo, J.; Far, P.M.; Quinn, M.; Sharma, N.; Bae, S.; Irrcher, I.; Sharma, S. Local oral and nasal microbiome diversity in age-related macular degeneration. Sci. Rep. 2020, 10, 3862. [Google Scholar] [CrossRef] [PubMed]
- Bellot, G.; Garcia-Medina, R.; Gounon, P.; Chiche, J.; Roux, D.; Pouysségur, J.; Mazure, N.M. Hypoxia-induced autophagy is mediated through hypoxia-inducible factor induction of BNIP3 and BNIP3L via their BH3 domains. Mol. Cell. Biol. 2009, 29, 2570–2581. [Google Scholar] [CrossRef] [PubMed]
- Wang, A.L.; Lukas, T.J.; Yuan, M.; Du, N.; Tso, M.O.; Neufeld, A.H. Autophagy and exosomes in the aged retinal pigment epithelium: Possible relevance to drusen formation and age-related macular degeneration. PLoS ONE 2009, 4, e4160. [Google Scholar] [CrossRef] [PubMed]
- Semenza, G.L. Hypoxia-inducible factor 1: Regulator of mitochondrial metabolism and mediator of ischemic preconditioning. Biochim. Biophys. Acta 2011, 1813, 1263–1268. [Google Scholar] [CrossRef] [PubMed]
- Novak, I.; Kirkin, V.; McEwan, D.G.; Zhang, J.; Wild, P.; Rozenknop, A.; Rogov, V.; Löhr, F.; Popovic, D.; Occhipinti, A.; et al. Nix is a selective autophagy receptor for mitochondrial clearance. EMBO Rep. 2010, 11, 45–51. [Google Scholar] [CrossRef]
- Nazim, U.M.; Moon, J.H.; Lee, J.H.; Lee, Y.J.; Seol, J.W.; Eo, S.K.; Lee, J.H.; Park, S.Y. Activation of autophagy flux by metformin downregulates cellular FLICE-like inhibitory protein and enhances TRAIL- induced apoptosis. Oncotarget 2016, 7, 23468–23481. [Google Scholar] [CrossRef]
- Kaarniranta, K.; Sinha, D.; Blasiak, J.; Kauppinen, A.; Veréb, Z.; Salminen, A.; Boulton, M.E.; Petrovski, G. Autophagy and heterophagy dysregulation leads to retinal pigment epithelium dysfunction and development of age-related macular degeneration. Autophagy 2013, 9, 973–984. [Google Scholar] [CrossRef]
- Wang, J.; Ohno-Matsui, K.; Yoshida, T.; Shimada, N.; Ichinose, S.; Sato, T.; Mochizuki, M.; Morita, I. Amyloid-beta up-regulates complement factor B in retinal pigment epithelial cells through cytokines released from recruited macrophages/microglia: Another mechanism of complement activation in age-related macular degeneration. J. Cell Physiol. 2009, 220, 119–128. [Google Scholar] [CrossRef]
- Yao, J.; Jia, L.; Khan, N.; Lin, C.; Mitter, S.K.; Boulton, M.E.; Dunaief, J.L.; Klionsky, D.J.; Guan, J.L.; Thompson, D.A.; et al. Deletion of autophagy inducer RB1CC1 results in degeneration of the retinal pigment epithelium. Autophagy 2015, 11, 939–953. [Google Scholar] [CrossRef]
- Kuro, M.; Yoshizawa, K.; Uehara, N.; Miki, H.; Takahashi, K.; Tsubura, A. Calpain inhibition restores basal autophagy and suppresses MNU-induced photoreceptor cell death in mice. In Vivo 2011, 25, 617–623. [Google Scholar] [PubMed]
- Zhou, Z.; Vinberg, F.; Schottler, F.; Doggett, T.A.; Kefalov, V.J.; Ferguson, T.A. Autophagy supports color vision. Autophagy 2015, 11, 1821–1832. [Google Scholar] [CrossRef] [PubMed]
- Li, G.Y.; Fan, B.; Jiao, Y.Y. Rapamycin attenuates visible light-induced injury in retinal photoreceptor cells via inhibiting endoplasmic reticulum stress. Brain Res. 2014, 1563, 1–12. [Google Scholar] [CrossRef] [PubMed]
- Lazarou, M.; Sliter, D.A.; Kane, L.A.; Sarraf, S.A.; Wang, C.; Burman, J.L.; Sideris, D.P.; Fogel, A.I.; Youle, R.J. The ubiquitin kinase PINK1 recruits autophagy receptors to induce mitophagy. Nature 2015, 524, 309–314. [Google Scholar] [CrossRef] [PubMed]
- Wu, W.; Tian, W.; Hu, Z.; Chen, G.; Huang, L.; Li, W.; Zhang, X.; Xue, P.; Zhou, C.; Liu, L.; et al. ULK1 translocates to mitochondria and phosphorylates FUNDC1 to regulate mitophagy. EMBO Rep. 2014, 15, 566–575. [Google Scholar] [CrossRef] [PubMed]
- Hui, L.; Wu, H.; Wang, T.W.; Yang, N.; Guo, X.; Jang, X.J. Hydrogen peroxide-induced mitophagy contributes to laryngeal cancer cells survival via the upregulation of FUNDC1. Clin. Transl. Oncol. 2019, 21, 596–606. [Google Scholar] [CrossRef]
- Feng, J.; Tan, W.; Li, T.; Yan, Q.; Zhu, H.; Sun, X. Human retinal pigment epithelial cells are protected against hypoxia by BNIP3. Ann. Transl. Med. 2020, 8, 1502. [Google Scholar] [CrossRef]
- Zhang, Y.; Liu, D.; Hu, H.; Zhang, P.; Xie, R.; Cui, W. HIF-1α/BNIP3 signaling pathway-induced-autophagy plays protective role during myocardial ischemia-reperfusion injury. Biomed. Pharmacother. 2019, 120, 109464. [Google Scholar] [CrossRef]
- Wei, H.; Liu, L.; Chen, Q. Selective removal of mitochondria via mitophagy: Distinct pathways for different mitochondrial stresses. Biochim. Biophys. Acta 2015, 1853, 2784–2790. [Google Scholar] [CrossRef]
- Shelby, S.J.; Angadi, P.S.; Zheng, Q.D.; Yao, J.; Jia, L.; Zacks, D.N. Hypoxia inducible factor 1α contributes to regulation of autophagy in retinal detachment. Exp. Eye Res. 2015, 137, 84–93. [Google Scholar] [CrossRef] [PubMed]
- Liu, H.; Zhu, H.; Li, T.; Zhang, P.; Wang, N.; Sun, X. Prolyl-4-Hydroxylases Inhibitor Stabilizes HIF-1α and Increases Mitophagy to Reduce Cell Death After Experimental Retinal Detachment. Investig. Ophthalmol. Vis. Sci. 2016, 57, 1807–1815. [Google Scholar] [CrossRef] [PubMed]
- Zhu, D.; Xie, M.; Gademann, F.; Cao, J.; Wang, P.; Guo, Y.; Zhang, L.; Su, T.; Zhang, J.; Chen, J. Protective effects of human iPS-derived retinal pigmented epithelial cells on retinal degenerative disease. Stem Cell Res. Ther. 2020, 11, 98. [Google Scholar] [CrossRef] [PubMed]
- Ott, M.; Gogvadze, V.; Orrenius, S.; Zhivotovsky, B. Mitochondria, oxidative stress and cell death. Apoptosis Int. J. Program. Cell Death 2007, 12, 913–922. [Google Scholar] [CrossRef] [PubMed]
- Liu, L.; Feng, D.; Chen, G.; Chen, M.; Zheng, Q.; Song, P.; Ma, Q.; Zhu, C.; Wang, R.; Qi, W.; et al. Mitochondrial outer-membrane protein FUNDC1 mediates hypoxia-induced mitophagy in mammalian cells. Nat. Cell Biol. 2012, 14, 177–185. [Google Scholar] [CrossRef]
- Panieri, E.; Gogvadze, V.; Norberg, E.; Venkatesh, R.; Orrenius, S.; Zhivotovsky, B. Reactive oxygen species generated in different compartments induce cell death, survival, or senescence. Free Radic. Biol. Med. 2013, 57, 176–187. [Google Scholar] [CrossRef] [PubMed]
- Datta, S.; Cano, M.; Ebrahimi, K.; Wang, L.; Handa, J.T. The impact of oxidative stress and inflammation on RPE degeneration in non-neovascular AMD. Prog. Retin. Eye Res. 2017, 60, 201–218. [Google Scholar] [CrossRef] [PubMed]
- Hernández, C.; Bogdanov, P.; Corraliza, L.; García-Ramírez, M.; Solà-Adell, C.; Arranz, J.A.; Arroba, A.I.; Valverde, A.M.; Simó, R. Topical Administration of GLP-1 Receptor Agonists Prevents Retinal Neurodegeneration in Experimental Diabetes. Diabetes 2016, 65, 172–187. [Google Scholar] [CrossRef]
- Lee, S.Y.; Oh, J.S.; Rho, J.H.; Jeong, N.Y.; Kwon, Y.H.; Jeong, W.J.; Ryu, W.Y.; Ahn, H.B.; Park, W.C.; Rho, S.H.; et al. Retinal pigment epithelial cells undergoing mitotic catastrophe are vulnerable to autophagy inhibition. Cell Death Dis. 2014, 5, e1303. [Google Scholar] [CrossRef]
- Jiang, D.; Ryals, R.C.; Huang, S.J.; Weller, K.K.; Titus, H.E.; Robb, B.M.; Saad, F.W.; Salam, R.A.; Hammad, H.; Yang, P.; et al. Monomethyl Fumarate Protects the Retina From Light-Induced Retinopathy. Investig. Ophthalmol. Vis. Sci. 2019, 60, 1275–1285. [Google Scholar] [CrossRef]
- Reichenbach, A.; Bringmann, A. Glia of the human retina. Glia 2020, 68, 768–796. [Google Scholar] [CrossRef]
- Kingwell, K. Neurodegenerative disease: Microglia in early disease stages. Nat. Rev. Neurol. 2012, 8, 475. [Google Scholar] [CrossRef]
- Rullo, J.; Pennimpede, T.; Mehraban Far, P.; Strube, Y.N.; Irrcher, I.; Urton, T.; Bona, M.; Gonder, T.; Campbell, R.J.; Ten Hove, M.; et al. Intraocular calcidiol: Uncovering a role for vitamin D in the eye. J. Steroid Biochem. Mol. Biol. 2020, 197, 105536. [Google Scholar] [CrossRef]
- Mora, R.; Régnier-Vigouroux, A. Autophagy-driven cell fate decision maker: Activated microglia induce specific death of glioma cells by a blockade of basal autophagic flux and secondary apoptosis/necrosis. Autophagy 2009, 5, 419–421. [Google Scholar] [CrossRef]
- Bringmann, A.; Pannicke, T.; Grosche, J.; Francke, M.; Wiedemann, P.; Skatchkov, S.N.; Osborne, N.N.; Reichenbach, A. Müller cells in the healthy and diseased retina. Prog. Retin. Eye Res. 2006, 25, 397–424. [Google Scholar] [CrossRef]
- Kugler, E.; Bravo, I.; Durmishi, X.; Marcotti, S.; Beqiri, S.; Carrington, A.; Stramer, B.; Mattar, P.; MacDonald, R.B. GliaMorph: A modular image analysis toolkit to quantify Müller glial cell morphology. Development 2023, 150, dev201008. [Google Scholar] [CrossRef] [PubMed]


Disclaimer/Publisher’s Note: The statements, opinions and data contained in all publications are solely those of the individual author(s) and contributor(s) and not of MDPI and/or the editor(s). MDPI and/or the editor(s) disclaim responsibility for any injury to people or property resulting from any ideas, methods, instructions or products referred to in the content. |
© 2023 by the authors. Licensee MDPI, Basel, Switzerland. This article is an open access article distributed under the terms and conditions of the Creative Commons Attribution (CC BY) license (https://creativecommons.org/licenses/by/4.0/).
Share and Cite
Hao, X.-N.; Zhao, N.; Huang, J.-M.; Li, S.-Y.; Wei, D.; Pu, N.; Peng, G.-H.; Tao, Y. Intravitreal Injection of ZYAN1 Restored Autophagy and Alleviated Oxidative Stress in Degenerating Retina via the HIF-1α/BNIP3 Pathway. Antioxidants 2023, 12, 1914. https://doi.org/10.3390/antiox12111914
Hao X-N, Zhao N, Huang J-M, Li S-Y, Wei D, Pu N, Peng G-H, Tao Y. Intravitreal Injection of ZYAN1 Restored Autophagy and Alleviated Oxidative Stress in Degenerating Retina via the HIF-1α/BNIP3 Pathway. Antioxidants. 2023; 12(11):1914. https://doi.org/10.3390/antiox12111914
Chicago/Turabian StyleHao, Xiao-Na, Na Zhao, Jie-Min Huang, Si-Yu Li, Dong Wei, Ning Pu, Guang-Hua Peng, and Ye Tao. 2023. "Intravitreal Injection of ZYAN1 Restored Autophagy and Alleviated Oxidative Stress in Degenerating Retina via the HIF-1α/BNIP3 Pathway" Antioxidants 12, no. 11: 1914. https://doi.org/10.3390/antiox12111914